 Zeeshan Fareed
 Sultan Salem
 Tomiwa Sunday Adebayo
 Ugur Korkut Pata
 Farrukh Shahzad
94% of researchers rate our articles as excellent or good
Learn more about the work of our research integrity team to safeguard the quality of each article we publish.
Find out more
ORIGINAL RESEARCH article
Front. Environ. Sci. , 28 October 2021
Sec. Environmental Economics and Management
Volume 9 - 2021 | https://doi.org/10.3389/fenvs.2021.770152
This article is part of the Research Topic Export Product Quality, Renewable Energy, and Sustainable Production View all 48 articles
Sustainable development and reducing environmental pressure are major issues that concern developed as well as developing countries. Although researchers widely use carbon dioxide emissions and ecological footprint within the scope of environmental degradation, a more comprehensive ecological indicator is needed to assess environmental sustainability. In this context, the load capacity factor enables a comprehensive environmental sustainability assessment through the simultaneous analysis of biocapacity and ecological footprint. However, there are few studies analyzing the determinants of load capacity factor and this study aims to fill this gap for Indonesia. Using the recently developed Fourier quantile causality test, this study investigates the impact of income, export diversification, non-renewable and renewable energy consumption on the load capacity factor for Indonesia during 1965Q1–2014Q4. The results show unidirectional causality from non-renewable energy consumption to the load capacity factor at all quantiles, while income, export diversification, and renewable energy are the causes of environmental quality at middle and higher quantiles (within 0.5, 0.7, and 0.9). Most importantly, renewable energy and export diversification increase the load capacity factor and thus support environmental quality. In contrast, an increase in income and consumption of non-renewable energy reduces the load capacity factor. These results highlight the importance of renewable energy and export diversification for the sustainable development of Indonesia.
One of the most serious issues confronting the entire planet is the continuing and increasing degradation of the environment and climate. The United Nations Framework Convention on Climate Change represents a significant stride forward in global cooperation to combat climate change. The COP21 agreement in Paris was a critical step in improving global awareness and diplomacy on climate-related concerns. The COP21 was crucial for the global community to realize that the continuous expansion of economic activities has exacerbated climate change by increasing carbon dioxide (CO2) levels in the atmosphere, leading to an increase in global temperature (Su et al., 2021). The rapid expansion of global production has also expanded the ecological footprint (EF) by exploiting natural resources and increasing energy utilization (Adebayo and Kirikkaleli, 2021), causing global warming. Furthermore, as the world’s populace grows, the need for energy adds to ecological concerns (He et al., 2021).
Several potential causes of environmental degradation have been found in the literature; economic expansion, fossil fuel use, foreign direct investment, and trade openness have been recognized as major contributors to CO2 emissions (Pata, 2018). Nevertheless, it was not until the late 21st century that scholars began to recognize a possible connection between environmental degradation and trade diversification (Rasli et al., 2018; Mania, 2020; Liu et al., 2018). Several nations are also trying to diversify their exports to increase their share of global commerce and protect their exports against demand shocks. Nonetheless, trade diversification is likely to increase the likelihood of CO2 emissions in areas where nations are linked for trade purposes, which means that the potential involvement of trade diversification in pollution cannot be overlooked. Whether trade diversification is the cause of the rapid spread of emissions or aid in mitigating CO2 emissions remains an open question.
Governments around the world have recognized renewable energy consumption as a means to alleviate environmental deterioration, in addition to putting a greater focus on the role of trade diversification in reducing carbon emissions. As fossil fuels have exacerbated global warming, the international community is focusing on a sustainable development agenda that calls for the adoption of greener, renewable energy sources (Pata, 2021a). The use of renewable energy plays an important role in abating greenhouse gasses (Yuping et al., 2021). By lowering reliance on fossil fuels, renewable energy can help reduce emissions and maintain energy security. Renewable energy sources can lower energy costs, minimize climate and environmental impacts, enhance human health and air quality, and create jobs (Kirikkaleli and Adebayo, 2020). In addition, energy import prices can be reduced by utilizing indigenous renewable energy resources such as wind, solar, biomass, geothermal, and hydropower (Sharif et al., 2019). For all these reasons, nations are switching to renewable energy.
As for indicators of environmental degradation, there are a variety of measures. Researchers have studied CO2 emissions and related variables extensively, but CO2 emissions only provide information on air pollution, which can cause water and soil pollution to be overlooked. For this reason, researchers have begun to investigate EF, a wide measure of ecological damage than CO2 emissions (Yilanci and Pata, 2020). A prerequisite for sustainability is that societies do not utilize natural resources rapidly than the biosphere’s reproductive potential and do not generate unnecessary waste Moran et al. (2008). However, the supply side of ecological conditions is ignored in the EF analysis. Siche et al. (2010) suggest using a load capacity factor to evaluate the elasticity of the elements affecting environmental quality in such a situation.
Within the scope of EF accounting, Siche et al. (2009) measured the load capacity factor by dividing the biocapacity by the EF and considering “1” as the limit of environmental sustainability. The load capacity factor indicates whether a society’s ecological system and current lifestyle are sustainable. Suppose the load capacity factor is less than “1”. In that case, the current environmental conditions are unsustainable, whereas a load capacity factor greater than “1” indicates that available resources are sufficient to meet human resource needs.
To the best of our knowledge, only two studies have empirically tested the determinants of the load capacity factor. First, Pata (2021b) used the augmented ARDL approach and found that economic growth reduces the load capacity factor in Japan and the United States, while health spending increases environmental quality in both countries. The author also emphasized that renewable energy improves the load capacity factor in the United States. On the other hand, using the dynamic ARDL method for China, Pata and Isik (2021) concluded that income, energy intensity, and natural resource rent reduce environmental quality while human capital helps to increase the load capacity factor. Regarding the load capacity factor, there seems to be a gap and research opportunity for other countries and groups of countries.
This study aims to examine the impact of renewable energy, non-renewable energy, income and export product diversification on the load capacity factor in Indonesia. While many studies have examined the environmental effects of export diversification in developing countries such as China, Korea, and Turkey (see, e.g., Gozgor and Can, 2016; Liu et al., 2018; Li et al., 2021), Indonesia has been neglected.
Figure 1 shows the ecological situation in Indonesia for the analysis period 1965–2014 with load capacity factor, EF, and biocapacity. It can be seen that biocapacity is decreasing rapidly. Indonesia has had an ecological deficit and a load capacity factor of less than “1” since 2000. In 50 years, the EF has increased by 28%, while the country’s biocapacity has decreased by 49%. An analysis that only considers EF might suggest that environmental pollution in Indonesia has increased by 29%, but this is not entirely true about overall conditions. As can be seen from the figure, the biocapacity to meet anthropogenic demand for natural resources has decreased by over 49% over the same period. Therefore, biocapacity should not be neglected in the environmental sustainability analysis of Indonesia. In this context, a more accurate approach is to consider both biocapacity and EF simultaneously by examining the load capacity factor as an environmental quality indicator.
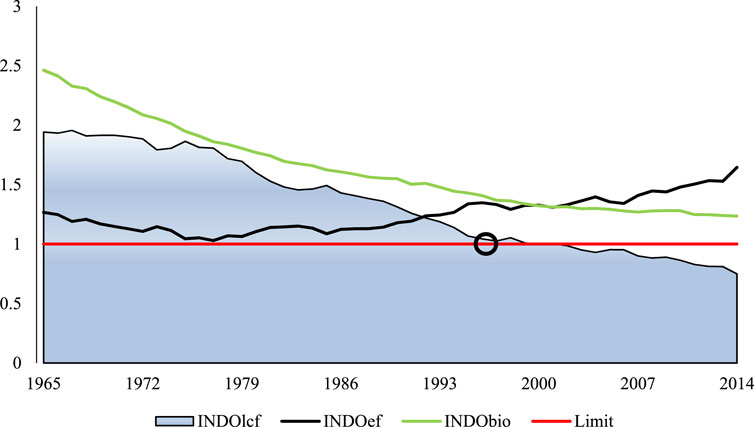
FIGURE 1. Ecological situation in Indonesia. SOURCE: Global Footprint Network (2021).
The present study contributes to the ongoing literature in two distinct ways: First, we utilized the load capacity factor as a metric for environmental sustainability. This metric represents both supply and demand-side features of environmental quality. Second, we applied the Bootstrap Fourier Granger causality in quantiles (BFGC-Q). Unlike the Fourier-Toda-Yamamoto causality test, which does not provide information about the nonlinear causalities and tail-causal relationship, the BFGC-Q initiated by Cheng et al. (2021) provides a flexible and detailed way to evaluate causality relationships. Thus, the present research fills the gap in prior studies by assessing the influence of renewable energy and export diversification on the load capacity factor in Indonesia.
The next section presents a summary of related studies followed by data and methods in Data and Methodology. Study findings and discussion are presented in Empirical Results, and Conclusion concludes the research.
This section of the empirical analysis reviewed past studies on the influence of export diversification, trade openness, fossil fuels, renewable energy, and economic growth on environmental degradation. For example, using Japan as a case study, Ikram et al. (2021) assessed the determinants of EF using ARDL and quantile ARDL approaches. The outcomes from their study disclosed that energy utilization triggers pollution. Odugbesan et al. (2021) studied Thailand utilizing a dataset from 1971 to 2017 and reported that both fossil fuels and GDP reduce environmental quality. Similarly, Ahmad et al. (2020) explored the GDP-emissions association in Chinese provinces using the dynamic common correlated mean group method from 2000 to 2018 and concluded that economic progress trigger emissions levels. In 21 Kyoto annexe countries, Nazir et al. (2018) explored the interrelationship among trade, GDP, and environmental degradation using system GMM and panel causality from 1990 to 2018. The outcomes of this research showed that an upsurge in trade activities and GDP leads to an increase in environmental degradation. The study of Adebayo et al. (2021) for Indonesia also found that an upsurge in GDP triggers environmental degradation. Similarly, Hashmi et al. (2020) contemplated that trade openness positively influences the environment in the short and long run by using the ARDL model for Pakistan over 1971–2014.
Several studies have been conducted regarding the connection between environmental degradation and renewable energy utilization (REC). For example, the study by Fatima et al. (2021) investigated the impact of REC on environmental degradation using random and fixed effect regression models and found that REC helps prevent environmental degradation. Similarly, utilizing a dataset from 1990 to 2014, Akram et al. (2020) assessed the REC-degradation interrelationship in BRICS economies. The study utilized the panel ARDL approach, and the outcomes revealed that an upsurge in REC enhances environmental sustainability. The research by Sharma et al. (2021) on the interrelationship between REC and CO2 emissions from 1990 to 2015 using CS-ARDL disclosed that an upsurge in REC improves the quality of the environment in eight developing Asian countries. In addition, Yuping et al. (2021) performed a case study on Argentina to evaluate the effect of REC on environmental sustainability using a dataset from 1980 to 2018. The ARDL method was used in the study, and the results of the study showed that REC contributes to environmental sustainability.
Similarly, the study of Pata (2021c) in the United States on the REC-emissions association using the Bayer-Hanck cointegration found a negative interrelationship between environmental degradation and renewable energy utilization, which means that an upsurge in REC abates EF and CO2 emissions. Rafique et al. (2021) examined the heterogeneous relationship between REC and ecological footprint in OECD economies between 1994–2016. They concluded that REC has a heterogeneous impact on ecological footprint, and REC plays an important role to mitigate pollution in OECD countries.
Furthermore, recent studies have been conducted on the relationship between environmental degradation and export diversification, but they have reached different conclusions. For instance, Liu et al. (2019) utilized Driscoll and Kraay approach and reported that export diversification accelerates environmental degradation. Using a dataset from 1995 to 2013, Mania (2020) assessed the interconnection between environmental degradation and export diversification using the Generalized Method of Moment (GMM) in less advanced countries and concluded that export diversification has a positive impact on CO2 emissions. The research of Khan et al. (2021) utilizing RCEP countries and datasets from 1987 to 2017 disclosed that export diversification boosts pollution. Similarly, the research by Wang et al. (2020) on the connection between export diversification and emissions in G-7 nations between 1990 and 2017 revealed that export diversification contributes to environmental degradation.
In contrast, Shahzad et al. (2020) used GMM for 63 countries from 1971 to 2014 and found that export diversification reduces CO2 emissions. Wang et al. (2021) used FMOLS, DOLS and Granger causality tests for ten leading complex countries from 1980 to 2014 and concluded that export diversification mitigates environmental degradation. The study by Shahzad et al. (2021), also utilizing a dataset from 1971 to 2014 for 63 countries and applying the GMM, showed that an upsurge in export diversification enhances environmental quality. Similarly, Murshed and Dao (2020) contemplated that export quality significantly reduces carbon emissions in South Asian economies using a dataset from 1972 to 2014. The inconsistency in the literature highlights the need to analyze the impact of export diversification on various environmental indicators.
The annual data covering the period 1965–2014 consists of five variables. The data for the load capacity factor (LCF), export product diversification (EXDIV), renewable energy consumption (REC), fossil fuel consumption (FEC), and gross domestic product (GDP) come from four different sources. The data of LCF (index) are collected from Global Footprint Network (2021), GDP (per capita, constant 2010) from the World Bank (2021), EXDIV (index) calculated by Henn et al. (2020) from International Monetary Fund (2021), and REC (per capita, kWh) and EC (per capita, kWh) from Our World in Data (2021). All these annual frequency data are transformed into logarithmic values and converted to quarterly frequencies using the quadratic match-sum method to avoid problems with small observations. This method considers seasonality by reducing data variations while transitioning from low frequency to high frequency, and therefore it is preferred over other interpolation methods (Sbia, 2014; Shahzad, 2017). Table 1 provides some descriptive statistics for quarterly data.
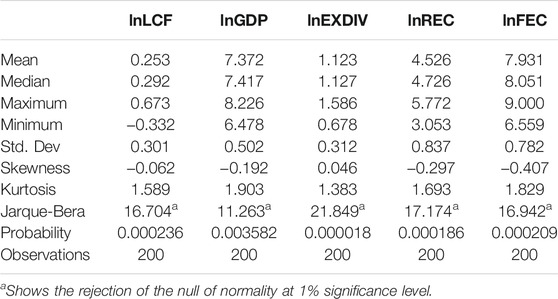
TABLE 1. Descriptive statistics.
The Jarque-Bera test statistics and probability values show that the five series are not normally distributed. For non-normally distributed series, it is more appropriate to use median-based quantile causality tests instead of mean-based standard Granger causality tests (Balcilar et al., 2017; Balcilar et al., 2021). Based on this, we analyze the determinants of the load capacity factor using the Fourier causality test.
Granger (1969) proposed a causality test to determine the predictive power of one variable for another. Over time, many researchers have modified Granger’s causality test. Toda and Yamamoto (1995) extended the causality test to eliminate long-term information losses by using level data and adding the maximum order of integration of the variables to the vector autoregression model. However, this approach does not account for structural breaks. To address this omission, Enders and Jones (2016) modified the Granger causality test by using Gallant’s Fourier approximation. Following Enders and Jones (2016), Nazlioglu et al. (2016) applied the same procedure to the Toda-Yamamoto causality test. In the first step of the Fourier Toda-Yamamoto causality test, Nazlioglu et al. (2016) relaxed the assumption that the intercept does not change over time, as in Eq. 1.
where
In Eq. 2,
In Eq. 3, the significance of the trigonometric terms can be tested using the conventional F-statistic following Becker et al. (2006). If the parameters are not equal to zero
The Fourier-Toda-Yamamoto causality test does not provide information about the nonlinear causalities and the tail-causal relationship. Considering this issue, Cheng et al. (2021) modified the Fourier Toda-Yamamoto causality test by using a quantile autoregression approach. With the approach, referred to as “Bootstrap Fourier Granger causality in quantiles” (BFGC-Q), Cheng et al. (2021) aimed to provide a flexible and detailed way to evaluate causality relationships. To construct the BFGC-Q test, the quantiles are added to Eq. 3 and the following equation is estimated:
In Eq. 4, Z denotes a matrix with all covariates, k* and p* are the optimal lags and frequencies, respectively. Estimating Eq. 4 with the quantile regression approach, Granger non-causality can be tested at different quantiles “τ∈(0,1)” as follows:
In Eq. 6,
In the first step of the analysis, we use traditional unit root tests to determine the maximum order of integration of the variables and report the results in Table 2.
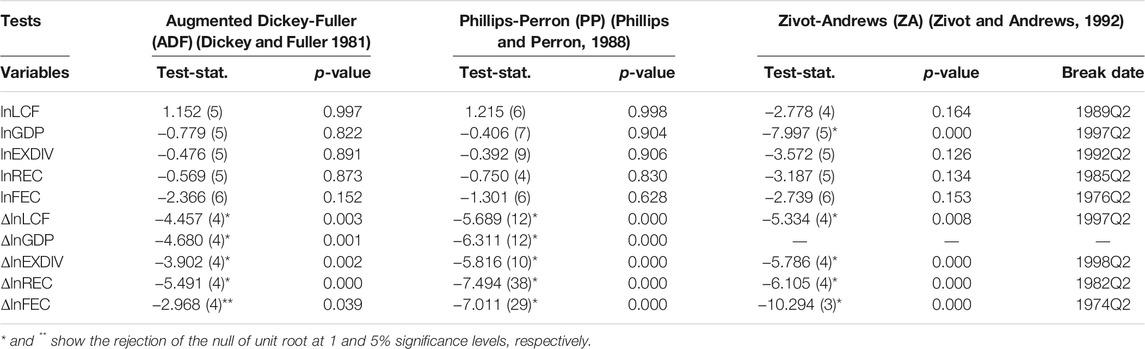
TABLE 2. Results of unit root tests.
The results of the ADF and PP -unit root tests show that all series are stationary at the first difference [I(1)]. ZA unit root test indicates that GDP is stationary at level [I(0)], while LCF, EXDIV, REC and FEC contain a unit root. These findings suggest that the maximum order of integrating the variables (dmax) is “1”. Moreover, structural breaks intensified in 1997Q2–1998Q2 can be attributed to the 1997 Asian crisis, which affected export product diversification, economic growth and environmental quality. On the one hand, the 1997 crisis significantly impacted Indonesia’s income and debt levels and ended 30 years of uninterrupted economic growth (Enoch et al., 2001). On the other hand, the 1997–1998 crisis caused Indonesia’s banking system to be reluctant to lend and Indonesia’s economic recovery process was slow due to the credit crunch and high-interest rates (Trinugroho et al., 2014). It is clear that such a crisis leads to economic and environmental changes.
After determining the maximum integration degree of the series to be “1” based on the results of the unit root tests, in the second step of the analysis, we test the significance of the Fourier terms using the F-test and show the results in Table 3.
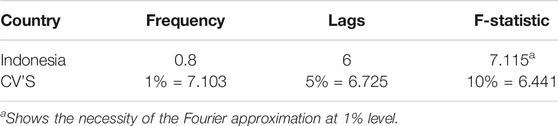
TABLE 3. Results of F-test.
We set the maximum lag length to six and the frequency to four, following Cheng (2021). In Table 3, the F-statistic is greater than the 1% bootstrapped critical value (7.115 > 7.103). This finding implies that Fourier functions should be used in causality analysis.
In the final step of the analysis, we employ the BFGC-Q test to examine the causal effects of export product diversification, income, renewable energy and non-renewable energy on the load capacity factor. Table 4 presents the results of the BFGC-Q causality test.
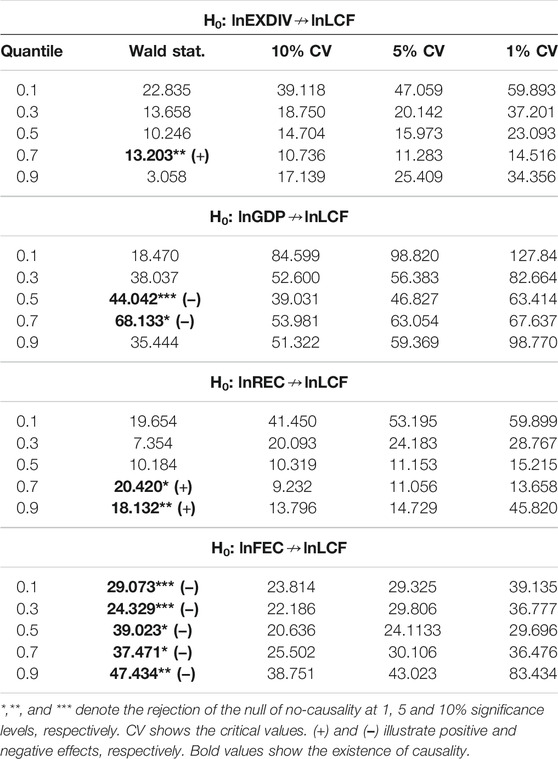
TABLE 4. Results of Fourier quantile causality test.
The results show that there is unidirectional causality from fossil fuel consumption to load capacity factor for all quantiles. In contrast, export diversification is the cause of environmental quality only at the 0.7 quantile. Similarly, a unidirectional causality runs from income and renewable energy to the load capacity factor at higher quantiles (0.5, 0.7, and 0.9). These findings show that the relationship between fossil fuel consumption and environmental quality is not sensitive to quantiles; on the contrary, the causal effects of export diversification, income, and renewable energy consumption on the load capacity factor are highly sensitive.
Moreover, by examining the coefficients of the independent variables, we find that income and fossil fuels reduce environmental quality, while renewable energy and export diversification increases the load capacity factor (see Figure 2.).
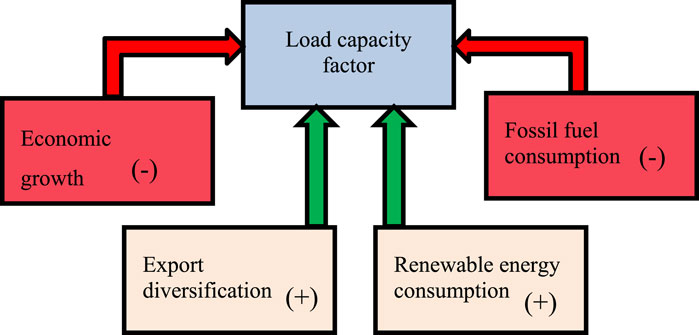
FIGURE 2. Quantile causality direction.
Despite Indonesia’s large renewable energy potential, the country’s energy sector is heavily dependent on fossil fuels (Sugiawan and Managi, 2016). Indonesia’s high dependence on oil and imports for more than 50% of its energy is a potential risk to its energy supply (Rahman et al., 2021). Renewable energy is a good alternative to avoid these risks and improve environmental quality. Indonesia utilizes 60% of its bioenergy capacity and 78% of its geothermal energy capacity. However, the utilization rates in this country are 22% for solar energy and 1% for wind energy (IRENA, 2020). Indonesia needs to increase its investment in solar and wind energy and the utilization areas of this energy to support the load capacity factor.
In Indonesia, export diversification can enable the use of environmental technologies through the technique effect. In addition, as noted by Shahzad et al. (2021), export diversification can help reduce energy demand in Indonesia. Therefore, Indonesia should continue to specialize and diversify in exports to improve environmental quality. Expanding the export basket of goods and services can increase the load capacity factor by developing environmentally friendly energy technologies in this country. The Indonesian government can both reduce the country’s dependence on exports of certain commodities and support environmental quality by providing favorable loans and tax breaks to exporters to diversify their export basket.
Indonesia is the fourth most populous country in the world and suffers from severe environmental issues due to its high population density and rapid industrial growth. Many studies have examined environmental degradation through mostly used indicators; CO2 emissions, EF, and greenhouse gas emissions in both developed and developing countries. However, a more comprehensive ecological indicator is much needed to address environmental issues and achieve the Sustainable Development Goals. Therefore, this study uses a load capacity factor as a different proxy of environmental degradation, which provides a comprehensive environmental assessment tool by concurrently analyzing biocapacity and EF. Furthermore, the load capacity factor offers both supply and demand-side aspects of environmental quality.
In this scenario, the current study explores the impact of renewable energy, non-renewable energy, income and export product diversification on the load capacity factor in the Indonesian context during 1965Q1–2014Q4. We employ a novel econometric method called Bootstrap Fourier Granger causality in quantiles (BFGC-Q) to achieve the objectives of the study. In contrast to the other traditional Granger and Toda-Yamamoto causality tests, this method yields asymmetric causalities and tail-causal associations between the variables within the Fourier approximation. We employ equally spaced grid of 5 quantiles (0.10, 0.30, 0.50, 0.70, and 0.90). The results reveal unidirectional causality running from export diversification, income and renewable energy consumption to load capacity factors at middle and upper quantiles, while non-renewable energy consumption causes load capacity factors at all quantile distributions.
In a nutshell, renewable energy and export diversification are important factors that increase load capacity and thus improve environmental quality in Indonesia. On the other hand, income and non-renewable energy consumption lower the load capacity factor. These empirical findings contribute significantly to the achievement of sustainable environmental development in Indonesia. Besides, this study provides some useful policy implications for policymakers. First, the Indonesian government needs to invest more in renewable energy sources (solar and wind energy) to offset the load capacity deficit. Second, the government should expand its export basket of goods and services to increase biocapacity and make the environment cleaner and undamaged by adopting clean environmental technologies. As Indonesia is the country with the second-highest plastic waste pollution globally, the government should pay more attention to the introduction of recycling processes and technologies, which, together with the improvement of biocapacity and the expansion of the export basket, will contribute to effective environmental protection.
ZF: Investigation, Formal analysis, Writing - Review and Editing. SS: Writing - Original Draft, Writing - Review and Editing. TA: Investigation, Writing Original Draft, Writing - Review and Editing UP: Data Curation, Conceptualization, Resources, Methodology, Software, Formal analysis. Writing Original Draft. FS: Writing Original Draft, Writing - Review and Editing.
All authors listed have made a substantial, direct, and intellectual contribution to the work and approved it for publication.
The authors declare that the research was conducted in the absence of any commercial or financial relationships that could be construed as a potential conflict of interest.
All claims expressed in this article are solely those of the authors and do not necessarily represent those of their affiliated organizations, or those of the publisher, the editors and the reviewers. Any product that may be evaluated in this article, or claim that may be made by its manufacturer, is not guaranteed or endorsed by the publisher.
Adebayo, T. S., Akinsola, G. D., Kirikkaleli, D., Bekun, F. V., Umarbeyli, S., and Osemeahon, O. S. (2021). Economic Performance of Indonesia amidst CO2 Emissions and Agriculture: a Time Series Analysis. Environ. Sci. Pollut. Res. 28, 47942–47956. doi:10.1007/s11356-021-13992-6
Adebayo, T. S., and Kirikkaleli, D. (2021). Impact of Renewable Energy Consumption, Globalization, and Technological Innovation on Environmental Degradation in Japan: Application of Wavelet Tools. Environ. Dev. Sustainability, 1–26. doi:10.1007/s10668-021-01322-2
Ahmad, M., Li, H., Anser, M. K., Rehman, A., Fareed, Z., Yan, Q., et al. (2020). Are the Intensity of Energy Use, Land Agglomeration, CO2 Emissions, and Economic Progress Dynamically Interlinked across Development Levels. Energ. Environ. 32, 0958305X20949471. doi:10.1177/0958305X20949471
Akram, R., Majeed, M. T., Fareed, Z., Khalid, F., and Ye, C. (2020). Asymmetric Effects of Energy Efficiency and Renewable Energy on Carbon Emissions of BRICS Economies: Evidence from Nonlinear Panel Autoregressive Distributed Lag Model. Environ. Sci. Pollut. Res. 27 (15), 18254–18268. doi:10.1007/s11356-020-08353-8
Balcilar, M., Bathia, D., Demirer, R., and Gupta, R. (2021). Credit Ratings and Predictability of Stock Return Dynamics of the BRICS and the PIIGS: Evidence from a Nonparametric Causality-In-Quantiles Approach. Q. Rev. Econ. Finance 79, 290–302. doi:10.1016/j.qref.2020.07.005
Balcilar, M., Bekiros, S., and Gupta, R. (2017). The Role of News-Based Uncertainty Indices in Predicting Oil Markets: a Hybrid Nonparametric Quantile Causality Method. Empir Econ. 53 (3), 879–889. doi:10.1007/s00181-016-1150-0
Becker, R., Enders, W., and Lee, J. (2006). A Stationarity Test in the Presence of an Unknown Number of Smooth Breaks. J. Time Ser. Anal. 27 (3), 381–409. doi:10.1111/j.1467-9892.2006.00478.x
Cheng, K., Hsueh, H.-P., Ranjbar, O., Wang, M.-C., and Chang, T. (2021). Urbanization, Coal Consumption and CO2 Emissions Nexus in China Using Bootstrap Fourier Granger Causality Test in Quantiles. Lett. Spat. Resour. Sci. 14 (1), 31–49. doi:10.1007/s12076-020-00263-0
Dickey, D. A., and Fuller, W. A. (1981). Likelihood Ratio Statistics for Autoregressive Time Series with a Unit Root. Econometrica 49 (4), 1057–1072. doi:10.2307/1912517
Enders, W., and Jones, P. (2016). Grain Prices, Oil Prices, and Multiple Smooth Breaks in a VAR. Stud. Nonlinear Dyn. Econom. 20 (4), 399–419. doi:10.1515/snde-2014-0101
Enoch, C., Baldwin, B. E., Frecaut, O., and &Kovanen, A. (2001). “Indonesia: Anatomy of a Banking Crisis Two Years of Living Dangerously 1997–99,”. IMF Working Papers (Washington, DC: International Monetary Fund), 139. doi:10.5089/9781451847253.001
Fatima, T., Shahzad, U., and Cui, L. (2021). Renewable and Nonrenewable Energy Consumption, Trade and CO2 Emissions in High Emitter Countries: Does the Income Level Matter. J. Environ. Plann. Manag. 64 (7), 1227–1251. doi:10.1080/09640568.2020.1816532
Global Footprint Network (2021). Global Footprint Network. Available at: https://data.footprintnetwork.org/#/(accessed July 10, 2021).
Gozgor, G., and Can, M. (2016). Export Product Diversification and the Environmental Kuznets Curve: Evidence from Turkey. Environ. Sci. Pollut. Res. 23 (21), 21594–21603. doi:10.1007/s11356-016-7403-9
Granger, C. W. J. (1969). Investigating Causal Relations by Econometric Models and Cross-Spectral Methods. Econometrica 37 (3), 424–438. doi:10.2307/1912791
Hashmi, S. H., Hongzhong, F., Fareed, Z., and Bannya, R. (2020). Testing Non-linear Nexus between Service Sector and CO2 Emissions in Pakistan. Energies 13 (3), 526. doi:10.3390/en13030526
He, X., Adebayo, T. S., Kirikkaleli, D., and Umar, M. (2021). Consumption-based Carbon Emissions in Mexico: an Analysis Using the Dual Adjustment Approach. Sustainable Prod. Consumption 27, 947–957. doi:10.1016/j.spc.2021.02.020
Henn, C., Papageorgiou, C., Romero, J. M., and Spatafora, N. (2020). Export Quality in Advanced and Developing Economies: Evidence from a New Data Set. IMF Econ. Rev. 68 (2), 421–451. doi:10.1057/s41308-020-00110-8
Ikram, M., Xia, W., Fareed, Z., Shahzad, U., and Rafique, M. Z. (2021). Exploring the Nexus between Economic Complexity, Economic Growth and Ecological Footprint: Contextual Evidences from Japan. Sustainable Energ. Tech. Assessments 47, 101460. doi:10.1016/j.seta.2021.101460
International Monetary Fund (2021). Export Diversification and Quality. Available at: https://data.imf.org/?sk=A093DF7D-E0B8-4913-80E0-A07CF90B44DB (accessed August 19, 2021).
IRENA (2020). Energy Profile: Indonesia. Available at: https://www.irena.org/IRENADocuments/Statistical_Profiles/Asia/Indonesia_Asia_RE_SP.pdf (accessed August 24, 2021).
Khan, Z., Murshed, M., Dong, K., and Yang, S. (2021). The Roles of export Diversification and Composite Country Risks in Carbon Emissions Abatement: Evidence from the Signatories of the Regional Comprehensive Economic Partnership Agreement. Appl. Econ. 53, 4769–4787. doi:10.1080/00036846.2021.1907289
Kirikkaleli, D., and Adebayo, T. S. (2020). Do renewable Energy Consumption and Financial Development Matter for Environmental Sustainability? New Global Evidence. Sust. Dev. 29 (4), 583–594. doi:10.1002/sd.2159
Li, M., Ahmad, M., Fareed, Z., Hassan, T., and Kirikkaleli, D. (2021). Role of Trade Openness, export Diversification, and Renewable Electricity Output in Realizing Carbon Neutrality Dream of China. J. Environ. Manage. 297, 113419. doi:10.1016/j.jenvman.2021.113419
Liu, H., Kim, H., and Choe, J. (2019). Export Diversification, CO2 Emissions and EKC: Panel Data Analysis of 125 Countries. Asia-pac J. Reg. Sci. 3 (2), 361–393. doi:10.1007/s41685-018-0099-8
Liu, H., Kim, H., Liang, S., and Kwon, O.-S. (2018). Export Diversification and Ecological Footprint: a Comparative Study on EKC Theory Among Korea, Japan, and China. Sustainability 10 (10), 3657. doi:10.3390/su10103657
Mania, E. (2020). Export Diversification and CO 2 Emissions: An Augmented Environmental Kuznets Curve. J. Int. Dev. 32 (2), 168–185. doi:10.1002/jid.3441
Moran, D. D., Wackernagel, M., Kitzes, J. A., Goldfinger, S. H., and Boutaud, A. (2008). Measuring Sustainable Development - Nation by Nation. Ecol. Econ. 64 (3), 470–474. doi:10.1016/j.ecolecon.2007.08.017
Murshed, M., and Dao, N. T. T. (2020). Revisiting the CO 2 Emission-Induced EKC Hypothesis in South Asia: the Role of Export Quality Improvement. GeoJournal, 1–29. doi:10.1007/s10708-020-10270-9
Nazlioglu, S., Gormus, A., and Soytas, U. (2019). Oil Prices and Monetary Policy in Emerging Markets: Structural Shifts in Causal Linkages. Emerging Markets Finance and Trade 55 (1), 105–117. doi:10.1080/1540496x.2018.1434072
Nazlioglu, S., Gormus, N. A., and Soytas, U. (2016). Oil Prices and Real Estate Investment Trusts (REITs): Gradual-Shift Causality and Volatility Transmission Analysis. Energ. Econ. 60, 168–175. doi:10.1016/j.eneco.2016.09.009
Odugbesan, J. A., Adebayo, T. S., Akinsola, G. D., and Olanrewaju, V. O. (2021). Determinants of Environmental Degradation in Thailand: Empirical Evidence from ARDL and Wavelet Coherence Approaches. Pollution 7 (1), 181–196.
Our World in Data (2021). Energy. Available at: https://ourworldindata.org/energy (accessed August 19, 2021).
Pata, U. K. (2021b). Do renewable Energy and Health Expenditures Improve Load Capacity Factor in the USA and Japan? A New Approach to Environmental Issues. Eur. J. Health Econ., 1–13.
Pata, U. K., and Isik, C. (2021). Determinants of the Load Capacity Factor in China: A Novel Dynamic ARDL Approach for Ecological Footprint Accounting. Resour. Pol. 74, 102313. doi:10.1016/j.resourpol.2021.102313
Pata, U. K. (2021a). Linking Renewable Energy, Globalization, Agriculture, CO2 Emissions and Ecological Footprint in BRIC Countries: A Sustainability Perspective. Renew. Energ. 173, 197–208. doi:10.1016/j.renene.2021.03.125
Pata, U. K. (2021c). Renewable and Non-renewable Energy Consumption, Economic Complexity, CO2 Emissions, and Ecological Footprint in the USA: Testing the EKC Hypothesis with a Structural Break. Environ. Sci. Pollut. Res. 28 (1), 846–861. doi:10.1007/s11356-020-10446-3
Pata, U. K. (2018). The Influence of Coal and Noncarbohydrate Energy Consumption on CO2 Emissions: Revisiting the Environmental Kuznets Curve Hypothesis for Turkey. Energy 160, 1115–1123. doi:10.1016/j.energy.2018.07.095
Phillips, P. C. B., and Perron, P. (1988). Testing for a Unit Root in Time Series Regression. Biometrika 75 (2), 335–346. doi:10.1093/biomet/75.2.335
Rafique, M. Z., Fareed, Z., Ferraz, D., Ikram, M., and Huang, S. (2021). Exploring the Heterogenous Impacts of Environmental Taxes on Environmental Footprints: An Empirical Assessment from Developed Economies. Energy 238, 121753. doi:10.1016/j.energy.2021.121753
Rahman, A., Dargusch, P., and Wadley, D. (2021). The Political Economy of Oil Supply in Indonesia and the Implications for Renewable Energy Development. Renew. Sust. Energ. Rev. 144, 111027. doi:10.1016/j.rser.2021.111027
Rasli, A. M., Qureshi, M. I., Isah-Chikaji, A., Zaman, K., and Ahmad, M. (2018). New Toxics, Race to the Bottom and Revised Environmental Kuznets Curve: The Case of Local and Global Pollutants. Renew. Sust. Energ. Rev. 81, 3120–3130. doi:10.1016/j.rser.2017.08.092
Rizwan Nazir, M., Imran Nazir, M., Haider Hashmi, S., and Fareed, Z. (2018). Financial Development, Income, Trade, and Urbanization on CO2 Emissions: New Evidence from Kyoto Annex Countries. Risus 9 (3), 17–37. doi:10.24212/2179-3565.2018v9i3p17-37
Sbia, R., Shahbaz, M., and Hamdi, H. (2014). A Contribution of Foreign Direct Investment, Clean Energy, Trade Openness, Carbon Emissions and Economic Growth to Energy Demand in UAE. Econ. Model. 36, 191–197. doi:10.1016/j.econmod.2013.09.047
Shahzad, S. J. H., Shahbaz, M., Ferrer, R., and Kumar, R. R. (2017). Tourism-led Growth Hypothesis in the Top Ten Tourist Destinations: New Evidence Using the Quantile-On-Quantile Approach. Tourism Manag. 60, 223–232. doi:10.1016/j.tourman.2016.12.006
Shahzad, U., Doğan, B., Sinha, A., and Fareed, Z. (2021). Does Export Product Diversification Help to Reduce Energy Demand: Exploring the Contextual Evidences from the Newly Industrialized Countries. Energy 214, 118881. doi:10.1016/j.energy.2020.118881
Shahzad, U., Ferraz, D., Doğan, B., and Aparecida do Nascimento Rebelatto, D. (2020). Export Product Diversification and CO2 Emissions: Contextual Evidences from Developing and Developed Economies. J. Clean. Prod. 276, 124146. doi:10.1016/j.jclepro.2020.124146
Sharif, A., Afshan, S., and Qureshi, M. A. (2019). Idolization and Ramification between Globalization and Ecological Footprints: Evidence from Quantile-On-Quantile Approach. Environ. Sci. Pollut. Res. 26 (11), 11191–11211. doi:10.1007/s11356-019-04351-7
Sharma, R., Sinha, A., and Kautish, P. (2021). Does Renewable Energy Consumption Reduce Ecological Footprint? Evidence from Eight Developing Countries of Asia. J. Clean. Prod. 285, 124867. doi:10.1016/j.jclepro.2020.124867
Siche, R., Pereira, L., Agostinho, F., and Ortega, E. (2010). Convergence of Ecological Footprint and Emergy Analysis as a Sustainability Indicator of Countries: Peru as Case Study. Commun. Nonlinear Sci. Numer. Simulation 15 (10), 3182–3192. doi:10.1016/j.cnsns.2009.10.027
Su, Z.-W., Umar, M., Kirikkaleli, D., and Adebayo, T. S. (2021). Role of Political Risk to Achieve Carbon Neutrality: Evidence from Brazil. J. Environ. Manage. 298, 113463. doi:10.1016/j.jenvman.2021.113463
Sugiawan, Y., and Managi, S. (2016). The Environmental Kuznets Curve in Indonesia: Exploring the Potential of Renewable Energy. Energy Policy 98, 187–198. doi:10.1016/j.enpol.2016.08.029
Toda, H. Y., and Yamamoto, T. (1995). Statistical Inference in Vector Autoregressions with Possibly Integrated Processes. J. Econom. 66 (1-2), 225–250. doi:10.1016/0304-4076(94)01616-8
Trinugroho, I., Agusman, A., and Tarazi, A. (2014). Why Have Bank Interest Margins Been So High in Indonesia since the 1997/1998 Financial Crisis. Res. Int. Business Finance 32, 139–158. doi:10.1016/j.ribaf.2014.04.001
Wang, L., Chang, H.-L., Rizvi, S. K. A., and Sari, A. (2020). Are Eco-Innovation and export Diversification Mutually Exclusive to Control Carbon Emissions in G-7 Countries. J. Environ. Manage. 270, 110829. doi:10.1016/j.jenvman.2020.110829
Wang, Z., Ben Jebli, M., Madaleno, M., Doğan, B., and Shahzad, U. (2021). Does export Product Quality and Renewable Energy Induce Carbon Dioxide Emissions: Evidence from Leading Complex and Renewable Energy Economies. Renew. Energ. 171, 360–370. doi:10.1016/j.renene.2021.02.066
World Bank (2021). World Development Indicators. Available at: https://data.worldbank.org/indicator/NY.GDP.PCAP.KD (accessed July 10, 2021).
Yilanci, V., and Korkut Pata, U. (2020). Convergence of Per Capita Ecological Footprint Among the ASEAN-5 Countries: Evidence from a Non-linear Panel Unit Root Test. Ecol. Indicators 113, 106178. doi:10.1016/j.ecolind.2020.106178
Yuping, L., Ramzan, M., Xincheng, L., Murshed, M., Awosusi, A. A., Bah, S. I., et al. (2021). Determinants of Carbon Emissions in Argentina: The Roles of Renewable Energy Consumption and Globalization. Energ. Rep. 7, 4747–4760. doi:10.1016/j.egyr.2021.07.065
Keywords: export diversification, renewable energy consumption, load capacity factor, Fourier approximation, quantile causality test
Citation: Fareed Z, Salem S, Adebayo TS, Pata UK and Shahzad F (2021) Role of Export Diversification and Renewable Energy on the Load Capacity Factor in Indonesia: A Fourier Quantile Causality Approach. Front. Environ. Sci. 9:770152. doi: 10.3389/fenvs.2021.770152
Received: 03 September 2021; Accepted: 14 September 2021;
Published: 28 October 2021.
Edited by:
Lianbiao Cui, Anhui University of Finance and Economics, ChinaReviewed by:
Zahoor Ahmed, Beijing Institute of Technology, ChinaCopyright © 2021 Fareed, Salem, Adebayo, Pata and Shahzad. This is an open-access article distributed under the terms of the Creative Commons Attribution License (CC BY). The use, distribution or reproduction in other forums is permitted, provided the original author(s) and the copyright owner(s) are credited and that the original publication in this journal is cited, in accordance with accepted academic practice. No use, distribution or reproduction is permitted which does not comply with these terms.
*Correspondence: Sultan Salem, cy5zYWxlbUBiaGFtLmFjLnVr
Disclaimer: All claims expressed in this article are solely those of the authors and do not necessarily represent those of their affiliated organizations, or those of the publisher, the editors and the reviewers. Any product that may be evaluated in this article or claim that may be made by its manufacturer is not guaranteed or endorsed by the publisher.
Research integrity at Frontiers
Learn more about the work of our research integrity team to safeguard the quality of each article we publish.