- 1School of Chemical Engineering and Physical Sciences, Lovely Professional University, Jalandhar, India
- 2Indian Institute of Technology (Indian School of Mines), Dhanbad, India
Soil samples from the urban road and roadside often exhibit a high concentration of polycyclic aromatic hydrocarbons (PAHs). This contamination is attributed to vehicular exhaust emissions. After their release into the atmosphere, the PAH particulate matter eventually is deposited on the surface of the road and its surrounding areas. In order to develop a theoretical approach to quantify and predict the transport of PAH particulates from the atmosphere to the roadside soil, the estimation of particulate buildup in the atmosphere is a prerequisite. In the present study, empirical and temporal expressions of particulate buildup in the atmosphere have been developed. The developed site-specific expressions, coupled with other non–site-specific expressions can be used for indirect estimation of PAH particulate load in the soil of urban road networks.
1 Introduction
Polycyclic aromatic hydrocarbons (PAHs) are considered significant contributors to cancer and tumors in human beings (IARC, 2010). It has been reported that dermal contact with PAH-contaminated soil can be potentially hazardous for human health, as it is one of the major exposure pathways of PAHs to the human body (Tarafdar and Sinha, 2017a). It was observed that soil samples collected from busy traffic sites contain a significant amount of PAHs (Tarafdar and Sinha, 2017b). It has also been revealed that vehicular emission is one of the most important sources of PAHs in roadside soil (Suman et al., 2016). The suspended particulate matter (SPM) containing PAHs gets released from the tailpipes of the automobiles and eventually gets deposited into the soil. Another major cause of PAH contamination in the soil is wet deposition of SPM in the atmosphere. Therefore, proper quantification of SPM buildup in the atmosphere can provide crucial insights into the transport of PAHs from the atmosphere to the soil.
Several studies have revealed that residing near highways and major urban roadways results in adverse impacts on human health, including respiratory problems (McCreanor et al., 2007), birth defects and developmental issues (Wilhelm and Ritz, 2003), untimely death (Krewski et al., 2009), cardiovascular issues (Peters et al., 2004; Riediker et al., 2004), and cancer (Harrison et al., 1999; Pearson et al., 2000). These traffic-induced health risks can be the results of both short-term and long-term exposure to PM (Krewski et al., 2009; McCreanor et al., 2007).
It was reported that the traffic parameters and the traffic facilities have a significant influence on vehicular emission (Gokhale and Pandian 2007; Pandian et al., 2009). Concentrations of traffic-related air pollutants show strong spatial patterns (Roorda-Knape et al., 1998; Funasaka et al., 2000; Kingham et al., 2000; Zhu et al., 2002). A review by the World Health Organization (WHO, 2005) concluded that concentrations of oxides of nitrogen (NOx), black smoke, and particles less than 10 μm (PM10) within 200–500 m of roadways far exceeded the urban background; particles less than 2.5 μm (PM2.5) and PM10 had somewhat higher concentrations than the urban background. However, vehicular emission is not the sole determining factor of ambient air quality. Air quality (more specifically the ambient concentration of pollutants) of any road network is a function of onsite and non–traffic-related meteorological parameters which have significant temporal variability.
Generally, the prime focus of the line source dispersion model is to explore the spatial dispersion of the vehicle-induced pollutants. The temporal distribution of the pollutants, especially, in context of dry and wet deposition, is often not integrated into the line source models. Therefore, the gradual buildup of pollutant concentrations in the atmosphere after natural removal of the pollutants is often not recognized by the models. Temporal patterns can be dramatic since traffic quantities (and congestion), as well as meteorological factors affecting the dispersion of pollutants, are substantially related to the time of the day, day of the week, and/or season (Roosli et al., 2001; Martuzevicius et al., 2004).
Dispersion models can capture the variability of the pollutant concentration as the effect of mobile sources in the urban road networks and roadside environment. Near-surface dispersion models are widely used for dispersion studies at on road and roadside areas. Two classic examples of near-road dispersion models are the general finite line source model (GFLSM) (Luhar and Patil, 1989) and R-Line model (Snyder et al., 2013). Both the models are based on a steady-state Gaussian formulation and are designed to simulate the ambient pollutant concentration using line-type source emissions. However, the GFLSM does not account for dynamic change in the pollutant concentration in ambient air and particulate buildup. In order to eliminate this limitation, site-specific, time-dependent, and non–traffic-related variables are required to incorporate into the model. The GFLSM was modified to incorporate a temporal term to address the particulate buildup in ambient air of the vehicle-dominated sites.
In the present study, a site-specific and temporal expression of the particulate buildup in the atmosphere of the urban road network has been studied which, coupled with wet deposition, can serve as an indirect measure to quantify the PAH particulate concentration in the soil of the roadside and the area in close vicinity.
2 Materials and Methods
2.1 Study Area
Dhanbad was designated by the Central Pollution Control Board (CPCB, 2009) as one of the 24 critically polluted areas in India. Being designated as the “coal capital of India,” Dhanbad experiences a huge flow of daily traffic and, hence, an increased level of pollutant load, especially in occupational areas. Most of these occupational sites are located beside (mostly at intersections) National Highway 32 or NH-32 (presently National Highway 18), as it is the most important roadway of Dhanbad. Part of NH-32 located in Dhanbad experiences a dual mode of traffic activities. A portion of the road falls into a dense commercial area, and another portion is in a less dense area and in close vicinity of another national highway, namely, NH-2 (presently National Highway 19).
NH-32, which traverses through the study area, connects it with Bokaro Steel City and Chas on one side and with NH-2 on the northeastern side. This city is connected to other major cities such as Patna via NH-2, Ranchi via NH-32, and Jamshedpur via SH-12. Barwadda road is another important road that provides connectivity to NH-2. Jharia road, also known as SH-12, runs toward the south connecting the study area with Purulia and Chas.
NH-32 connects Govindpur in Dhanbad districts with Jamshedpur in the East Singhbhum district in Jharkhand. The total length of NH-32 is 179 km. It originates from the intersection of NH-2 at Govindpur. A 13-km long road segment up to Bank More covering a large and populated part of Dhanbad city is selected for the present study (Figure 1). A total of 10 monitoring points on the study road segment were selected to record the traffic activities (Figure 1) and (Supplementary Table S1). The reason for selecting the monitoring stations is their importance as commercial sites. Some onsite observations at the monitoring sites and notable traffic activities have been tabulated in Supplementary Table S3. Large crowds are often observed at the selected sites. The presence of PAH particulates in the soil and atmosphere of these locations may lead to significant exposure of PAH to the public.
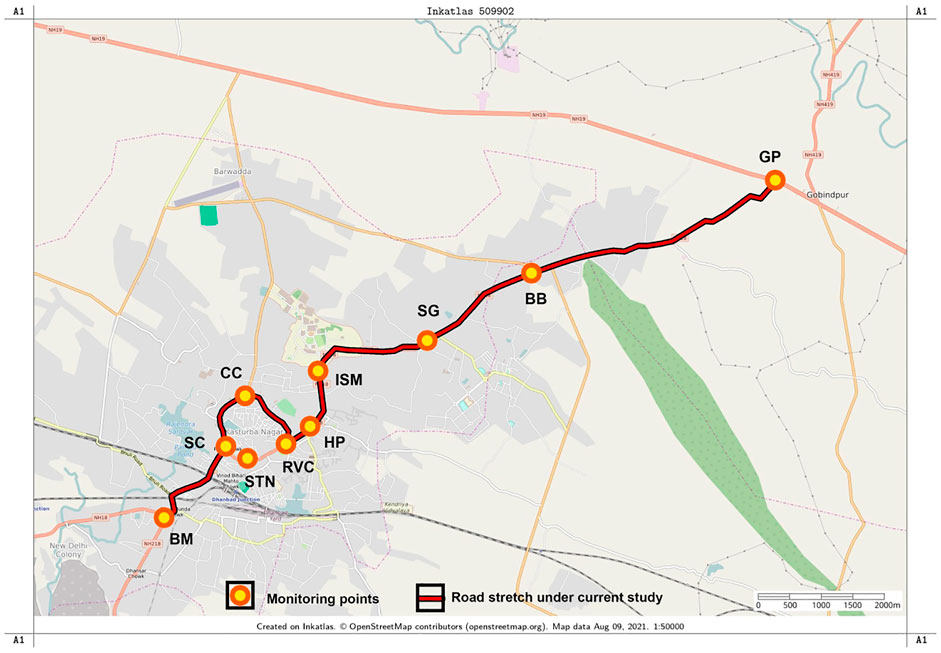
FIGURE 1. Road map of the study route and location of the monitoring points (base map source: https://www.openstreetmap.org).
2.2 Methodology
2.2.1 Data Collection
To study the near-road dispersion and the role of local source contribution, particulate matter (PM) was selected as the key pollutant. Additionally, carbon monoxide (CO) has been used as a reference gas for comparing the performances of the dispersion models in order to support the decision of model selection. The source of CO in near-road ambient air is mainly vehicular emission. As a result, the outcome of the dispersion study is more prone to yield accurate results than the pollutants (such as PM) with additional non–traffic-related sources. The measurement of CO and PM concentrations was carried out at the predefined monitoring locations (Supplementary Table S1) on NH-32. To study the pollutant buildup in the atmosphere, winter rainfall was considered to be a suitable monitoring time. Monitoring was carried out during winter before the first winter rainfall, immediately after the last rainfall, and at specified intervals afterward (1, 2, 7, 15, and 30 days after rainfall). The measurement of CO was performed using a CO meter (make: KIMO, model: AQ 200), and the measurement of PM was carried out using an aerosol spectrophotometer (make: GRIMM, model: 1.109). The duration of data collection was 1 h for both pollutants. The data collection was performed at the highest possible data collection frequency of the instruments (1 data point per 6 s in case of CO, and 1 data point per second in case of PM). The ERs of CO were obtained using a flue gas analyzer (HORIBA, CVS-51S). The emission rate (ER) of PM10, PM2.5, and PM1 was obtained using the PART5 (1995) emission model.
2.2.2 Dispersion Models
The concentration of gaseous matter and PM was estimated for all the sites considered in the present study with the help of the GFLSM and R-Line dispersion model. Both the models are based on a steady-state Gaussian formulation and are designed to simulate the ambient pollutant concentration using line-type source emissions. The GFLSM was developed by Luhar and Patil (1989). This model is based on Gaussian diffusion equations and modified to take the diversity of wind direction into account. Unlike the GM, this model does not consider an infinite length of the roadway. The GFLSM was extensively used by many researchers (Banerjee et al., 2011; Ganguly and Broderick 2008; Wang et al., 2006; Mishra et al., 2016; Rajput et al., 2019; Madhavan and Geetha, 2021; Sangeetha and Amudha, 2021). It was reported that the GFLSM performs better than the GM, CALINE3, and Highway-2 due to the finite length consideration. Moreover, due to the simplicity and flexibility of this model, it is appropriate to be integrated with other models, such as traffic flow simulation models (Drag and Wojciech, 2009). The Research LINE-source (R-LINE) (v1.2) model was developed by the U.S. EPA in the 2010s which is a steady-state dispersion model for line sources (Synder et al., 2013). It was developed for predicting mobile source air quality impacts near roadways. It is frequently used in simulating dispersion processes, but only in the simulation of the physical processes and not chemical processes. Clearly, it accounts only for primary and chemically inert pollutants. The R-LINE model takes meteorologic parameters as inputs, such as wind speed, wind direction, Monin–Obukhov length for turbulence, and surface friction velocity. However, it does not consider the impact of wet deposition (e.g., due to precipitation) or non-linear chemical transformation (Venkatram et al., 2013). The concentration from a finite line source in the R-LINE model is estimated by approximating the line as a series of point sources. The number of points needed for convergence to the proper solution is determined by the model and, in particular, is a function of the distance from the source line to the receptor. Each point source is simulated using a Gaussian plume formulation. The GFLSM was executed for each of the sites using a site-specific ER of gaseous pollutants and particulates separately. The meteorological parameters (wind speed and wind direction) were collected from the Meteorological and Oceanographic Satellite Data Archival Center (MOSDAC) meteorological data repository. The dispersion coefficients (σy and σz) were calculated using Martin’s equations (Eq. 1 and Eq. 2) (Martin, 1976).
where a, b, c, d, and f are stability-dependent constants. The values of a, b, c, d, and f are tabulated in Table 1.
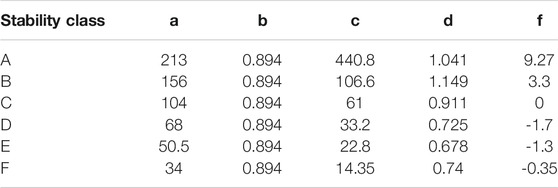
TABLE 1. Values of a, b, c, d, and f for σy and σz for different stability conditions (Martin, 1976).
The R-Line model uses the pre-processed surface meteorological data files generated by AERMET (a meteorological pre-processor of AERMOD). The raw meteorological files (in SCRAM format) were used as the input of AERMET. The raw meteorological data were obtained from the MOSDAC meteorological data repository. The dispersion study for PM was carried out using the site-specific ER-derived emission model Part-5. The derived concentration data for CO and particulates were then compared with the observed concentration of CO and particulates.
In order to study the particulate buildup in the atmosphere, the dispersion study was carried out in regular intervals after rainfall. The ERs of PM10, PM2.5, and PM1 from the traffic sources were assumed to be constant over time. The dispersion model GFLSM was used to estimate the pollutant concentration. The relationship between the particulate concentration and the time elapsed after rainfall was established.
2.2.3 Modification in the General Finite Line Source Model
The dispersion model GFLSM was modified to address the particulate buildup in the atmosphere by incorporating a temporal term in the governing equation (Eq. 3) (Luhar and Patil, 1989). The derived relationship between the particulate concentration in ambient air and the time elapsed after rainfall was primarily observed to be logarithmic. Again, the ER was considered uniform over time, and on the other hand, the GFLSM is a steady-state dispersion model; the concentration value directly derived from the GFLSM was considered the non-incremental term of the observed relationship (Eq. 4). The incremental term was considered to be attributed to the background level of particulates in ambient air. In order to quantify the particulate buildup in ambient air of road networks in Dhanbad, the coefficients of the incremental term were defined to be site-specific and non–traffic-associated parameters.
where CGFLSM is the concentration of pollutants in ambient air (estimated with the GFLSM); Q is the vehicular ER; ue is the wind speed; z is the receptor height; h0 is the plume rise; θ is the wind direction; L is the length of the road segment; y is the receptor distance from the roadway center line along the line source; x is the downwind distance; CMGFLSM is the concentration of pollutants in ambient air (after the modification in the GFLSM); a is the site-specific non–traffic-associated parameter; and train is the time elapsed after rainfall in days.
3 Results and Discussion
The results of the dispersion study are displayed and discussed in this section. First, the inter-comparison between the performance of the GFLSM and R-Line model is presented. The observed concentration and temporal variability of PM10, PM2.5, and PM1 are displayed.
The estimated and observed values of CO concentration in ambient air at different sites of Dhanbad road networks are depicted in Figure 2. It can be observed that the highest concentration of CO was at SC for both observed data and estimated data (GFLSM and R-Line). The lowest observed concentration of CO was at ISM and BB, and on the other hand, the lowest value of CO concentration estimated with the GFLSM and R-Line was found at BB and GP, respectively. The R-Line model overestimated the CO concentration at most of the sites (except CC). The concentration of CO was underestimated by the GFLSM at BM, SC, STN, CC, and RVC, but the same was overestimated at HP, ISM, SG, BB, and GP. The observed concentration of CO was found to be above the national ambient air quality standards (NAAQS, 2009) at BM, SC, and CC. The CO concentration estimated with the GFLSM followed the same trend in this aspect, but in the case of the R-Line model, BM, SC, STN, and CC were above the NAAQS limit of CO.
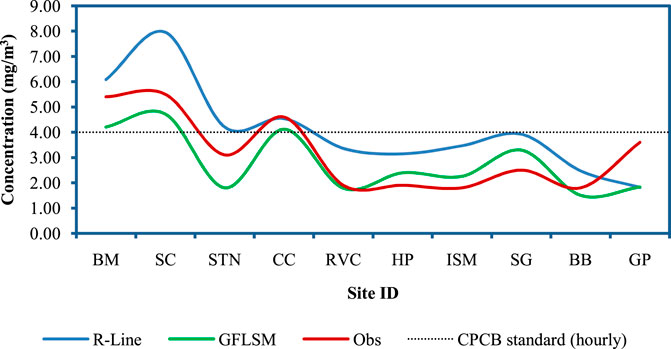
FIGURE 2. Estimated and observed values of CO concentration in ambient air at different sites of Dhanbad road networks.
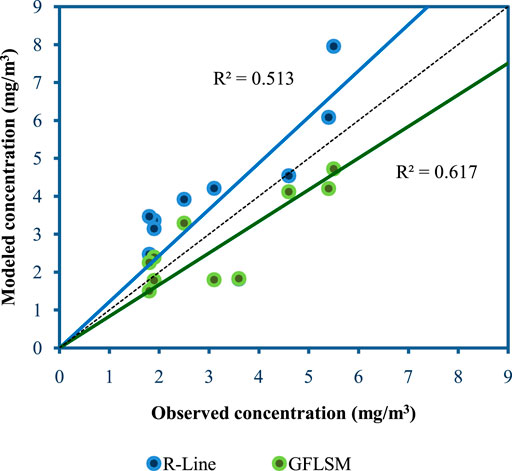
The comparison between the performance of the GFLSM and R-Line model is depicted in Figure 3. It can be observed that the general tendency of the GFLSM was to underestimate the ambient concentration of CO, whereas the tendency of the R-Line model was to overestimate it. It can also be observed that the GFLSM produces better estimates of CO concentration than the R-Line model.
3.1 Particulate Buildup in the Atmosphere
Figures 4A–J depicts the concentration of PM10, PM2.5, and PM1 at different sites in Dhanbad road networks at specified time intervals after rainfall. It can be observed that in all sites, the concentration of ambient PM increased significantly. A similar trend was observed by Yoo et al. (2020). The researchers investigated the impacts of the meteorological conditions on the concentration of PM10 and PM2.5. Although the researchers of the aforementioned study observed the increment of PM concentration within the days after rainfall, any well-defined relationship was not established. Another study by Olszowski (2016) demonstrated the gradual increment of PM10 concentration with time elapsed after rainfall. However, the temporal resolution of the present study is different from that of the aforementioned study. In the present study, a logarithmic relationship between the PM concentrations and the days after rainfall was observed. The coefficients of the logarithmic term and the intercept of the site-specific relationship between particulate concentration in ambient air and time elapsed after rainfall are tabulated in Table 2. The increments were likely to be attributed to the local non–traffic-related sources and local meteorological parameters that cause the buildup of PM in ambient air. The buildup tendency was observed to be the highest in the case of PM10 at all sites followed by PM2.5 and PM10. At most of the sites, the difference between the particulate concentration in ambient air before rainfall and after 30 days from rainfall was observed to be negligible (Figure 5; Supplementary Table S2).

FIGURE 4. Concentration buildup of PM10, PM2.5, and PM1 after rainfall at different sites in Dhanbad road networks [(A) BM, (B) SC, (C) STN, (D) CC, (E) RVC, (F) HP, (G) ISM, (H) SG, (I) BB, and (J) GP].
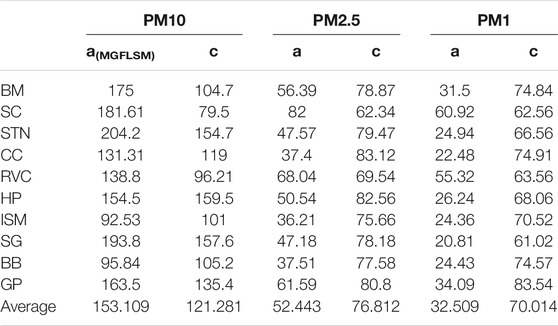
TABLE 2. Coefficients of the logarithmic term and the intercept of the site-specific relationship between particulate concentration in ambient air and time elapsed after rainfall.
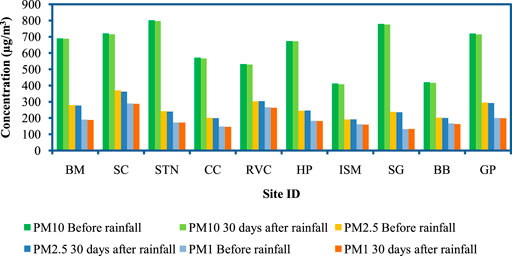
FIGURE 5. Difference between the particulate concentration in ambient air before rainfall and after 30 days from rainfall.
It was observed that the GFLSM operates with relatively high performance immediately after rainfall than before rainfall. The detailed result of the performance evaluation study is tabulated in Table 3. It can be noticed that the difference in the fractional bias (FB) was significantly high. The FB of the after-rainfall particulate concentration was within the acceptable limit (−0.5 to 0.5). The index of agreement (IOA) was found to be higher in the case of after-rainfall particulate concentration.
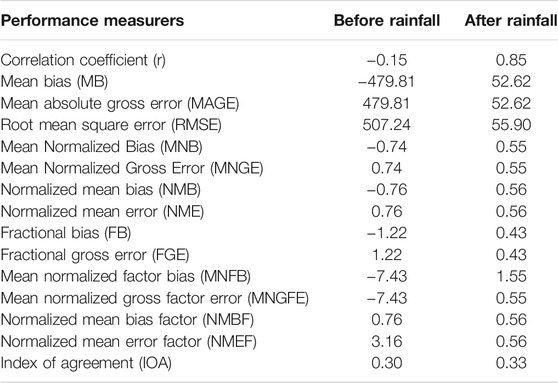
TABLE 3. Performance of the GFLSM for estimating particulate concentration before and after rainfall.
4 Conclusion
The performance of the GFLSM was observed to be better than that of the R-Line model in the study area. Another notable observation was that the GFLSM underestimated the concentration of the pollutants whereas R-Line overestimated the same. The ambient concentration of PM10, PM2.5, and PM1was observed to increase logarithmically over time after the rainfall event. This relationship was used for the modification of the GFLSM to quantify the pollutant buildup in the atmosphere over time. It was observed that it took approximately 30 days for the atmosphere of the Dhanbad road network to regain the concentration of the particulate pollutants similar to that before the scavenging of PM due to rainfall. This information may help in the estimation of PM scavenging due to the next instances of wet deposition within the aforementioned temporal range. The subsequent result can be helpful in estimating the transport of PAH particulates into the roadside soil. Although the study provides an estimation of PAH particulate transport into the soil, the derived coefficients are site-specific. Therefore, initial information of onsite meteorology is required for the estimation of subsequent temporal variation in the PAH concentration. This limitation may be removed if the derived trends of particulate buildup in the atmosphere are integrated in a micro- or meso-scale dispersion model for theoretical estimation of the coefficients. Elaborate information on dispersion and deposition of PM (especially of PM2.5) into the roadside soil can offer a huge scope of exposure study and health risk assessment of PAHs.
Data Availability Statement
The original contributions presented in the study are included in the article/Supplementary Material; further inquiries can be directed to the corresponding author.
Author Contributions
Site selection, data collection, and analysis were performed by PA. The study was supervised and guided by SE.
Conflict of Interest
The authors declare that the research was conducted in the absence of any commercial or financial relationships that could be construed as a potential conflict of interest.
Publisher’s Note
All claims expressed in this article are solely those of the authors and do not necessarily represent those of their affiliated organizations, or those of the publisher, the editors, and the reviewers. Any product that may be evaluated in this article, or claim that may be made by its manufacturer, is not guaranteed or endorsed by the publisher.
Supplementary Material
The Supplementary Material for this article can be found online at: https://www.frontiersin.org/articles/10.3389/fenvs.2021.768358/full#supplementary-material
References
Banerjee, T., Barman, S. C., and Srivastava, R. K. (2011). Application of Air Pollution Dispersion Modeling for Source-Contribution Assessment and Model Performance Evaluation at Integrated Industrial Estate-Pantnagar. Environ. Pollut. 159 (4), 865–875. doi:10.1016/j.envpol.2010.12.026
Drag, Ł., and Wojciech, S. (2009). “The Integrated Computer System For Modelling of Air Pollution Based on The Digital Data,” in 2009 IEEE International Workshop on Intelligent Data Acquisition and Advanced Computing Systems: Technology and Applications (IEEE), 478–483.
Funasaka, K., Miyazaki, T., Tsuruho, K., Tamura, K., Mizuno, T., and Kuroda, K. (2000). Relationship between Indoor and Outdoor Carbonaceous Particulates in Roadside Households. Environ. Pollut. 110 (1), 127–134. doi:10.1016/s0269-7491(99)00281-x
Ganguly, R., and Broderick, B. M. (2008). Performance Evaluation and Sensitivity Analysis of the General Finite Line Source Model for CO Concentrations Adjacent to Motorways: A Note. Transportation Res. D: Transport Environ. 13 (3), 198–205. doi:10.1016/j.trd.2008.01.006
Gokhale, S., and Pandian, S. (2007). A Semi-empirical Box Modeling Approach for Predicting the Carbon Monoxide Concentrations at an Urban Traffic Intersection. Atmos. Environ. 41 (36), 7940–7950. doi:10.1016/j.atmosenv.2007.06.065
Harrison, R. M., Leung, P. L., Somervaille, L., Smith, R., and Gilman, E. (1999). Analysis of Incidence of Childhood Cancer in the West Midlands of the United Kingdom in Relation to Proximity to Main Roads and Petrol Stations. Occup. Environ. Med. 56 (11), 774–780. doi:10.1136/oem.56.11.774
IARC (2010). Some Non-heterocyclic Polycyclic Aromatic Hydrocarbons and Some Related Exposures. IARC Monogr. Eval. Carcinog Risks Hum. 92, 1–853.
Kingham, S., Briggs, D., Elliott, P., Fischer, P., and Erik Lebret, E. (2000). Spatial Variations in the Concentrations of Traffic-Related Pollutants in Indoor and Outdoor Air in Huddersfield, England. Atmos. Environ. 34 (6), 905–916. doi:10.1016/s1352-2310(99)00321-0
Krewski, D., Jerrett, M., Burnett, R. T., Ma, R., Hughes, E., Shi, Y., et al. (2009). Extended Follow-Up and Spatial Analysis of the American Cancer Society Study Linking Particulate Air Pollution and Mortality. Res. Rep. Health Eff. Inst. 140 (5), 5–36.
Luhar, A. K., and Patil, R. S. (1989). A General Finite Line Source Model for Vehicular Pollution Prediction. Atmos. Environ. (1967) 23 (3), 555–562. doi:10.1016/0004-6981(89)90004-8
Madhavan, S., and Geetha, S. (2021). “Predicting Particulate Air Pollution Using Line Source Models,” in Urban Air Quality Monitoring, Modelling and Human Exposure Assessment (Singapore: Springer), 137–153. doi:10.1007/978-981-15-5511-4_10
Martin, D. O. (1976). Comment On"The Change of Concentration Standard Deviations with Distance". J. Air Pollut. Control Assoc. 26 (2), 145–147. doi:10.1080/00022470.1976.10470238
Martuzevicius, D., Grinshpun, S. A., Reponen, T., Górny, R. L., Shukla, R., Lockey, J., et al. (2004). Spatial and Temporal Variations of PM2.5 Concentration and Composition throughout an Urban Area with High Freeway Density-The Greater Cincinnati Study. Atmos. Environ. 38 (8), 1091–1105. doi:10.1016/j.atmosenv.2003.11.015
McCreanor, J., Cullinan, P., Nieuwenhuijsen, M. J., Stewart-Evans, J., Malliarou, E., Jarup, L., et al. (2007). Respiratory Effects of Exposure to Diesel Traffic in Persons with Asthma. N. Engl. J. Med. 357 (23), 2348–2358. doi:10.1056/nejmoa071535
Mishra, R. K., Shukla, A., Parida, M., and Pandey, G. (2016).Urban Roadside Monitoring and Prediction of CO, NO2 and SO2 Dispersion from On-Road Vehicles in Megacity Delhi. Transportation Res. Part D: Transport Environ. 46, 157–165. doi:10.1016/j.trd.2016.03.019
Olszowski, T. (2016). Changes in PM10 Concentration Due to Large-Scale Rainfall. Arab J. Geosci. 9 (2), 160. doi:10.1007/s12517-015-2163-2
Pandian, S., Gokhale, S., and Ghoshal, A. K. (2009). Evaluating Effects of Traffic and Vehicle Characteristics on Vehicular Emissions Near Traffic Intersections. Transportation Res. Part D: Transport Environ. 14 (3), 180–196. doi:10.1016/j.trd.2008.12.001
PART5 (1995). A Program for Calculating Particle Emission from Motor Vehicles. Michigan: Office of Mobile Sources, National Motor Vehicle and Fuels Emission Laboratory, US Environmental Protection Agency.
Pearson, R. L., Wachtel, H., and Ebi, K. L. (2000). Distance-weighted Traffic Density in Proximity to a home Is a Risk Factor for Leukemia and Other Childhood Cancers. J. Air Waste Manag. Assoc. 50 (2), 175–180. doi:10.1080/10473289.2000.10463998
Peters, M. J., van der Horst-Bruinsma, I. E., Dijkmans, B. A., and Nurmohamed, M. T. (2004).Cardiovascular Risk Profile of Patients with Spondylarthropathies, Particularly Ankylosing Spondylitis and Psoriatic Arthritis. Semin. Arthritis Rheum. 34, 585–592. doi:10.1016/j.semarthrit.2004.07.010
Rajput, J. S., Saxena, A. K., and Singh, U. P. (2019). Application of Mathematical Modeling for the Prediction of NOx Concentration Due to Vehicular Emission and Model Performance in Gwalior City,(MP). Int. J. Innovative Sci. Res. Techn. 4 (01), 29–36. doi:10.13140/RG.2.2.17274.13768
Riediker, M., Cascio, W. E., Griggs, T. R., Herbst, M. C., Bromberg, P. A., Neas, L., et al. (2004). Particulate Matter Exposure in Cars Is Associated with Cardiovascular Effects in Healthy Young Men. Am. J. Respir. Crit. Care Med. 169 (8), 934–940. doi:10.1164/rccm.200310-1463oc
Roorda-Knape, M. C., Janssen, N. A. H., De Hartog, J. J., Van Vliet, P. H. N., Harssema, H., and Brunekreef, B. (1998). Air Pollution from Traffic in City Districts Near Major Motorways. Atmos. Environ. 32 (11), 1921–1930. doi:10.1016/s1352-2310(97)00496-2
Röösli, M., Theis, G., Künzli, N., Staehelin, J., Mathys, P., Oglesby, L., et al. (2001). Temporal and Spatial Variation of the Chemical Composition of PM10 at Urban and Rural Sites in the Basel Area, Switzerland. Atmos. Environ. 35 (21), 3701–3713. doi:10.1016/s1352-2310(00)00511-2
Sangeetha, A., and Amudha, T. (2021). A Particle Swarm Optimization Methodology to Design an Effective Air Quality Monitoring Network. Environment, Development and Sustainability 23, 15739–15763.
Snyder, M. G., Venkatram, A., Heist, D. K., Perry, S. G., Petersen, W. B., and Isakov, V. (2013). RLINE: A Line Source Dispersion Model for Near-Surface Releases. Atmos. Environ. 77, 748–756. doi:10.1016/j.atmosenv.2013.05.074
Suman, S., Sinha, A., and Tarafdar, A. (2016). Polycyclic Aromatic Hydrocarbons (PAHs) Concentration Levels, Pattern, Source Identification and Soil Toxicity Assessment in Urban Traffic Soil of Dhanbad, India. Sci. Total Environ. 545-546, 353–360. doi:10.1016/j.scitotenv.2015.12.061
Tarafdar, A., and Sinha, A. (2017a). Cancer Risk Assessment of Polycyclic Aromatic Hydrocarbons in the Soils and Sediments of India: a Meta-Analysis. Environ. Manag. 60 (4), 784–795. doi:10.1007/s00267-017-0920-6
Tarafdar, A., and Sinha, A. (2017b). Estimation of Decrease in Cancer Risk by Biodegradation of PAHs Content from an Urban Traffic Soil. Environ. Sci. Pollut. Res. 24 (11), 10373–10380. doi:10.1007/s11356-017-8676-3
Venkatram, A., Snyder, M. G., Heist, D. K., Perry, S. G., Petersen, W. B., and Isakov, V. (2013). Re-formulation of Plume Spread for Near-Surface Dispersion. Atmos. Environ. 77, 846–855. doi:10.1016/j.atmosenv.2013.05.073
Wang, J. S., Chan, T. L., Ning, Z., Leung, C. W., Cheung, C. S., and Hung, W. T. (2006). Roadside Measurement and Prediction of CO and PM2.5 Dispersion from On-Road Vehicles in Hong Kong. Transportation Res. Part D: Transport Environ. 11 (4), 242–249. doi:10.1016/j.trd.2006.04.002
Wilhelm, M., and Ritz, B. (2003). Residential Proximity to Traffic and Adverse Birth Outcomes in Los Angeles County, California, 1994-1996. Environ. Health Perspect. 111 (2), 207–216. doi:10.1289/ehp.5688
World Health Organization (2005). Health Effects of Transport-Related Air Pollution. Copenhagen: WHO Regional Office for Europe, 125–165.
Yoo, H-G., Hong, J-W., Jinkyu, H., Sunyong, S., Yoon, E. J., Park, J-H., et al. (2020). Impact of Meteorological Conditions on the PM2.5 and PM10 Concentrations in Seoul. J. Clim. 11 (5-2), 521–528. doi:10.15531/ksccr.2020.11.5.521
Keywords: vehicular exhaust, transport of PAHs, soil contamination, wet deposition, dispersion model
Citation: Adak P and Elumalai SP (2021) Estimation of Onsite Factors on Polycyclic Aromatic Hydrocarbon Particulate Buildup in Urban Road Networks. Front. Environ. Sci. 9:768358. doi: 10.3389/fenvs.2021.768358
Received: 31 August 2021; Accepted: 11 October 2021;
Published: 03 November 2021.
Edited by:
Abhrajyoti Tarafdar, Korea University, South KoreaReviewed by:
Azadeh Tavakoli, University of Zanjan, IranSagnik Chakraborty, Jiangsu University, China
Copyright © 2021 Adak and Elumalai. This is an open-access article distributed under the terms of the Creative Commons Attribution License (CC BY). The use, distribution or reproduction in other forums is permitted, provided the original author(s) and the copyright owner(s) are credited and that the original publication in this journal is cited, in accordance with accepted academic practice. No use, distribution or reproduction is permitted which does not comply with these terms.
*Correspondence: Prasenjit Adak, cHJhc2Vuaml0LjIzOTY2QGxwdS5jby5pbg==
 Prasenjit Adak
 Suresh Pandian Elumalai2