 Guoyin Wang
 Wennan Leng3
 Bangjun Cao
94% of researchers rate our articles as excellent or good
Learn more about the work of our research integrity team to safeguard the quality of each article we publish.
Find out more
ORIGINAL RESEARCH article
Front. Environ. Sci., 10 November 2021
Sec. Atmosphere and Climate
Volume 9 - 2021 | https://doi.org/10.3389/fenvs.2021.763504
This article is part of the Research TopicDust and Polluted Aerosols: Sources, Transport and Radiative EffectsView all 13 articles
Atmospheric diffusion is one of the factors affecting local air quality, dominating the evolution of air pollution episodes. Previous work has emphasized the unfavorable diffusion conditions in the Sichuan Basin resulting from its complex terrain. However, the recent spatiotemporal variation in atmospheric diffusion conditions in the basin and their effects on local air quality remain unclear. Based on the wind speed, boundary layer height, vertical potential temperature difference of ERA5 analysis, two independent metrics containing information on horizontal and vertical diffusion ability, i.e., ventilation coefficient (VE) and the air stagnant conditions (ASI), are involved to indicate wintertime atmospheric diffusion conditions in the basin. Both VE and ASI reveal a decrease tendency of atmospheric diffusion condition from the northwestern portion of the basin to the southeast. In terms of the long-term variation in diffusion conditions, VE showed a broader increasing trend from 1979 to 2019, with a distinct increase in the western region. In contrast, the occurrence of air stagnation events has declined −3∼−6%/decade in the basin, more significantly over the western basin. Both the increase in VE and the decrease in air stagnation frequency indicate the improvement of atmospheric diffusion conditions in the Sichuan Basin from 1979 to 2019, which mitigates the effects of air pollutant emissions to some extent. The enhancement of diffusion conditions is due to the improvement of vertical diffusion conditions. The lowest seasonal PM2.5 concentrations occur in the northwestern basin, where VE is highest and ASI is lowest. Atmospheric diffusion conditions can explain approximately 25–50% of the interannual variation in PM2.5 concentrations in Chengdu.
Severe and frequent air pollution has become a major environmental concern in China in recent years (Dang and Liao, 2019; Hu et al., 2019; Li et al., 2019; Mu and Zhang, 2014). Pollution episodes, characterized by dense fine particles and low horizontal visibility, have many negative impacts on transportation, public health and weather/climate (Che et al., 2019; Chen H. et al., 2019; Chen S. et al., 2019; Feng and Wang, 2019; He Y. et al., 2018; Jian et al., 2018; Wang et al., 2009; Wang et al., 2018b). Numerous studies have been conducted to reveal the mechanisms of haze formation and its long-term variation, indicating that high pollutant emissions and unfavorable meteorological conditions are two key factors (Chen et al., 2018; Ding et al., 2019; Fan et al., 2020; Huang et al., 2018; Miao et al., 2017; Hu et al., 2021). Secondary aerosol formation also contributes to the explosive growth of particulate concentrations, especially during the developing stage of each pollution episode (Guo et al., 2019; He J. et al., 2018; Ma et al., 2020; Sun et al., 2013; Zhao D. et al., 2018). Moreover, variation in East Asian winter monsoon strength, El Niño-Southern Oscillation, Arctic Sea ice extent and the phase of Pacific Decadal Oscillation change background atmospheric circulation and in turn affect the formation of air pollution at different time scales (Cai et al., 2017; Chang et al., 2020; Chen and Wang, 2015; Li et al., 2016; Wang et al., 2020; Yin et al., 2017).
There are four main regions suffering from the severe air pollution in China: the North China Plain (NCP), Yangtze River Delta (YRD), Pearl River Delta (PRD) and Sichuan Basin (Bi et al., 2016; Wang and Zhang, 2020a; Wang and Zhang, 2020b; Xia et al., 2020; Zhang and Geng, 2019; Zhao and Garrett, 2015; Zhao et al., 2020). Compared to the first three mega-regions, less attention has been given to the air quality in the Sichuan Basin, especially the long-term variation in air quality and its attribution in terms of the long-term variation. The Sichuan Basin comprises the greater part of eastern Sichuan Province and the western portion of Chongqing municipality located in southwestern China. It is surrounded by the highlands of the Tibetan Plateau to the west, the YunGui Plateau to the south, the Wu Mountains to the east and the Daba Mountains to the north (Cao et al., 2020; Liu et al., 2021; Zhong et al., 2019). The complex local topography stimulates special meteorological conditions with lower surface wind, higher relative humidity and a stable boundary layer, which is conducive to the formation of haze in the basin (Liao et al., 2018; Ning et al., 2018). Therefore, although the anthropogenic emissions in the basin are not as much as those in the other three regions, its air pollution ranks in the top four regions in China (Fan et al., 2015; Gui et al., 2019; Liu et al., 2019; Zhang et al., 2019; Zhao S. et al., 2018).
Emissions in a specific region do not normally change much over a short period, but local meteorological patterns change rapidly and can strongly affect the accumulation, removal, and transport of air pollutants and thus the day-to-day variation in air pollutants (Chen et al., 2020; Zhang, 2017; Zhang et al., 2014; Zhao C. et al., 2018). A combined metric to evaluate the effects of atmospheric conditions on air pollution is the atmospheric diffusion ability, which cannot be ignored in the quantitative evaluation of historical emission reduction effects and the development of emission reduction measures. The atmospheric ventilation coefficient (VE) provides an indication of the ability of the atmosphere to disperse pollutants over a region and is the metric most frequently used to predict the evolution of local diffusion conditions. Generally, VE in the basin is relatively weak due to special terrain (Ning et al., 2019; Tang et al., 2015; Zhu et al., 2018). Severe air pollution episodes are also linked to the occurrence of air stagnation conditions (Wang et al., 2016). A previous work highlighted that the Sichuan Basin experiences frequent air stagnation conditions for approximately half of the whole year, which is the worst atmospheric diffusion condition among the four severely polluted regions in China listed above. However, the work of Wang et al. (2016) has only provided an average frequency of air stagnation in the basin based on the meteorological conditions at several PM2.5 observation stations from 2013 to 2017. The thresholds for the occurrence of air stagnation events are established according to the global air pollutant concentrations, which may smooth some local air pollution information. In addition, the spatial variation in the occurrence frequency of air stagnation conditions in the basin, how atmospheric diffusion conditions have changed in recent decades, and the extent of impact of temporal and spatial variation in atmospheric diffusion conditions on local air quality remain unclear.
In this work, the long-term variation in VE and the occurrence of air stagnation events are examined to investigate the spatial and temporal variation in atmospheric diffusion conditions in the Sichuan Basin. The regional thresholds for air stagnation conditions are defined in Section 2. Spatiotemporal variation in diffusion conditions and their effects on local air quality are shown in Section 3.
Figure 1 shows the altitude distribution around the Sichuan Basin. Sixty-four air quality observation stations from the Ministry of Ecology and Environment of the People’s Republic of China are located in the basin (i.e., altitude under 1,000 m). The 64 stations belong to 14 cities in Sichuan Province and Chongqing City. The PM2.5 concentrations observed from December 2013 to December 2019 at the 64 stations were used to indicate the variation in ambient air quality. The fifth-generation European Centre for Medium-Range Weather Forecasts atmospheric reanalysis data (ECMWF ERA5) with a horizontal resolution of 0.25°
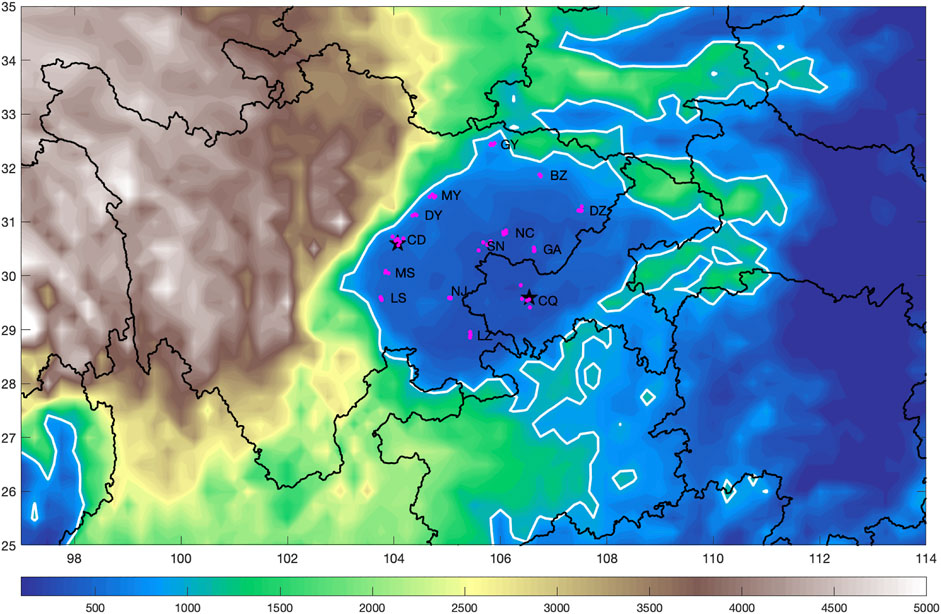
FIGURE 1. Spatial distribution of elevation around the Sichuan Basin (unit: m) and 64 air quality observation stations in the basin. The edge of the Sichuan Basin is marked by the 1000-m contour line (white line). Magenta dots indicate the locations of the 64 air quality stations. GY (Guangyuan), BZ (Bazhong), MY (Mianyang), DY (Deyang), CD (Chengdu), MS (Meishan), LS (Leshan), NC (Nanchong), SN (Suining), NJ (Nenjiang), DZ (Dazhou), GA (Guang’an), CQ (Chongqing), and LZ (Luzhou) indicate the 14 cities in the basin. CD and CQ are marked by black stars.
The ventilation coefficient (VE) is a product of the boundary layer height and average vertical wind speed through the boundary layer. The higher the VE is, the more efficiently the atmosphere can disperse near-surface pollutants and the better the air quality. The VE can be calculated by (Lu et al., 2012; Liu et al., 2012; Sujatha et al., 2016):
where
Air stagnation is considered to consist of light winds so that horizontal dispersion is at a minimum, a stable lower atmosphere that effectively prevents vertical escape, and no precipitation to wash any pollution away (Wang et al., 2018a). Severe air pollution episodes are usually related to the presence of air stagnation. There exist several types of quantitative definitions for air stagnation events based on different meteorological variables depending on the domain concerned. Previous work has shown relatively high frequency of air stagnation events in the Sichuan Basin based on a nationwide unified air stagnation threshold. However, it is essential to identify a more regionally applicable air stagnation definition due to the complicated terrain around the basin. Here, the 10 m (Wind_10) wind speed and potential temperature difference between 925 hPa and 850 hPa
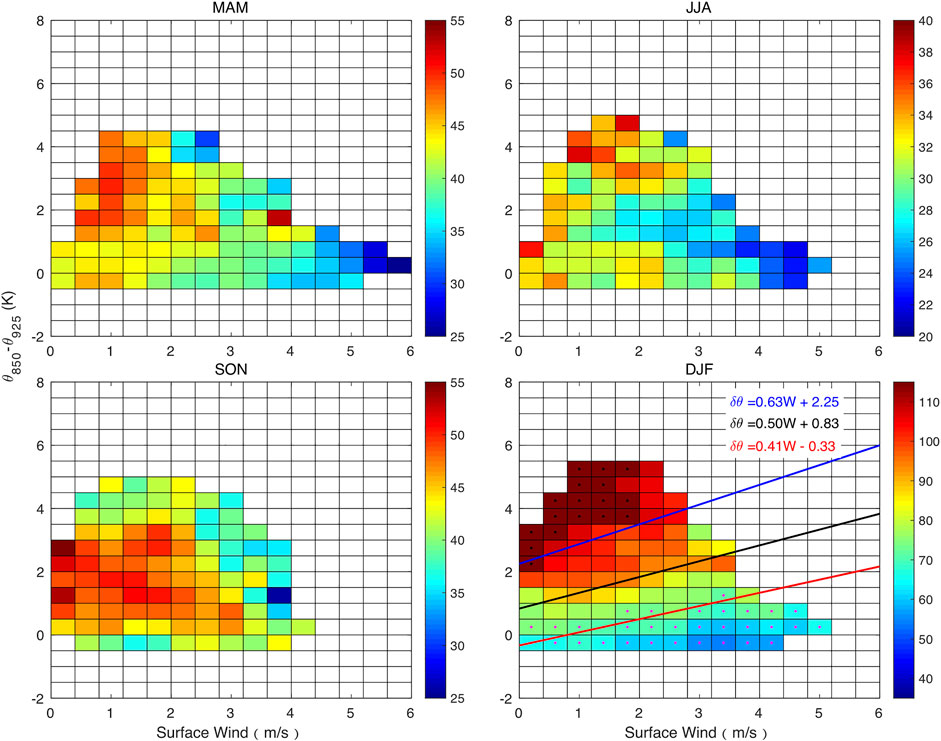
FIGURE 2. Seasonal dependence of PM2.5 concentrations on the 10-m wind speed (Wind_10) and potential temperature difference between 925 hPa and 850 hPa (
To eliminate the effects of seasonal, spatial, and long-term variations in PM2.5 concentration, PM2.5 concentrations on dry days were normalized by their corresponding monthly mean values. That is, if the normalized PM2.5 concentrations exceeded 100%, the original PM2.5 concentrations were higher than their monthly mean, and the corresponding atmospheric conditions were defined as air stagnation conditions. Figure 3 displays the relationship between normalized PM2.5 concentrations and the variation in
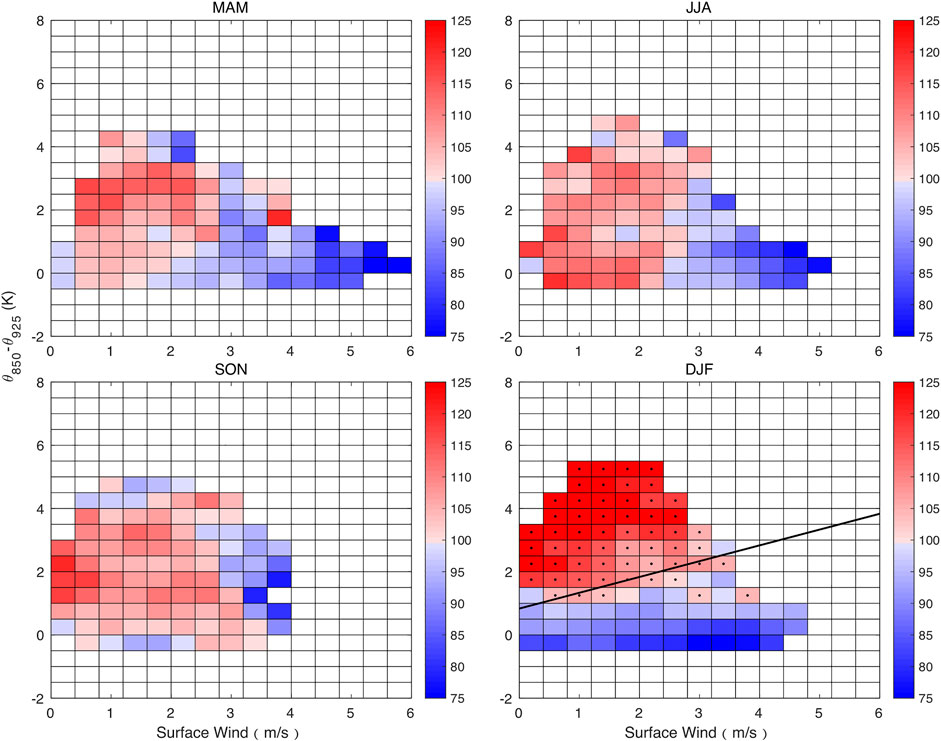
FIGURE 3. Seasonal dependence of normalized PM2.5 concentrations on the 10-m wind speed (Wind_10) and potential temperature difference between 925 hPa and 850 hPa (
The wintertime climatology distributions of VE, and frequencies of ASI, favorable and unfavorable conditions over the Sichuan Basin are shown in Figure 4. VE tended to decrease from the northwest region of the basin to the southeast, with the maximum VE exceeding 3,400 m2/s compared to the lowest value of approximately 1,600 m2/s. Figure 5 shows the distribution of Wind_BL and BLH, which are used for the calculation of VE. The BLH and average wind speed in the boundary layer were higher in the northwest portion of the basin, where the elevations are in the range of 500–1,000 m (Figure 1). The sloped terrain in the northwest area of the basin may increase absorption of solar radiation (Wang and Wang, 2015), enhancing the development of the daytime convective boundary layer and the downward transport of upper momentum, which leads to higher BLH and Wind_BL. In addition, the northwestern region of the basin is also a principal track of northwestern cold air to the basin, and the airflow over the northern mountain brings cold air and heavy wind to the northwestern basin. Deeper in the basin, where the elevation is lower than 500 m, both BLH and average wind speed declined by approximately 40% compared to the northwest region due to the blocking of terrain and the effect of valleys. The almost synchronous spatial variations in BLH and Wind_BL contributed to the evident regional difference in VE in the basin.
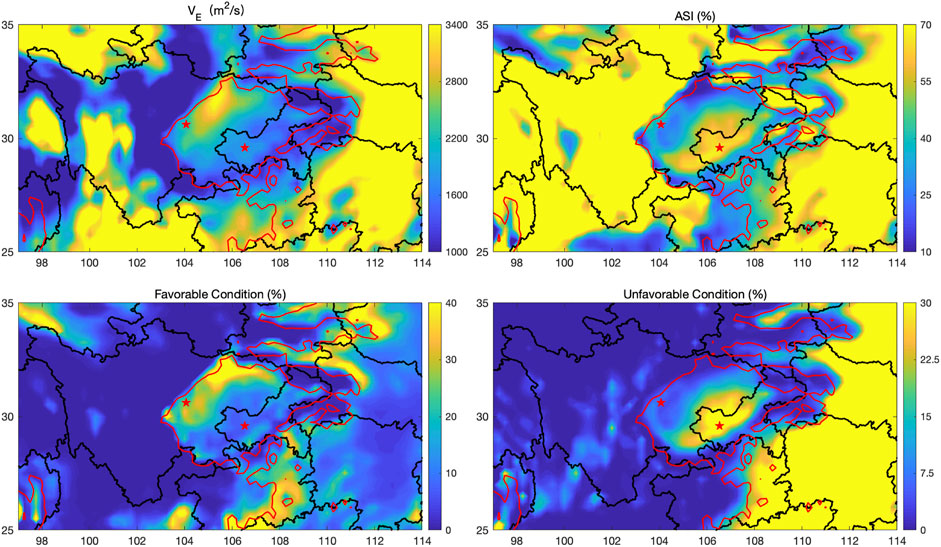
FIGURE 4. Distributions of ventilation coefficient (VE), frequency of air stagnation index (ASI), favorable condition and unfavorable condition during the winters from 1979 to 2019 in Sichuan Basin. Two red pentagrams indicate the locations of Chengdu and Chongqing.
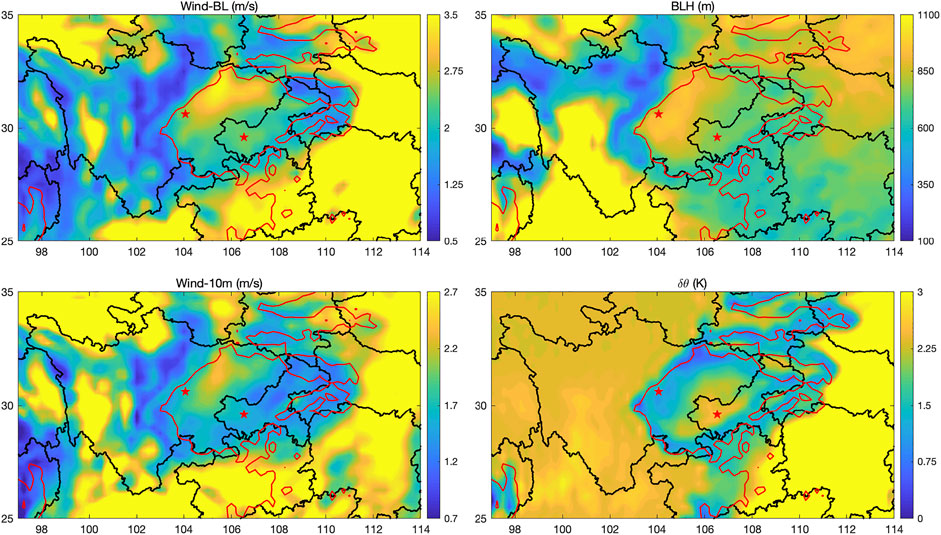
FIGURE 5. Distributions of boundary layer wind speed (Wind_BL), boundary layer height (BLH), 10-m wind speed (Wind_10) and potential temperature difference between 925 hPa and 850 hPa (
As a metric combining the atmospheric horizontal and vertical diffusion conditions and wet deposition effect, the frequency of ASI can be used to measure the local atmospheric diffusion capacity more comprehensively. Figure 4 shows an almost opposite spatial distribution of ASI to VE over the basin, with an increasing tendency from the northwest to the southeast region. The spatial distribution pattern of ASI frequency climatology over the basin agrees well with the previous work (Liao et al., 2018). The wintertime ASI frequency was lower than 20% in the northwestern part of the basin, while it increased to over 60% in the southeastern low-altitude region. The spatial correlation coefficient between ASI frequency and elevation was -0.44 over the basin region, indicating that more frequent air stagnation events occurred in the low-altitude region. According to the climatology of the surface wind speed (Wind_10) and potential temperature difference between 925 hPa and 850 hPa
A day can be defined as an air-stagnation day or a no-air-stagnation day, based on the threshold of
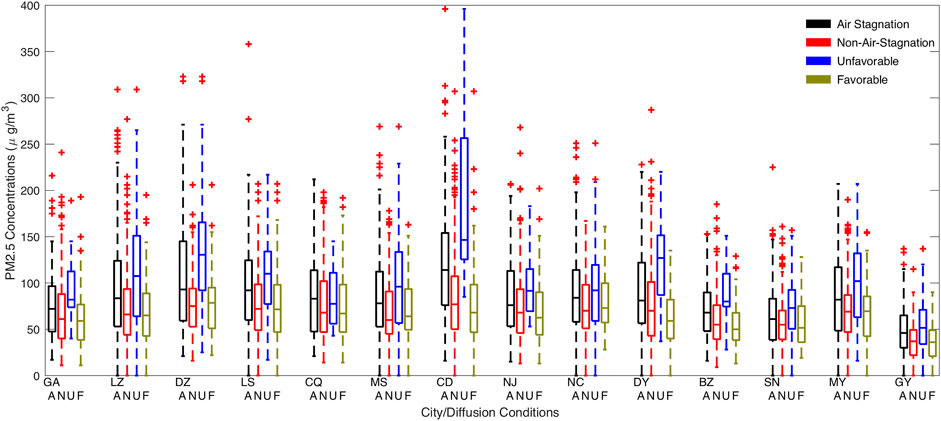
FIGURE 6. Box plot of daily mean PM2.5 concentrations according to different metrics of atmospheric diffusion conditions in the specific cities. Abbreviations of the 14 cities are the same as in Figure 1. Labels of A/N/U/F in the X-axis indicate air stagnation, no-air-stagnation days, and unfavorable and favorable conditions, respectively.
The emission of air pollutants and their precursors is the initial cause of air pollution episodes, but the daily fluctuations and evolution of air quality are exacerbated by unfavorable meteorological conditions, which can be measured based on atmospheric diffusion conditions. Air pollutant emissions are thought to have increased due to anthropogenic activities in recent decades, which is the main reason for the worsening of ambient air quality. However, it remains unclear how the recent atmospheric diffusion conditions changed and what the effect of atmospheric condition variation on the air quality is. Figure 7 shows the patterns of variation in wintertime atmospheric diffusion conditions in the basin during the period of 1979–2019. The linear trends of VE, ASI frequency, and favorable and unfavorable condition frequencies indicate the variation in atmospheric diffusion conditions. In general, VE showed a broadly increasing trend in the Sichuan Basin from 1979 to 2019, with a higher positive tendency in the western region and a weak negative trend in the eastern part. The VE in Chengdu and Chongqing cities showed an almost identical weakly positive tendency of approximately 20 m2/(s decade). Although the linear trend was insignificant, the consistent increase in VE in the basin represents an improvement in atmospheric diffusion conditions in recent decades, which may alleviate to a certain extent the increase in anthropogenic emissions. The temporal variation of the two factors affecting VE are shown in Figure 8. The wind speed in the boundary layer reveals a decreasing trend in the basin, with a significant negative trend in the eastern part, where the Wind_BL was lower than that in the northwestern region. That is, the already weak horizontal diffusion conditions decreased further. However, in the vertical direction, a significant increase in BLH occurred over most regions of the basin, which in part counteracts the effects of the decreasing Wind_BL and resulted in an overall increase in VE.
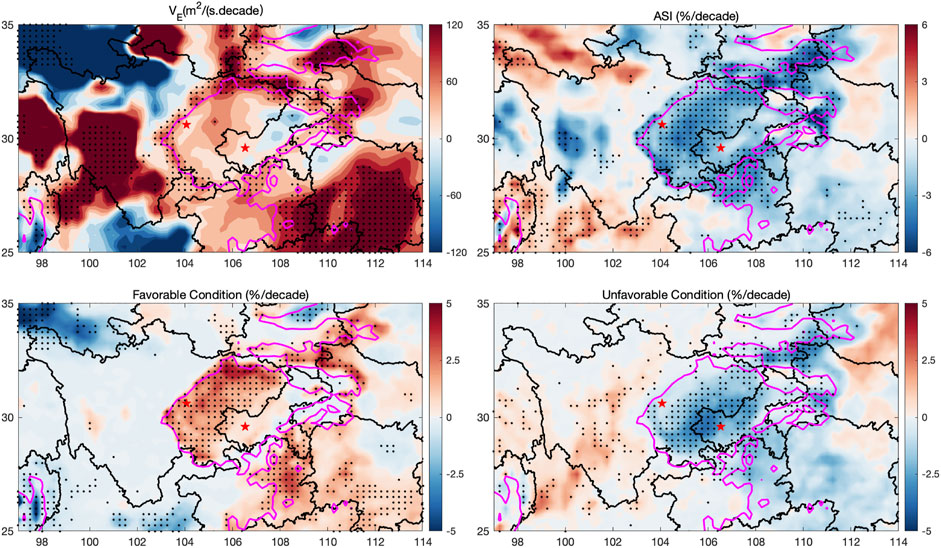
FIGURE 7. Distribution of the long-term trends of VE, ASI, and favorable and unfavorable condition frequencies during the winters from 1979 to 2019 in the Sichuan Basin. Dots mark the significance at 5% of the linear trends based on least square method.
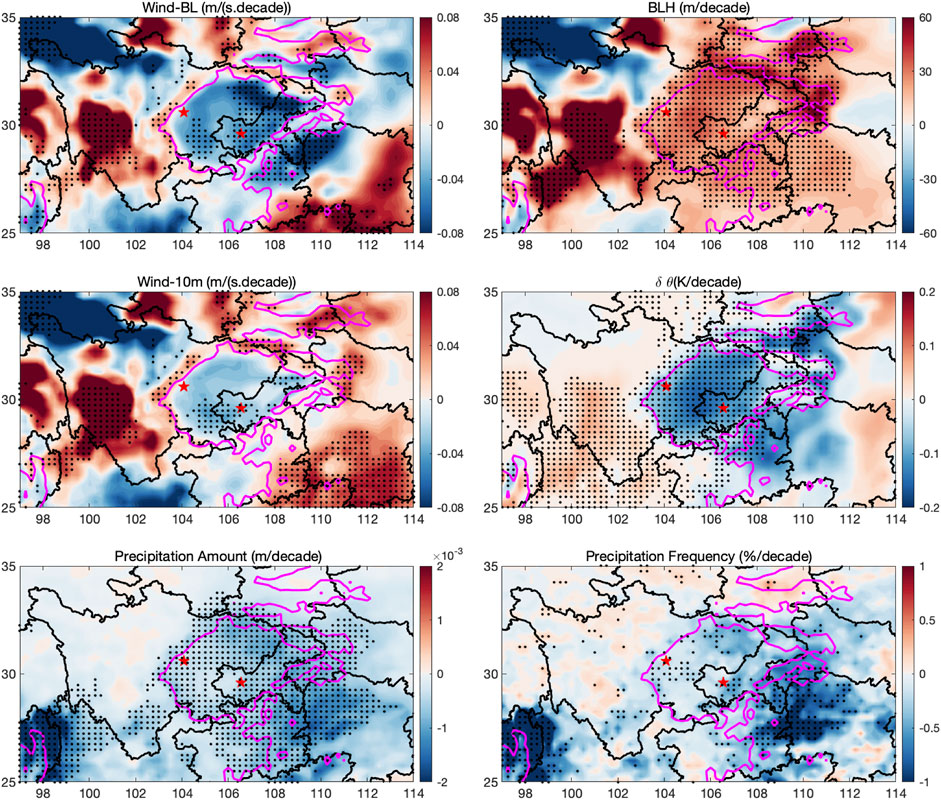
FIGURE 8. Distribution of the long-term trends of Wind_BL, BLH, Wind_10 m,
Measuring the variation in diffusion conditions from another view, Figure 7 also shows the pattern for the ASI frequency. Contrary to the increasing VE tendency, the wintertime occurrence of air stagnation events exhibited a decreasing trend of ∼3–6%/decade in the basin. The negative tendency of the ASI frequency was more significant over the western part of the basin than in the eastern region, which is similar to the pattern for VE. A lower frequency of ASI also implies better atmospheric diffusion conditions. The variation in surface wind speed was not significant in the basin as shown in Figure 8. For wet deposition, precipitation frequency is considered as the main factor based on the definition of ASI. The variation in precipitation frequency was weak and insignificant, although the wintertime precipitation amount showed a significant decreasing trend during the study period. Therefore, the impact of horizonal diffusion conditions and wet deposition on ASI variation can be neglected, and the decreasing trend in ASI frequency was driven by the negative tendency of
The variation in frequencies of favorable and unfavorable conditions is also illustrated in Figure 7. Figure 7 shows a large area of increasing frequency of favorable conditions in the basin, which indicates the improvement in atmospheric diffusion conditions. The occurrence of favorable conditions increased significantly by 4–5%/decade over the western part of the basin, but the tendency was not significant in the eastern region. The spatial distribution of variation in frequency of favorable conditions was consistent with that for VE. The higher the VE and favorable condition frequency, the better the diffusion conditions. Both VE and favorable condition frequency indicated remarkable improvement in diffusion conditions over the western area of the basin, where the atmospheric diffusion conditions were better than in other regions. For unfavorable conditions, which are highly likely to exacerbate severe air pollution, the frequency showed a significant falling trend from 1979 to 2019 over the southeast low-altitude region. Although the increasing tendency of favorable condition frequency was not remarkable over the southeast low-altitude region, the significant decrease in the occurrence of unfavorable conditions marks an improvement in the local atmospheric diffusion conditions. Overall, a higher frequency of favorable diffusion conditions occurred over the western better-diffusion region, and a lower frequency of unfavorable diffusion conditions took place over the eastern worse-diffusion region; both processes noticeably enhanced the atmospheric diffusion ability.
If the air pollutant emissions are identical for all cities, the differences in ambient air pollutant concentrations are almost determined by atmospheric diffusion conditions; i.e., better diffusion ability corresponds to low air pollutant concentrations, and vice versa. Figure 9 shows the winter average PM2.5 concentrations varying with atmospheric diffusion conditions in the 14 cities within the basin. The cities are presented in ascending order of average VE, with the lowest VE in Guang’an (GA) and the highest value in Guangyuan (GY). Similar to the spatial distribution in Figure 4, Figure 9 shows decreasing trends of ASI and unfavorable condition frequencies with increasing in VE. Generally, average winter PM2.5 concentrations decline with increasing local atmospheric diffusion conditions. Guangyuan has the best air quality due to its excellent atmospheric diffusion ability. However, the atmospheric diffusion conditions are moderate in Chengdu (CD), which is the capital of Sichuan Province, and its air pollution is the most serious among the 14 cities. Located in the northwestern part of the basin, Mianyang (MY) has the second highest VE, but its air quality is worse than in the other cities with approximately the same level of VE. Chengdu and Mianyang are the top two cities in terms of GDP volume in Sichuan Province, which implies higher anthropogenic emission levels than other cities.
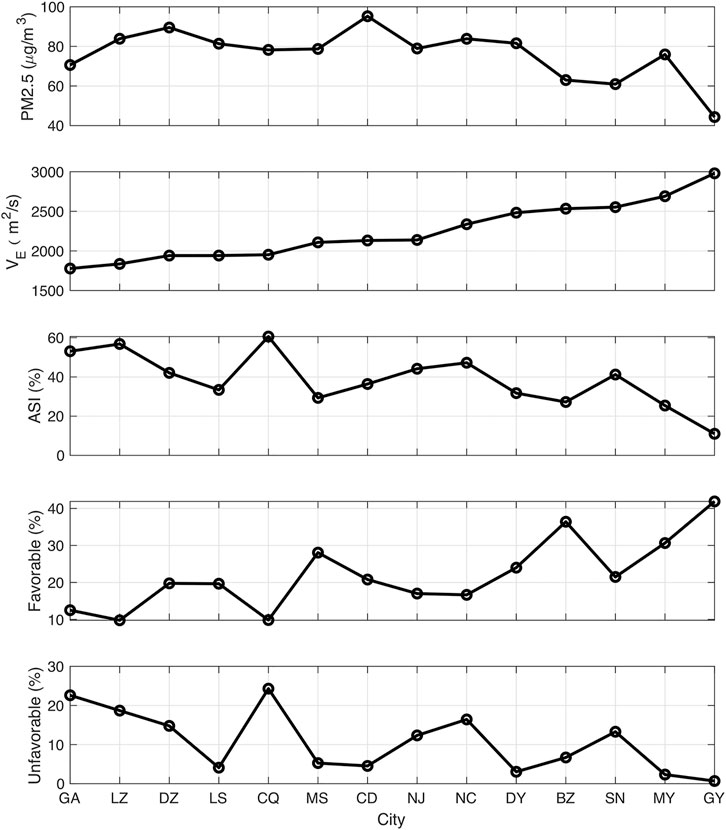
FIGURE 9. Variation of winter average PM2.5 concentrations with VE, frequency of ASI, and favorable and unfavorable conditions in the 14 cities in the basin. All the variables are the average values during the winters from 2013 to 2019. Cities are ranked by the value of VE.
The multiyear average PM2.5 concentration showed a close relationship with atmospheric diffusion ability (Figure 9). Taking Chengdu and Chongqing as examples, Figure 10 shows that the interannual air quality changed with diffusion conditions. Monthly PM2.5 concentrations exhibited a significant decreasing trend in Chengdu and Chongqing from the winter of 2013–2019, with negative tendencies of −11.34 and −8.93 μg/(m3. yr). Based on the national air quality standard in China, daily mean PM2.5 concentrations lower than 35 μg/m3 are good air quality days. Figure 10 also shows the monthly occurrence of good air quality in the two cities from 2013 to 2019, showing significant increases of 2.12 and 2.87%/yr. The remarkable decrease in PM2.5 concentration and increase in the frequency of good air quality represent the success of emission reduction policies in recent years. The industrial and residential emissions of SO2 in Sichuan Province and Chongqing municipality decreased from 1.29*106 to 8.4*105 tons from 2011 to 2017, which contributed to the significant decrease in regional PM2.5 concentrations (National Bureau of Statistics of China, 2020). To exclude the effects of emission reduction on air quality, the detrending time series of PM2.5 concentration and frequency of good air quality were used to investigate the influence of atmospheric diffusion conditions on the interannual variation in air quality. There were significant correlations between the occurrence of good air quality and VE/ASI/favorable conditions in the two cities, with correlation coefficients of 0.71/−0.5/0.6 and 0.47/−0.58/0.45 in Chengdu and Chongqing, respectively. In addition, the PM2.5 concentration was significantly negatively correlated with VE and favorable condition frequency in Chengdu. Moreover, Table 1 summarizes the correlation coefficients between the metrics indicating atmospheric diffusion conditions and the series of “moderate,” “unhealthy for sensitive groups to unhealthy,” “very unhealthy to hazardous” air quality in Chengdu and Chongqing. Only the occurrence of good or very unhealthy to hazardous air quality was closely associated with atmospheric diffusion. The frequencies of occurrence of moderate to unhealthy air quality were insensitive to variations in ambient atmospheric conditions.
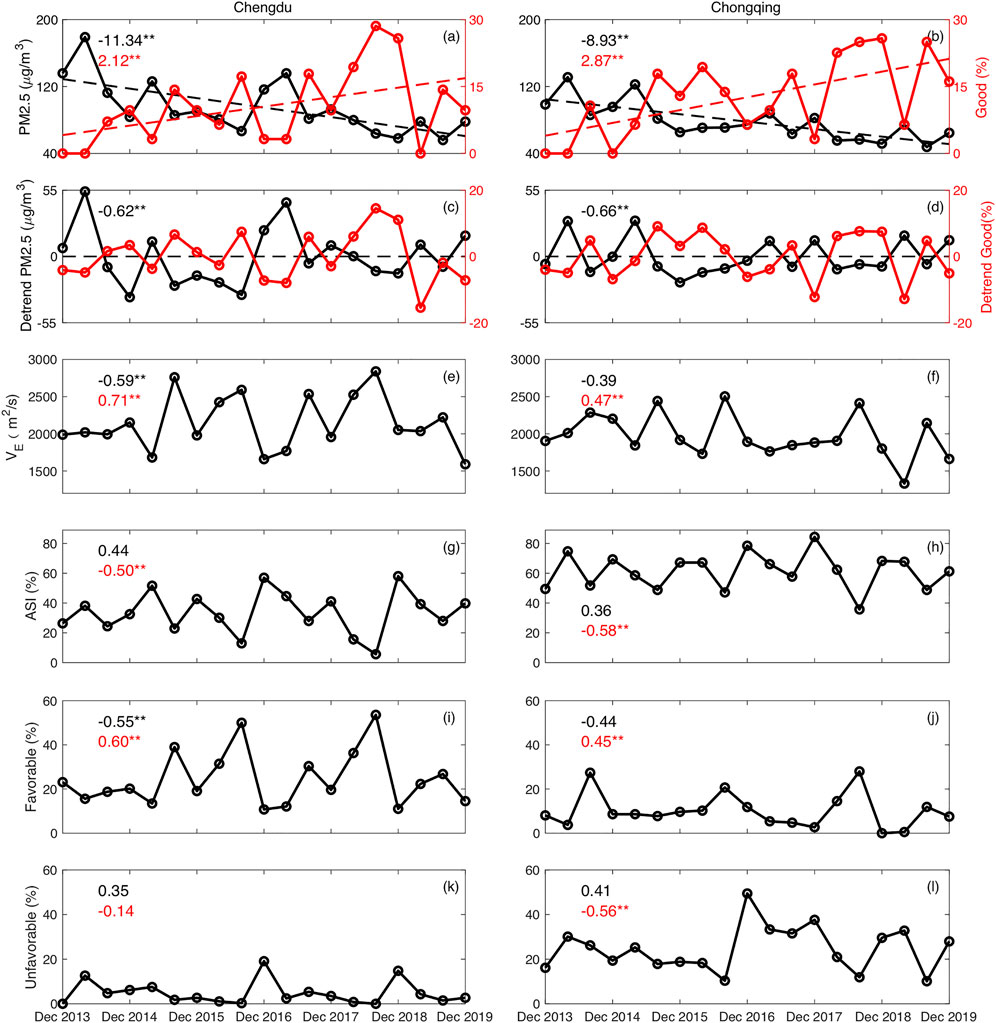
FIGURE 10. Variation in monthly PM2.5 concentrations and good air quality frequency (A–B), detrending PM2.5 concentrations and good air quality frequency (C–D), VE (E–F), frequencies of ASI (G–H), favorable (I–J) and unfavorable (K–L) conditions during the winters from 2013 to 2019 (19 months in total) in Chengdu and Chongqing. Detrending series were calculated by subtracting the linear trend from the original series. Values in Figs (A–B) are the linear trend of PM2.5 concentration (black) and good air quality (red). ** indicates significance at 0.01 of the linear trends based on least square method. Values in Figs (C–D) indicate the correlation coefficient of detrended PM2.5 concentrations and good air quality frequency. ** indicates that the correlation coefficient is significant at the 0.01 probability level. Values in Figs. (E–L) indicate the correlation coefficients between the detrended PM2.5 concentrations (black) and good air quality frequency (red) with the specific metric of atmospheric diffusion conditions. ** indicates that the correlation coefficient is significant at the 0.01 probability level.
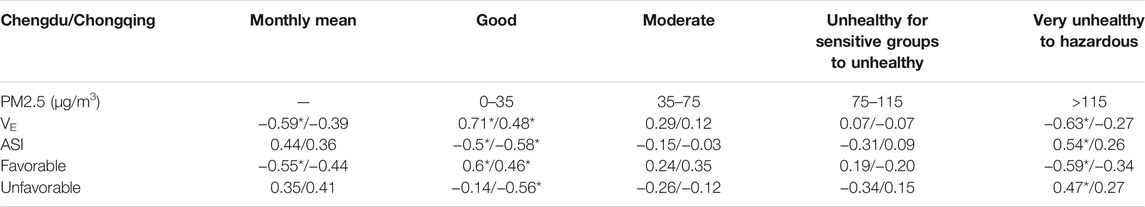
TABLE 1. Correlation coefficients between the detrend PM2.5 concentrations and the frequencies of different air quality levels with the specific metric indicating atmospheric diffusion conditions during the winter of 2013–2019 in Chengdu and Chongqing (* indicates that the correlation coefficient is significant at the 0.01 probability level).
Atmospheric diffusion controls the day-to-day evolution of air pollution episodes, the long-term variation of which has important significance for the quantitative evaluation of historical emission reduction effects or the development of emission reduction measures. The spatial and temporal distributions of wintertime atmospheric diffusion conditions in the Sichuan Basin are examined in this work. The thresholds for occurrence of air stagnation events are established based on the relationship between PM2.5 concentrations and surface wind speed and potential temperature differences at 925 hPa and 800 hPa. VE and the frequency of air stagnation events were incorporated to evaluate the variation in atmospheric diffusion conditions and their effects on air quality in the Sichuan Basin. Both atmospheric horizontal and vertical diffusion conditions are contained in the definitions of VE and air stagnation events. Wind_BL/BLH/Wind_10/
Given the long-term variations in winter atmospheric diffusion conditions, VE showed a broadly increasing trend from 1979 to 2019, with a distinct increase in the western region and a weak negative trend in the eastern basin. The significant increase in BLH explained the positive tendency of VE over most of the basin, and the remarkable decrease in Wind_BL drove the negative tendency of VE in the eastern basin. In contrast, the occurrence of air stagnation events showed a decreasing trend of ∼3–6%/decade in the basin, which was more significant over the western part of the basin than over the eastern region. The decreasing pattern of ASI frequency was driven by the negative tendency of
Seasonal PM2.5 concentrations declined with increasing local atmospheric diffusion conditions, with the best air quality in the northwest city of Guangyuan. Air quality in Chengdu and Mianyang were worse than in other cities with the same level of atmospheric diffusion conditions, perhaps because of their higher anthropogenic emission levels. The atmospheric diffusion conditions showed significant correlations with the occurrence of “good” and “very unhealthy to hazardous” air quality, and the occurrence frequencies of “moderate” to “unhealthy” air quality were insensitive to the variation in ambient atmospheric conditions. Atmospheric diffusion conditions were able to explain approximately 25–50% of the interannual variation in PM2.5 concentrations in Chengdu.
Long-term variation of daytime BLH have been investigated in many other studies, which shows remarkable increase trend over the past decades (Guo et al., 2016; Wang and Wang, 2016). The variation in wind speed, low tropospheric stability, surface temperature and cloud cover are considered as the dominant factors for the increase of BLH (Li et al., 2021; Guo et al., 2021). Considering the severe air pollution in the winter and poor performance of the stable BLH simulation, spatial and temporal variations in wintertime atmospheric diffusion conditions at 14:00 LST were investigated in this study. However, there were remarkable seasonal and diurnal differences in the processes in the atmospheric boundary layer (Stull, 2012; Wang and Wang, 2016), which may affect the variation in atmospheric diffusion conditions and warrant future studies.
The original contributions presented in the study are included in the article/Supplementary Material, further inquiries can be directed to the corresponding author.
GW and BC designed and conducted the research and analysis. WL and SJ collected data and contributed to the definition of air stagnation. GW, SJ and BC worked together on the interpretation of results and wrote the paper.
This study was funded by the National Natural Science Foundation of China (41975075, 42075058 and 41805117) and Shanghai International Science and Technology Partnership Project (No. 21230780200).
The authors declare that the research was conducted in the absence of any commercial or financial relationships that could be construed as a potential conflict of interest.
All claims expressed in this article are solely those of the authors and do not necessarily represent those of their affiliated organizations, or those of the publisher, the editors and the reviewers. Any product that may be evaluated in this article, or claim that may be made by its manufacturer, is not guaranteed or endorsed by the publisher.
Hourly PM2.5 real-time data in China were downloaded from the website of Ministry of Ecology and Environment of the People’s Republic of China (http://106.37.208.233:20035). The fifth generation European Centre for Medium-Range Weather Forecasts atmospheric reanalysis data (ECMWF ERA5) at 97–114°E and 25–35°N with a horizontal resolution of 0.25°* 0.25° from 1979 to 2019 are downloaded from https://www.ecmwf.int/en/forecasts/datasets/reanalysis-datasets/era5.
The Supplementary Material for this article can be found online at: https://www.frontiersin.org/articles/10.3389/fenvs.2021.763504/full#supplementary-material
Bi, J., Huang, J., Holben, B., and Zhang, G. (2016). Comparison of Key Absorption and Optical Properties between Pure and Transported Anthropogenic Dust over East and Central Asia. Atmos. Chem. Phys. 16 (24), 15501–15516. doi:10.5194/acp-16-15501-2016
Cai, W., Li, K., Liao, H., Wang, H., and Wu, L. (2017). Weather Conditions Conducive to Beijing Severe Haze More Frequent under Climate Change. Nat. Clim Change 7 (4), 257–262. doi:10.1038/nclimate3249
Cao, B., Wang, X., Ning, G., Yuan, L., Jiang, M., Zhang, X., et al. (2020). Factors Influencing the Boundary Layer Height and Their Relationship with Air Quality in the Sichuan Basin, China. Sci. Total Environ. 727, 138584. doi:10.1016/j.scitotenv.2020.138584
Chang, L., Wu, Z., and Xu, J. (2020). Potential Impacts of the Southern Hemisphere Polar Vortices on central-eastern China Haze Pollution during Boreal Early winter. Clim. Dyn. 55 (3), 771–787. doi:10.1007/s00382-020-05294-3
Che, H., Xia, X., Zhao, H., Dubovik, O., Holben, B. N., Goloub, P., et al. (2019). Spatial Distribution of Aerosol Microphysical and Optical Properties and Direct Radiative Effect from the China Aerosol Remote Sensing Network. Atmos. Chem. Phys. 19 (18), 11843–11864. doi:10.5194/acp-19-11843-2019
Chen, H., and Wang, H. (2015). Haze Days in North China and the Associated Atmospheric Circulations Based on Daily Visibility Data from 1960 to 2012. J. Geophys. Res. Atmos. 120 (12), 5895–5909. doi:10.1002/2015jd023225
Chen, H., Wang, H., Sun, J., Xu, Y., and Yin, Z. (2019a). Anthropogenic fine Particulate Matter Pollution Will Be Exacerbated in Eastern China Due to 21st century GHG Warming. Atmos. Chem. Phys. 19 (1), 233–243. doi:10.5194/acp-19-233-2019
Chen, J., Li, Z., Lv, M., Wang, Y., Wang, W., Zhang, Y., et al. (2018). Aerosol Hygroscopic Growth, Contributing Factors and Impact On Haze Events in a Severely Polluted Region in Northern China. Atmos. Chem. Phys 19 (2), 1327–1342. doi:10.5194/acp-19-1327-2019
Chen, S., Zhang, X., Lin, J., Huang, J., Zhao, D., Yuan, T., et al. (2019b). Fugitive Road Dust PM2.5 Emissions and Their Potential Health Impacts. Environ. Sci. Technol. 53 (14), 8455–8465. doi:10.1021/acs.est.9b00666
Chen, Z., Chen, D., Zhao, C., Kwan, M.-p., Cai, J., Zhuang, Y., et al. (2020). Influence of Meteorological Conditions on PM2.5 Concentrations across China: A Review of Methodology and Mechanism. Environ. Int. 139, 105558. doi:10.1016/j.envint.2020.105558
Dang, R., and Liao, H. (2019). Severe winter Haze Days in the Beijing-Tianjin-Hebei Region from 1985 to 2017 and the Roles of Anthropogenic Emissions and Meteorology. Atmos. Chem. Phys. 19 (16), 10801–10816. doi:10.5194/acp-19-10801-2019
Ding, A., Huang, X., Nie, W., Chi, X., Xu, Z., Zheng, L., et al. (2019). Significant Reduction of PM2.5 in Eastern China Due to Regional-Scale Emission Control: Evidence from SORPES in 2011-2018. Atmos. Chem. Phys. 19 (18), 11791–11801. doi:10.5194/acp-19-11791-2019
Fan, H., Zhao, C., and Yang, Y. (2020). A Comprehensive Analysis of the Spatio-Temporal Variation of Urban Air Pollution in China during 2014-2018. Atmos. Environ. 220, 117066. doi:10.1016/j.atmosenv.2019.117066
Fan, J., Rosenfeld, D., Yang, Y., Zhao, C., Leung, L. R., and Li, Z. (2015). Substantial Contribution of Anthropogenic Air Pollution to Catastrophic Floods in Southwest China. Geophys. Res. Lett. 42 (14), 6066–6075. doi:10.1002/2015gl064479
Feng, F., and Wang, K. (2019). Determining Factors of Monthly to Decadal Variability in Surface Solar Radiation in China: Evidences from Current Reanalyses. J. Geophys. Res. Atmos. 124 (16), 9161–9182. doi:10.1029/2018jd030214
Gui, K., Che, H., Wang, Y., Wang, H., Zhang, L., Zhao, H., et al. (2019). Satellite-derived PM2.5 Concentration Trends over Eastern China from 1998 to 2016: Relationships to Emissions and Meteorological Parameters. Environ. Pollut. 247, 1125–1133. doi:10.1016/j.envpol.2019.01.056
Guo, J., Miao, Y., Zhang, Y., Liu, H., Li, Z., Zhang, W., et al. (2016). The Climatology of Planetary Boundary Layer Height in China Derived from Radiosonde and Reanalysis Data. Atmos. Chem. Phys. 16 (20), 13309–13319. doi:10.5194/acp-16-13309-2016
Guo, J., Xu, H., Liu, L., Chen, D., Peng, Y., Yim, S. H. L., et al. (2019). The Trend Reversal of Dust Aerosol over East Asia and the North Pacific Ocean Attributed to Large-Scale Meteorology, Deposition, and Soil Moisture. J. Geophys. Res. Atmos. 124 (19), 10450–10466. doi:10.1029/2019jd030654
Guo, J., Zhang, J., Yang, K., Liao, H., Zhang, S., Huang, K., et al. (2021). Investigation of Near-Global Daytime Boundary Layer Height Using High-Resolution Radiosondes: First Results and Comparison with ERA-5, MERRA-2, JRA-55, and NCEP-2 Reanalyses. Atmos. Chem. Phys. Discuss. [in review]. doi:10.5194/acp-2021-257
He, J., Lu, S., Yu, Y., Gong, S., Zhao, S., and Zhou, C. (2018a). Numerical Simulation Study of winter Pollutant Transport Characteristics over Lanzhou City, Northwest China. Atmosphere 9 (10), 382. doi:10.3390/atmos9100382
He, Y., Wang, K., Zhou, C., and Wild, M. (2018b). A Revisit of Global Dimming and Brightening Based on the sunshine Duration. Geophys. Res. Lett. 45 (9), 4281–4289. doi:10.1029/2018gl077424
Hu, Z., Huang, J., Zhao, C., Ma, Y., Jin, Q., Qian, Y., et al. (2019). Trans-Pacific Transport and Evolution of Aerosols: Spatiotemporal Characteristics and Source Contributions. Atmos. Chem. Phys. 19, 12709–12730. doi:10.5194/acp-19-12709-2019
Hu, Z., Jin, Q., Ma, Y., Pu, B., Ji, Z., Wang, Y., et al. (2021). Temporal Evolution of Aerosols and Their Extreme Events in Polluted Asian Regions during Terra's 20-year Observations. Remote Sensing Environ. 263, 112541. doi:10.1016/j.rse.2021.112541
Huang, X., Wang, Z., and Ding, A. (2018). Impact of Aerosol-PBL Interaction on Haze Pollution: Multiyear Observational Evidences in North China. Geophys. Res. Lett. 45 (16), 8596–8603. doi:10.1029/2018gl079239
Jian, B., Li, J., Wang, G., He, Y., Han, Y., Zhang, M., et al. (2018). The Impacts of Atmospheric and Surface Parameters on Long-Term Variations in the Planetary Albedo. J. Clim. 31 (21), 8705–8718. doi:10.1175/jcli-d-17-0848.1
Li, J., Liao, H., Hu, J., and Li, N. (2019). Severe Particulate Pollution Days in China during 2013-2018 and the Associated Typical Weather Patterns in Beijing-Tianjin-Hebei and the Yangtze River Delta Regions. Environ. Pollut. 248, 74–81. doi:10.1016/j.envpol.2019.01.124
Li, Q., Zhang, R., and Wang, Y. (2016). Interannual Variation of the Wintertime Fog-Haze Days across central and Eastern China and its Relation with East Asian winter Monsoon. Int. J. Climatol. 36 (1), 346–354. doi:10.1002/joc.4350
Li, Y., Li, J., Zhao, Y., Lei, M., Zhao, Y., Jian, B., et al. (2021). Long-term Variation of Boundary Layer Height and Possible Contribution Factors: A Global Analysis. Sci. Total Environ. 796, 148950. doi:10.1016/j.scitotenv.2021.148950
Liao, T., Gui, K., Jiang, W., Wang, S., Wang, B., Zeng, Z., et al. (2018). Air Stagnation and its Impact on Air Quality during winter in Sichuan and Chongqing, Southwestern China. Sci. Total Environ. 635, 576–585. doi:10.1016/j.scitotenv.2018.04.122
Liu, Y., Tang, G., Huang, X., Wei, K., Wu, S., Wang, M., et al. (2021). Unexpected Deep Mixing Layer in the Sichuan Basin, China. Atmos. Res. 249, 105300. doi:10.1016/j.atmosres.2020.105300
Liu, Y., Tang, G., Zhou, L., Hu, B., Liu, B., Li, Y., et al. (2019). Mixing Layer Transport Flux of Particulate Matter in Beijing, China. Atmos. Chem. Phys. 19 (14), 9531–9540. doi:10.5194/acp-19-9531-2019
Lu, C., Deng, Q.-h., Liu, W.-w., Huang, B.-l., and Shi, L.-z. (2012). Characteristics of Ventilation Coefficient and its Impact on Urban Air Pollution. J. Cent. South. Univ. Technol. 19 (3), 615–622. doi:10.1007/s11771-012-1047-9
Ma, Y., Ye, J., Xin, J., Zhang, W., Vilà-Guerau de Arellano, J., Wang, S., et al. (2020). The Stove, Dome, and Umbrella Effects of Atmospheric Aerosol on the Development of the Planetary Boundary Layer in Hazy Regions. Geophys. Res. Lett. 47 (13). doi:10.1029/2020gl087373
Miao, Y., Guo, J., Liu, S., Liu, H., Li, Z., Zhang, W., et al. (2017). Classification of Summertime Synoptic Patterns in Beijing and Their Associations with Boundary Layer Structure Affecting Aerosol Pollution. Atmos. Chem. Phys. 17 (4), 3097–3110. doi:10.5194/acp-17-3097-2017
Mu, M., and Zhang, R. (2014). Addressing the Issue of Fog and Haze: A Promising Perspective from Meteorological Science and Technology. Sci. China Earth Sci. 57, 1–2. doi:10.1007/s11430-013-4791-2
National Bureau of Statistics of China (2020). https://data.stats.gov.cn/easyquery.htm?cn=C01. Accessed November 3, 2021.
Ning, G., Wang, S., Ma, M., Ni, C., Shang, Z., Wang, J., et al. (2018). Characteristics of Air Pollution in Different Zones of Sichuan Basin, China. Sci. Total Environ. 612, 975–984. doi:10.1016/j.scitotenv.2017.08.205
Ning, G., Yim, S. H. L., Wang, S., Duan, B., Nie, C., Yang, X., et al. (2019). Synergistic Effects of Synoptic Weather Patterns and Topography on Air Quality: a Case of the Sichuan Basin of China. Clim. Dyn. 53 (11), 6729–6744. doi:10.1007/s00382-019-04954-3
Stull, R. B. (2012). An Introduction to Boundary Layer Meteorology. Dordrecht: Springer Science & Business Media.
Sujatha, P., Mahalakshmi, D. V., Ramiz, A., Rao, P. V. N., and Naidu, C. V. (2016). Ventilation Coefficient and Boundary Layer Height Impact on Urban Air Quality. Cogent Environ. Sci. 2 (1), 1125284. doi:10.1080/23311843.2015.1125284
Sun, Y. L., Wang, Z. F., Fu, P. Q., Yang, T., Jiang, Q., Dong, H. B., et al. (2013). Aerosol Composition, Sources and Processes during Wintertime in Beijing, China. Atmos. Chem. Phys. 13 (9), 4577–4592. doi:10.5194/acp-13-4577-2013
Tang, G., Zhu, X., Hu, B., Xin, J., Wang, L., Münkel, C., et al. (2015). Impact of Emission Controls on Air Quality in Beijing during APEC 2014: Lidar Ceilometer Observations. Atmos. Chem. Phys. 15 (21), 12667–12680. doi:10.5194/acp-15-12667-2015
Wang, K., Dickinson, R. E., and Liang, S. (2009). Clear Sky Visibility Has Decreased over Land Globally from 1973 to 2007. Science 323 (5920), 1468–1470. doi:10.1126/science.1167549
Wang, L., and Wang, K. (2015). Impacts of DEM Uncertainty on Estimated Surface Solar Radiation and Extracted River Network. Bull. Am. Meteorol. Soc. 96 (2), 297–304. doi:10.1175/bams-d-13-00285.1
Wang, X., Dickinson, R. E., Su, L., Zhou, C., and Wang, K. (2018a). PM2.5 Pollution in China and How it Has Been Exacerbated by Terrain and Meteorological Conditions. Bull. Am. Meteorol. Soc. 99 (1), 105–119. doi:10.1175/bams-d-16-0301.1
Wang, X., and Wang, K. (2016). Homogenized Variability of Radiosonde-Derived Atmospheric Boundary Layer Height over the Global Land Surface from 1973 to 2014. J. Clim. 29 (19), 6893–6908. doi:10.1175/jcli-d-15-0766.1
Wang, X., Wang, K., and Su, L. (2016). Contribution of Atmospheric Diffusion Conditions to the Recent Improvement in Air Quality in China. Sci. Rep. 6, 36404. doi:10.1038/srep36404
Wang, X., Wen, H., Shi, J., Bi, J., Huang, Z., Zhang, B., et al. (2018b). Optical and Microphysical Properties of Natural mineral Dust and Anthropogenic Soil Dust Near Dust Source Regions over Northwestern China. Atmos. Chem. Phys. 18 (3), 2119–2138. doi:10.5194/acp-18-2119-2018
Wang, X., and Zhang, R. (2020a). Effects of Atmospheric Circulations on the Interannual Variation in PM2.5 Concentrations over the Beijing-Tianjin-Hebei Region in 2013-2018. Atmos. Chem. Phys. 20 (13), 7667–7682. doi:10.5194/acp-20-7667-2020
Wang, X., and Zhang, R. (2020b). How Did Air Pollution Change during the COVID-19 Outbreak in China. Bull. Am. Meteorol. Soc. 101 (10), E1645–E1652. doi:10.1175/bams-d-20-0102.1
Wang, Y., Meng, Z., Lyu, R., Huang, G., He, Q., and Cheng, T. (2020). Spatiotemporal Changes of Surface Solar Radiation: Implication for Air Pollution and rice Yield in East China. Sci. Total Environ. 739, 140361. doi:10.1016/j.scitotenv.2020.140361
Xia, X., Che, H., Shi, H., Chen, H., Zhang, X., Wang, P., et al. (2020). Advances in Sunphotometer-Measured Aerosol Optical Properties and Related Topics in China: Impetus and Perspectives. Atmos. Res. 249, 105286. doi:10.1016/j.atmosres.2020.105286
Yin, Z., Wang, H., and Chen, H. (2017). Understanding Severe winter Haze Events in the North China Plain in 2014: Roles of Climate Anomalies. Atmos. Chem. Phys. 17 (3), 1641–1651. doi:10.5194/acp-17-1641-2017
Zhang, L., Guo, X., Zhao, T., Gong, S., Xu, X., Li, Y., et al. (2019). A Modelling Study of the Terrain Effects on Haze Pollution in the Sichuan Basin. Atmos. Environ. 196, 77–85. doi:10.1016/j.atmosenv.2018.10.007
Zhang, Q., and Geng, G. (2019). Impact of Clean Air Action on PM2.5 Pollution in China. Sci. China Earth Sci. 62, 1845–1846. doi:10.1007/s11430-019-9531-4
Zhang, R., Li, Q., and Zhang, R. (2014). Meteorological Conditions for the Persistent Severe Fog and Haze Event over Eastern China in January 2013. Sci. China Earth Sci. 57 (1), 26–35. doi:10.1007/s11430-013-4774-3
Zhang, R. (2017). Warming Boosts Air Pollution. Nat. Clim Change 7 (4), 238–239. doi:10.1038/nclimate3257
Zhao, C., and Garrett, T. J. (2015). Effects of Arctic Haze on Surface Cloud Radiative Forcing. Geophys. Res. Lett. 42 (2), 557–564. doi:10.1002/2014gl062015
Zhao, C., Li, Y., Zhang, F., Sun, Y., and Wang, P. (2018a). Growth Rates of fine Aerosol Particles at a Site Near Beijing in June 2013. Adv. Atmos. Sci. 35 (2), 209–217. doi:10.1007/s00376-017-7069-3
Zhao, D., Schmitt, S. H., Wang, M., Acir, I.-H., Tillmann, R., Tan, Z., et al. (2018b). Effects of NOx and SO2 on the Secondary Organic Aerosol Formation from Photooxidation of α-pinene and Limonene. Atmos. Chem. Phys. 18, 1611–1628. doi:10.5194/acp-18-1611-2018
Zhao, H., Che, H., Zhang, L., Gui, K., Ma, Y., Wang, Y., et al. (2020). How Aerosol Transport from the North China plain Contributes to Air Quality in Northeast China. Sci. Total Environ. 738, 139555. doi:10.1016/j.scitotenv.2020.139555
Zhao, S., Yu, Y., Yin, D., Qin, D., He, J., and Dong, L. (2018c). Spatial Patterns and Temporal Variations of Six Criteria Air Pollutants during 2015 to 2017 in the City Clusters of Sichuan Basin, China. Sci. total Environ. 624, 540–557. doi:10.1016/j.scitotenv.2017.12.172
Zhong, J., Zhang, X., Wang, Y., Wang, J., Shen, X., Zhang, H., et al. (2019). The Two-Way Feedback Mechanism between Unfavorable Meteorological Conditions and Cumulative Aerosol Pollution in Various Haze Regions of China. Atmos. Chem. Phys. 19 (5), 3287–3306. doi:10.5194/acp-19-3287-2019
Keywords: atmospheric diffusion ability, ventilation coefficient, atmospheric boundary layer, air pollution, Sichuan Basin
Citation: Wang G, Leng W, Jiang S and Cao B (2021) Long-Term Variation in Wintertime Atmospheric Diffusion Conditions Over the Sichuan Basin. Front. Environ. Sci. 9:763504. doi: 10.3389/fenvs.2021.763504
Received: 24 August 2021; Accepted: 27 October 2021;
Published: 10 November 2021.
Edited by:
Longlei Li, Cornell University, United StatesReviewed by:
Pengfei Tian, Lanzhou University, ChinaCopyright © 2021 Wang, Leng, Jiang and Cao. This is an open-access article distributed under the terms of the Creative Commons Attribution License (CC BY). The use, distribution or reproduction in other forums is permitted, provided the original author(s) and the copyright owner(s) are credited and that the original publication in this journal is cited, in accordance with accepted academic practice. No use, distribution or reproduction is permitted which does not comply with these terms.
*Correspondence: Bangjun Cao, Y2FvYmoxOTg5QDE2My5jb20=
Disclaimer: All claims expressed in this article are solely those of the authors and do not necessarily represent those of their affiliated organizations, or those of the publisher, the editors and the reviewers. Any product that may be evaluated in this article or claim that may be made by its manufacturer is not guaranteed or endorsed by the publisher.
Research integrity at Frontiers
Learn more about the work of our research integrity team to safeguard the quality of each article we publish.