 Xinzhi Wang
 Ying Ma3
- 1College of Pharmacy, Nanjing University of Chinese Medicine, Nanjing, China
- 2Jiangsu Key Laboratory of Research and Development in Marine Bio-Resource Pharmaceutics, Nanjing, China
- 3Department of Medicine, Nanjing University of Science and Technology Hospital, Nanjing, China
Marine clam is one of the main sources of arsenic (As), and the tidal flats of Jiangsu Province are considered major culturing areas for clams in mid-eastern China. In view of increasingly severe pollution in this region, concerns have been raised by the consumers with the safety of clams they purchased or may purchase. To address these concerns, we conducted a multi-year survey to determine the levels of As and As species in five major clam species cultivated in eight production areas of this region. Based on the above analysis data, Bayesian statistics used a Markov Chain Monte Carlo approach was applied to predict the toxic As residue distributions in clams produced in this region and their health risks to Chinese adults. It was found that the bioaccumulation ability of total As (tAs) and inorganic As (iAs) was species-specific, while Mactra veneriformis (MV) had the strongest accumulation capacity for toxic iAs (0.22–2.85 mg/kg dw). Up to 6.7% of the tested MV samples exceeding the iAs limit of China Food and Drug Administration. The content of iAs was also found to be related significantly to the harvest seasons, with clam in the spawning period (June) having the lowest iAs concentrations. The non-carcinogenic and carcinogenic health risk from dietary exposure to iAs associated with MV consumption was rather high, which suggested that specific attention should be paid to the safety of clam consumption in this region.
Introduction
Over the past 10 years, the pollution of the marine environment of China has become increasingly severe, particularly for heavy metal pollution (Wang et al., 2013; Zhang et al., 2013; Bi et al., 2017; Xiao et al., 2017; Cao et al., 2020). More than 20 large rivers and irrigation canals along the coast of mid-eastern China bring terrestrial materials, including heavy metals, into the tidal flats and seas (Cao et al., 2020). In addition, with the rapid development of the coastal economy in Mid-eastern province Jiangsu, the number of industrial enterprises continues to increase. Wastewater containing heavy metals is discharged into rivers and canals and finally into the sea or accumulated in the surface sediments of tidal flats. Therefore, the tidal flats of this area are reportedly one of the most polluted regions along the coast of China (Cao et al., 2020).
Marine clams are filter-feeding organisms, and their living habits and physiological characteristics indicate they are more inclined to accumulate heavy metals from their living environment (Kato et al., 2020). Heavy metal contaminations in marine clams were previously reported in many countries/regions, including Arabian Gulf, Italy, India, etc (Alyahya et al., 2011; Kumar et al., 2021; Tavoloni et al., 2021). As for China, the accumulation of heavy metal in different coastal areas and clam species significantly varied, and As content in some clam samples exceeded the standard limits greatly (Wu et al., 2014; Jia et al., 2018; Cheng et al., 2018; Qiu et al., 2018; Li et al., 2019; Gong et al., 2020; Liu et al., 2020). Coastal tidal flats in Jiangsu province comprise a major culturing area for marine clams, such as Mactra veneriformis (MV), Ruditapes philippinarum (VP), Meretrix meretrix (MM), Cyclina sinensis (CS), Sinonovacula constricta (SC), and others. According to the Fisheries Yearbook of China, in 2018, the aquaculture area and the annual production of clams reached 71,800 hectares and 36,8000 tons, respectively, in this area (The Fisheries Bureau of Ministry of Agriculture, 2019). The clams cultivated here were distributed mainly to mainland China or exported to Japan, South Korea, and even Europe. However, because of the severe pollution, it is extremely important to assess the safety of clam products from this region.
Based on the aforementioned, we conducted preliminary heavy metal testing of clam samples collected from this region in 2014. Our results showed that heavy metal contaminants, including Hg, Cd, Cr, and Pb in the test samples were relatively low and did not exceed the limit, but the As was relatively high, with nearly 2% of the test samples exceeding the maximum limits of the China Food and Drug Administration (CFDA, 2016, GB2672-2017). The toxicity of As is species-dependent, and inorganic As (iAs), including arsenite (AsIII), and arsenate (AsV), is more toxic than organic As (oAs) species, including dimethylarsenous acid (DMA), monomethylarsinic acid (MMA), arsenocholine (AsC), arsenobetaine (AsB), and others (Cubadda et al., 2017). It has been reported that long-term exposure to iAs can cause diseases such as cancer, skin lesions, diabetes, and hypertension (Cubadda et al., 2017). Therefore, it is very necessary to conduct the health risk assessment of human exposure to iAs in food and drinking water (Samal et al., 2021; Moulick et al., 2021). However, reports have indicated that the dominant compounds of As in clam products are the less toxic organic forms. As the proportion of iAs in clam of different species, origins, and harvest seasons varies, the risk to human health also varies significantly (Kato et al., 2020).
Thus, this study aims to assessing the concentration and speciation of As in different clam species collected from multiple geographical locations, harvesting months, and years along the mid-eastern China (specially Jiangsu Province) coastal line. Upon above data, Bayesian modeling approach was further used to estimate the posterior As residue distributions in clams cultivated in this region and their health risks to Chinese adults. It is hope that through this study, we can fully understand the As pollution situation and evaluate whether the consumption of clams cultivated in this region will cause safety problems for potential consumers.
Materials and Methods
Sample Collection and Pretreatment
A total of 486 samples were collected for the experiment. We collected five commercially important clam species in eight main clam culture areas (All clams were cultures using the inter-tide zone method) along the Jiangsu coastal line during their harvesting season from April to October in 2014, 2016, and 2018. Detailed sampling information is shown in Figure 1 and Supplementary Table S1. All samples were kindly provided by the Institute of Oceanology and Marine Fisheries (Nantong, Jiangsu, China) and Jiangsu Haitu Research Center (Nanjing, Jiangsu, China).
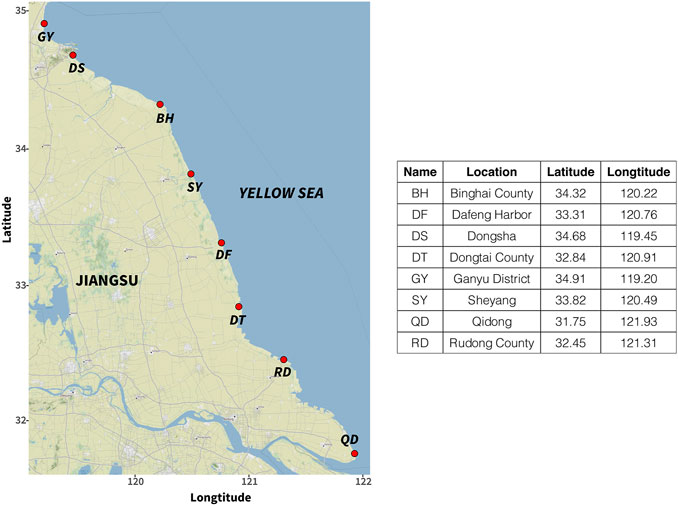
FIGURE 1. Sampling sites (red dot) of Clams cultivated in Jiangsu Province (the map was generated with R studio by using the “ggmap” package, map was sourced from “google map”).
After sampling, the exterior surfaces of all the clam samples were cleaned thoroughly with ultrapure water (Milli-Q, Millipore, United States) to remove sediments and other foreign material. One composite sample was merged from 8 to 10 clams (same species) collected from same area and date. All the composite samples were then removed from the shells, chopped, and homogenized using a blender. The chopped tissues were freeze-dried, ground into powder, and stored in polyethylene bags prior to analysis. All specimens were marked carefully and deposited at the College of Pharmacy, Nanjing University of Chinese Medicine, Nanjing, China.
Chemical and Standards
Ultrapure water (Millipore, United States) was used to prepare the standards, mobile phase, and extraction solutions. Nitric acid (HNO3, 70%), NH4 H2PO4, and hydrogen peroxide (H2O2) were obtained from Sinopharm Reagent Co. (Beijing, China). HPLC-grade methanol was purchased from Tedia (United States). Mussel reference tissue (BCR668) was purchased from Sigma-Aldrich (St. Louis, MO, United States). A stock solution of As (1,000 μg/ml, 20190203) was purchased from the National Nonferrous Metals and Electronic Materials Analysis and Testing Center (Beijing, China). Stock solutions of As III (GBW08666), DMA (GBW08669), MMA (GBW08668), AsV (GBW08667), AsB (GBW08670), and AsC (GBW08671) were all obtained from the National Institute of Metrology (Beijing, China).
Arsenic Concentration and Speciation
The tAs concentration and speciation in the test samples were measured on a dry weight basis. The tAs concentrations were detected as described previously (Jia et al., 2018). In brief, triplicates of each sample (∼0.2 g dw) were weighed precisely and digested with 5 ml concentrated HNO3 (70%, v/v) and 1 ml of H2O2 (30%, v/v) in a microwave digester (MARS, CEM Corp., United States). The heating process was as follows: the temperature was elevated from room temperature to 120°C within 5 min and kept for 5 min at 120°C; then from 120 to 150°C within 5 min and kept for 10 min at 150°C; finally from 150 to 190°C within 5 min and kept for 20 min at 190°C. After digestion, the liquid was transferred into a 25 ml volumetric flask, diluted to the marker using the ultrapure water and filtered through 0.22 μm filters. Blank control tests using the Mussel reference tissue (BCR668) were also performed. The tAs concentration was then analyzed using ICP-MS (NexION 350D, PerkinElmer, United States).
Speciation tests were performed using the microwave-assisted extraction method as established previously (Jia et al., 2018). Briefly, triplicates of each sample (∼0.2 g dw) were weighed precisely and extracted in the microwave digester (MARS) for 1.5 h at 100°C with 20 ml of HNO3 (1%, v/v) solution before centrifuging (8,000 rpm, 10 min). The supernatant was then aspirated, and diluted to 25 ml with ultrapure water, extracts were filtered through 0.22 μm filters, and stored at −20°C before use. The arsenic species were analyzed using HPLC-ICP-MS (NexION 350D coupled with Series 200 HPLC, PerkinElmer) equipped with an anion-exchange column (PRP-X100, 250 mm × 4.6 mm, 10 μm, Hamilton, UK). The mobile phase comprised 25 mM NH4H2PO4 (pH8.0) and ultrapure water.
The analytical methods described above were further validated by determining quality parameters including the limits of detection (LOD), limits of quantification (LOQ), linearity, precision, and recovery experiments. LOD/LOQ was determined by spiking the Mussel reference tissue (BCR668) with the tAs or each As species standards, the spiked tissue was then extracted by aforementioned procedure, respectively, and calculated on the basis of three/ten times of the blank signals (S/N = 3 or 10). Linearity was performed by spiking the extracted blank mussel tissue with suitable concentrations of As or each of 6 As species standard solutions prior to the injection. The calibration curves of the tAs and six As species were then calculated using a non-weighted least squares linear regression analysis method. Precision was calculated by the relative standard deviation (RSD%) based on ten injections and determinations of one sample (Meretrix meretrix sample collected from October 2014 at Dongtai County). The recovery (%) was determined by spiking the above sample with suitable concentrations of solutions containing As or a mixture of six As species (n = 10).
Supplementary Table S2 enlist analytical methods validation parameters including linearity, LOD, LOQ, precision and spike recovery. The results proved that the analytical methods used in this manuscript were fulfilling the required criteria in accordance to the specifications by Association of Official Analytical Chemists (AOAC) for analysis (AOAC, 2012).
Data Analysis
Statistical Analysis Methods
We employed one-way analysis of variance (ANOVA) to analyze the differences in tAs or iAs concentrations among the five clam species, three sampling years, seven sampling months, and eight cultivation locations. All the statistical tests were performed with RStudio (United States) open-source software (V1.3.959) using the “ggpubr” package (V0.4.0).
Pearson’s correlation analysis was performed to evaluate the relationship between the tAs and iAs contents in different clam species, sampling seasons, and locations. All correlation tests were performed by RStudio software (United States) using the “ggpubr” package (ggscatter, V0.4.0).
Baysian Estimation of as Distributions in Clam Samples
The As and iAs detection results in the samples were limited by the detection method [the concentration is not detectable below the Limit of Quantitation (LOQ)] and the sample collection method (the collection time and location were limited), and could not fully reflect the As concentration distribution in the different samples. Therefore, we employed the Bayesian inference method to estimate the distribution of As concentration in samples of different populations, harvest times, and locations to provide a basis for subsequent health risk estimation.
where
∗ a: mean of the observed logarithmically transformed tAs or iAs concentrations
∗ b: standard deviation of the logarithmically transformed tAs or iAs concentrations
To estimate the mean tAs or iAs in the clam samples, we used the Markov Chain Monte Carlo (MCMC) algorithm in our calculations, using follow equation:
where,
CAs/iAs: mean tAs or iAs concentration in clam samples
μ: mean of the log-normal distribution of tAs or iAs concentration
σ: standard deviation of the log-normal distribution of tAs or iAs concentrations.
All the calculations were performed with RStudio (V1.3.959) (United States) software, using the “rjags” (V4.10) package to call the JAGS software (V4.3.0), where the MCMC model was programmed. Package “coda” (V0.19.2) was used to further analyze and visualize the output returned from JAGS. For each MCMC simulation, the total iteration was performed 10,000 times, with the first 5,000 times serving as the burn-in period. A horizontal box plot and log-normal distributions using the “ggplot2” package (V3.3.2) (RStudio, United States) were also generated with the R software. All programming codes used in our analyses are presented in Supplementary Data S1.
Probablistic Assessment of Dietary as Exposure
Dietary consumption data for clam were obtained from a report published in 2018 by the Chinese Center for Disease Control and Prevention. This report contains marine food consumption data for 2015, pertaining to Chinese adults aged between 19 and 58 years in 15 provinces (Su et al., 2016). In this study, we assumed that all the consumed marine food was clam; therefore, the average daily consumption rate of clam was set at 28.6 g (fresh weight, with standard deviation at 48.9 g) in accordance with the above report. The average body weight of Chinese adults was recently reported as being 61.9 kg (with a standard deviation of 15.1 kg). Therefore, the lifetime average daily dose (LADD) of iAs for consuming clam was estimated as follows:
where,
CiAs: Posterior iAs level in clam samples (mg/g)
DI: Daily intake rate of clam (dry weight, g/day)
BW: Body weight (kg)
The mean and standard deviations were used as input to quantify the degree of total variations in the data pertaining to clam consumption, posterior iAs concentrations in clam samples, and body weight. Because the above-mentioned data did not contain negative values, we believed these all conformed to log-normal distributions. The probabilistic computation in the estimation of LADDs was performed by MCMC simulation, as mentioned in Baysian Estimation of As Distributions in Clam Samples. All R programming R codes are displayed in Supplementary Data S2.
Risk Assessment of Dietary Intake of Clam Cultivated in Jiangsu
The non-carcinogenic health risk of iAs for consumption of clam cultivated in Jiangsu was estimated as follows:
where HQ is the hazard quotient and RfD is the reference dose for oral exposure to iAs. The United States Environmental Protection Agency (USEPA) recommended an RfD value of 3 × 10⁻⁴ mg kg-1 BW/d for iAs (https://cfpub.epa.gov/ncea/iris2/chemicalLanding.cfm? substance_nmbr=278). We referred to this value in the computation of HQs. An HQ value exceeding 1 indicate the possibility of adverse effects on renal and reproductive functions in humans. Because of the probabilistic computation for LADDs, the output of the HQs was presented probabilistically.
The carcinogenic health risk associated with exposure to iAs from clam consumption in Jiangsu Province was calculated according to the following equation:
Where CR is carcinogenic risk, q*(25.7 mg kg-1 BW/d) is the cancer slope factor regulated by USEPA for iAs corresponding to bladder and lung cancer (https://cfpub.epa.gov/ncea/iris2/chemicalLanding.cfm?substance_nmbr=278).
Results and Discussion
Total As
Among the 486 clam samples we collected, the tAs concentration fluctuated greatly (see Supplementary Table S3 and Figure 2), ranging from 0.56 to 7.74 mg/kg (dw), with an average of 2.53 mg/kg, median of 2.22 mg/kg, and SD value of 1.25. The literature indicates that the concentration range of tAs in several major clam culturing areas in China is 1.7–3.4 mg/kg (ww) for Shandong province (Wu et al., 2014), 4.29–25.9 mg/kg (dw) for Zhanjiang (Guangdong province) (Zhang et al., 2013), 0.15–1.95 mg/kg for Zhejiang province (ww) (Mu et al., 2013), 0.34–1.60 mg/kg for Fujian province (ww) (Qiu et al., 2018). The tAs concentration we reported in Jiangsu cultivated clam samples, converted into wet weight, was in the range 0.14–1.94 mg/kg (ww), i.e., an intermediate level compared with that of other major culturing areas, lower than that in Guangdong and Shandong, similar with that in Zhejiang province, and higher than that in Fujian province.
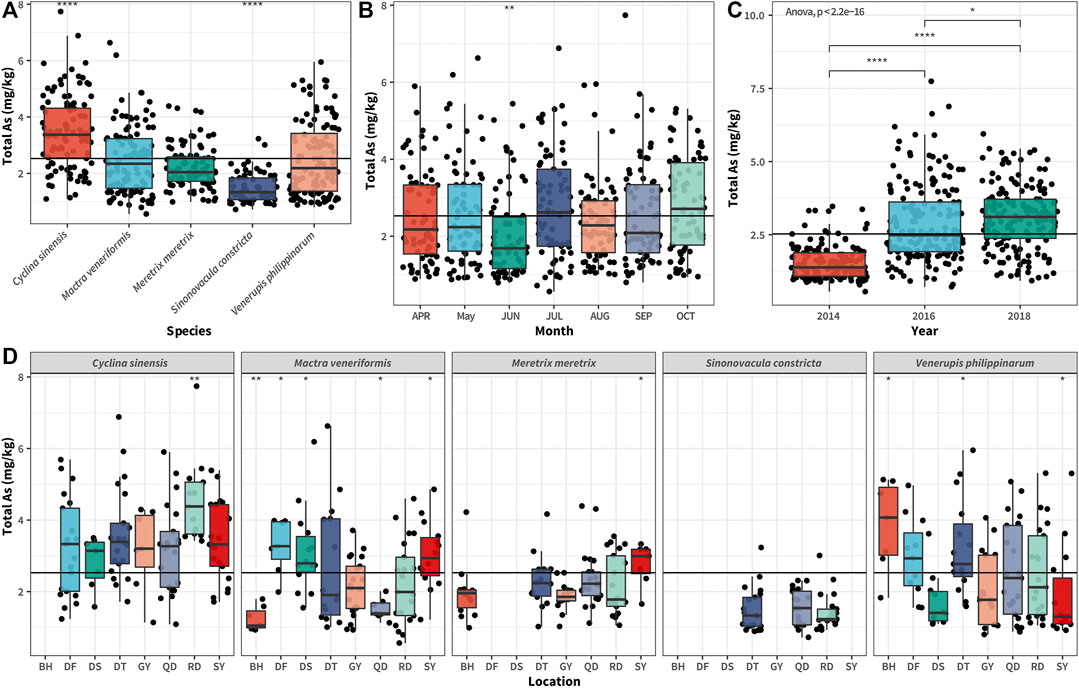
FIGURE 2. Boxplot of total As concentrations in different clam species (A), collecting months (B), sampling years (C), and locations (D) in Jiangsu province, China. The bottom and top of the boxes represent the 25th and 75th percentiles, while error bars represent the 5th and 95th percentiles. The solid lines inside the box represent the median tAs concentrations. In all panels, data were analyzed using one-way analysis of variance (ANOVA), where *p < 0.05; ** p < 0.01; and **** p < 0.0001.
As shown in Figure 2A, there were significant differences in tAs concentrations between different clam species cultivated in Jiangsu (p < 0.0001), reflecting the difference in As bioaccumulation capacity between the different species. Among these, CS was the highest (range 1.03–6.8 mg/kg, mean 2.97 mg/kg, and median 2.87 mg/kg), followed by MV (range 0.44–5.98 mg/kg, mean 2.14 mg/kg, and median 2.0 mg/kg), MM (range 0.9–63.79 mg/kg, mean 1.92 mg/kg, and median 1.76 mg/kg), VP (range 0.76–5.66 mg/kg, mean 2.2 mg/kg, and median 1.99 mg/kg), and SC (range 0.7–2.46 mg/kg, mean 1.31 mg/kg, and median 1.19 mg/kg). The mean value of tAs concentration in CS was 2.2 times that of SC. Therefore, in terms of species difference, we believe that CS had the strongest As bioaccumulation ability, whereas SC had the weakest.
Further, a significant difference was found in the tAs concentration among clam collected in different seasons (p < 0.001, Figure 2B). Among these, June showed the lowest tAs concentration. June is the spawning season for clam cultivated in Jiangsu. As reported previously, the spawning behavior of clam has a significant effect on its As concentration, i.e., a large mass of gametes is released, eliminating the As accumulated in the gametes from the clam bodies (Kato et al., 2020). As shown in Figure 2C, there were significant differences in the tAs concentrations of clam in different sampling years (p < 0.0001). From 2014, and 2016 to 2018, the tAs content in clam samples had increased significantly gradually, indicating that As pollution in the coastal culture areas of Jiangsu province had progressively become severe. The tAs contents among samples collected from different locations also showed significant differences (Figure 2D), probably implying that the As pollution levels of these clam culture areas were different.
As Species
The toxicity of As in seafood depends mainly on its species, and it has been recognized widely that the toxicity of iAs is far greater than that of organic As (oAs) (Kato et al., 2020). Therefore, we employed the HPLC-ICP-MS method to analyze As speciation of all the collected samples. The analyse was conducted to improve understanding of the distribution of oAs and iAs in the clam cultivated in the study area, and to provide a basis for subsequent assessment of their consumption risks. All the results are shown in Supplementary Table S3 and Figure 3.
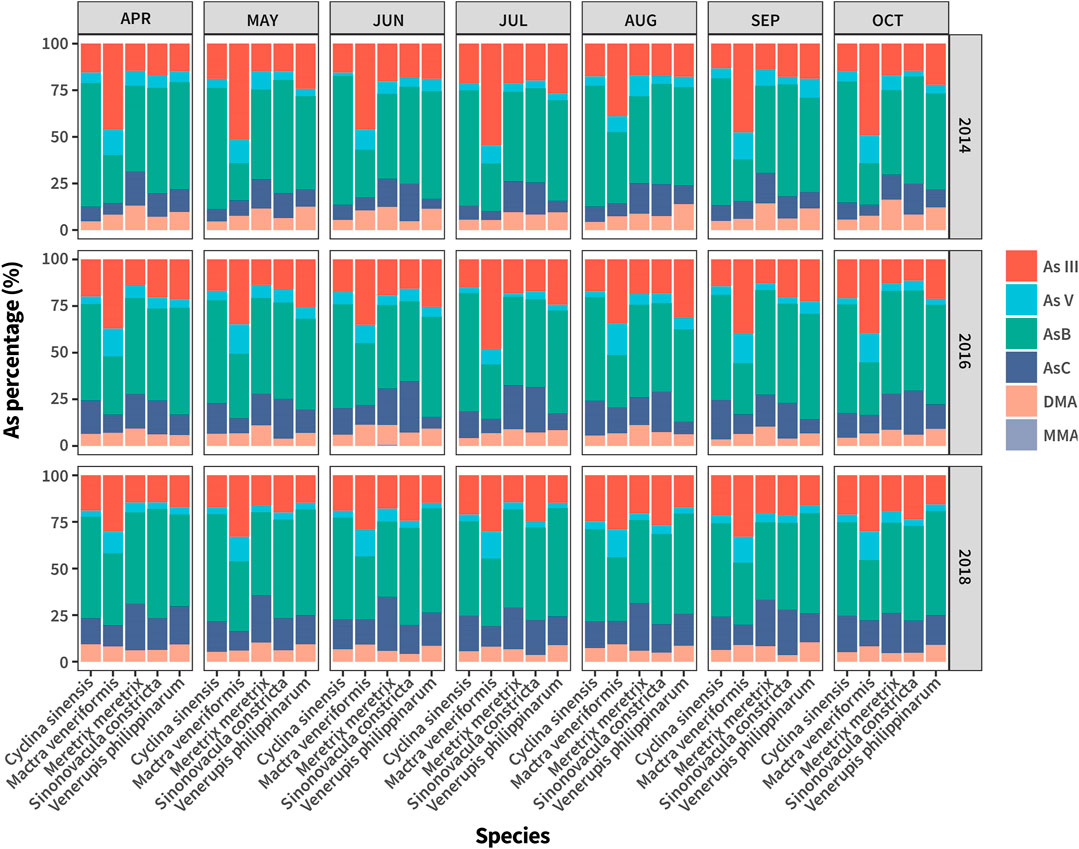
FIGURE 3. Contribution of five As species to total As in collected clam samples.
Among the 486 collected samples, the proportion of oAs ranged from 18.5 to 94.8%, with a mean value of 62.3% and median of 65.8%, whereas the proportion of iAs ranged from 9.3 to 68.4%, with a mean value of 22.1% and median of 26.5%. These results suggested that the main As species in most collected clam samples was oAs, and was generally 2–3 times that of iAs. Among the oAs, AsB was the dominant species (mean value 42.7%, median 44.2%), followed by AsC (mean value 12.7%, median 11.9%), DMA (mean value 6.9%, median 6.5%), and MMA had the lowest proportion, which could hardly be detected in most collected samples. As regards iAs, As(III) was the dominant species (mean value 20.5%, median 17.7%), followed by As(V) (mean value 5.9%, median 4.5%). The above results are consistent with the distribution of As species in marine-derived clam previously reported in the literature.
Further, we found that the proportion of oAs and iAs differed significantly among clam species. As shown in Figure 3 and Supplementary Table S3, SC had the highest oAs proportion (mean value 72.7%, median 72.9%), followed by CS, MM, and VP, which shared the same oAs proportion, with mean and median values ranging from 66 to 68%, respectively. The oAs proportion in MV was the lowest among all the clam species, with mean and median values of only 41.5 and 46.7%, respectively. In terms of the proportion of iAs, there is no doubt that MV had the highest percentage compared with other clam species (mean and median values of 41.5 and 40%, respectively). CS, MM, VP, and SC had the same percentage, with mean and median values ranging from 19 to 22%. The proportion of iAs in MV was more than twice as high as that in other clam species. Accordingly, we believe that the MV cultivated in Jiangsu province tended to bioaccumulate toxic iAs species in their bodies, the risk of which to human health should not be underestimated.
Inorganic As
Because of the toxicity of iAs, we focused on the iAs bioaccumulation levels in all the collected clam samples. As shown in Figure 4A, the iAs concentrations indicated significant differences among the five clam species (p < 0.0001). The highest was found in MV, which ranged from 0.22 to 2.85 mg/kg, with mean and median values of 1.1 and 1.08 mg/kg, respectively. The lowest concentration was found in SC, ranging from 0.13 to 0.72 mg/kg, with mean and median values of 0.29 mg/kg. The results of our previous studies have indicated that the water content of clam samples cultivated in Jiangsu was between 75 and 80%. In the current study, the water content was set at 75%. According to the requirements of the national standard issued by the China Food and Drug Administration (CFDA GB2672-2017), the limit for iAs in aquatic products is 0.5 mg/kg (ww), which, converted to dry weight is 2.0 mg/kg (dw) for iAs. The number of MV samples exceeding this limit was seven, accounting for 6.7% of all MV samples. None of the other clam species samples exceeded this limit.
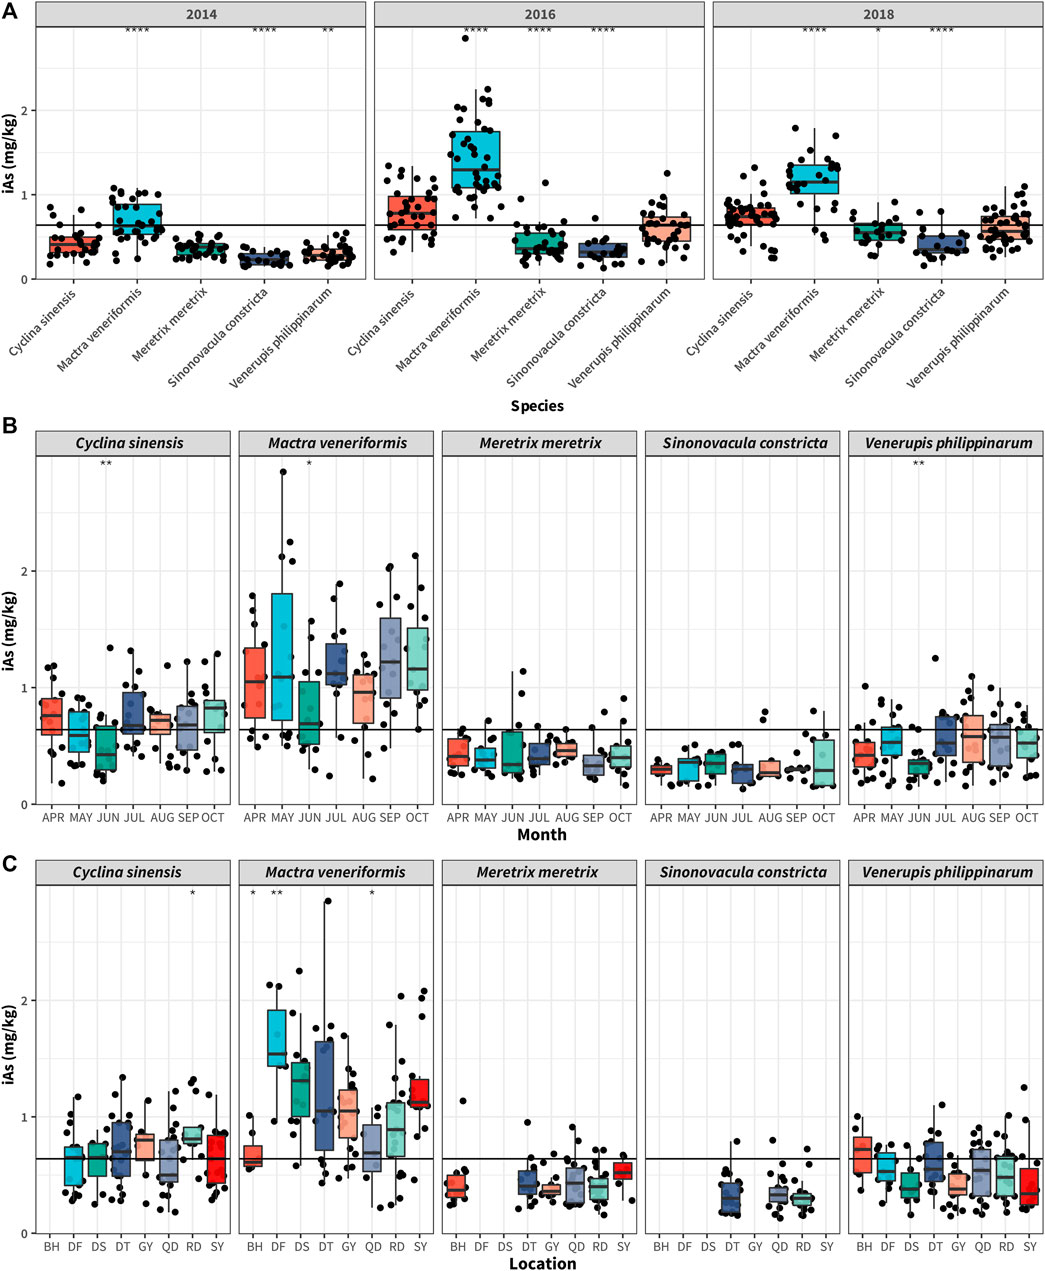
FIGURE 4. Inorganic As concentrations in different clam species (A), collecting months (B), and sampling locations (C) in Jiangsu province, China. The bottom and top of the boxes represent the 25th and 75th percentiles, while error bars represent the 5th and 95th percentiles. The solid lines inside the box represent the median iAs concentrations. In all panels, data were analyzed using one-way analysis of variance (ANOVA), where * p < 0.05; ** p < 0.01; ****p < 0.0001.
As iAs concentrations differ among clam species, we conducted a correlation study between iAs and tAs in all the collected clam samples to further evaluate their bioaccumulation abilities toward toxic and non-toxic As species. As shown in Figure 5A, there were significant positive correlations between iAs and tAs in all clam species (p < 0.0001). Among these, the strongest correlation between iAs and tAs was MV, with a correlation coefficient of 0.9. As shown in Supplementary Table S4, the slope of the regression curve of MV was the highest (0.36), followed by SC, CS, MM, and VP (ranging from 0.14 to 0.21), which indicated that MV could have the highest toxic iAs bioaccumulation activity among all the tested clam species.
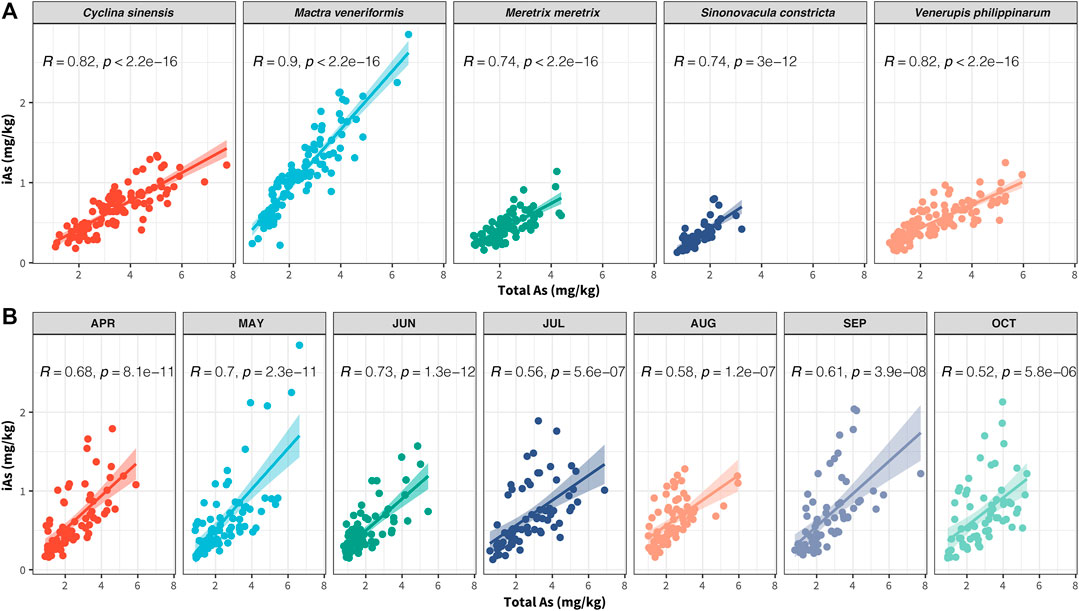
FIGURE 5. Pearson’s correlation analysis of iAs- total As among different clam species (A) and collecting seasons (B).
From the perspective of harvest seasons, the iAs concentrations in CS, MV, and VP were significantly reduced in June compared with the other collection months (p < 0.01), whereas the iAs content in SC and MM showed no significant difference in the different harvest months (Figure 4B). Correlation analysis between iAs and tAs for the different collection seasons is shown in Figure 5B. This figure indicates that iAs and tAs were significantly positively correlated for different collection months, with June having the strongest correlation at a correlation coefficient of 0.73. As shown by the corresponding regression curve (Supplementary Table S4), the accumulation activity of iAs in June was relatively weaker than it was in other months. Consistent with tAs, the above results suggested that the bioaccumulation of iAs would also be weakened in clam during their spawning period.
As regards the sampling locations, the MV samples collected from Dafeng contained significantly higher iAs than samples from other locations (Figure 4C). This could be ascribed to the strong bioaccumulation ability of iAs in MV species and high iAs content in the clam food chain of this culture area.
Estimated Distribution of tAs and iAs in Clam Cultivated in Jiangsu
Using the tAs and iAs values we observed earlier in clam samples as prior knowledge, we adopted Markov Chain Monte Carlo (MCMC) simulation to generate the posterior distributions of tAs and iAs to further estimate their concentrations in the different clam species (Lin et al., 2020). After conducting MCMC computation for the two tAs/iAs datasets, respectively, Figure 6A shows the predicted posterior distributions of the amounts of tAs(blue)/iAs(red) in five clam species cultivated along the Jiangsu coastline. Supplementary Table S5 shows the mean and standard deviations of the posterior distributions.
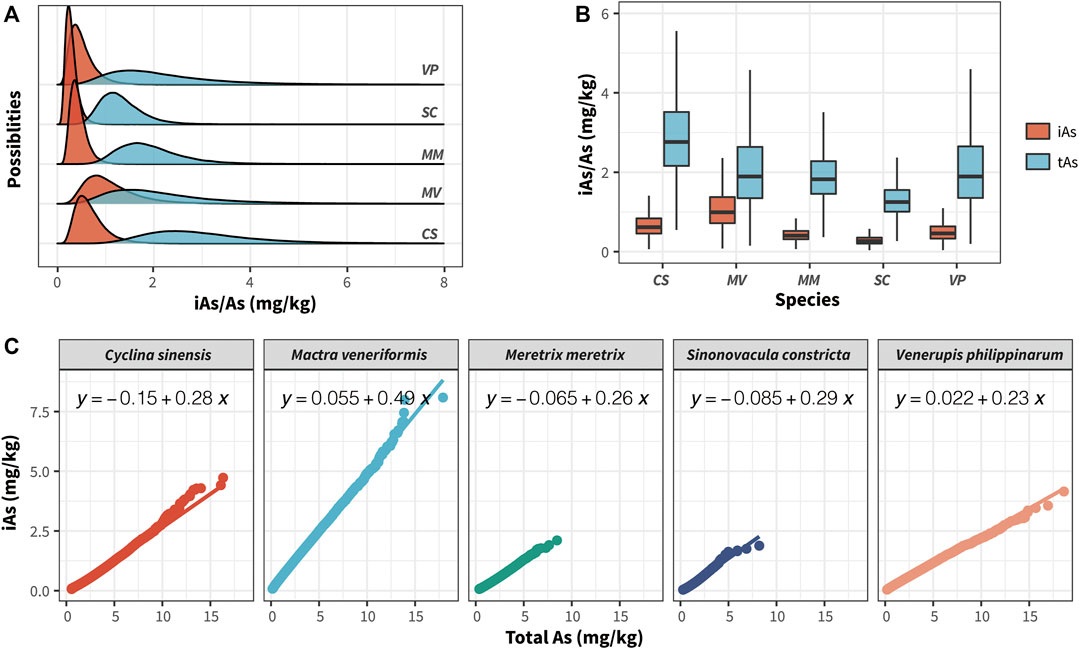
FIGURE 6. Posterior probabilistic distributions of iAs (blue) and tAs (red) concentrations in different clam species cultivated in Jiangsu Province (A); Boxplot of posterior probabilistic distributions of iAs and tAs concentrations in different clam species, the bottom and top of the boxes represent the 25th and 75th percentiles, while error bars represent the 5th and 95th percentiles. The solid lines inside the box represent the median As concentrations (B); Pearson’s correlation analysis of posterior distributions of iAs and tAs among different clam species (C).
As shown in Figure 6A and Supplementary Table S5, the rank of the posterior means of the tAs concentrations in each clam species was CS, MV, MM, VP, and SC. CS presented the highest tAs concentration of all the clam species, with a mean concentration and SD value of 3.47 ± 1.43 mg/kg (dw), whereas SC had the lowest tAs concentration, with a mean and SD values of 1.49 ± 0.54 mg/kg. The above tAs posterior distribution data are consistent with the previously observed data.
As regards iAs posterior distribution in clam, the rank for the posterior means of iAs concentrations in each clam species were MV, CS, VP, MM, and SC. MV had the highest toxic iAs concentration of all the clam species, with a mean concentration and SD value of 1.12 ± 0.58 mg/kg (dw), whereas SC had the lowest iAs concentration, with a mean and SD value at 0.29 ± 0.13 mg/kg (dw) (Figures 6A,B). The posterior mean of iAs in MV was 3.86 times higher than was that in SC. In addition, as shown in Figure 6A, nearly 7% of MV posterior concentrations exceeded the limit of iAs (2.0 mg/kg) set by the CFDA, suggesting that consuming these clam species cultivated in Jiangsu province could cause certain health risk levels.
Based on the estimated tAs and iAs posterior distributions, we further analyzed the correlation between them in different clam species. As shown in Figure 6C, there were strong positive correlations between tAs and iAs in all the clam species (R = 1, p < 0.0001). Among all the correlation regression curves, the highest correlation slope between tAs and iAs was MV, which reached 0.41, further proving that the bioaccumulation capacity of iAs was far stronger than was that of other clam species. In addition, because of the high cost of HPLC-ICP-MS instruments, they are usually not available in most laboratories for quantifying of the concentration of toxic iAs in clam samples. Therefore, the regression curves shown in Figure 6C could help these laboratories to estimate the content of iAs in the clam samples cultivated in Jiangsu province by only measuring their tAs content.
Health Risk Assessment
The content of iAs determines the health risk of As in clam samples. The results of As speciation analysis in this study showed that iAs accounted for 0.13–2.85 mg/kg in all clam samples. Certain samples exceeded the maximum limit of iAs (2.0 mg/kg) issued by the CFDA, suggesting potential health risks for consumption of the clam cultivated in Jiangsu. To estimate the potential health risk of consuming the different clam species, the probability distribution of the non-carcinogenic HQ value of iAs exposure from lifetime consumption of MV, MM, VP, SC, and CS for Chinese adults was obtained by MCMC simulations. The cumulative probability distribution of HQ is shown in Figure 7A, and the related statistical information is presented in Supplementary Table S6. The HQ values for Chinese adults for consuming MV ranged from 0.03 to 4.32, with 1.6% having a risk above the serious or priority level (HQ = 1) (Hu et al., 2017), whereas that of MM, VP, SC, and CS ranged from 0.22 to 1.11, 0.02 to 1.82, 0.01 to 0.91, and 0.02 to 2.17, respectively, with only 0.002, 0.03, 0, and 0.08% having a health risk above the serious or priority level. Based on the USEPA’s proposed cancer slope factor of 25.7 cases for an iAs dose of 1 mg kg-1 BW/d, the average daily consumption of MV may result in a mean of 16.5 cases of bladder and lung cancer per 100,000 Chinese adults with lifetime exposure (Supplementary Table S7). This would result in 6.3–12.2 additional cancer cases than consuming other clam species in this region.
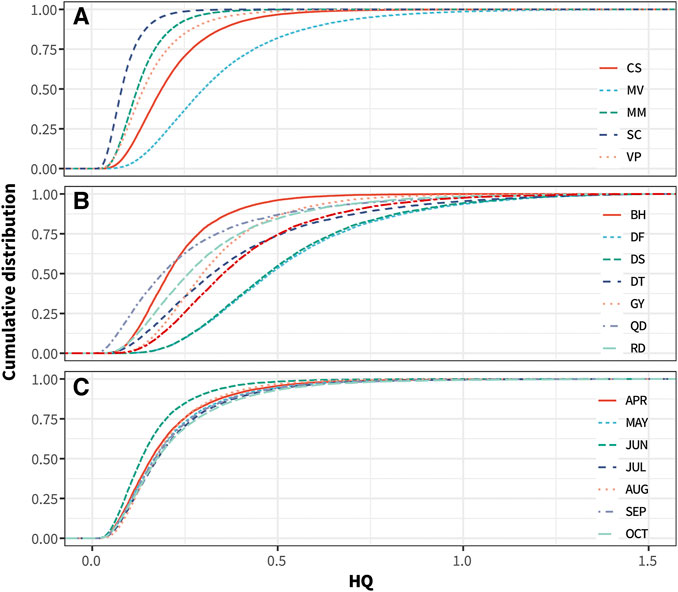
FIGURE 7. Cumulative probability of HQ of iAs exposure from consumption of different clam species cultivated in Jiangsu for the adult populations of China (A). Cumulative probability of HQ of iAs exposure from consumption of MV sampling at different locations (B) and seasons (C) in Jiangsu for the adult populations of China.
As all mentioned above, more attention is required with respect to the excessive accumulation of iAs in MV and the attendant consumption safety issues. MV accounted for nearly one-third of the total clam production in Jiangsu province. To minimize the health risk for consuming this species, the probability distributions of HQ values from different culturing locations and sampling seasons of MV were calculated by MCMC simulations. The cumulative probability distribution of HQ values concerning collecting locations and seasons are shown in Figures 7B,C, and the related statistical information is presented in Supplementary Tables S8, S9. As regards MV samples collected in June (HQ values ranged from 0.01 to 1.28) at Binghai county (HQ values ranged from 0.03 to 1.37), only 0.03% of these showed risk above the serious or priority level, which is significantly lower than is that for other sample collecting seasons and locations. Therefore, we recommended the consumption of MV harvested in June and collected in Binghai County in Jiangsu Province.
Conclusion
Clam, which can more efficiently enrich trace metals from water and sediment, are well known as the primary dietary source of As; however, the concentrations, speciation, and seasonal fluctuation of As in cultivated clam along the mid-eastern China, especially Jiangsu coastline are largely unknown. In this study, for the first time, a 3-year follow-up survey was conducted on As and its species in five major clam species from eight cultivation locations in this area. Among the 486 collected samples, we found that the bioaccumulation of tAs and iAs was species-specific. The tAs ranged from 0.56 to 7.74 mg/kg dw (mean 2.53 mg/kg), with CS (1.03–6.8 mg/kg dw, mean 2.97 mg/kg) containing the most tAs, whereas SC (0.7–2.46 mg/kg dw, mean 1.31 mg/kg) contained the least. The iAs ranged from 0.13 to 2.85 mg/kg, with MV (0.22–2.85 mg/kg, mean 1.1 mg/kg) accumulating the most toxic iAs, whereas SC (0.13–0.72 mg/kg, mean 0.29 mg/kg) accumulated the least. Our studies also demonstrated that the bioaccumulation of tAs and iAs in clam samples was influenced by sampling seasons. Both tAs and iAs concentrations were significantly reduced during the spawning period of clam by eliminating the As accumulated in gametes from their bodies. The MCMC approach was used in this study to estimate posterior distributions of iAs exposure and HQ when consuming clam cultivated in Jiangsu province. According to posterior means, the non-carcinogenic or carcinogenic health risk of iAs associated with MV consumption was rather high, namely approximately 1.6% of the adult population in China had HQ above the serious or priority risk level and a mean of 16.5 cases of bladder and lung cancers per 100,000 Chinese adults with lifetime dietary exposure. Despite the existence of uncertainty and variability in the health risk assessment of this study, our results suggested that more attention should be paid to the relative safety of clam consumption. MV species cultivated in Jiangsu Province should be monitored more carefully. In addition, based on our results, a feasible solution to reduce iAs exposure for MV consumers is to purchase clams harvested in June from Binhai County in Jiangsu Province.
Data Availability Statement
The original contributions presented in the study are included in the article/Supplementary Material, further inquiries can be directed to the corresponding author.
Author Contributions
XW: Conceptualization, writing (original draft, review, and editing), data analysis, and visualization; YM: Data analysis and visualization; LC and XC: ICP-MS and HPLC-ICP-MS analysis; WZ: Clam samples pretreatment.
Funding
This research was founded by the Natural Science Foundation of Jiangsu Province (BK20181419); Natural Foundation of Jiangsu Higher Education Institutions of China (19KJA310006) and Natural Science Foundation of China (82074067).
Conflict of Interest
The authors declare that the research was conducted in the absence of any commercial or financial relationships that could be construed as a potential conflict of interest.
Publisher’s Note
All claims expressed in this article are solely those of the authors and do not necessarily represent those of their affiliated organizations, or those of the publisher, the editors and the reviewers. Any product that may be evaluated in this article, or claim that may be made by its manufacturer, is not guaranteed or endorsed by the publisher.
Supplementary Material
The Supplementary Material for this article can be found online at: https://www.frontiersin.org/articles/10.3389/fenvs.2021.763257/full#supplementary-material
References
Alyahya, H., El-Gendy, A. H., Al Farraj, S., and El-Hedeny, M. (2011). Evaluation of heavy metal pollution in the Arabian Gulf using the clam Meretrix Meretrix Linnaeus, 1758. Water Air Soil Pollut. 214, 499–507. doi:10.1007/s11270-010-0441-x
AOAC (2012). Association of Official Analytical Chemists, Standard method performance requirements (AOAC SMPR 211.009), for Cr, Mo and Se in infant formula and adult/pediatric nutritional formula. J. AOAC Int. 95 (2), 1.
Bi, S., Yang, Y., Xu, C., Zhang, Y., Zhang, X., and Zhang, X. (2017). Distribution of heavy metals and environmental assessment of surface sediment of typical estuaries in eastern China. Mar. Pollut. Bull. 121 (1-2), 357–366. doi:10.1016/j.marpolbul.2017.06.013
Cao, Z., Wang, L., Yang, L., Yu, J., Lv, J., Meng, M., et al. (2020). Heavy metal pollution and the risk from tidal flat reclamation in coastal areas of Jiangsu, China. Mar. Pollut. Bull. 158, 111427. doi:10.1016/j.marpolbul.2020.111427
Cheng, J. L., Zhang, X. H., Zhuo, Q., Liu, T. T., and Tang, Z. W. (2016). Accumulation and health risks of heavy metals in edible marine shellfishes from China. Chin. J. Food Hyg. 28 (2), 175–180. doi:10.13590/j.cjfh.2016.02.008
China Food and Drug Administration (2016). China’s Maximum Levels for Contaminants in Foods. GB, 2672–2017.
Cubadda, F., Jackson, B. P., Cottingham, K. L., Van Horne, Y. O., and Kurzius-Spencer, M. (2017). Human exposure to dietary inorganic arsenic and other arsenic species: State of knowledge, gaps and uncertainties. Sci. Total Environ. 579 (C), 1228–1239. doi:10.1016/j.scitotenv.2016.11.108
Gong, Y., Chai, M., Ding, H., Shi, C., Wang, Y., and Li, R. (2020). Bioaccumulation and human health risk of shellfish contamination to heavy metals and as in most rapid urbanized Shenzhen, China. Environ. Sci. Pollut. Res. 27, 2096–2106. doi:10.1007/s11356-019-06580-2
Hu, Y., Zhang, W., Cheng, H., and Tao, S. (2017). Public Health Risk of Arsenic Species in Chicken Tissues from Live Poultry Markets of Guangdong Province, China. Environ. Sci. Technol. 51, 3508–3517. doi:10.1021/acs.est.6b06258
Jia, Y., Wang, L., Ma, L., and Yang, Z. (2018). Speciation analysis of six arsenic species in marketed shellfish: Extraction optimization and health risk assessment. Food Chem. 244, 311–316. doi:10.1016/j.foodchem.2017.10.064
Kato, L. S., Ferrari, R. G., Leite, J. V. M., and Conte-Junior, C. A. (2020). Arsenic in shellfish: A systematic review of its dynamics and potential health risks. Mar. Pollut. Bull. 161, 111693. doi:10.1016/j.marpolbul.2020.111693
Kumar, P., Sivaperumal, P., Manigandan, V., Rajaram, R., and Hussain, M. (2021). Assessment of potential human health risk due to heavy metal contamination in edible finfish and shellfish collected around Ennore coast, India. Environ. Sci. Pollut. Res. 28, 8151–8167. doi:10.1007/s11356-020-10764-6https://doi.org.libezproxy.bournemouth.ac.uk/10.1007/s11356-020-10764-6
Li, P., Pan, Y., Fang, Y., Du, M., Pei, F., Shen, F., et al. (2019). Concentrations and health risks of inorganic arsenic and methylmercury in shellfish from typical coastal cities in China: A simultaneous analytical method study. Food Chem. 278, 587–592. doi:10.1016/j.foodchem.2018.11.085
Lin, H.-C., Li, H.-Y., Wu, Y.-T., Tsai, Y.-L., Chuang, C.-Y., Lin, C.-H., et al. (2020). Bayesian inference of nonylphenol exposure for assessing human dietary risk. Sci. Total Environ. 713 (C), 136710. doi:10.1016/j.scitotenv.2020.136710
Liu, S., Liu, Y., Yang, D., Li, C., Zhao, Y., Ma, H., et al. (2020). Trace elements in shellfish from Shenzhen, China: Implication of coastal water pollution and human exposure. Environ. Pollut. 263 (Part B), 114582. doi:10.1016/j.envpol.2020.114582
Moulick, D., Samanta, S., Sarkar, S., Mukherjee, A., Pattnaik, B. K., Saha, S., et al. (2021). Arsenic contamination, impact and mitigation strategies in rice agro-environment: An inclusive insight. Sci. Total Environ. 800, 149477. doi:10.1016/j.scitotenv.2021.149477
Mu, Q. L., Wang, X. H., She, Y. Y., Zou, W. M., Wang, J., and Wang, Y. H. (2013). Contamination status of heavy metals and shellfish poisoning in the shellfish samples of Zhejiang coastal areas. Mar. Sci. 37 (1), 87–91. 1000-3096(2013)01-0087-05.
Qiu, Z., Lv, Z., Wang, K., Lan, Y., Yang, X., Rensing, C., et al. (2018). Species distribution characteristics of arsenic in shellfish seafood collected from Fujian Province of China. J. Food Compost. Anal. 72, 132–140. doi:10.1016/j.jfca.2018.07.002
Samal, A. C., Bhattacharya, P., Biswas, P., Maity, J. P., Bundschuh, J., and Santra, S. C. (2021). Variety-specific arsenic accumulation in 44 different rice cultivars (O. sativa L.) and human health risks due to co-exposure of arsenic-contaminated rice and drinking water. J. Hazard. Mater. 407, 124804. doi:10.1016/j.jhazmat.2020.124804
Su, C., Wang, Z. H., Jia, X. F., Du, W. F., Zhang, B., and Ding, G. Q. (2016). An analysis on marine food consumption among Chinese adults aged 18 to 19 years old in 15 provinces in 2015. Acta Nutrimenta Sinica 40 (1), 23–26. doi:10.13325/j.cnki.acta.nutr.sin.2018.01.008
Tavoloni, T., Miniero, R., Bacchiocchi, S., Brambilla, G., Ciriaci, M., Griffoni, F., et al. (2021). Heavy metal spatial and temporal trends (2008-2018) in clams and mussel from Adriatic Sea (Italy): Possible definition of forecasting models. Mar. Pollut. Bull. 163, 111865. doi:10.1016/j.marpolbul.2020.111865
The Fisheries Bureau of Ministry of Agriculture (2019). China Fisheries Yearbook (in Chinese), 1979-2018. Beijing: China Agriculture Press.
Wang, S.-L., Xu, X.-R., Sun, Y.-X., Liu, J.-L., and Li, H.-B. (2013). Heavy metal pollution in coastal areas of South China: A review. Mar. Pollut. Bull. 76 (1-2), 7–15. doi:10.1016/j.marpolbul.2013.08.025
Wu, X., Gao, M., Wang, L., Luo, Y., Bi, R., Li, L., et al. (2014). The arsenic content in marketed seafood and associated health risks for the residents of Shandong, China. Ecotoxicology Environ. Saf. 102 (C), 168–173. doi:10.1016/j.ecoenv.2014.01.028
Xiao, C., Jian, H., Chen, L., Liu, C., Gao, H., Zhang, C., et al. (2017). Toxic metal pollution in the Yellow Sea and Bohai Sea, China: distribution, controlling factors and potential risk. Mar. Pollut. Bull. 119 (1), 381–389. doi:10.1016/j.marpolbul.2017.03.027
Keywords: arsenic, arsenic species, marine clams, mid-eastern China, Bayesian modeling, health risk
Citation: Wang X, Ma Y, Chen L, Zhang W and Chen X (2021) Multi-Year Survey and Bayesian Modeling Approach for Characterizing Arsenic Pollution in Marine Clams Cultivated Along the Tidal Flats of Mid-Eastern China. Front. Environ. Sci. 9:763257. doi: 10.3389/fenvs.2021.763257
Received: 23 August 2021; Accepted: 04 October 2021;
Published: 21 October 2021.
Edited by:
Debapriya Mondal, St George’s, University of London, United KingdomCopyright © 2021 Wang, Ma, Chen, Zhang and Chen. This is an open-access article distributed under the terms of the Creative Commons Attribution License (CC BY). The use, distribution or reproduction in other forums is permitted, provided the original author(s) and the copyright owner(s) are credited and that the original publication in this journal is cited, in accordance with accepted academic practice. No use, distribution or reproduction is permitted which does not comply with these terms.
*Correspondence: Xinzhi Wang, eGluemhpd2FuZ0BuanVjbS5lZHUuY24=