 Fubo Zhao
 Shuai Ma
 Yiping Wu
- Department of Earth and Environmental Science, School of Human Settlements and Civil Engineering, Xi’an Jiaotong University, Xi’an, China
Global warming will significantly change patterns of precipitation (P) and evapotranspiration (E) and thus the surface water availability (P minus E, P–E). Changes in P–E will challenge freshwater supply, food security, and sustainability of the ecosystems. Therefore, understanding the spatiotemporal change in P–E and its drivers is key for water resources management. Here, we quantified the changes in water availability during the driest month of the year and identified its drivers in the Yellow River Basin (YRB), China, during 1982–2016. Our results showed that 89.6% of the YRB showed declining dry-season water availability in 2000–2016 compared with 1982–1999, although the total dry-season water resources (defined as the proportion of the sum of monthly P–E to the P) remained nearly unchanged due to the increased P. Changes in seasonal P and E contributed to 87.0 and 99.0% declines in dry-season water availability, respectively, demonstrating the key role of E in net seasonal water fluxes. Increased air temperature (41.8%), vegetation greening (30.8%), and vapor pressure deficit (19.2%) were the main factors driving changes in E in the YRB during the study period. Our study highlighted a drier dry season in the YRB during 1982–2016 and illustrated that climate and vegetation changes played important roles in driving changes in dry-season water availability. Seasonal water fluxes must be considered in future water resources management in the YRB, especially in the context of climate warming and revegetation programs.
Introduction
Global average temperatures have risen significantly over the past century in association with anthropogenic greenhouse gas emissions (IPCC, 2014). As a consequence of global warming, the earth’s water cycle is expected to be substantially modified, impacting the patterns of precipitation (P) and evapotranspiration (E) over land areas (Arnold et al., 2000; Jung et al., 2010; Murray-Tortarolo et al., 2016; Zhou et al., 2021a). The net water flux into the land surface—namely, P minus E (P–E) over land—is a critical aspect of the water cycle (Byrne and O’Gorman, 2015), representing the total water available for runoff, soil water storage change, and ground water recharge (Kumar et al., 2014). It is of great importance for many aspects of earth’s systems, and its change will pose great challenges to freshwater supply and food security and the sustainability of the natural ecosystems (Oki and Kanae, 2006; Dai et al., 2009; Rockström et al., 2009). Changes in P–E are especially important in water-limited ecosystems in which vegetation growth largely depends on water availability (Zhao et al., 2019; Zhou et al., 2021b). Therefore, understanding the changes in P–E and its drivers is of vital importance for water resources management in the water-limited regions.
In land, it is generally recognized that the E is limited by the amount of water supplied through P, leading to a smaller E than P. However, this may not be the case, especially at the seasonal scale (Held and Soden, 2006; Greve and Seneviratne, 2015). On seasonal time scales, E can exceed P, and the wet season becomes wetter and the dry season becomes drier (Kumar et al., 2015). In this context, there may be less reliable water availability for nature and humans (Kumar et al., 2014). Moreover, there may be greater dryness during dry season in the projected future climate scenarios, which may exert more serious negative effects on ecosystems (Kumar et al., 2014).
Compared with wet season, the dry-season water availability seems more important because of its key influences on vegetation status, ecosystem sustainability, and carbon cycles (Greve and Seneviratne, 2015; Murray-Tortarolo et al., 2016). For example, at the global scale, changes in dry-season water availability could exert profound influences on ecosystem production (Murray-Tortarolo et al., 2016) and impact food production (Kaewmai et al., 2021). However, currently, there are limited studies investigating changes in dry-season water availability changes and its drivers at different spatial scales (Padrón et al., 2020). This might be hindered by the quality of observation records and uncertainties of model simulations (Padrón et al., 2020) because, for example, there are large uncertainties in simulating E over land areas (Zhang et al., 2010a; Jung et al., 2011). The process-based models have been widely used to simulate E and proven as reliable tools in eco-hydrological studies (Yang et al., 2019; Zhao et al., 2019). For example, Leuning et al. (2008) improved the Penman-Monteith equation to estimate E by introducing a biophysical model for surface conductance for the physical features of canopy and soil water loss. The improved model is convenient because it only uses meteorological observations and remote sensing-based leaf area index as inputs, and has been widely used to estimate E at both regional and global scales (Zhang et al., 2010b; Bai et al., 2020; Zhange et al., 2020).
The Yellow River Basin (YRB), in the transitional zone of monsoon and continental climates, is one of the most important basins in China (Yin et al., 2021). The YRB directly supports more than 100 million people and is recognized as the Cradle of Chinese civilization (Jiang et al., 2020; Tian et al., 2021). With the rapid intensification of climate change and human activities, water shortage has become one of the most serious threats to sustainable development in the YRB (McVicar et al., 2007; Feng et al., 2016). Many studies have investigated the nature and human-induced changes in P (Wang et al., 2021; Zhang et al., 2021) and E in the region (Shao et al., 2019; Jiang et al., 2020; Liang et al., 2020). However, few studies have investigated the water availability over the dry season. To fill this knowledge gap, this study investigates the changes in dry-season water availability and its attributions in the YRB during 1982–2016. First, we defined the dry-season as the warm months from May to September of each year following (Padrón et al., 2020), and also aligned with the active vegetation growth season. We then investigated the changes in dry-season water availability (defined as the annual minimum monthly P–E) between past (1982–1999) and recent (2000–2016) periods. Last, we conducted an attribution analysis of changes in dry-season water availability.
Materials and Methods
Study Area
The Yellow River is the second largest river in China with 5,464 km. It originates from the Qinghai-Tibetan plateau and flows across nine provinces in northern China (Supplementary Figure S1). It is also the most important water source in northwestern and northern China. The YRB is characterized by arid and semi-arid continental monsoon climate with a mean annual precipitation of 495 mm (Yin et al., 2021) and a general decreasing trend from the southeast to the northwest. The mean annual air temperature ranges from approximately –4 to 14°C and varies with both latitude and elevation (–11 to 6,253 m). Similar to the spatial patterns of precipitation, the E also decreases from southeast to northwest (Jiang et al., 2020). Vegetation is rich and diverse, including alpine meadows and grasslands in the upper reaches, and the croplands and forests in the central and lower reaches (Tian et al., 2021). The YRB has long been at the center of political, economic, and social development concerns (Omer et al., 2021). Because of the degraded eco-environment and to control the soil and water erosion in the Loess Plateau (the middle reaches of the YRB), the Chinese government has implemented the ‘Grain-for-Green’ (GGP) program since the 1999 (Feng et al., 2016). The intense human activity and critical climate changes have significantly impacted the water resources and thus the social-economic development of the YRB (Feng et al., 2016). During the recent decades, the contradiction between water supply and demand has been increasingly prominent, and the drought disasters frequent (Wang et al., 2018; Zhou et al., 2021a). Therefore, the water resources and water availability have been key issues in the YRB (Wang et al., 2018). Understanding the spatiotemporal changes of water availability and its drivers will help efficiently manage the water resources in the basin.
Data
We used the Penman-Monteith-Leuning (PML) model (Penman, 1948; Leuning et al., 2008) to estimate E in the YRB during 1982–2016. The construction of PML required meteorological data, remote sensing data, land cover, and E validation data. The spatial meteorological data with a 0.1° resolution, including 2-m air temperature, surface pressure, specific humidity, wind speed, downward shortwave radiation, downward longwave radiation, and precipitation rate, were obtained from the China Meteorological Forcing Dataset (CMFD) of the Institute of Tibetan Plateau Research, Chinese Academy of Sciences (http://www.itpcas.ac.cn/) (Yang et al., 2010). The remote sensing leaf area index (LAI) data were collected from the Global Inventory Modeling and Mapping Studies (GIMMS) with a spatial resolution of 0.0833° and a 15-day temporal resolution (Zhu et al., 2013). The Global Land Surface Satellite (GLASS) albedo data were used to estimate the net radiation in this study. The land cover maps for 1980, 1995, 2000, 2005, and 2010, with a resolution of 1 km, were collected from the Institute of Geographic Sciences and Natural Resources Research, Chinese Academy of Sciences (Liu et al., 2005). To validate E, we first collected flux tower-based observations from measurement sites in and around the YRB (see Supplementary Figure S1). We then used monthly E data from the Global Land Evaporation Amsterdam Model (GLEAM) (Miralles et al., 2010) to validate the E for both the main sub-watersheds (Supplementary Figure S1; Supplementary Table S1) and the entire YRB.
Estimation of Evapotranspiration
Generally, E consists of three components: transpiration from plant canopy (Ec: mm/day), evaporation from soil (Es: mm/day), and evaporation from canopy interception (Ei: mm/day) (Eq. 1). The PML model was used to estimate Ec and Es across the YRB.
where λ is the latent heat of vaporization (MJ kg−1),
where k is the von Kármán constant; um (m s−1) is the wind speed at height zm (m); d is the zero plane displacement height (m); zom and zov are the roughness for momentum and water vapor, estimated by zom = 0.123 h and zov = 0.1 zom, where h is the canopy height; gsx is the maximum stomatal conductance, which is required for calibration; Qh is the PAR at the top of canopy height (MJ m−2 d−1); Q50 is the absorbed PAR; and D50 is the Da at which stomatal conductance reaches gsx/2.
We used the Priestley-Taylor Jet Propulsion Laboratory model (Fisher et al., 2008) to estimate Ei:
where
We calibrated gsx by comparing PML-E with flux tower-based observations and GLEAM-E (see Supplementary Table S2). Moreover, we also considered land use dynamics in the estimation of E to improve accuracy in both estimation and attributions (Zhang et al., 2020). The model performance and evaluation can be found in Supplementary Text S1 and Supplementary Figures S2, S3.
Definition of Dry-Season Water Availability
Following previous studies (Ghiggi et al., 2019; Padrón et al., 2020), we defined the dry-season water availability as the annual minimum monthly P–E. For each year, we identified the month with the lowest P–E during the warm period from May to September, leading to 1 min (P—E) per year. Then, the 1982–2016 was clipped into a past period (1982–1999) and a recent period (2000–2016). Because the YRB experienced an intense human activity since the 1999 due to the implementation of GGP, we clipped the time period into two similar time series with a point of 2000 to roughly estimate the revegetation effects on dry-season water availability. The use of similar time series could also partly reduce the uncertainties in analysis. We next computed at each grid cell the average min (P—E) in these two periods:
where y represents the individual year during 1982–1999 and 2000–2016.
We then compared the difference between
We used the ratio of the sum of P–E to the total P over the dry season to reflect the proportions of total available water resources. We used this index to analyze whether total dry-season water resources have changed between past and recent periods:
The difference of
Attribution Methods
We used the factorial experiment for attribution analysis. As seen from Equations 8 and 11, the changes of min (P—E) and (P—E)/P can be attributed to the changes in P and E between past and recent periods. For example, an increase in P and a decrease in E would favor an increase in dry-season water availability and water resources. Therefore, we identified the major contributor to dry-season water availability by fixing P or E at the conditions of past or recent periods. We further attributed the E changes via factorial experiments (Cheng et al., 2017; Shao et al., 2019; Yang et al., 2019). Specifically, we designed six modeling experiments. One with real E estimation with all varied climate variables and dynamic LAI and five control modelling experiments, which fixed only one contributing variable (i.e., Ta, LAI, VPD, Rn, and Wn) as the mean values during the period of 1982–1985 in each modelling experiment (Liang et al., 2020). This time series represented the mean climate and vegetation conditions of the 1980s. We chose a relatively short period (4 years) as the control period because we tried to keep original trends and variations of both climate and vegetation. The differences between the real and control experiments highlight the contributions of controlled variables to the total E changes (Liang et al., 2020; Zhang et al., 2020). For example, the main effects of Ta are calculated as:
Results
Change in Dry-Season Water Availability
Spatial pattern of changes in dry-season water availability, represented by min (P–E), from past (1982–1999) to recent (2000–2016) periods, shows that positive changes in min (P–E) were rare and only located in the upper and lower reaches (Supplementary Figure S1). Negative changes in min (P–E) were widespread especially in the middle basin regions (the Loess Plateau region). The largest decline in min (P–E) was found in the upper and middle regions with a maximum reduction of 23 mm month−1. The min (P–E) density distribution shifted to negative from past to recent periods, indicating that the min (P–E) during recent period was lower than during the past period (Figure 1C). In total, 89.6% of the YRB showed declines in min (P–E). The spatial changes in total dry-season water resource showed larger heterogeneity. Roughly equal areas showed negative (54.7%) or positive (45.3%) changes in (P–E)/P, leading to an overall neutral change (Figure 1B). However, many areas showed a larger total E than total P over the dry season, leading to a significant tail distribution during both past and recent periods (Figure 1D). In addition, changes in min (P–E) and (P–E)/P were positively correlated (r = 0.32 and p < 0.001).
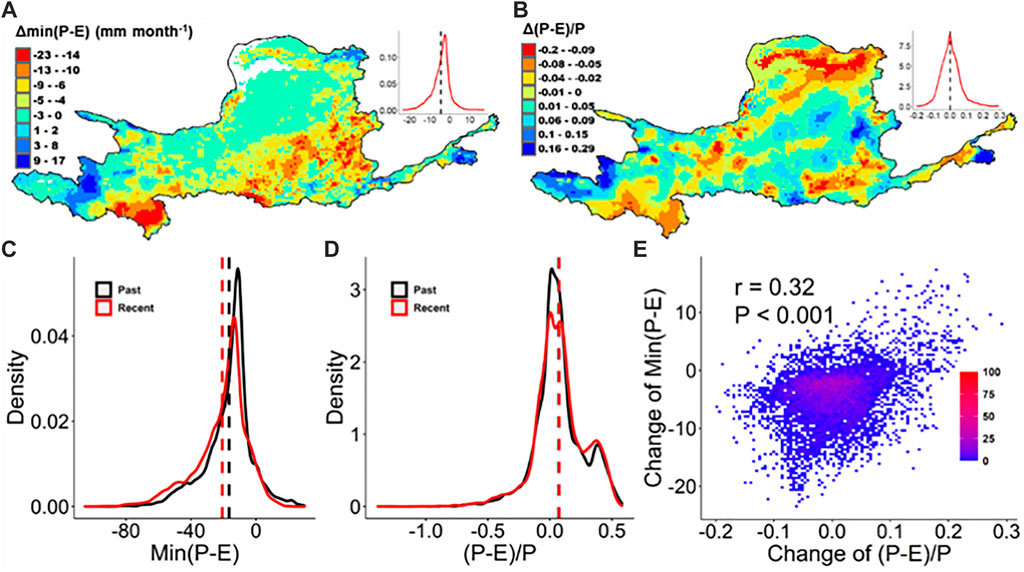
FIGURE 1. Change patterns in dry-season water availability. (A) Spatial pattern of changes in min (P–E) between past (1982–1999) and recent (2000–2016) periods. (B) Spatial pattern of changes in (P–E)/P between past and recent periods. (C,D) Density of min (P–E) and (P–E)/P in both past and recent periods. (E) Correlation (Pearson's r) between Δmin (P–E) and Δ(P–E)/P. P and E mean the precipitation and evapotranspiration, respectively.
Dry-Season Water Availability in Relation to P and E
Positive contributions of P to min (P–E) were majorly located in the upper reaches, whereas negative contributions were majorly located in the middle portions (the Loess Plateau region; Figure 2). The positive contribution ranged from 1 to 19 mm month−1, while the negative contribution up to −40 mm month−1. The ΔP contributed negatively to the min (P–E) with a mean of −15 mm month−1. The ΔE contributed negatively to min (P–E) across almost the whole YRB with the largest negative contributions in the middle portions. Only small areas in the southern margin showed positive contributions of E to min (P–E). Similar to ΔP, the ΔE contributed negatively to the change in min (P–E) with a mean of −17 mm month−1. The ΔP favored a decline in min (P–E) across 87.0% area of the YRB, whereas ΔE favored a decrease in min (P–E) across 99.0% area of the YRB. We also attributed the changing trend of dry-season water availability to changes in E and P during the study period (Supplementary Figure S4) via factorial simulations. Results showed that the dry-season water availability significantly decreased during the period of 1982–2016 with a rate of −0.24 mm/year (p < 0.001) (Supplementary Figure S4A). The attribution showed that changes in E contributed majorly to the decline in dry-season water availability (contributed to −0.22 mm/year), being much larger than that by P (−0.02 mm/year).
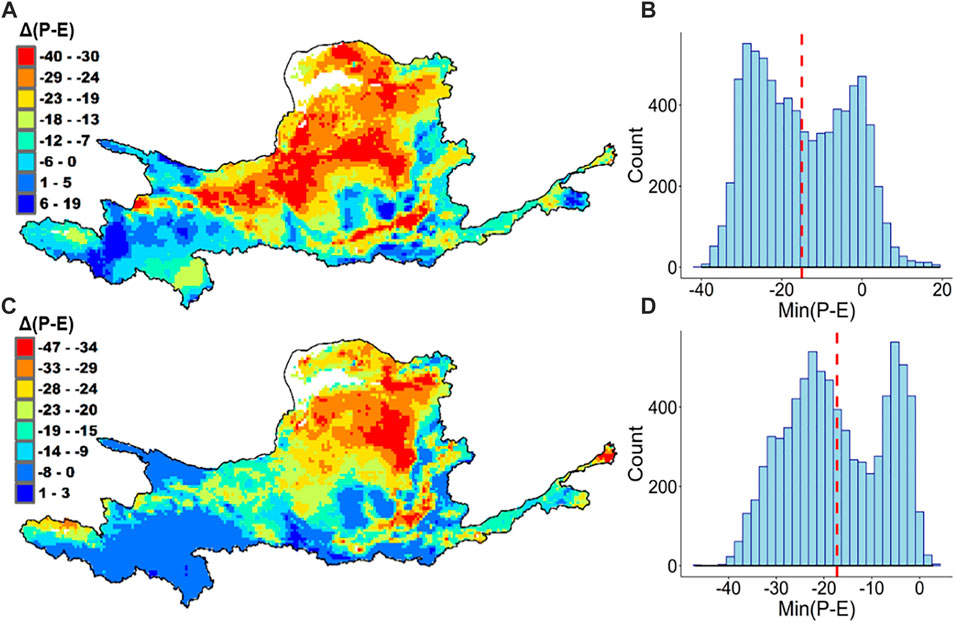
FIGURE 2. Contributions of P and E changes to Δmin(P–E) (dry-season water availability). (A,B) Spatial pattern of ΔP contribution to Δmin(P–E) and its corresponding density distribution. (C,D) Spatial pattern of ΔE contribution to Δmin(P–E) and its corresponding density.
The positive contributions of ΔP to Δ(P–E)/P were majorly concentrated in the upper and middle regions of the YRB with the magnitudes ranging from 0 to 0.57 (Figure 3). The negative contributions were majorly distributed in the marginal regions of the upper and middle reaches ranging from −0.01 to −0.25. The average contribution of ΔP to Δ(P–E)/P was positive and of 0.009 (Figure 3B). Negative contributions of ΔE to Δ(P–E)/P were found across the whole YRB, reaching −0.13. The positive contributions of ΔE to Δ(P–E)/P were majorly found in the upper and middle portions of the YRB. The ΔE favored a decrease in Δ(P-E)/P with a mean of −0.007. In total, ΔP favored roughly equal areas of decrease (50.2%) and increase (49.8%) in Δ(P–E)/P. However, ΔE favored a decrease in Δ(P–E)/P on 66.0% and an increase in Δ(P–E)/P on 34.0% areas of the YRB.
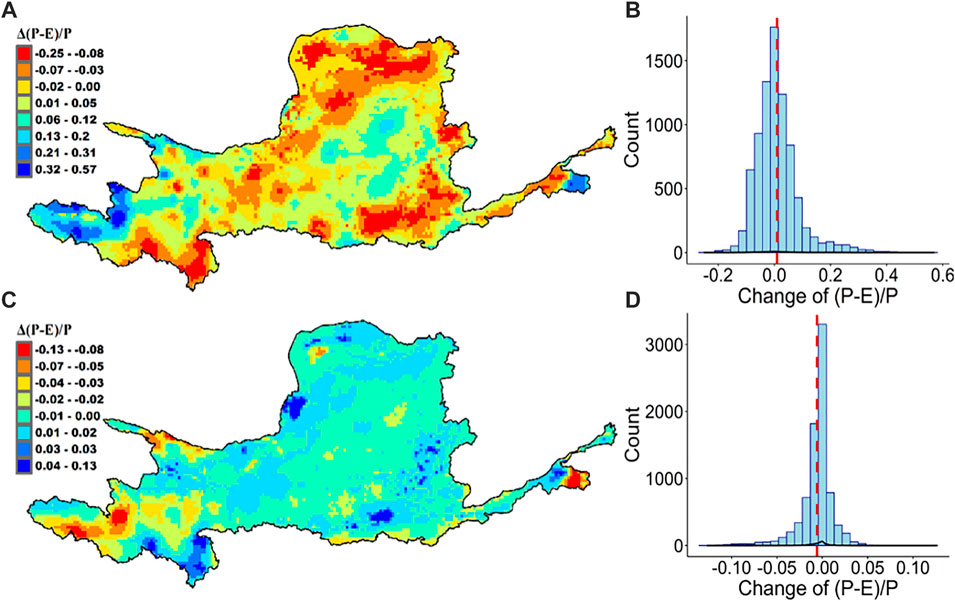
FIGURE 3. Contributions of P and E changes to Δ(P–E)/P (total dry-season water resources). (A,B) Spatial pattern of ΔP contribution to Δ(P–E)/P and its corresponding density distribution. (C,D) Spatial pattern of ΔE contribution to Δ(P–E)/P and its corresponding density distribution.
Dry-Season E Changes in Relation to Climate and Vegetation
ΔE in dry season were positive in most areas of the YRB (Supplementary Figure S5), with only 9.6% of the YRB showing decreases in E. Dry-season E changes were mainly attributed to climate and vegetation (Figure 4, see also Supplementary Figure S6). Increased air temperature (Ta) played the major role in the positive dry-season E changes, with a relative contribution of 46.2% (0.42 mm/year) (Supplementary Figure S6), followed by LAI with a relative contribution of 36.3% (0.33 mm/year) and VPD with to 19.8% (0.18 mm/year). The Rn and Wn played minor positive and negative roles in dry-season E variations, with contributions of 3.3% (0.03 mm/year) and −4.4% (−0.04 mm/year), respectively.
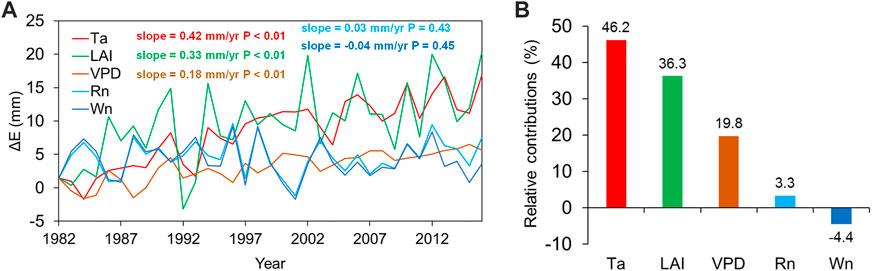
FIGURE 4. Climate and vegetation contributions to changes in dry-season E during the study period. (A) Net effects of climate and vegetation on dry-season E changes during the study period of 1982–2016 (B) their corresponding relative contributions. Ta, LAI, VPD, Rn, and Wn are air temperature, leaf area index, vapor pressure index, solar radiation, and wind speed, respectively. The dry-season E estimated with all varied variables showed a significant increase with a rate of 0.91 mm/yr.
Discussion
In this study, we used the annual monthly minimum P–E representing the water availability during the driest month in an individual year. Similar approaches have been in previous reports (Kumar et al., 2014; Kumar et al., 2015; Padrón et al., 2020). Our study found that nearly 90% of the YRB showed a decline in dry-season water availability, indicating a drier dry season, though the total water resources remained nearly unchanged due to increased P partly offsetting the increased E during the study period (1982–2016). Although this study focused on specific months, the decline in water resources found was in line with others (Bai et al., 2016; Jiang et al., 2020; Li et al., 2020). For example, Jiang et al. (2020) reported a significant increasing trend in annual E during 1981–2010 in the YRB, resulting in declined water resources. During recent decade, the water storage over the YRB also showed a significant decreasing trend (Jiang et al., 2019), which was majorly induced by the vegetation greening (Li et al., 2020). In the middle portion of the YRB, the E has significantly increased during the past 15 years and resulted in declines in total water resources (Shao et al., 2019; Shao et al., 2021). These findings together with our results have implications for ecosystem restoration and management in the YRB, because the decreased dry-season water availability may exert negative influences on vegetation growth and soil carbon sequestration. For example, changes in water availability over the dry season would affect the vegetation throughout the whole year and drive NPP (Net Primary Production) variations (Murray-Tortarolo et al., 2016). Moreover, changes in dry-season water storage may trigger the carbon flux from soil to atmosphere due to the drought stress (Humphrey et al., 2018). Therefore, when implementing the revegetation programs, the dry-season water availability must be taken into account, which has seldom been the case. In addition, declined dry-season water availability may further exacerbate the water stress in the YRB, which is originally water-limited (Jiang et al., 2020; Yin et al., 2021).
In comparison with P, changes in E contributed more to the decreased dry-season water availability, demonstrating the key role of E in net seasonal water flux. This finding was also consistent with previous reports by Padrón et al. (2020), who found that the E increases dominated the decreases in water availability in extratropical regions. The drier dry season was primarily attributed to the increased E in the YRB during the past 35 years, adding to other studies that highlight the importance of E for the onset and amplification of droughts (Seneviratne et al., 2012; Teuling et al., 2013). Dry-season E changes were attributed to increased air temperature (see Supplementary Figure S7), followed by vegetation greening (increased LAI) and increased VPD. The results were also in line with the findings of Li et al. (2021) for the Loess Plateau region (the middle portions of the YRB). On the one hand, increased air temperature could enhance both soil and plant evaporation, indirectly or directly increasing E. For example, the increased air temperature can elevate VPD and thus improve atmospheric water demand directly (Padrón et al., 2020). The increased LAI, which was caused by the revegetation program (Chen et al., 2015; Chen et al., 2019), could increase E through promoting plant transpiration and evaporation from intercepted precipitation (Donohue et al., 2010). The Rn and Wn played only minor roles in E variation. The YRB is a semi-arid region, where solar radiation is sufficient for E (Yang et al., 2019); thus, E variation may be little sensitive to changes in Rn. The positive effects of Wn on E during recent years (after 2007) may be offset by the decreased ones during the past period (1982–2006), leading to an overall negative effect on E variation.
This study is limited by some shortcomings. For example, we only considered five key factors in attributing E changes. However, other factors, such as the precipitation, carbon dioxide concentration, and water use efficiency, may also have played an important role in driving E change during the study period. As reported by Liang et al. (2020), the rapid urbanization and agricultural intensification have significantly promoted the E during the past several decades in the Loess Plateau region. Jiang et al. (2020) also found that the precipitation and relative humidity played an important role in E changes in the YRB during the period of 1981–2010. Additionally, in attributing dry-season E changes, we assumed that the influencing factors were independent without considering the interactions among them. Further study should consider more natural influencing factors to comprehensively identify the drivers of E change. Furthermore, in estimating E, the anthropogenic factors, such as the reservoir construction, were not taken into account, which may lead to uncertainties in E.
Our study have implications for water resources management in the YRB. Because there is a relatively higher demand of water resources for humans and society during the summer season, the decreased dry-season water availability could further exacerbate the water stress during the same time period. Therefore, the efficient water saving technology and water usage can be good approaches to alleviate the water deficit during the dry season in the YRB. For example, reducing E through appropriate measures, such as conservation tillage and improvement in irrigation system, reasonable planning of cultivating season, and scientific regulation of forest planting density, could alleviate the water stress in the context of increasing precipitation. In addition, more cautions should be paid to the dry-season water losses when implementing the revegetation programs considering the significant role of LAI on E changes.
Conclusion
This study quantified the changes in dry-season water availability and identified its drivers over the period of 1982–2016 in the YRB. The results show that the dry-season water availability, represented by monthly min (P–E), decreased over 89.6% area of the YRB during the 1982–1999 relative to the period of 2000–2016, but the total dry-season water resources remained unchanged. The increased dry-season E contributed majorly to the decreased dry-season water availability. The increased E was primarily driven by the increased air temperature (41.8%), LAI (30.8%), and VPD (19.2%). These findings highlight that the seasonal water fluxes must be paid more attention to make more comprehensive and efficient water resources management measures.
Data Availability Statement
The original contributions presented in the study are included in the article/Supplementary Material, further inquiries can be directed to the corresponding author.
Author Contributions
FZ conceived and designed the framework, performed the experiments, and wrote the paper. SM and YW contributed to data preparation and analysis.
Funding
This study was funded by the National Science Foundation of China (31961143011), the China Postdoctoral Science Foundation (2020M683451), the Strategic Priority Research Program of the Chinese Academy of Sciences (XDB40020205), the Shaanxi Major Theoretical and Practical Program (20ST-106), and the Innovation Team of Shaanxi Province (2021TD-52).
Conflict of Interest
The authors declare that the research was conducted in the absence of any commercial or financial relationships that could be construed as a potential conflict of interest.
Publisher’s Note
All claims expressed in this article are solely those of the authors and do not necessarily represent those of their affiliated organizations, or those of the publisher, the editors, and the reviewers. Any product that may be evaluated in this article, or claim that may be made by its manufacturer, is not guaranteed or endorsed by the publisher.
Acknowledgments
We thank the HPCC Platform in Xi’an Jiaotong University for computing equipment and computer maintenance. We appreciate the detailed suggestions and comments from the editor and reviewers.
Supplementary Material
The Supplementary Material for this article can be found online at: https://www.frontiersin.org/articles/10.3389/fenvs.2021.762137/full#supplementary-material
References
Arnold, J. G., Muttiah, R. S., Srinivasan, R., and Allen, P. M. (2000). Regional Estimation of Base Flow and Groundwater Recharge in the Upper Mississippi River Basin. J. Hydrol. 227 (1-4), 21–40. doi:10.1016/s0022-1694(99)00139-0
Bai, P., Liu, X., Liang, K., and Liu, C. (2016). Investigation of Changes in the Annual Maximum Flood in the Yellow River basin, China. Quat. Int. 392, 168–177. doi:10.1016/j.quaint.2015.04.053
Bai, P., Liu, X., Zhang, Y., and Liu, C. (2020). Assessing the Impacts of Vegetation Greenness Change on Evapotranspiration and Water Yield in China. Water Resour. Res. 56 (10). e2019WR027019. doi:10.1029/2019wr027019
Byrne, M. P., and O’Gorman, P. A. (2015). The Response of Precipitation Minus Evapotranspiration to Climate Warming: Why the "Wet-Get-Wetter, Dry-Get-Drier" Scaling Does Not Hold Over Land*. J. Clim. 28 (20), 8078–8092. doi:10.1175/jcli-d-15-0369.1
Chen, C., Park, T., Wang, X., Piao, S., Xu, B., Chaturvedi, R. K., et al. (2019). China and India Lead in Greening of the World Through Land-Use Management. Nat. Sustain. 2, 122–129. doi:10.1038/s41893-019-0220-7
Chen, Y., Wang, K., Lin, Y., Shi, W., Song, Y., and He, X. (2015). Balancing Green and Grain Trade. Nat. Geosci. 8, 739–741. doi:10.1038/ngeo2544
Cheng, L., Zhang, L., Wang, Y.-P., Canadell, J. G., Chiew, F. H. S., Beringer, J., et al. (2017). Recent Increases in Terrestrial Carbon Uptake at Little Cost to the Water Cycle. Nat. Commun. 8 (1), 110. doi:10.1038/s41467-017-00114-5
Dai, A., Qian, T., Trenberth, K. E., and Milliman, J. D. (2009). Changes in Continental Freshwater Discharge From 1948 to 2004. J. Clim. 22 (10), 2773–2792. doi:10.1175/2008jcli2592.1
Donohue, R. J., McVicar, T. R., and Roderick, M. L. (2010). Assessing the Ability of Potential Evaporation Formulations to Capture the Dynamics in Evaporative Demand Within a Changing Climate. J. Hydrol. 386 (1-4), 186–197. doi:10.1016/j.jhydrol.2010.03.020
Feng, X., Fu, B., Piao, S., Wang, S., Ciais, P., Zeng, Z., et al. (2016). Revegetation in China's Loess Plateau Is Approaching Sustainable Water Resource Limits. Nat. Clim Change. 6 (11), 1019–1022. doi:10.1038/nclimate3092
Fisher, J. B., Tu, K. P., and Baldocchi, D. D. (2008). Global Estimates of the Land-Atmosphere Water Flux Based on Monthly AVHRR and ISLSCP-II Data, Validated at 16 FLUXNET Sites. Remote Sensing Environ. 112 (3), 901–919. doi:10.1016/j.rse.2007.06.025
Ghiggi, G., Humphrey, V., Seneviratne, S. I., and Gudmundsson, L. (2019). GRUN: an Observation-Based Global Gridded Runoff Dataset From 1902 to 2014. Earth Syst. Sci. Data. 11 (4), 1655–1674. doi:10.5194/essd-11-1655-2019
Greve, P., and Seneviratne, S. I. (2015). Assessment of Future Changes in Water Availability and Aridity. Geophys. Res. Lett. 42 (13), 5493–5499. doi:10.1002/2015gl064127
Held, I. M., and Soden, B. J. (2006). Robust Responses of the Hydrological Cycle to Global Warming. J. Clim. 19 (21), 5686–5699. doi:10.1175/jcli3990.1
Humphrey, V., Zscheischler, J., Ciais, P., Gudmundsson, L., Sitch, S., and Seneviratne, S. I. (2018). Sensitivity of Atmospheric CO2 Growth Rate to Observed Changes in Terrestrial Water Storage. Nature. 560 (7720), 628–631. doi:10.1038/s41586-018-0424-4
IPCC (2014). Climate Change 2014: Impacts, Adaptation, and Vulnerability. Part A: Global and Sectoral Aspects. Cambridge, UK: Cambridge University Press Medicale, 1132, Available online at (http://www.ipcc.ch/pdf/assessment).
Jiang, Z.-Y., Yang, Z.-G., Zhang, S.-Y., Liao, C.-M., Hu, Z.-M., Cao, R.-C., et al. (2020). Revealing the Spatio-Temporal Variability of Evapotranspiration and its Components Based on an Improved ShuttleWorth-Wallace Model in the Yellow River Basin. J. Environ. Manage. 262, 110310. doi:10.1016/j.jenvman.2020.110310
Jing, W., Yao, L., Zhao, X., Zhang, P., Liu, Y., Xia, X., et al. (2019). Understanding Terrestrial Water Storage Declining Trends in the Yellow River Basin. J. Geophys. Res. Atmos. 124 (23), 12963–12984. doi:10.1029/2019jd031432
Jung, M., Reichstein, M., Margolis, H. A., Cescatti, A., Richardson, A. D., Arain, M. A., et al. (2011). Global Patterns of Land-Atmosphere Fluxes of Carbon Dioxide, Latent Heat, and Sensible Heat Derived From Eddy Covariance, Satellite, and Meteorological Observations. J. Geophys. Res. 116, G00J07. doi:10.1029/2010jg001566
Jung, M., Reichstein, M., Ciais, P., Seneviratne, S. I., Sheffield, J., Goulden, M. L., et al. (2010). Recent Decline in the Global Land Evapotranspiration Trend Due to Limited Moisture Supply. Nature. 467 (7318), 951–954. doi:10.1038/nature09396
Kaewmai, R., Grant, T., Mungkalasiri, J., and Musikavong, C. (2021). Assessing the Water Scarcity Footprint of Food Crops by Growing Season Available Water Remaining (AWARE) Characterization Factors in Thailand. Sci. Total Environ. 763, 143000. doi:10.1016/j.scitotenv.2020.143000
Kumar, S., Allan, R. P., Zwiers, F., Lawrence, D. M., and Dirmeyer, P. A. (2015). Revisiting Trends in Wetness and Dryness in the Presence of Internal Climate Variability and Water Limitations Over Land. Geophys. Res. Lett. 42 (24), 10867. doi:10.1002/2015gl066858
Kumar, S., Lawrence, D. M., Dirmeyer, P. A., and Sheffield, J. (2014). Less Reliable Water Availability in the 21st Century Climate Projections. Earth's Future. 2 (3), 152–160. doi:10.1002/2013ef000159
Leuning, R., Zhang, Y. Q., Rajaud, A., Cleugh, H., and Tu, K. (2008). A Simple Surface Conductance Model to Estimate Regional Evaporation Using MODIS Leaf Area Index and the Penman-Monteith Equation. Water Resour. Res. 44 (10), W10419. doi:10.1029/2007wr006562
Li, C., Zhang, Y., Shen, Y., and Yu, Q. (2020). Decadal Water Storage Decrease Driven by Vegetation Changes in the Yellow River Basin. Sci. Bull. 65 (22), 1859–1861. doi:10.1016/j.scib.2020.07.020
Li, T., Xia, J., Zhang, L., She, D., Wang, G., and Cheng, L. (2021). An Improved Complementary Relationship for Estimating Evapotranspiration Attributed to Climate Change and Revegetation in the Loess Plateau, China. J. Hydrol. 592, 125516. doi:10.1016/j.jhydrol.2020.125516
Liang, W., Zhang, W., Jin, Z., Yan, J., Lü, Y., Li, S., et al. (2020). Rapid Urbanization and Agricultural Intensification Increase Regional Evaporative Water Consumption of the Loess Plateau. J. Geophys. Res. Atmospheres. 125 (23). e2020JD033380. doi:10.1029/2020jd033380
Liu, J., Liu, M., Tian, H., Zhuang, D., Zhang, Z., Zhang, W., et al. (2005). Spatial and Temporal Patterns of China's Cropland During 1990-2000: An Analysis Based on Landsat TM Data. Remote Sensing Environ. 98 (4), 442–456. doi:10.1016/j.rse.2005.08.012
McVicar, T. R., Li, L., Van Niel, T. G., Zhang, L., Li, R., Yang, Q., et al. (2007). Developing a Decision Support Tool for China's Re-Vegetation Program: Simulating Regional Impacts of Afforestation on Average Annual Streamflow in the Loess Plateau. For. Ecol. Manag. 251 (1-2), 65–81. doi:10.1016/j.foreco.2007.06.025
Miralles, D. G., Gash, J. H., Holmes, T. R. H., de Jeu, R. A. M., and Dolman, A. J. (2010). Global Canopy Interception From Satellite Observations. J. Geophys. Res. Atmospheres. 115 (D16), D16122. doi:10.1029/2009jd013530
Murray-Tortarolo, G., Friedlingstein, P., Sitch, S., Seneviratne, S. I., Fletcher, I., Mueller, B., et al. (2016). The Dry Season Intensity as a Key Driver of NPP Trends. Geophys. Res. Lett. 43 (6), 2632–2639. doi:10.1002/2016GL068240
Oki, T., and Kanae, S. (2006). Global Hydrological Cycles and World Water Resources. Science. 313 (5790), 1068–1072. doi:10.1126/science.1128845
Omer, A., Zhuguo, M., Yuan, X., Zheng, Z., and Saleem, F. (2021). A Hydrological Perspective on Drought Risk-Assessment in the Yellow River Basin Under Future Anthropogenic Activities. J. Environ. Manage. 289, 112429. doi:10.1016/j.jenvman.2021.112429
Padrón, R. S., Gudmundsson, L., Decharme, B., Ducharne, A., Lawrence, D. M., Mao, J., et al. (2020). Observed Changes in Dry-Season Water Availability Attributed to Human-Induced Climate Change. Nat. Geosci. 13 (7), 477–481. doi:10.1038/s41561-020-0594-1
Penman, H. L. (1948). Natural Evaporation from Open Water, Bare Soil and Grass. Proc. R. Soc. Lond. A. 193 (1032), 120–145. doi:10.1098/rspa.1948.0037
Rockström, J., Falkenmark, M., Karlberg, L., Hoff, H., Rost, S., and Gerten, D. (2009). Future Water Availability for Global Food Production: The Potential of Green Water for Increasing Resilience to Global Change. Water Resour. Res. 45 (7), W00A12. doi:10.1029/2007wr006767
Seneviratne, S. I., Lehner, I., Gurtz, J., Teuling, A. J., Lang, H., Moser, U., et al. (2012). Swiss Prealpine Rietholzbach Research Catchment and Lysimeter: 32 Year Time Series and 2003 Drought Event. Water Resour. Res. 48 (6), W06526. doi:10.1029/2011wr011749
Shao, R., Zhang, B., He, X., Su, T., Li, Y., Biao, L., et al. (2021). Historical Water Storage Changes Over China's Loess Plateau. Water Resour. Res. 57, e2020WR028661. doi:10.1029/2020wr028661
Shao, R., Zhang, B., Su, T., Long, B., Cheng, L., Xue, Y., et al. (2019). Estimating the Increase in Regional Evaporative Water Consumption as a Result of Vegetation Restoration Over the Loess Plateau, China. J. Geophys. Res. Atmos. 124 (22), 11783–11802. doi:10.1029/2019jd031295
Teuling, A. J., Van Loon, A. F., Seneviratne, S. I., Lehner, I., Aubinet, M., Heinesch, B., et al. (2013). Evapotranspiration Amplifies European Summer Drought. Geophys. Res. Lett. 40 (10), 2071–2075. doi:10.1002/grl.50495
Tian, F., Liu, L-Z., Yang, J-H., and Wu, J-J. (2021). Vegetation Greening in More Than 94% of the Yellow River Basin (YRB) Region in China During the 21st Century Caused Jointly by Warming and Anthropogenic Activities. Ecol. Indicators. 125 (2), 107479. doi:10.1016/j.ecolind.2021.107479
Wang, F., Wang, Z., Yang, H., and Zhao, Y. (2018). Study of the Temporal and Spatial Patterns of Drought in the Yellow River Basin Based on SPEI. Sci. China Earth Sci. 61 (8), 1098–1111. doi:10.1007/s11430-017-9198-2
Wang, X., Zhang, B., Li, F., Li, X., Li, X., Wang, Y., et al. (2021). Vegetation Restoration Projects Intensify Intraregional Water Recycling Processes in the Agro-Pastoral Ecotone of Northern China. J. Hydrometeorology. 22, 6. doi:10.1175/jhm-d-20-0125.1
Yang, K., He, J., Tang, W., Qin, J., and Cheng, C. C. K. (2010). On Downward Shortwave and Longwave Radiations over High Altitude Regions: Observation and Modeling in the Tibetan Plateau. Agric. For. Meteorology. 150 (1), 38–46. doi:10.1016/j.agrformet.2009.08.004
Yang, Z., Zhang, Q., Hao, X., and Yue, P. (2019). Changes in Evapotranspiration Over Global Semiarid Regions 1984-2013. J. Geophys. Res. Atmos. 124 (6), 2946–2963. doi:10.1029/2018jd029533
Yin, L., Feng, X., Fu, B., Wang, S., Wang, X., Chen, Y., et al. (2021). A Coupled Human-Natural System Analysis of Water Yield in the Yellow River basin, China. Sci. Total Environ. 762, 143141. doi:10.1016/j.scitotenv.2020.143141
Zhang, B., Tian, L., Zhao, X., and Wu, P. (2021). Feedbacks Between Vegetation Restoration and Local Precipitation over the Loess Plateau in China. Sci. China Earth Sci. 64, 920. doi:10.1007/s11430-020-9751-8
Zhang, D., Liu, X., Zhang, L., Zhang, Q., Gan, R., and Li, X. (2020). Attribution of Evapotranspiration Changes in Humid Regions of China From 1982 to 2016. J. Geophys. Res. Atmospheres. 125 (13), e2020JD032404. doi:10.1029/2020jd032404
Zhang, K., Kimball, J. S., Nemani, R. R., and Running, S. W. (2010a). A Continuous Satellite-Derived Global Record of Land Surface Evapotranspiration From 1983 to 2006. Water Resour. Res. 46 (9), W09522. doi:10.1029/2009wr008800
Zhang, Y., Leuning, R., Hutley, L. B., Beringer, J., McHugh, I., and Walker, J. P. (2010b). Using Long-Term Water Balances to Parameterize Surface Conductances and Calculate Evaporation at 0.05° Spatial Resolution. Water Resour. Res. 46 (5), 1. doi:10.1029/2009wr008716
Zhao, F., Wu, Y., Sivakumar, B., Long, A., Qiu, L., Chen, J., et al. (2019). Climatic and Hydrologic Controls on Net Primary Production in a Semiarid Loess Watershed. J. Hydrol. 568, 803–815. doi:10.1016/j.jhydrol.2018.11.031
Zhou, K., Wang, Y., Chang, J., Zhou, S., and Guo, A. (2021a). Spatial and Temporal Evolution of Drought Characteristics Across the Yellow River basin. Ecol. Indicators. 131. 108207 doi:10.1016/j.ecolind.2021.108207
Zhou, S., Williams, A. P., Lintner, B. R., Berg, A. M., Zhang, Y., Keenan, T. F., et al. (2021b). Soil Moisture-Atmosphere Feedbacks Mitigate Declining Water Availability in Drylands. Nat. Clim. Chang. 11 (1), 38–44. doi:10.1038/s41558-020-00945-z
Zhu, Z., Bi, J., Pan, Y., Ganguly, S., Anav, A., Xu, L., et al. (2013). Global Data Sets of Vegetation Leaf Area Index (LAI)3g and Fraction of Photosynthetically Active Radiation (FPAR)3g Derived from Global Inventory Modeling and Mapping Studies (GIMMS) Normalized Difference Vegetation Index (NDVI3g) for the Period 1981 to 2011. Remote Sensing. 5 (2), 927–948. doi:10.3390/rs5020927
Keywords: climate warming, dry-season water availability, evapotranspiration, precipitation, water resources
Citation: Zhao F, Ma S and Wu Y (2021) Changes in Dry-Season Water Availability and Attributions in the Yellow River Basin, China. Front. Environ. Sci. 9:762137. doi: 10.3389/fenvs.2021.762137
Received: 21 August 2021; Accepted: 08 October 2021;
Published: 16 November 2021.
Edited by:
Maria Ilhéu, University of Evora, PortugalReviewed by:
XingYuan, Nanjing University of Information Science and Technology, ChinaMaria Filomena Magalhães, University of Lisbon, Portugal
Copyright © 2021 Zhao, Ma and Wu. This is an open-access article distributed under the terms of the Creative Commons Attribution License (CC BY). The use, distribution or reproduction in other forums is permitted, provided the original author(s) and the copyright owner(s) are credited and that the original publication in this journal is cited, in accordance with accepted academic practice. No use, distribution or reproduction is permitted which does not comply with these terms.
*Correspondence: Yiping Wu, cm9ja3kueXB3dUBnbWFpbC5jb20=