 Deng Zhi-li
 Zhang Qian-qian
 Zhang Xing-ying
94% of researchers rate our articles as excellent or good
Learn more about the work of our research integrity team to safeguard the quality of each article we publish.
Find out more
ORIGINAL RESEARCH article
Front. Environ. Sci., 18 October 2021
Sec. Atmosphere and Climate
Volume 9 - 2021 | https://doi.org/10.3389/fenvs.2021.761557
NH3 is an important part of the global nitrogen cycle as the most important atmospheric alkaline gas. NH3 reacts rapidly with acidic substances and accelerates the generation of particulate matter (PM2.5), which has important effects on the atmosphere and climate change. In this study, satellite NH3 column data were used to analyze spatial and temporal distributions of NH3 in China, and because of high concentrations and rates of change, North China was selected for more detailed analysis. Qualitative analysis was conducted to understand the relations between concentrations of NH3 and those of SO2 and NO2. Last, the random forest method was used to quantify relations between concentrations of atmospheric NH3 and factors influencing those concentrations, such as meteorological factors, NH3 self-emission, and concentrations of SO2 and NO2. Satellite-retrieved NH3 column concentrations showed an increasing trend during the 11 years from 2008 to 2018, and the rate of increase in summer was faster than that in winter. In those 11 years, NH3 self-emission had the greatest influence on NH3 concentrations. Concentrations of SO2 and NO2 had some effect and were negatively correlated with NH3 concentrations. The effect of SO2 on NH3 concentration was greater than that of NO2. Atmospheric NH3 concentration was also affected by meteorological conditions (temperature, relative humidity, pressure, and wind). In summer, temperature is the most important factors of meteorological conditions and relative humidity is the most important factors in winter. Therefore, to better control atmospheric NH3 concentrations, it is particularly important to formulate practical NH3 emission reduction policies and to consider the effects of SO2 and NO2 emission reduction policies.
On global and local scales, livestock emissions and extensive fertilizer use are major sources of atmospheric NH3 Galloway (2005). As one of the important precursors of reactive nitrogen (Nr) compounds, NH3 is an important component of the global N cycle (Sutton et al., 2008). Atmospheric NH3 is the most important alkaline gas and reacts rapidly with sulfuric and nitric acids, and it also accelerates the production of particulate matter (PM2.5) discharged into the atmosphere (Malm et al., 2004). NH3-produced PM2.5 leads to 1.3 million premature deaths in China each year. In the United States, the public health loss caused by NH3 is estimated at $36 billion per year (Guo et al., 2020). NH3 also affects the climate, because generated aerosols produce negative radiative forcing that affects the global radiation balance (Charlson et al., 2017). The surface deposition of NH3 greatly alters the environment by causing problems such as soil acidification, eutrophication of water bodies, and decline in biodiversity. Therefore, it is particularly important to analyze NH3 temporal and spatial trends and quantify the factors that influence NH3 concentrations in order to better understand the sedimentation mechanism of NH3 and formulate relevant emission reduction policies.
NH3 is a short-lived gas with a life span of only a few hours, and the concentration is generally low; for example, minimum concentrations are less than 1 ppb. These characteristics lead to large differences in temporal and spatial distributions of atmospheric NH3. NH3 emissions to the atmosphere are affected by local agricultural activities and weather factors such as temperature, pressure, and humidity (Bouwman et al., 1997). Studies show that SO2 and NO2 emissions can also affect atmospheric NH3 concentrations (Pinder et al., 2008; Yu et al., 2018). Because of these factors, it is difficult for observation methods, such as those ground-based with low spatial resolution, to generate the data required for detailed analysis of NH3 concentrations. However, with the development of satellite remote sensing technology, satellites can provide long-term high spatial resolution NH3 concentration data on a global scale. Satellite instruments can fill observation gaps by providing daily global distributions and can be used to quantify spatial–temporal distributions and factors influencing NH3 concentrations. Observations from the Infrared Atmospheric Sounding Interferometer (IASI) and the Tropospheric Emissions Spectrometer (TES) were used to obtain atmospheric NH3 concentrations, respectively, and then, spatial and temporal distributions of NH3 were analyzed (Shephard et al., 2011; Van Damme et al., 2014; Van Damme et al., 2015b; Damme et al., 2020). Satellite data have also been used in combination with ground-based observation and model simulation data to analyze temporal and spatial distribution trends in NH3 concentrations in Colorado, USA, and NH3 profiles in different seasons (Li et al., 2016).
At present, the effect of NH3 concentration is primarily analyzed qualitatively from two aspects: meteorological conditions and SO2 and NO2 emissions. Schiferl et al. (2016) used satellite retrieval data and model simulation data to evaluate the NH3 trend in the United States and concluded that meteorological factors and SO2 and NO2 emissions affected atmospheric NH3 concentrations. Liu et al. (2018) used model simulation to analyze the influence of SO2 and NO2 emissions on NH3 concentrations and concluded that NO2 emissions had limited effect on increasing NH3 concentrations. Warner et al. (2017) examined the temporal and spatial distributions of NH3 and then conducted correlation analyses with several important influencing factors. However, although there are large differences in NH3 concentrations between cold and warm seasons, previous studies did not consider the influence of different seasons on NH3. Liu et al. (2017b) accounted for the influence of seasonal factors in seasonal trend analyses of NH3 and NO2 concentrations, but specific relations between them were not identified. Amount of NH3 emissions is another important factor that affects NH3 concentrations, but amounts are not easy to determine because of the different proportions from different emission sources in different regions. There is great uncertainty in estimated amounts of NH3 emissions, and there are large errors in the current emission inventory data, with global emission inventory error reaching 50% (Galloway et al., 2008). Local error may be even greater. Thus, it remains very difficult to accurately quantify the effects of different emission sources on NH3 concentrations. So in this study, Time stamp data and day_of_year data (the day of the year) were used to represent changes in NH3 emissions between years and during a year separately. In this way, the relationship between NH3 emissions and NH3 concentration can be expressed, and the changes of NH3 emissions can even be indirectly reversed through the observation of NH3 concentration.
According to (Warner et al., 2017), different factors affect NH3 concentrations in different regions. Therefore, when analyzing influencing factors, it is beneficial to narrow the study area to draw more accurate conclusions. Thus, in this study, following an analysis that included all of China, North China was selected as the research area. North China was selected because high levels of agricultural activities led to NH3 concentrations that were higher than those in other regions in China. In addition, because North China has a developed economy, dense population, and abundant NH3 emission sources, it is particularly important to analyze the key factors affecting NH3 concentrations.
In this paper, NH3 concentration data were obtained from the Infrared Atmospheric Sounding Interferometer (IASI), and the spatial distribution trend of NH3 was analyzed for the 11 years from 2008 to 2018. North China (32°N-42°N, 110°E-120°E) was the focus of analysis because NH3 concentrations were high and the changing trend was obvious. Time series analysis of NH3 was also conducted in cold and warm seasons using annual average and monthly average data. On the basis of time series analysis, annual average concentration trends of SO2 and NO2 were analyzed in cold and warm seasons separately, and correlations were performed between concentrations of the two gases and those of NH3. To further understand the influence of different factors, a random forest model was used to quantify the effects of each of the meteorological factors and NH3 emissions and SO2 and NO2 concentrations on NH3 concentrations in different seasons.
The IASI is an infrared Fourier transform spectrometer that observes the infrared radiation emitted by the atmosphere and the surface in the wave number range of 645 to 2,760 cm−1 without gaps, with a spectral resolution of 0.5 cm−1, and 8,461 total channels. Overpass times are 0930 and 2130 mean local solar time. Radiometric resolution is 0.1–0.5 k, and the spectral noise is 0.15–0.2 k, at 950 cm−1 wave number and 280 k. Van Damme et al. (2014), Van Damme et al. (2015a) used satellite inversion results to compare IASI sensor data with LOTOUS model simulation results and ground-based observations respectively to verify that the accuracy of IASI data is stable. In this paper, the IASI ANNI-NH3-v2.1R-1 dataset with a spatial resolution of 0.25° × 0.25° (25 km) was used to represent NH3 column concentration. In the inversion process, the initial meteorological data were from the ERA5 ECMWF reanalysis dataset, and the dimensionless value Hyperspectral Range Index (HRI) was converted into NH3 concentration based on a neural network algorithm (Dammers et al., 2017). In this paper, the data from 2008 to 2018 were divided into cold (January to March and October to December) and warm (April to September) seasons for analysis. The cloud amount was screened, and the points with cloud coverage less than 30% were selected for analysis.
Level-3 OMSO2e planetary boundary layer volume column density (VCD, unit is DU) data obtained from the Ozone Monitoring Instrument (OMI) were used to represent the SO2 data. Data obtained were also from 2008 to 2018 and were used to analyze cold and warm seasons separately. The L3 data were obtained by excellent pixel screening of OMI L2OMSO2 data, which excluded the influence of clouds, observation angles, and ground conditions. The accuracy is higher than L2 data, and the spatial resolution is 0.25° × 0.25°.
The NO2 data were obtained from the OMI L3 OMNO2d data, which are filtered by the cloud coverage rate of 30%, and the units are mole/cm2. In spatial–temporal analyses, the daily data were processed into annual average data in cold and warm seasons separately, as NH3 data.
Meteorological data were from the ERA5 land hourly data of the European Centre for Medium-Range Weather Forecasts. The dataset included data from 1981 to the present. The combination of model simulation data and observational data provides more accurate reanalysis data. Data at 0200 and 1400 UTC were selected as the meteorological data based on local overpass times of METOP at 0930 and 2130 and had a spatial resolution of 0.1° × 0.1°. Temperature, relative humidity, pressure, windu and windv were selected as the influencing factors of NH3 concentration. Windu represents the eastward component of the wind, and windv represents the northward component of the wind, these two parameters can be combined to get the speed and direction of the horizontal wind.
Annual average and 7-days sliding average data were used to analyze the trend in NH3 concentrations for 11 years in cold and warm seasons. Because the trend in NH3 concentration was nonlinear, the annual average change rate in NH3 concentration r was defined according to Equation 1. The equation accounts for the year-to-year change in NH3 concentration (Liu et al., 2017a). Considering rates of change in NH3 concentration before and after 2011, the 11-years dataset was divided into two parts.
The random forest method is an ensemble learning algorithm composed of many classifications. In the 1980s, Breiman invented the classification tree algorithm, and by repeatedly dichotomizing data for classification or regression, the amount of calculation is greatly reduced. Decision trees can be an efficient means to obtain nonlinear relations between variables. In 2001, classification trees were combined into a random forest (Breiman, 2001). In this process, variables (columns) and data (rows) are used randomly to generate many classification trees that are then aggregated. The random forest method is simple and fast with high prediction accuracy and is currently widely used in environmental studies to analyze factors influencing meteorological data (Wang et al., 2020; Zhang et al., 2020). A random forest model was also used with special conditions to quantify the effects of anthropogenic emissions on NH3 concentrations during the epidemic (He et al., 2021).
Time stamp data were used to represent changes in NH3 emissions between years, and day_of_year data were used to represent changes in NH3 emissions during a year. Meteorological elements (temperature, pressure, wind speed, wind direction and relative humidity) and SO2 and NO2 concentrations were selected as factors influencing NH3 concentrations. These influencing factors combined with NH3 concentrations formed a dataset. Data for the 11 years were first divided into cold and warm seasons and then processed using a 7-day sliding average. Data were then divided into training and validation sets randomly according to the ratio of seven to three. The training set as the input of the random-forest model was used to train the random forest model, and the validation set was used to test the accuracy. R2 was calculated to indicate the significance of the model. For verification, the model qualification standard was 0.85. Only if R2 is greater than 0.85, the trained model can be used for the prediction of NH3 concentration. Finally, the trained model can be used to simulate and predict NH3 concentrations in any artificially settings.
After the model was established, data on influencing factors could be changed and NH3 concentrations predicted in the simulated environment. The 2008 data were used as the baseline, assuming that each kind of meteorological data, SO2 and NO2 concentrations and emission data were always in the state of 2008, respectively. Different meteorological data were also discussed separately. Other data were not processed, and then, the NH3 concentration was predicted in the changed conditions. The purpose of ensuring that data remained unchanged in 2008 was to verify the influence of various factors on inter-annual changes, while ignoring the changes caused by changes during a year. Predicted results were compared with NH3 concentration data predicted by real data in order to eliminate systematic errors in the random forest model prediction process to the greatest extent. Differences represented the changes in NH3 concentration caused by fixing various influencing factors. Eq. 2 defines the variable contribute, which represents the influence of changes in various influencing factors on NH3 concentration. The value of contribute is equal to the predicted rate of change (PRC) divided by the true rate of change (TRC). With fixed meteorological data, results represented the effects of meteorological conditions. With fixed unix data, results represented the effect of NH3 emission, and with fixed SO2 and NO2 data, results represented the effects of SO2 and NO2. Because the calculated influences of the various influencing factors are relative values, it is necessary in a final step to normalize the percentages of calculated influences on NH3 concentrations. Thus, the sum of influencing factors contributions is 1.
Annual average values from 2008 to 2018 in each grid were used to obtain Figure 1, which shows the spatial distribution of NH3 concentration in mole/cm2 in the east ofChina during cold and warm seasons. Figure 2 is a map of the rate of change in NH3 volume mixing ratio computed using linear regression in each 0.25° × 0.25° latitude–longitude grid cell, and the point with significant linear trend was marked with a red cross. NH3 concentration (Figure 1) and rate of increase in NH3 concentration (Figure 2) were higher in North China than in other regions. These results are consistent with high NH3 emissions due to intensive fertilizer use and livestock activity in North China (Huang et al., 2012). The eastern part of Sichuan and central parts of Shaanxi and Hubei were also areas with highest NH3 concentrations as well as high rates of change, which might be primarily associated with NH3 emissions from rice cultivation. There was also a large area of relatively high NH3 concentration in Xinjiang, which was likely associated with management of sheep manure (Huang et al., 2012). Some other regions of China also had sporadic high NH3 concentrations, although the rate of change in NH3 concentration was low. The Qinghai–Tibet Plateau had the lowest NH3 concentrations, which also has a small amount of arable lands and low nitrogen fertilizer use. NH3 concentrations and rates of increase were generally higher in the warm season than in the cold season, and compared with other regions in China, the contrast between cold and warm seasons was most obvious in North China. Maximum NH3 concentration in summer during the 11 years was 4.5 e16 mole/cm2, whereas the maximum in winter during the same period was 3.5 e16 mole/cm2. Both maximums were in North China. The maximum change rate in NH3 concentration in summer was 3.6 e15 mole/cm2. yr, whereas the maximum change rate in winter was 3.2 e15 mole/cm2. yr. Both maximums also occurred in North China. High concentrations and rates of change occurred primarily in North China because of the developed economy, dense population, and many types of NH3 emission sources, especially large amounts of agricultural emissions. Therefore, because of high NH3 concentrations, high change rates, and obvious differences between cold and warm seasons, the North China region was selected as the main area of research focus. Time series analysis of NH3 concentrations was performed, and on that basis, qualitative and quantitative analyses of NH3 concentrations were conducted.
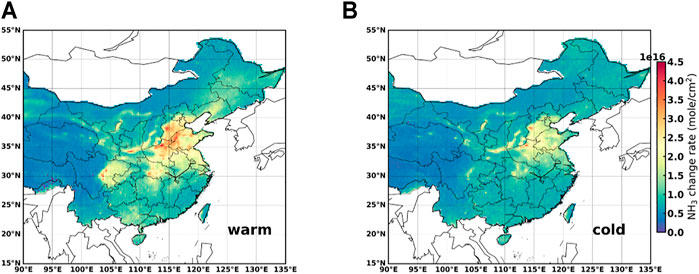
FIGURE 1. Spatial distributions of annual NH3 concentrations in (A) warm and (B) cold seasons in the east of China.
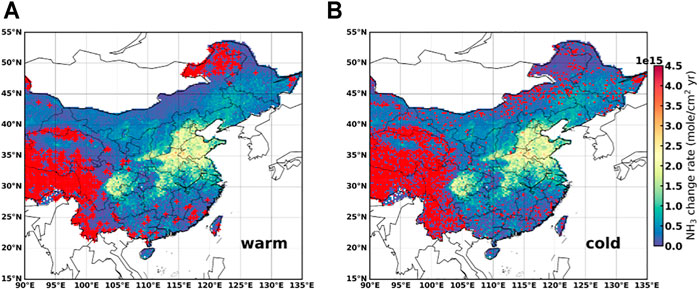
FIGURE 2. Rates of change in annual NH3 concentrations in (A) warm and (B) cold seasons in the east of China. The point with significant linear trend is pointed with red cross.
In the region of North China, It can easily find that the NH3 concentration (Figure 1) presents a decreasing trend distribution from the center to the surroundings. The high-value center is located at the junction of Hebei, Henan and Shandong province. No matter in both cold and warm seasons, maximum NH3 concentration all occur in Henan province, The NH3 concentration in warm season is higher than that in cold season. The change rate of NH3 concentration (Figure 2) has a similar distribution characteristics. It can easily find that the NH3 concentration has increased significantly. However, the linear trend of growth is not significant, especially in warm season. Only a few points (red cross) have a p-value greater than 0.85. So we have defined a new way (Eq. 1) to express the rate of change in time series analysis. The unit of this is not mole/cm2. yr any more, the unit should be “%”.
Figure 3A shows the yearly mean IASI NH3 Volume Mixing Ratio (VMRs) in North China from 2008 to 2018 separately for warm and cold seasons. Pink and gray solid lines represent 7-days moving average data to show inter-annual changes in NH3 in warm and cold seasons, respectively. Seasonal changes were apparent, and especially in the warm season, there were greater fluctuations in NH3 concentrations. The maximum NH3 concentrations occurred in June and July each year, which might be related to the meteorological conditions during those months. The orange solid line represents annual average data indicating the trend in NH3 concentration in the warm season, whereas the blue solid line represents the trend in the cold season. NH3 concentrations and rates of increase in summer were significantly higher than those in winter. The change rate over 11 years in summer was 106.7% (change_warm), whereas that in winter was approximately half of that in summer, at 54.7% (change_cold). After 2011, the rate of increase in NH3 concentration accelerated, especially in summer, with the increase almost exponential. Before 2011, the NH3 concentration in the warm season increased by 5.38% (r_warm08-11) per year, whereas there was a slight downward trend in the cold season, with a change rate of −0.59% (r_cold08-11) per year. After 2011, NH3 concentration increased by 8.93% (r_warm11-18) per year in the warm season and by 6.9% (r_cold11-18) per year in the cold season, the trend of ammonia is similar to other research (Liu et al., 2017a; Warner et al., 2017). As an important atmospheric alkaline gas, NH3 reacts with atmospheric SO2 and NO2, and therefore, increases in NH3 concentration may be related to decreases in SO2 and NO2 concentrations. An inflection point in the trend was apparent, which might be related to policies limiting SO2 and NO2 emissions promulgated around 2011. Therefore, the trends in atmospheric SO2 and NO2 concentrations were analyzed further.
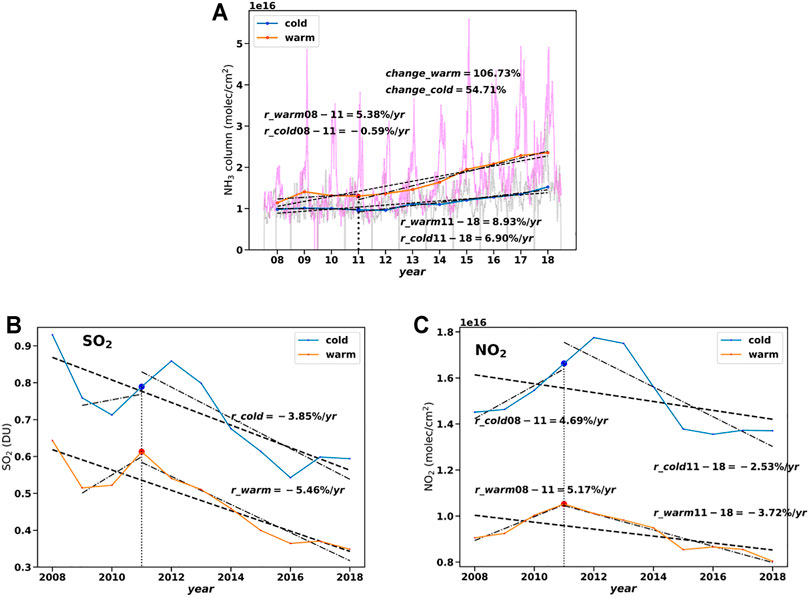
FIGURE 3. Recent (11 years from 2008 to 2018) trends in NH3 concentrations (A) and factors of influence SO2 (B) and NO2 (C) in cold and warm seasons in North China.
Trend analysis was performed on SO2 and NO2 concentrations, and yearly mean VMRs of SO2 (Figure 3B) and NO2 (Figure 3C) were plotted under the same space–time conditions. Overall, the trends in SO2 and NO2 concentrations were downward, in contrast to the trend in NH3 concentrations. Both gases also exhibited inflection points in 2011. During the 11 years, SO2 concentrations decreased by 45.8% in the warm season and by 36.1% in the cold season, whereas NO2 concentrations decreased by 11.2% in the warm season and by 5.56% in the cold season. Thus, the decreases were greater in the warm season than in the cold season. However, SO2 and NO2 concentrations in the cold season were higher than those in the warm season, which was the opposite of lower NH3 concentrations in winter than in summer. In addition, before the inflection point in 2011, there was a trend of increase in NO2 concentration. Before 2011, the rate of increase in NO2 concentration in cold and warm seasons was 4.69 and 5.17%, respectively, and the changing trends in SO2 and NO2 concentrations were not consistent. After 2011, the trend in NO2 concentrations was downward, with rates of decline in cold and warm seasons of −2.53% and −3.72%, respectively. The concentration of SO2 also showed a downward trend.
China’s pollution control regulations are issued in 5-year increments, and during the 11th Chinese Five Year Plan (FYP) period (2006–2010); the Chinese government implemented a series of strategies to reduce SO2 emissions. During the 12th Chinese FYP period (2011–2015) more stringent strategies were implemented to control both SO2 and NO2 (China Statistical Yearbook, http://www.stats.gov.cn/). Therefore, SO2 concentrations always showed a trend of decrease, whereas NO2 concentrations only started to decrease after 2011. The vertical dashed line drawn from 2011 point on the x-axis intersects the trend line at two points and they were marked on the chart. This decrease may be one reason for the increased rate of increase in NH3 concentration after 2011. In the two time periods before and after the inflection point in 2011, there were no significant differences in the rates of increase and decrease in SO2 and NO2 in cold and warm seasons. In the absence of differences, it is difficult to explain why NH3 increased significantly faster in summer than in winter after 2012. Thus, further quantitative analysis and consideration of the influence of meteorological conditions on NH3 concentrations are needed.
Based on qualitative analysis, the random forest algorithm was used to quantify the effects of influencing factors on atmospheric NH3 concentrations in cold and warm seasons. Those factors included meteorological factors, NH3 emissions, and concentrations of SO2 and NO2. In Figures 4, 5, blue columns represent annual average NH3 concentration under real conditions, and the NH3 trend was consistent with that in the time series analysis. Red bars represent the predicted NH3 concentration when an influencing factor was changed and fixed at the state of 2008. The difference between the two represents the effect of a particular influencing factor on NH3 concentrations. Dotted and dashed lines in Figures below indicate trends in NH3 concentration under actual and predicted scenarios, respectively. Because linear trends in NH3 concentrations were not obvious, difference in slope was not a good representation of the effect of an influencing factor on NH3 concentration. The contribute shown in Figures was calculated according to Eq. 2. The normalized results shown in the Table 1 can represent the relative influence of each influencing factors on NH3 concentration. Figure 4 presents the result of fixing different meteorological factors. Figure 5 present the result of fixing other factors expect for meteorological.
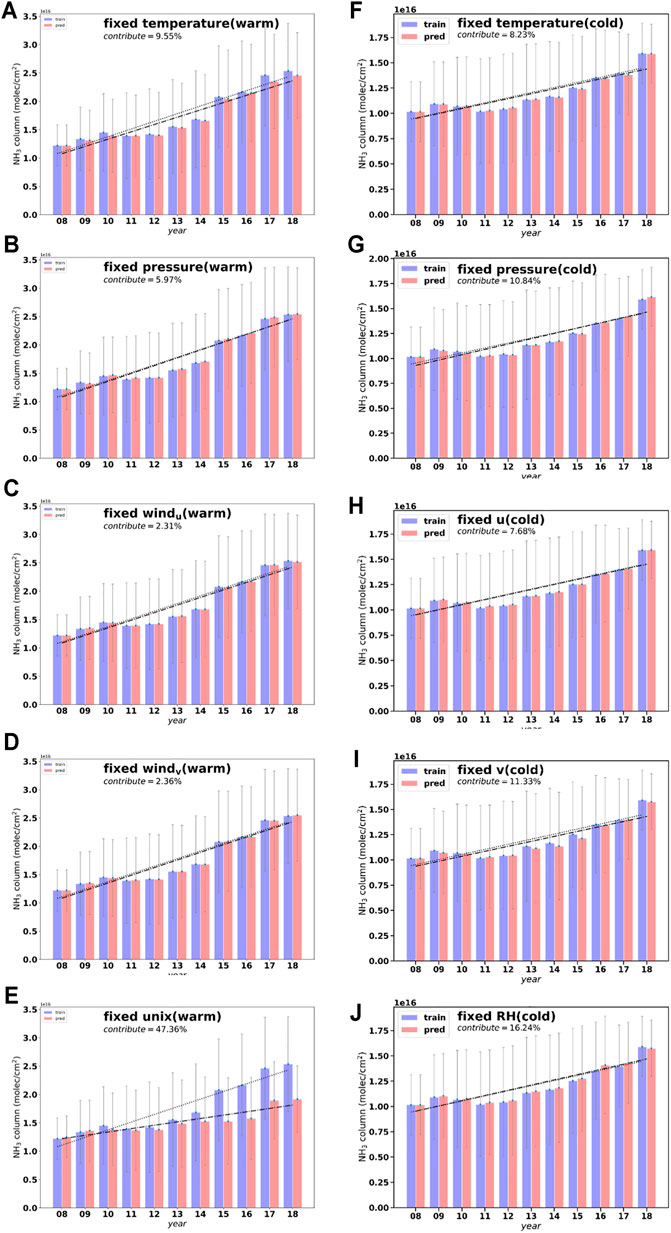
FIGURE 4. Results of random forest models on meterological factors that influence NH3 concentrations in North China. Blue columns represent annual average NH3 concentration under real conditions. Red bars represent the predicted NH3 concentration when an influencing factor was changed and fixed at the state of 2008. Dotted and dashed lines represent indicate trends in NH3 concentration under actual and predicted scenarios, respectively.
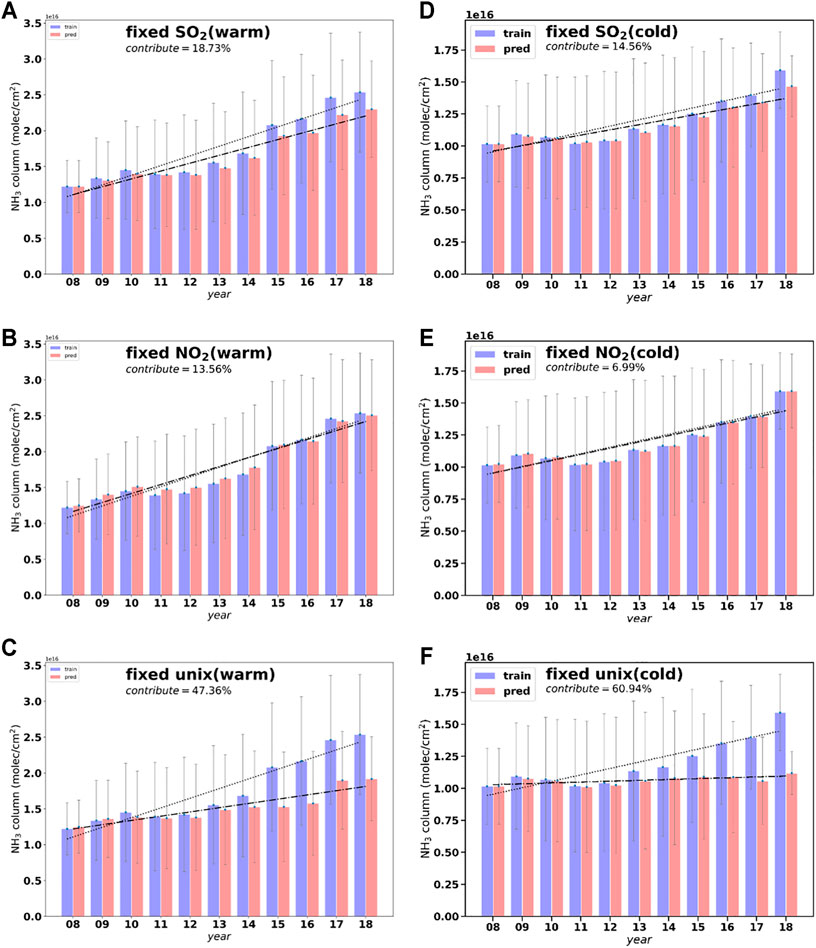
FIGURE 5. Results of random forest models on other factors that influence NH3 concentrations in North China.
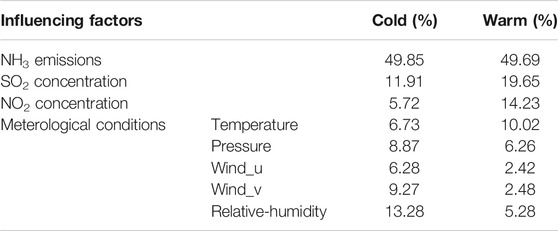
TABLE 1. The degree of influence of acid gas emissions, NH3 emissions and meteorological conditions on NH3 concentration after normalized.
NH3 emissions had the greatest effect on NH3 concentrations in both cold and warm seasons, contributing 49.85 and 49.69% to the NH3 concentration in cold and warm seasons, respectively. Atmospheric NH3 was also influenced by meteorological conditions (temperature, pressure, and wind), In warm season, the most important factor is temperature, it can lead to a change of NH3 concentration of 10.02%, however, in cold season, it only cause 6.73% change of NH3 concentration. In cold season, the most important factor is relative humidity. It can cause 13.28% change of NH3 concentration, and in warm season, it only change 5.28%. There is no obvious contrast between other factors in the cold and warm seasons. Concentrations of SO2 and NO2 also affected NH3 concentration, to some extent. Their concentrations were negatively correlated with those of NH3, and the effect of SO2 on NH3 was greater than that of NO2, In this study, concentrations of SO2 caused a change in NH3 concentration of 19.65% in the warm season and 11.91% in the cold season. Concentrations of NO2 caused a change in NH3 concentration of 14.23% in the warm season and 5.72% in the cold season, (Liu et al., 2018) shows that SO2 has a greater impact on NH3 concentration than NO2 when the emission of NH3 is small, which maybe related to ozone photochemical reaction. Besides, summer has greater influence than other seasons. Compared with the result of this study, without the limitation of NH3 emission, this study also gets similar results. Yu et al. (2018) only considered the impact of acid gases on NH3 concentration, and it got a conclusion that SO2 affects two thirds of the NH3 concentration and NO2 affects one third. Those results could explain why before 2011, the overall trend in NH3 concentration depended on the trend in SO2 and was opposite to that trend. The results could also explain why the change rate in NH3 before 2011 was lower than that after 2011. What’s more, the effect of these two gases is greater in the warm season than in the cold season. This may be related to the rapid rate of chemical reaction caused by the high temperature in summer. Schiferl et al. (2016) used Geos-Chem model to analyze the impact of ammonia in the U.S., the results show that meteorological factors have a greater impact on NH3 concentration than acid gases, however, NH3 emission have little effect. It is different from this article, which maybe caused by regional differences (Warner et al., 2017). Warner et al. (2017) carried out key analysis on several places with high NH3 concentration, It indicated that over the U.S., the increase results from a combination of acid gases and temperatures. Over China, acid gases, temperatures, and fertilizer use all play a role.
The random forest results in Figure 4 show the relative magnitude of the effect of each influencing factor on NH3 concentration. The contribution of each influencing factor to NH3 concentration was determined separately in cold and warm seasons, because there was no mutual relation between the two seasons. Whether cold or warm season, the most important factor influencing atmospheric NH3 concentrations was the emission of NH3. After 2011, when there were no significant differences in the rates of change in SO2 and NO2 concentrations, the rate of increase in NH3 concentration was clearly higher than that in winter, indicating temperature might be an important factor. In addition, NH3 emissions in the cold and warm seasons will affect half part of the NH3 concentration, playing a decisive role in NH3 concentration. However,. there are many types of NH3 emissions, and the types of emission sources in cold and warm seasons are not the same, so, it was difficult to establish the emission inventory, and the effects of different emission sources on NH3 concentrations were not easy to determine. Emissions of NH3 had the greatest effect on NH3 concentrations. Therefore, a more detailed understanding of the effects of different emission sources on atmospheric NH3 is necessary to increase understanding of changes in NH3 concentrations and help formulate relevant emission reduction policies.
In this paper, the spatial distribution of NH3 concentration in China was analyzed, and then, North China was selected as the area of focus because of its high and clearly increasing NH3 concentrations. In addition, there were clear differences in NH3 concentrations between cold and warm seasons. Temporal distributions of atmospheric NH3 concentrations and the influencing factors were analyzed, which included NH3 emissions, meteorological conditions (temperature, pressure, and wind), and SO2 and NO2 concentrations. The conclusions of the study were the following:
1. Within China, NH3 concentrations in North China were generally higher than those in surrounding areas, and the rate of change was rapid. The eastern part of Sichuan and central parts of Shanxi and Hubei were also areas with maximum NH3 concentrations. Sporadic high NH3 concentrations were also detected in other regions of China. Overall, NH3 concentration and rate of change in concentration were higher in summer than in winter.
2. Atmospheric NH3 concentrations increased year by year, and the change rate was faster in summer than in winter. The change rate in NH3 concentrations was related to the concentrations of SO2 and NO2.
3. NH3 emissions had the greatest effect on atmospheric NH3 concentrations, it will determine the change in NH3 concentration by half. In the cold season, emissions changed average NH3 concentration by 49.85% every year. In the warm season, the change was 49.69%. Concentrations of SO2 and NO2 affected NH3 concentration to a certain extent, and their concentrations were negatively correlated with those of NH3. The effect of SO2 on NH3 was greater than that of NO2. Concentrations of SO2 led to changes in NH3 concentration of 19.65% in the warm season and 11.91% in the cold season. Concentration of NO2 caused changes in NH3 concentration of 5.72% in the cold season and 14.23% in the warm seasons. Decreases in atmospheric SO2 and NO2 concentrations lead to increases NH3 concentration. Meteorological conditions (atmospheric pressure and wind) also affected atmospheric NH3 concentration, In warm season, the most important factor is temperature, and in cold season, the most important factor is relative humidity. On the other hand, in addition to NH3 emissions, which is the most important influencing factor, the role of acid gases in summer if greater than that of meteorological factors, and it is contrast in the cold season.
To further understand the trend in NH3 concentration, more accurate emission inventories are needed. Moreover, because reductions in atmospheric SO2 and NO2 concentrations can lead to increases in NH3 concentrations, the implementation of emission reduction policies such as desulfurization and deacidification in air pollution control actions could increase atmospheric NH3 concentrations. Therefore, in addition to improving emission inventories, the effects of SO2 and NO2 emissions on atmospheric NH3 should be considered (Heald et al., 2016).
The original contributions presented in the study are included in the article/Supplementary Material, further inquiries can be directed to the corresponding authors.
Methodology: DZ-l, ZQ-q Investigation: DZ-l, ZQ-q Writing-original draft: DZ-l Writing-review and editing: DZ-l, ZQ-q, ZX-y Funding acquisition: ZX-y, ZQ-q.
This work is funded by the National Natural Science Foundation of China (No.: 41775028, 41805098), National Key Research and Development Program Earth Observation and Navigation Key Project (No. 2017YFB0504001, No.2016YFB0500705).
The authors declare that the research was conducted in the absence of any commercial or financial relationships that could be construed as a potential conflict of interest.
All claims expressed in this article are solely those of the authors and do not necessarily represent those of their affiliated organizations, or those of the publisher, the editors and the reviewers. Any product that may be evaluated in this article, or claim that may be made by its manufacturer, is not guaranteed or endorsed by the publisher.
The authors acknowledge the AERIS data infrastructure for providing access to the IASI data in this study and ULB-LATMOS for development of the retrieval algorithms.
Bouwman, A. F., Lee, D. S., Asman, W. A. H., Dentener, F. J., Van Der Hoek, K. W., and Olivier, J. G. J. (1997). A Global High-Resolution Emission Inventory for Ammonia. Glob. Biogeochem. Cycles 11 (4), 561–587. doi:10.1029/97gb02266
Charlson, R. J., Langner, J., Rodhe, H., Leovy, C. B., and Warren, S. G. (2017). Perturbation of the Northern Hemisphere Radiative Balance by Backscattering from Anthropogenic Sulfate Aerosols. Tellus B: Chem. Phys. Meteorology 43 (4), 152–163. doi:10.3402/tellusb.v43i4.15404
Damme, M. V., Clarisse, L., Franco, B., Sutton, M. A., and Coheur, P. F. (2020). Global, Regional and National Trends of Atmospheric Ammonia Derived from a Decadal (2008-2018) Satellite Record. Environ. Res. Lett. doi:10.1088/1748-9326/abd5e0
Dammers, E., Shephard, M. W., Palm, M., Cady-Pereira, K., Capps, S., Lutsch, E., et al. (2017). Validation of the CrIS Fast Physical NH3 Retrieval with Ground-Based FTIR. Atmos. Meas. Tech. 10 (7), 2645–2667. doi:10.5194/amt-10-2645-2017
Galloway, J. N. (2005). The Global Nitrogen Cycle: Past, Present and Future. Sci. China C Life Sci. 48 Spec No, 669–677. doi:10.1360/062005-261
Galloway, J. N., Townsend, A. R., Erisman, J. W., Bekunda, M., Cai, Z., Freney, J. R., et al. (2008). Transformation of the Nitrogen Cycle: Recent Trends, Questions, and Potential Solutions. Science 320 (5878), 889–892. doi:10.1126/science.1136674
Guo, Y., Chen, Y., Searchinger, T. D., Zhou, M., Pan, D., Yang, J., et al. (2020). Air Quality, Nitrogen Use Efficiency and Food Security in China Are Improved by Cost-Effective Agricultural Nitrogen Management. Nat. Food 1 (10), 648–658. doi:10.1038/s43016-020-00162-z
He, Y., Pan, Y., Gu, M., Sun, Q., Zhang, Q., Zhang, R., et al. (2021). Changes of Ammonia Concentrations in Wintertime on the North China Plain from 2018 to 2020. Atmos. Res. 253, 105490. doi:10.1016/j.atmosres.2021.105490
Heald, C. L., Van Damme, M., Clarisse, L., Clerbaux, C., Coheur, P.-F., Nowak, J. B., et al. 2016, Interannual Variability of Ammonia Concentrations over the United States: Sources and Implications Atmos. Chem. Phys. 16 (18), 12305–12328. doi:10.5194/acp-16-12305-2016
Huang, X., Song, Y., Li, M., Li, J., Huo, Q., Cai, X., et al. (2012). A High-Resolution Ammonia Emission Inventory in China. Glob. Biogeochem. Cycles 26, a, n. doi:10.1029/2011gb004161
Li, Y., Thompson, T. M., Van Damme, M., Chen, X., Benedict, K. B., Shao, Y., et al. (2016). Temporal and Spatial Variability of Ammonia in Urban and Agricultural Regions of Northern Colorado, United States. Atmos. Chem. Phys. Discuss. 17 (10), 6197–6213. doi:10.5194/acp-2016-1008
Liu, L., Zhang, X., Xu, W., Liu, X., Li, Y., Lu, X., et al. (2017a). Temporal Characteristics of Atmospheric Ammonia and Nitrogen Dioxide over China Based on Emission Data, Satellite Observations and Atmospheric Transport Modeling since 1980. Atmos. Chem. Phys. 17 (15), 9365–9378. doi:10.5194/acp-17-9365-2017
Liu, L., Zhang, X., Xu, W., Liu, X., Lu, X., Wang, S., et al. (2017b). Ground Ammonia Concentrations over China Derived from Satellite and Atmospheric Transport Modeling. Remote Sensing 9 (5), 467. doi:10.3390/rs9050467
Liu, M., Huang, X., Song, Y., Xu, T., Wang, S., Wu, Z., et al. (2018). Rapid SO2 Emission Reductions Significantly Increase Tropospheric Ammonia Concentrations over the North China Plain. Atmos. Chem. Phys. 18 (24), 17933–17943. doi:10.5194/acp-18-17933-2018
Malm, W. C., Schichtel, B. A., Pitchford, M. L., Ashbaugh, L. L., and Eldred, R. A. (2004). Spatial and Monthly Trends in Speciated fine Particle Concentration in the United States. J. Geophys. Res. 109 (D3, a, n). doi:10.1029/2003jd003739
Pinder, R. W., Gilliland, A. B., and Dennis, R. L. (2008). Environmental Impact of Atmospheric NH3emissions under Present and Future Conditions in the Eastern United States. Geophys. Res. Lett. 35 (12, a, n). doi:10.1029/2008gl033732
Schiferl, L. D., Heald, C. L., Van Damme, M., Clarisse, L., Clerbaux, C., Coheur, P.-F., et al. (2016). Interannual Variability of Ammonia Concentrations over the United States. doi:10.5194/acp-16-12305-2016
Shephard, M. W., Cady-Pereira, K. E., Luo, M., Henze, D. K., Pinder, R. W., Walker, J. T., et al. (2011). TES Ammonia Retrieval Strategy and Global Observations of the Spatial and Seasonal Variability of Ammonia. Atmos. Chem. Phys. 11 (20), 10743–10763. doi:10.5194/acp-11-10743-2011
Sutton, M. A., Erisman, J. W., Dentener, F., and Möller, D. (2008). Ammonia in the Environment: From Ancient Times to the Present. Environ. Pollut. 156 (3), 583–604. doi:10.1016/j.envpol.2008.03.013
Van Damme, M., Clarisse, L., Dammers, E., Liu, X., Nowak, J. B., Clerbaux, C., et al. (2015a). Towards Validation of Ammonia (NH3) Measurements from the IASI Satellite. Atmos. Meas. Tech. 8 (3), 1575–1591. doi:10.5194/amt-8-1575-2015
Van Damme, M., Clarisse, L., Heald, C. L., Hurtmans, D., Ngadi, Y., Clerbaux, C., et al. (2014). Global Distributions, Time Series and Error Characterization of Atmospheric Ammonia (NH3) from IASI Satellite Observations. Atmos. Chem. Phys. 14 (6), 2905–2922. doi:10.5194/acp-14-2905-2014
Van Damme, M., Erisman, J. W., Clarisse, L., Dammers, E., Whitburn, S., Clerbaux, C., et al. (2015b). Worldwide Spatiotemporal Atmospheric Ammonia (NH3 ) Columns Variability Revealed by Satellite. Geophys. Res. Lett. 42 (20), 8660–8668. doi:10.1002/2015gl065496
Van Damme, M., Wichink Kruit, R. J., Schaap, M., Clarisse, L., Clerbaux, C., Coheur, P.-F., et al. (2014). Evaluating 4 Years of Atmospheric Ammonia (NH3) over Europe Using IASI Satellite Observations and LOTOS-EUROS Model Results. J. Geophys. Res. Atmos. 119 (15), 9549–9566. doi:10.1002/2014jd021911
Wang, Y., Wen, Y., Wang, Y., Zhang, S., Zhang, K. M., Zheng, H., et al. (2020). Four-Month Changes in Air Quality during and after the COVID-19 Lockdown in Six Megacities in China. Environ. Sci. Technol. Lett. 7 (11), 802–808. doi:10.1021/acs.estlett.0c00605
Warner, J. X., Dickerson, R. R., Wei, Z., Strow, L. L., Wang, Y., and Liang, Q. (2017). Increased Atmospheric Ammonia over the World's Major Agricultural Areas Detected from Space. Geophys. Res. Lett. 44 (6), 2875–2884. doi:10.1002/2016gl072305
Yu, F., Nair, A. A., and Luo, G. (2018). Long‐Term Trend of Gaseous Ammonia over the United States: Modeling and Comparison with Observations. J. Geophys. Res. Atmos. 123 (15), 8315–8325. doi:10.1029/2018jd028412
Keywords: satellite observations, atmospheric ammonia, random forest model, spatial-temporal distributions, influencing factors
Citation: Zhi-li D, Qian-qian Z and Xing-ying Z (2021) Satellite-Based Analysis of Spatial–Temporal Distributions of NH3 and Factors of Influence in North China. Front. Environ. Sci. 9:761557. doi: 10.3389/fenvs.2021.761557
Received: 20 August 2021; Accepted: 05 October 2021;
Published: 18 October 2021.
Edited by:
Bin Zhao, Tsinghua University, ChinaReviewed by:
Xiuying Zhang, Nanjing University, ChinaCopyright © 2021 Zhi-li, Qian-qian and Xing-ying. This is an open-access article distributed under the terms of the Creative Commons Attribution License (CC BY). The use, distribution or reproduction in other forums is permitted, provided the original author(s) and the copyright owner(s) are credited and that the original publication in this journal is cited, in accordance with accepted academic practice. No use, distribution or reproduction is permitted which does not comply with these terms.
*Correspondence: Zhang Qian-qian, emhhbmdxcUBjbWEuZ292LmNu; Zhang Xing-ying, enh5QGNtYS5nb3YuY24=
Disclaimer: All claims expressed in this article are solely those of the authors and do not necessarily represent those of their affiliated organizations, or those of the publisher, the editors and the reviewers. Any product that may be evaluated in this article or claim that may be made by its manufacturer is not guaranteed or endorsed by the publisher.
Research integrity at Frontiers
Learn more about the work of our research integrity team to safeguard the quality of each article we publish.