 Liang Wang
 Ying Cheng
 Ravi Naidu
 Mark Bowman3
94% of researchers rate our articles as excellent or good
Learn more about the work of our research integrity team to safeguard the quality of each article we publish.
Find out more
REVIEW article
Front. Environ. Sci., 20 December 2021
Sec. Toxicology, Pollution and the Environment
Volume 9 - 2021 | https://doi.org/10.3389/fenvs.2021.756404
This article is part of the Research TopicEnvironmental Contamination Solutions for Complex Heterogeneous SystemsView all 10 articles
Once petroleum hydrocarbons (PHs) are released into the soil, the interaction between PHs and soil media is dependent not only upon the soil properties but also on the characteristics of PHs. In this study, the key factors influencing the interactions between PHs and soil media are discussed. The key factors include: 1) the characteristics of PHs, such as volatility and viscosity; and 2) soil properties, such as porosity, hydraulic properties and water status, and organic matter; and 3) atmospheric circumstances, such as humidity and temperature. These key factors can be measured either ex-situ using conventional laboratory methods, or in situ using portable or handheld instruments. This study overviews the current ex/in situ techniques for measuring the listed key factors for PH contaminated site assessments. It is a tendency to apply in situ methods for PH contaminated site characterisation. Furthermore, handheld/portable Fourier transform infrared spectroscopy (FTIR) instrument provides tremendous opportunities for in-field PH contaminated site assessment. This study also reviewed the non-destructive FTIR spectroscopy analysis coupling with handheld FTIR for in-field PH contaminated site characterisation, including determining the concentration of total PH, dominant PH fractions and soil key properties for PH transport modelling.
Highly sophisticated and varied mixtures of hydrocarbons form the majority of the components in petroleum products (Irwin et al., 1998; Weisman, 1998). Soil is a porous material and a highly reactive adsorbent. When an oil spill or leak occurs on soil, physical, chemical, and biological processes alter the composition, toxicity, and distribution of petroleum hydrocarbons (PHs) within the soil ecosystem, known as weathering processes (Brassington et al., 2007; Ayoubi et al., 2020; Ayoubi et al., 2021). The sequestration and distribution mechanisms of PHs within soil include adsorption, volatilization, transportation and transformation (Yong et al., 1992). Adsorbed PHs, including volatiles and oil or light non-aqueous phase liquid (LNAPL), undergo natural attenuation processes, including biodegradation by the intrinsic soil microbial community. Mullins and the team developed multicomponent diffusion models based on field data and column studies to simulate both oil and gas charges and degradation in soil, which are simple and provide excellent guidance to diffusion over geologic time (Zuo et al., 2015; Pan et al., 2016). Many studies have focused on the impacts on the soil ecosystem when oil pollution occurs (Uzoije and Agunwamba, 2011; Nudelman et al., 2002; Everett, 1978; Mercer and Cohen, 1990; Williams et al., 2002-2003; Barakat et al., 2001). PH pollution impacts both the chemical and physical properties of soil. Physical impacts include clumping soil particles into plaques, decreasing porosity, enhancing resistance to penetration, and increasing hydrophobicity (Uzoije and Agunwamba, 2011). Chemical impacts include boosting soil organic matter by creating anaerobic conditions that eliminate most aerobic microorganisms and reducing cation exchange capacity (Pan et al., 2016). (Everett, 1978; Nudelman et al., 2002).
The hydraulic and physical characteristics of the soil, as well as its water condition, influence multiphase sequestration and PH distribution in porous soil medium. The capacity of soils to filter, retain or release PHs is fundamental to understanding environmental contamination and remediation. In the 1990s, Mercer and Cohen reviewed the properties, models, characterisation and remediation of LNAPLs in subsurface soils (Mercer and Cohen, 1990). Yong et al. described the principles of the fate and transport of LNAPLs in soil media (Yong et al., 1992). Fine et al. evaluated and highlighted the key implications of soil components on the fate of petroleum products in soils, such as hydrocarbon retention, volatilization, and transport, as influenced by soil physical and chemical characteristics (Fine et al., 1997). More recently, Williams et al. (Williams et al., 2002-2003), investigated the fate and transport of PHs in soil and groundwater at contaminated sites in the U.S. According to Williams et al., once PHs are released into the soil, the interaction between PHs and soil media is dependent not only upon the soil properties but also on the characteristics of PHs (Williams et al., 2002-2003). Barakat et al. (2001), investigated compositional changes of naturally weathered oil residues in an arid terrestrial environment. Several aromatic PH compounds with varied ratios were found to be stable in oil residues throughout a wide range of weathering and hydrocarbon concentrations, according to their findings (Barakat et al., 2001).
Brassington et al. (2007), reviewed the key factors influencing the interactions between PHs and soil media for site characterisation, risk assessment and bioremediation of weathered hydrocarbons.
These key factors, summarized in Figure 1, include: 1) the characteristics of PHs, such as volatility and viscosity; and 2) soil properties, such as porosity, hydraulic properties and water status, and organic matter; and 3) atmospheric circumstances, such as humidity and temperature. These key factors can be measured either ex-situ using conventional laboratory methods, or in situ using portable or handheld instruments. The ex-situ methods are often traditional laboratory-based. Albeit with a large volume of soil samples, labour intensive and time-consuming, the conventional laboratory methods can provide higher accuracies and lower detection limits. On the opposite, in the field, portable instrument methods offer rapid results and better coverage, which could satisfy the requirements of locating hotspots (Rostron et al., 2014). It is a tendency to apply in situ methods for PH contaminated site characterisation. This study reviews the current ex/in situ techniques for measuring the listed key factors for PH contaminated site assessments.
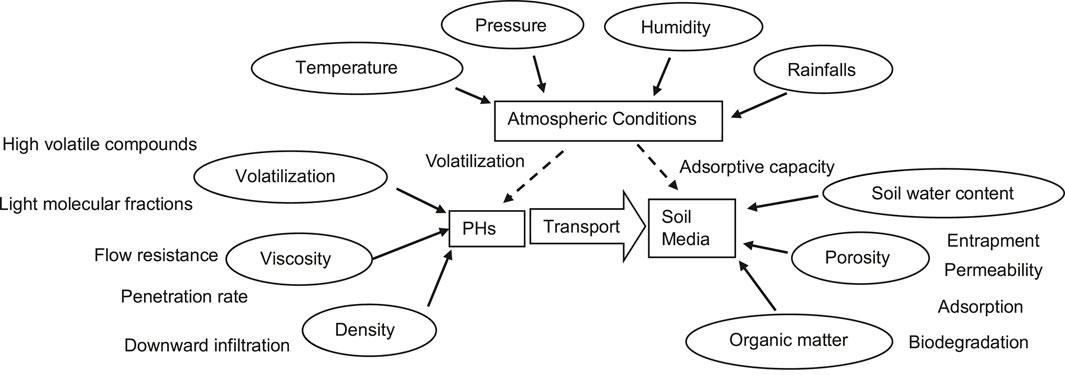
FIGURE 1. The key factors influencing the interaction between PHs and soil media.
Fourier transform infrared spectroscopy (FTIR) has been widely applied for quantifying the total amount of PH in contaminated soil, and soil property analysis (Czarnecki and Ozaki, 1996a; Kebbekus and Mitra, 1998; Bradley, 2007; Griffiths and De Haseth, 2007) (Soriano-Disla et al., 2014). Thanks to the recent development of handheld FTIR, it is possible to determine PH and soil properties rapidly in the field. In previous studies, handheld FTIR was applied to quantify total PH (TPH) and classify dominated PH fractions for contaminated site assessment (Wang et al., 2019). Furthermore, soil properties were also studied using handheld FTIR to provide inputs for soil contamination transport models for site assessment (Wang et al., 2020). This study also critically reviewed the non-destructive FTIR spectroscopy analysis for in-field PH contaminated site characterisation.
Volatilization is dominant in the loss of low molecular weight aliphatics and is the most substantial change in petroleum. Evaporation of PHs will result in the enrichment of high molecular weight, low volatile components in the residual hydrocarbon mixture (Fine et al., 1997). Volatilization is the process by which a compound evaporates in the vapour phase to the atmosphere (Yong et al., 1992). It is an important mechanism responsible for the loss of PHs from the soil to the air. Raoult’s and Henry’s laws can be applied to estimate the rate of Volatilization of a hydrocarbon compound from soil to air. More volatile compounds penetrate more rapidly from porous media than less volatile molecules. Volatilization losses are also dependent on many factors, such as soil properties, chemical properties and environmental conditions (Fine et al., 1997). The primary properties of a chemical controlling it’s volatilization are its vapour pressure and solubility in water. For example, the penetration of PHs increases with vapour pressure (Fine et al., 1997; Irwin et al., 1998). There is less than 5% of PHs will dissolve in water (Fine et al., 1997). Aromatic hydrocarbons, particularly BTEX (benzene, toluene, ethylbenzene, and xylenes), are the most water-soluble fraction of crude oil and other petroleum compounds, and because of their high toxicity and mobility in comparison to other petroleum hydrocarbons, they are frequently the main groundwater contaminant of concern at petroleum release sites (Williams et al., 2002-2003). The interaction of crude oil and reservoir aquifers has been mapped through the BTEX and other alkyl-aromatic compounds (Forsythe et al., 2017; Forsythe et al., 2019). In particular, the loss of alkylbenzenes, alkyl-naphthalenes and alkyl-phenanthrenes have been measured in crude oils as a metric of water washing. A series of related reservoirs have been shown to be water-washed sequentially, mild, moderate and severe based on the extent of water washing. Moreover, the loss of compounds from the crude oils was shown to tightly correlate to their water solubility (Forsythe et al., 2017; Forsythe et al., 2019). It is worth noting that soil adsorption reduces the activity of PHs by affecting vapour density and the subsequent volatilization rate. Further, the vapour density is also inversely related to the soil texture, moisture and organic matter contents in soil (Guenzi and Bear, 1974).
The dispersal of PHs from surface spills is controlled by its density and viscosity. Viscosity can be described as a fluid’s resistance to flow. The higher a fluid’s thickness, the more resistive it is to flow. Increases in the viscosity of LNAPLs are accompanied by an increase in heavy fractions, which reduces the preferential volatilization of light fractions. The hydrocarbon vapour penetrates around two to three times faster than LNAPLs (Fine et al., 1997). Hence, during LNAPL infiltration into fine soils, the intrinsic infiltration rate is decreased with increases in viscosity. The erosion of polluted soils is often accompanied by the transfer of very viscous PHs. The viscosity ratio (oil to water) increases when the temp decreases, changing the fractional flow of water and oil and also the intrinsic soil permeability (Torabzadeh and Handy, 1984). Temperature and thus density are essentially constant in most underground habitats, and some researchers claim that viscosity does not affect relative permeability (Sandberg et al., 1958; Odeh, 1959). It is worth mentioning the heaviest components in PH, asphaltenes, are normally nanocolloidally suspended in crude oil and impart the viscosity. The molecular structure and other properties have been studied and reported (Schuler et al., 2015; Schuler et al., 2017).
The density of a substance is defined as its mass per unit volume, and it is an important component determining the vertical infiltration of fluids in soil by gravity (Torabzadeh and Handy, 1984). The density of LNAPLs is also vital for controlling the mobility, or the rate at which LNAPLs are transported in soil (Keller and Simmons, 2005). Density is affected by several factors, the most important of which is temperature. Knowing the density of petroleum spilt at a place is critical since it is used to estimate the volume of petroleum leaked. The density of LNAPLs can be presented as American Petroleum Institute (API) gravity, which is an inverse measure of the density relative to water, using a hydrometer, which is a sealed hollow glass tube with a larger bottom that is used to measure liquid densities using buoyancy.
To represent PH fractions, equivalent carbon numbers (Cn) are used, with Cn values based on a variety of physical-chemical properties and simple partitioning models (otal Petroleum Hyd, 1005). In general, small linear PHs is in the gas phase while medium-sized linear PHs is LNAPL. The chains under C7, known as naphthas, are relatively light and quickly vaporised, and are commonly used as dry-cleaning solvents. For petrol, which is more volatile than water, the chains from C7 to C11 are commonly mixed and employed. Kerosene is next, from C12 to C15, followed by diesel and other heavier fuel oils, from C12 to C30. Branched PHs of intermediate size tend to be waxed with low melting points (Bray et al., 2020). Carbon chains in lubricating oils, such as engine and motor oils, ranging from C25 to C40. Long PHs (>C50) tend to be a solid phase, such as tars. Chemical structure, carbon number, and structure-activity connections are used to determine PH fractions (Interim Final Petroleum R, 1994). Heavier fractions of PHs are those with a greater Cn, or carbon chains that are longer. Higher viscosity, density, boiling temperatures, and longer residence durations in soil characterise the heavier PH fractions (Interim Final Petroleum R, 1994). Linear compounds up to C30, for example, may dissipate within a month. By contrast, those with up to C37 need at least 200 days. Indeed, the entire fraction can persist for 4 years or longer (Gudin, 1978). The properties of the alkanes with different Cn, can be found at the open chemistry database, PubChem (Sadler et al., 2003). The relationships between the Cn and their densities, boiling points and melting points, are collected from the database and summarized in Figure 2. At the range of 5–45 of Cn, all the values of these properties were increased logarithmically following the increase of the Cn. However, based on Figure 2A, the values of density were slightly increased when the carbon chain length was longer than 25 of Cn. While the boiling points are increased linearly after the alkane contains more than twenty carbons in the chain (Figure 2B). According to Uzoije et al. (Uzoije and Agunwamba, 2011), crude oil samples with heavier molecular weights or high carbon numbers provide higher impacts on the soil bulk density, percentage of organic matter and porosity. Cn can be determined by their boiling points using gas chromatography. Because crude oil and petroleum products have complicated chemical compositions with a lot of variation between them, it's impossible to isolate unique chemical “fingerprints” for each oil to determine where the weathered oil pollution originated (Wang and Fingas, 1995).
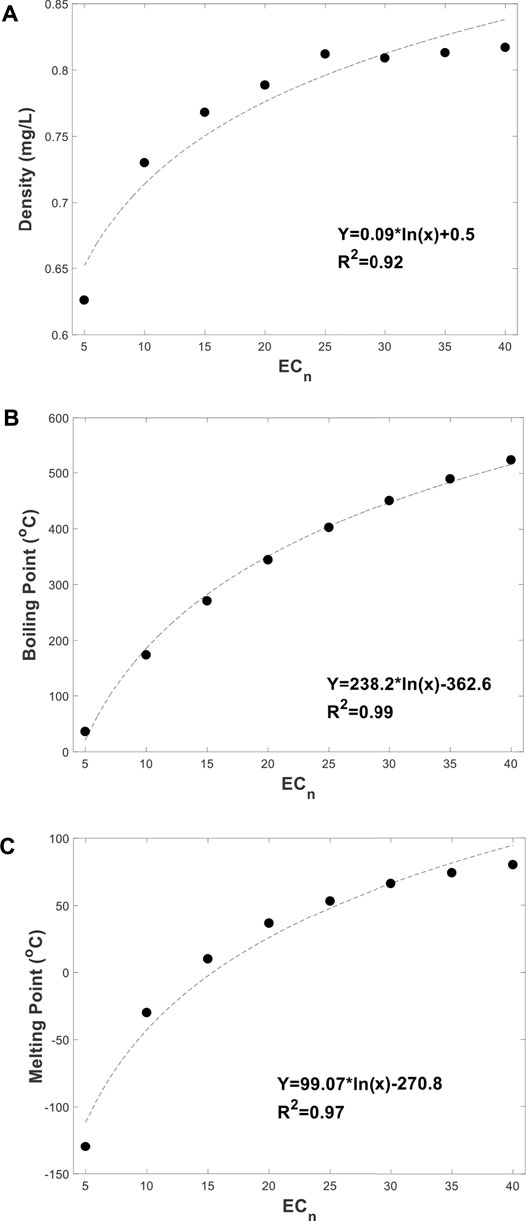
FIGURE 2. (A) The relationships between the Cn and their density. (B) The relationships between the Cn and their boiling point. (C) The relationships between the Cn and their melting point.
It’s critical to understand the viscosity and density of petroleum at a spill site, as this information is often needed to estimate the amount of petroleum spilt. The oil’s kinematic viscosity can be measured using capillary tube viscometers. The oil sample is placed in a capillary glass tube and allowed to flow through the tube under gravity in this method. More viscous grades of oil take a longer flowing time. However, The viscosity of an oil is nonsensical unless the temperature at which it was measured is specified. The viscosity is usually measured at one of two temperatures: 40 or 100°C. The viscosity of most industrial oils is commonly measured at 40°C. Similarly, most engine oils are routinely measured at 100°C. The density of LNAPLs can be present as API gravity, which is an inverse measure of the density relative to water. A hydrometer can be used to measure API gravity.
To measure PH components in contaminated soil, they need to be extracted from soils before standardized soil extraction procedures. Methanol extraction is recommended for volatile substances including BTEX and gasoline, according to EPA method 5035, alternatively, direct headspace analysis can be used. Soxhlet, sonication, and supercritical fluid extractions are routinely used for semi-volatile substances (Weisman, 1998). To reach low detection limits, sample concentration methods, such as Snyder trapping column or nitrogen evaporation are adopted. There are several approaches for PH determinations including total PH (TPH), PH group type and individual PH component measurements (Weisman, 1998). Gas chromatography (GC) and infrared spectrometry (IR) are the two common analytical techniques employed for TPH determinations. High-performance liquid chromatography and GC are commonly used for PH group type analysis. GC with mass spectrometry (GC/MS) is commonly used for individual PH component measurements. It’s worth mentioning that non-petroleum substances detected by GC-based technologies may cause TPH concentrations to be overestimated. For example, chlorinated compounds in gasoline samples may be detected by GC-based methods and reported as TPH.
Today, on-site real-time assessment of industrial chemicals with relatively rapid qualitative analysis using portable GC/MS, has been demonstrated in a number of literature (Meuzelaar et al., 2000; Leary et al., 2016; Visotin and Lennard, 2016). For example, the US military used a “HAPSITE Smart GC-MS system” to detect toxic gases (Leary et al., 2016). However, on-site measurement with a field-friendly method providing near laboratory quality data for rapid quantitative, conclusive and defensible sampling of airborne chemicals has remained challenging. A field-portable Torion-T9 GC-MS, which provides analytical information that is definitive for many types of samples containing the organic analyte(s) using solid-phase microextraction (SPME) and Needle Trap as the default sampling method. As demonstrated in our previous study (Wang et al., 2021a; Wang et al., 2021b), Torion-T9 portable GC-MS can provide results within minutes and is suitable for on-site analysis.
The handheld IR technique can be applied for analysing PHs sequestrated in soil, where the PHs can be identified based on the information of spectral peaks (Wang et al., 2020). The IR methodology takes significantly less time and costs to analyse than GC and HPLC-based technologies. However, it is difficult to interpret the raw IR spectral data as obtained and classify these petroleum products based on carbon chain lengths by mere observation. The interferences are represented by a sequence of more or less overlapping bands in the spectrum line form (band). These bands represent absorbed or scattered individual molecules (Czarnecki and Ozaki, 1996b; Kebbekus and Mitra, 1998; Bradley, 2007; Griffiths and De Haseth, 2007). When analysing a material with an unknown mixture of PHs, extracting information and identifying components from overlapping IR spectra is a critical problem. Separating heavily overlapping bands, according to Czarnecki and Ozaki, takes both an experienced researcher and some knowledge of the system under study (Czarnecki and Ozaki, 1996b). Therefore, IR analyses are commonly used for such chemical structure studies. Limited researches have been done on using these spectrum approaches to determine the PH fractions.
According to our previous study of using an handheld FTIR with diffuse reflectance infrared spectroscopy (DRIFTS) mode to classify dominant PH fractions, the similarity of the MIR peaks in the functional/group frequency region from 3,000–2,800 cm−1, indicates the major compounds in the petroleum products have identical molecular structures, which is the carbon-hydrogen bonding for long-chain alkanes due to–C-H stretching vibrations (Wang et al., 2019). Two bands coherent to the doublet were discovered at locations 2,954 and 2,872 cm−1, which can be used to determine the proportion of carbon chains (Wang et al., 2019). Another two doublets were found between 1,480 and 1,450 cm−1, as well as between 750 and 730 cm−1. Following the increase in Cn (Griffiths and De Haseth, 2007), the intensity of one coherent band was detected to increase in each of these regions. The cohesive bands intensity ratio can be used to determine the Cn (Wang et al., 2019).
It is worth noticing that there are two types of sampling modes for using the FTIR, DRIFTS and attenuated total reflections (ATR). According to recent studies (Koçak et al., 2021; Volkov et al., 2021), both techniques can be applied in soil analysis, but DRIFTS is more sensitive in soil applications. DRIFTS entails minimal sample preparation, i.e., drying and grinding, which is suitable for soil sample direct measurement. On the other hand, ATR can be applied as a complement to DRIFTS for soil minerals, organic matters with dark colour and in the presence of water.
Non-invasive geophysical subsurface imaging techniques including electromagnetic (EM) induction, ground-penetrating radar (GPR), nuclear Magnetic Resonance (NMR), Electrical Resistivity Tomography (ERT) and Induced Polarisation (IP) have been applied for PH, especially LNAPLs contaminated site characterisation, to detect and delineate PH contaminants in soil subsurface.
The principle of EM induction for subsurface PH detection is used to measure the electrical conductivity/resistivities in the subsurface (Johansen et al., 2005; Behroozmand et al., 2015; Ayoubi et al., 2020; Ayoubi et al., 2021). A sending coil generates a primary magnetic field in the space surrounding it—even underground—by passing through it a primary alternating electric current of known frequency and magnitude. The eddy currents generated in the ground cause a secondary current to flow via underground conductors, resulting in an alternating secondary magnetic field that is detected by the receiving coil. A phase lag distinguishes the second field from the primary field. The ratio of the magnitudes of the primary and secondary currents is proportional to the terrain conductivity. The depth of penetration is determined by coil separation and orientation. Unlike conventional resistivity techniques, no ground contact is required. This eliminates direct electrical coupling problems and allows much more rapid data acquisition.
NMR has already been validated by more than 50 years of development and innovation by the petroleum exploration industry. This technique has widely used in lithology to see fluids (such as LNAPLs) and gas distribution in porous media (Behroozmand et al., 2015). The very recent development of small‐diameter, economical, and portable NMR tools (Spurlin et al., 2019) now permits the non-invasive use of this technology within existing polyvinyl chloride (PVC)‐cased well infrastructure or open holes, which provides repeatability for long‐term monitoring with low costs, as well as a direct‐push approach that enables reconnaissance PH contaminated site characterisation. The physical principle of NMR logging is the same principle underlying magnetic resonance imaging technology used in medicine and NMR spectroscopy in chemistry, by emitting a series of radio-frequency pulses and recording the returning signal, referred to as “spin echoes” and the NMR tool measures the NMR response in the sensitive zone. The characteristics of the measured NMR signal reflect the quantity of hydrogen protons, where the total amplitude of the signal is directly proportional to the total amount of groundwater or PHs. NMR has been effectively applied to geology applications for soil water content and permeability characterisation (Spurlin et al., 2019). There is little difference in the detection of petroleum hydrocarbon fluids and water. However, the environmental application of NMR is still in its early stage.
GPR detects reflected signals from subsurface structures by using electromagnetic radiation at UHF/VHF frequencies in the radio spectrum (Jol, 2009) (Knight, 2001). When the electromagnetic energy emitted from GPR, encounters a buried object with different permittivity, it may be reflected or refracted or scattered back to the surface. A receiving antenna can then record the variations in the return signal (Jol, 2009). The disparity in dielectric characteristics between the contaminated region and the pristine region is the basis for employing GPR to image a contaminant (Knight, 2001). GPR has become a valuable method utilised by a variety of scientists, engineers and consultants from many disciplines. For PH contaminated site applications, GPR can be applied for locating and predicting the fate and transport of contaminants in the subsurface soil and shallow groundwater, for contamination site assessment (Daniels et al., 1995; Babcock and Bradford, 2014). The presence of a layer of LNAPL on top of the water table reduces the capillary fringe and results in steady reflected radar signal amplitudes (Singer, 2007). The water in the pore space is replaced by LNAPL, which lowers the conductivity and dielectric characteristic of porous soil, increasing the radar propagation velocity (Jol, 2009). Nevertheless, for mixed contamination, the presence of inorganic contaminants in the subsurface typically increases electrical conductivity through their dissolution into the groundwater. A further drawback, using GPR to characterise contaminated sites will depend on the specific nature. For example, GPR is highly suited to most applications in dry sands, where penetration depth can exceed 50 m with low-frequency antennas. However, in wet clays, penetration depths are typically less than 1 m.
For delineation of a PH contaminated site, subsurface imaging method ERT and IP are also applied (Aranda et al., 2012). ERT and IP are well-established methods in the area of hydro-geophysics. Both of the techniques apply to explore electrical properties (resistivity and capacity) of the subsurface using the same four-electrode measurement approach. The devices introduce a known current flow to two electrodes and record the potential and capacity values from another set of electrodes at a set distance away, hence the electrical resistivity and IP can be calculated accordingly using inversion algorithms, such as Res2Dinv. The difference is ERT uses the injected current values and the receiving voltages to calculate the Earth resistivity, while the time-domain IP methods measure considers the resulting voltage following a change in the injected current. Soil and contaminant properties and state variables are linked to electrical resistivity and capacity, which makes the techniques valuable to study contaminant spatial distribution. ERT can be used to relate soil hydrocarbon contaminant characteristics (Aranda et al., 2012). When only surface electrodes are used, ERT&IP suffer from a decrease of sensitivity and resolution with increasing depth. A way to overcome the resolution problem is to include borehole electrodes to measure either between two (or more) boreholes and surface (Ochs and Klitzsch, 2020). However, the combination of surface and borehole ERT and IP techniques have little been studied in locating contaminants in environmental applications.
Soil solids can retain PHs by trapping in soil capillaries and pores or adsorption on particle surfaces (Fine et al., 1997). Mineral particles account for around 50% of the volume of soil, followed by 25% water, 20% air, and 5% organic matter (Wild, 1993). The processes occurring within soil that are instrumental in controlling PHs distribution include entrapment, adsorption, volatilization and transport. Figure 3 shows a schematic of the weathering processes of PHs in soil. Less volatile components will permeate through soil pores in the form of LNAPL, being trapped in pores or adsorbed on mineral and organic matter surfaces. While the highly volatile fraction will rapidly volatilize into the gas phase in soil pores. Entrapment by soil and sorption decrease LNAPL volatilization, water dissolution and degradation rates (Greene-Kelly, 1954a; Greene-Kelly, 1954b; German and Harding, 1969; Olejnik et al., 1974; Nathwani and Philips, 1997). The degree of hydrocarbon entrapment and sorption is controlled by physical and chemical features of the soil solid phases, such as water content, texture, and organic matter concentration.
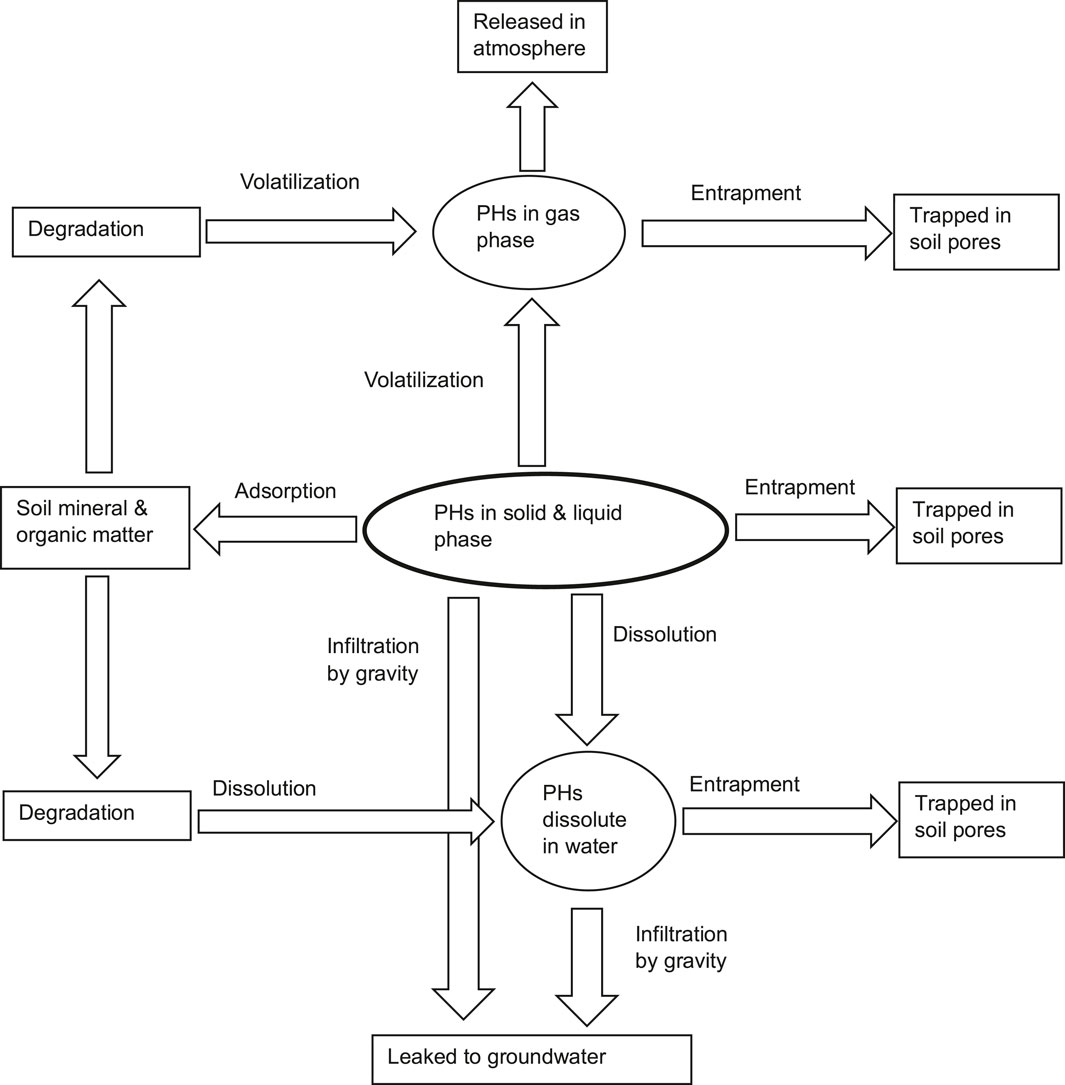
FIGURE 3. The schematic of the weathering processing of PHs in soil.
Particles of variable size, shape, and chemical content represent the mineral elements of soils. A typical soil has about 50% porosity, however, the pores are normally filled with air or water depending on the moisture level. The entrapment of LNAPLs is strongly influenced by soil texture (Singer, 2007). The smaller soil particles have small porosity and permeability, with higher hydrocarbon adsorption and holding capacity. According to (Nye et al., 1994), clayey soils have very small pore spaces and have the highest hydrocarbon adsorption and holding capacity. It was found that the total sorption capacity of clayey soil for PHs was markedly greater than the of sandy soil. Silty soils have higher hydrocarbon adsorption and holding capacity than sandy soils but are highly erosive. Moreover, the porosity is also affected by polydispersity of soil practical size and shape (Schulze et al., 2015). Soil tortuosity and hysteresis phenomena result from pore shape irregularity, size and distribution, known as pore throat-size distribution (Rezanezhad et al., 2009; Ghanbarian et al., 2017). Soil hysteresis has been demonstrated to impact natural LNAPL depletion or mass migration within the LNAPL body by recent studies (Sookhak Lari et al., 2016).
Sufficient textural information should be obtained to permit the classification of soils. Particle Size Analysis is a reliable, reproducible technique widely applied in the laboratory (Bowman and Hutka, 2002). There are two major soil particle size analysis methods, hydrometer and pipette methods (Bowman and Hutka, 2002). The hydrometer method consists in using a hydrometer to measure the density of water suspension of soil at time intervals based on Stoke’s law. The pipette method consists in using a pipette to take a known volume of a water suspension of a soil sample from the desired depth after a specific stirring time. This is accomplished by allowing different-sized soil particles to settle out of the solution at different periods (small clay particles take the longest). The portion of sand, silt and clay are determined based on the sample weight after drying. For both of the methods, soil pre-treatment can be required to remove organic materials and salts to increase soil dispersion. Based on the relative proportions of sand, silt and clay as a percentage, the soil texture triangle is used to convert particle size distribution into a recognised texture class (Bowman and Hutka, 2002). For field measurement, the clay percentage of soil can be approximated using a sieve and hands. According to (McDonald et al., 1998), Firstly, a sample of soil can be sieved by a 2 mm diameter sieve. Wet the soil with some water, knead it into a bolus, and then extrude a 2 mm thick, 1 cm wide ribbon. The length of the formed ribbon can provide estimated information on soil texture.
Porosity is defined as the proportion of pore volume to total volume (bulk volume) (Saidian et al., 2014). Saidian et al., comprehensively studied the measurement methods for soil porosity, including gas porosimetry, saturation methods and NMR (Saidian et al., 2014). Gas porosimetry relies on the expansion of gas, i.e., helium, and measure the effective porosity of the media. This method is still controversial. The arguments include gas can penetrate pores that are much smaller than the viscous fluid can; on the other hand, surface tension with gas-liquids is much higher than liquids-liquids to gas entry through water-filled pore throats can be less than oil entry (Danesh). Saturation methods measure the effective porosity of the media depending on the saturation with a certain fluid. With suitable calibrations, portable NMR determines the concentration of hydrogen nuclei of soil in the field, which directly translates to pore volume and, as a result, porosity (Saidian et al., 2014).
Pore diameters are dispersed over a wide range of values in the vast majority of porous media. There is also a probability density function that describes the pore volume distribution for given pore size. The interstitial surface area of the spaces and pores per unit mass or unit bulk volume of the porous material is defined as the specific surface of the porous material. In several porous media applications, the specific surface area plays a significant role. Pore size distribution can be measured using the subcritical nitrogen adsorption technique (Saidian et al., 2014). Isotherms are used to measure pressure and temperature while nitrogen gas is being injected into the sample.
Instead of applying the conventional lab-based soil column measurement methods, handheld infrared spectroscopy can be employed to provide such information rapid in the field (Wang et al., 2020). For soil chemical properties, The most prevalent component of sand is quartz, which can be used to assess sand concentration in soils. Kaolinite is a prominent natural clay substance found in abundance in Australian soils, particularly in warm and humid climates. Smectite and illite are the other two common natural materials. Quantitative prediction of quartz and kaolinite (or other clay materials) can approximate sand and clay, and can thus act as a proxy for soil texture.
Our previous study provides more details about soil texture determination using the handheld FTIR with DRIFTS mode (Wang et al., 2020). Quartz could be calibrated at 1,080 cm−1, which relates to the Si-O stretching vibration (Soriano-Disla et al., 2014). As suggested by (Ayoubi et al., 2020), Si-O bending vibration at 796 cm−1 can also be considered as a quantitative peak. The Si-O stretching peak is observed at 1,080 cm−1, from quartz overlapped with other unknown peaks. Band composition was be applied to separate these two bands for quantification purposes. For clay, kaolinite, previous research suggested the calibration can utilize the strong O-H stretching vibration presenting as the doublets at 3,690–3,620 cm−1. Smectite and illite can be determined at 3,400–3,300 cm−1 (Soriano-Disla et al., 2014).
Permeability is an important measure for soil drainage, which can influence fluids infiltration, storage, surface run-off and groundwater recharge (Azadmard et al., 2020). It is also known as hydraulic conductivity, which measures the rate of transmission of fluids and gas in soil (Odeh, 1959) (Gardner, 1956). Permeability is a complex feature of soils, varying with the location, soil porosity, depth, soil water content (SWC) and direction of flow. Horizontal permeability is often higher than vertical permeability because of soil layers (horizons). Soils with low permeability, such as heavy clay-rich soil, have up to two times the retention capacity of soils with high permeability, such as light sandy soils (Fine et al., 1997). SWC and permeability have an inverse relationship in unsaturated soils, as permeability fluctuates with soil moisture content (Odeh, 1959).
Soil permeability can be calculated using Darcy’s law, as a simple proportional relationship between the instantaneous discharge rate through a porous medium, the viscosity of the fluid and the pressure drop over a given distance at a constant elevation. Effective porosity may be reduced by the presence of hydrocarbon films on soil surfaces, especially with the swelling of clay materials (Fine et al., 1997). The calculation can only provide approximate results because the velocity of fluid flow through a pore is proportional to the fourth power of its diameter (Poiseuille’s law), even a slight change in the effective diameter of the pores can have a big impact on permeability. For ex-situ measurement, single/double infiltration ring methods can be applied for measuring the permeability based on the soil texture. For in situ measurements, soil permeability can be measured using a permeameter, which is a tube-like instrument is inserted into soil to measure the rate at water flows into the underlying soil.
The transport in soil describes and predicts the directional movement and the flow rate of the reservoir fluids. When oil is spilt on soil its transport includes infiltration and imbibition. Infiltration represents the consequence of the vertical movements influent by gravity and evaporation, and imbibition represents the influence of soil capillary suction or fluid absorption by adhesive force, which can occur horizontally without the influence of gravity (Keller and Simmons, 2005). Changes in the SWC can inversely change the soil adsorptive capacity for PHs – Water retained in small soil capillaries reduces the effective soil porosity and hinders LNAPL transport through the soil in imbibition (Fine et al., 1997). This is because the water in both the vapour and liquid phase competes for sorption sites with PHs in surface soil capillaries. According to Fine et al., at soil moisture equivalent to 70% of field capacity, the adsorption of hydrocarbons can be negligible (Fine et al., 1997). Another study demonstrated that clay’s sorption capacity can be doubled by using oven-dry rather than air-dry (Nye et al., 1994). Many studies have shown that increasing SWC reduces soil adsorptive capacity and enhances the PH into infiltrating (Acher et al., 1989; Yaron, 1989; Jarsjö et al., 1994) (van Darn, 1967).
SWC can be measured gravimetrically as a fraction of the total soil weight. However, this method is destructive and time-consuming and is impractical for measuring SWC in the field. In moist soils, the evaporation of light carbon fractions of PHs from soil is maintained by the soil water (Yong et al., 1992). In the absence of other force fields, the soil diffusivity is presented by the ratio of the hydraulic conductivity and the differential water capacity or the flux of water per unit gradient of moisture content (Hayes et al., 2007). The pressure plate outflow method, which is based on volumetric outflow measurements of water over time from a soil sample subjected to variations in matric suction, is the most widely used laboratory method for assessing soil water diffusivity in unsaturated soils (Gardner, 1956).
In geotechnical engineering, Atterberg limits are frequently used to identify, describe, and classify soils, as well as to make early assessments of the critical water contents (Nazir, 2011; Zolfaghari et al., 2015a; Zolfaghari et al., 2015b) (Das, 2006). For example, soil Atterberg limits were applied to indicate soil properties and land use in Western Iran (Zolfaghari et al., 2015a; Zolfaghari et al., 2015b). Atterberg limits or consistency limits are characterised by shrinkage, plastic and liquid limits (Nazir, 2011). The liquid limit represents the minimum water content at which soil particles flow under their weight. The plastic limit is the minimum water content at which soil is moulded without breaking. The water content at which further moisture loss will not result in any further volume reduction is known as the shrinkage limit. These limits control the consistency of the soils as wetting conditions change. These tests are most commonly employed on clayey or silty soils, which expand and shrink as a result of moisture content. Clays and silts change size and shear strength as a result of their reactions with water (Das, 2006).
In the field, SWC can be determined by measuring a related variable that is affected by the amount of soil water through calibration curves (Bittelli, 2011). Dielectric sensors, for example, take advantage of changes in soil dielectric characteristics as a function of SWC. Heat dissipation and flux sensors measure soil’s thermal properties and heat capacity variations (Hanks and Ashcroft, 1980). The neutron scattering approach relies on high-energy neutrons colliding with other atoms, particularly hydrogen in the water molecule, to lose energy (Bittelli, 2011). Alternatively, the hydraulic soil status can be estimated by using a GPR, and the working theory has been mentioned (Hubbard et al., 1997).
Using infrared spectroscopy, SWC can be measured using the oxygen-hydrogen stretching bonding, a broad peak centred at around 3,400 cm−1. By increasing the water content, the intensity of the characteristic water peak was enhanced while the peaks from the sand were impaired. The loss in spectral quality in the sand is due to significant surface reflection from water film (Soriano-Disla et al., 2014). Since kaolinite can be determined using the IR region similar to water, water content needs to be minimized especially for measuring clay soils. When FTIR with DRIFT mode, the presence of water in the field can have a negative impact on the IR spectra. Hence, ATR mode should be applied to the FTIR for measuring a soil sample with significant SWC. To calculate the water content, the water characteristic peak is broad and robust. The absorbance area or intensity of the peak can be applied directly for calibration.
The SOM consists of plant and animal wastes in various stages of decomposition, soil microbes and chemicals synthesised by them (Falahatkar et al., 2014; Havaee et al., 2014). The most abundant components of SOM are humic substances, which include humic acids, fulvic acids and humins. Other components primarily consist of polysaccharides, polypeptides, and altered lignin (Hayes et al., 2007). A study conducted by Benka-Cooker and Ekundayo indicates that SOM dominates LNAPL absorption when it is present at greater than 1% (Benka-Cooker and Ekundayo, 1995). Soils with a higher organic matter content adsorbed more PHs (Benka-Cooker and Ekundayo, 1995; Uzoije and Agunwamba, 2011). At low SOM, the adsorptive capacity of clays and other mineral matter may become vital, especially when they are dry (Benka-Cooker and Ekundayo, 1995). In contrast to LNAPL, in the case of vapour absorption, free mineral surfaces rather than organic matter seize control (Karickhoff, 1981). On the other hand, the presence of dissolved organic matter can also reduce the soil adsorption capacity due to competitive adsorption on mineral surfaces (Yong et al., 1992).
It is useful to express the partitioning of organic substances in soil by the soil organic carbon-water partitioning coefficient (Koc). Koc is the ratio of the mass of a chemical that is absorbed in the soil per unit mass of organic carbon over the equilibrium chemical concentration in solution. The mobility of organic soil pollutants can be predicted using Koc values. Large Koc values represent slowly mobile organic chemicals and low Koc values represent high mobile organic chemicals. For example, BTEX compounds have a lower Koc than most of the common aromatic hydrocarbons. Benzene (Koc of 59) is considered to be highly mobile in soil, toluene (Koc of 182) is considered to be moderate to highly mobile in soil, and xylenes (Koc of 363–407) are considered to be moderately mobile in soil (National primary drinking, 1995). Because of their low volatility, the majority of PAHs are categorised as semi-volatile organic compounds. PAHs are difficult to dissolve in water in general. Because of their low solubilities and high Koc, they are more likely to partition into sediments and soils than groundwater. As a result, the transport of PAHs from soils tends to be associated primarily with the transportation of the solid phase by the erosion of contaminated soils and sediments. As adsorption is an exothermic process, the Koc values usually decrease inversely with temperature (Yong et al., 1992). A 10% decrease in Koc would be expected for temperature rises from 20 to 30°C, and an18% increase would be expected for a temperature drop from 20 to 5°C (Yong et al., 1992).
SOM is mostly made up of soil organic carbon (SOC), which accounts for roughly 58 percent of the total mass, with the rest made up of water and other elements, such as potassium, calcium, magnesium, nitrogen, phosphorous and sulphur contained in organic residues (Combs and Nathan, 1998). Because SOM is often difficult to measure directly in laboratories, scientists prefer to measure SOC instead, and then multiply SOC by 1.72 to get SOM (Hoyle, 2013). SOC is most commonly analysed using either the Walkley-Black digestion method or the weight loss on ignition (LOI) method (Hayes et al., 2007). The Walkley-Black method uses chromic acid to measure the oxidisable organic carbon in soil samples. Oxidisable organic carbon is oxidised by 1 N K2Cr2O7 solution. The reaction is assisted by the heat generated when two volumes of H2SO4 are mixed with one volume of the dichromate. Ferrous sulphate is used to titrate the residual dichromate. The amount of organic carbon in the soil sample has an inverse relationship with the titre. The weight LOI method is based upon measuring the weight loss at different temperatures from 300 to 550°C for 2 h, then correlated to oxidisable organic carbon to determine SOM (Abella, 2007; Yerokun et al., 2007). According to the study of the comparison of determining SOM using the Walkley-Black method and the LOI procedure at 300, 360, 400, 500 and 550°C, a temperature of around 360°C was found to be optimal because it burned the most organic carbon, damaged the least inorganic carbon, caused the least clay structural water loss, and utilised the least amount of electrical energy (Salehi et al., 2011). An instrument known as a LECO carbon analyser or LECO method can be applied to measure SOC by combusting the organic carbon and measuring the resulting carbon dioxide produced (Gazulla et al., 2012). Before analysis, soil samples need to be acid-treated to remove inorganic carbon, i.e. carbonates from rocks. The amount of organic carbon is directly proportional to the amount of carbon dioxide produced. The Walkley-Black method has higher accuracy for measuring low SOM soils (<2%), while the weight-loss method is more suitable for measuring soil with greater than 6% SOM (Hayes et al., 2007).
According to (Soriano-Disla et al., 2014; Asgari et al., 2020), for organic matter, alkyl groups are monitored using mid-IR at 2,930–2,850 cm−1, protein amide at 1,670–1,530 cm−1, 1720 cm−1 for carboxylic acid, and 1,600–1,570 cm−1 for aromatic groups. Humic acid is a dark colour chemical, and the IR spectra at high levels of humic acid produced a low signal to noise ratio. When using FTIR with DRIFTS mode, the dark colour of humic acid substances may absorb more IR energy and cause less signal reflected in the IR signal receiver. Hence, ATR mode should be applied to the FTIR for SOM measurement. Since humic acid is not a single compound, all the peaks which indicated different functional groups should be used for calibration. According to (Irwin et al., 1998), numerous quartz peaks below 2000 cm−1 almost overlap entirely with the soil organic matter, which is composed mainly of humic acid. According to our previous study (Wang et al., 2020), it is noted that there are minor peaks resembling noise at roughly 3,500 cm−1 and 1720–1,630 cm−1, which can be considered as humic acid compounds. When humic acid content was greater than 10%, small peaks at about 2,930 cm−1 were found, which can be used for humic acid calibration in pristine soil. However, this area can only represent one humic acid functional group. Moreover, soil Vis/Near IR spectroscopy at the region between 350 and 1,150 nm wavelength can also provide significant characterising signals for SOM determination (Asgari et al., 2020).
Indigenous soil microbes represent approximately 5% of the total organic matter but play important roles in degrading PHs (Head et al., 2003). The natural bacteria or fungi transform, decrease or eliminate PHs by degrading or transforming more complex petroleum components into relatively simple components that pose less risk in the environment. This is referred to as biodegradation (Head et al., 2003). Biodegradation is an important natural attenuation process in soil and a primary weathering process for petroleum. Most soils and sediments contain bacteria and other organisms capable to degrade PHs (Potter and Simmons, 1998). In unpolluted environments, hydrocarbon-degrading bacteria can be found in small numbers, however, once they adapt to energy-rich PHs, they can attain great densities (Head et al., 2003). Biodegradation rates fluctuate depending on microbial densities and hydrocarbons, as well as the geochemical and hydrological conditions present in the subsurface soil (Potter and Simmons, 1998). Zones with different biodegradation rates can be identified using geochemical and microbiological data. In optimal environmental conditions, biodegradation rates of low to intermediate molecular weight aliphatic, alicyclic, and aromatic hydrocarbons can be accelerated. As the molecular weight of the hydrocarbon grows, so does its resistance to biodegradation (Wiedemeier et al., 1995). Peters and Moldowan developed a pH biodegradation classification scheme, known as PM scale, to rank the level of biodegradation of PHs from one to ten (Peters and Moldowan, 1993). The PM scale has been widely applied for light and conventional oils. There are other scales developed for a more comprehensive list of compounds and heavy oils (Wenger et al., 2002; Larter et al., 2012). According to Head (Head et al., 2003), more than 70% of PAH and 80% of benzo [a]pyrene in petroleum were partitioned to the residual LNAPL. Weathered PHs have low bioavailability, are resistant to environmental degradation and exist in the soil for a long time (Guerin, 2000).
Optimising the environmental conditions by bio-stimulation and bio-augmentation, including temperature, PH, moisture, permeability and oxygen level are vital for the degradation of weathered PHs. There are ample microbial processes and growth models have been developed to simulate the biodegration for optimisation. Sookhak Lari et al. have reviewed the models expecially for natural source zone depletion (NSZD) of LNAPL (Sookhak Lari et al., 2019). Garg et al. overviewed the control factors of processing LNAPL in NSZD (Garg et al., 2017). In the common pratice, Mesophilic temperatures, between 20 and 45°C, soil pH range of 5.0–9.0 and SWC between 50–80% by weight of the water-holding capacity are used for bioremediation (Brassington et al., 2007; Frysinger et al., 2003; E (2000). Contamina, 2000). In addition, the saturated permeability (Ksat) for soil should be greater than 10−3 cm/s, to maintain the aerobic metabolism condition with essential oxygen in soil water (Head et al., 2003). However, the soil can become anaerobic if oxygen is consumed faster than it can be replenished from the atmosphere. Biodegradation can also be conducted in anaerobic conditions albeit with a reduction of degradation rate and synthesis of unpleasant odorous compounds, such as hydrogen sulphide and methane (Head et al., 2003). Soil nutrients, such as phosphorus and nitrogen, are also critical for microorganism and bacteria. Therefore, optimising the environmental conditions is an essential factor for the stimulation and augmentation of biodegradation. Computer simulations are commonly used for understanding the basic processes and the rate-determining factors for biodegradation in different environmental conditions. For example, Gogoi et al., conducted laboratory and field pilot bioremediation studies on PH contaminated sites in India based on computer simulation methods (Gogoi et al., 2003).
There are two commonly used microbiological characterisation methods, enumeration studies and soil respirometry. Microbial enumeration is a qualitative measurement that employs plate counts to determine relative numbers of total microbial hydrocarbon degraders (Head et al., 2003). Soil respirometry measures oxygen depletion and carbon dioxide production in soil and provide an indirect measurement of biological activities (Head et al., 2003). The existence of catabolic genes and enzymes play essential biochemical roles to enable the soil endemic microbes to consume the PHs for carbon and energy by decomposition (Srinivasulu and Rangaswamy, 2006). Hence, soil enzymatic activities and microbial biomass carbon (Cmic) are two crucial biological activities that regulate PH attenuation (Alrumman et al., 2015). Well-known enzymes include amylase, arylsulphatases, b-glucosidase, cellulose, chitinase, dehydrogenase, phosphatase, protease, and urease (Das and Varma, 2011). To measure soil enzyme activities, different methodological approaches have been critically and thoroughly examined to distinguish among the various categories of soil enzymes (Nannipieri et al., 2002).
One of the popular techniques is to measure microbial growth and enzyme activity against Cmic throughout incubation with carbon and nitrogen treated soil samples (Srinivasulu and Rangaswamy, 2006). Another popular method is to measure both intracellular and extracellular enzyme activities due to the lysis of microbial cells after CHCl3 fumigation or ultrasonic treatment (Srinivasulu and Rangaswamy, 2006). The most common procedure to determine Cmic, is the chloroform fumigation-extraction approach. According to (Setia et al., 2012), in this method, soils are exposed to chloroform vapour for more than 24 h to lyse the microbial cells. With extraction using 0.5 M K2SO4, the difference between fumigated and non-fumigated carbon is related to Cmic with calibration curves.
Emerging research has recently improved the gaseous expression of PH degradation (Amos et al., 2005; Davis et al., 2005; Johnson et al., 2006; Sihota et al., 2011; McCoy et al., 2014). Soil microbes, methanogenesis comsume PHs and produce methane (CH4) in an anaerobic condition, then the methane is oxidised by soil oxygen to CO2 (CARE, 2018). LNAPL degradation rates in soil subsurface can be determined indirectly using gas flux measurement devices in the field (CARE, 2018). There should be are three soil gas flux methods: gradient method with monitoring sensors (O2, CO2, CH4 and VOC); passive flux trap (PFT) method with caustic CO2 sorbents in a static chamber; and dynamic closed chamber (DCC) with a field gas analyser connected to a ground-mounted chamber. According to CRC CARE technical report 2018 (CARE, 2018), gradient method is suitable for short and long term measurement for NSZD. While the pre-concentrated methods, PFT and DCC are more sensitive and can be applied at sites where CO2 is migrating via diffusion and advection.
Recent research found clay/bacteria interactions can be observed at the range of 1,400–1800 cm−1 wavelength, where Ca-MMT/P. syringae biomass activities can be observed (Fung-Khee, 2020). IR spectroscopy can only provide indications for functioning groups and is not able to distinguish the living and dead organic matter in soil. To determine soil biological activities, instead of locating the characterise IR peaks, an alternative method is to build a calibration model with chemometric regression methods using the IR spectral data. Nath et al. applied spectroscopy data with partial least square regression to predict soil biological activities such as soil microbial biomass, soil enzymes, and Q10 (Nath et al., 2021). The same approach was employed by Janu et al. to determine biochar and biomass (Janu et al., 2021). In their application, multiple linear regressions, such as principal component analysis (PCA) were applied to determine the most important IR peak regions that contributed to soil bio-properties.
Increasing the atmospheric temperature and pressure can increase the molecular kinetic movements and cause a decrease in the surface soil adsorption capacity. The soil adsorption capacity can be decreased by nearly 20% by raising the atmospheric temperature from 5 to 20°C (Yong et al., 1992). Theoretically, an increase in temperature and pressure usually increase the loss of PHs in surface soils by increasing the volatilization rate. However, there is no substantial evidence to support this theory in a practical condition (Spencer, 1970). Adversely, the loss of light PHs might not be affected by the temperature and pressure due to the balance of the soil adsorption process (Spencer, 1970). Volatilization might continue in frozen temperature soils due to the diffusion (Spencer, 1970). Furthermore, Barometric pressure changes or wind may drive the advection of PH vapours. When the atmospheric pressure is lower than the pressure in the subsurface, PH vapours are drawn out to the atmosphere. When the atmospheric pressure is greater than the pressure in the subsurface, PH vapours may be forced into the subsurface (Spencer, 1970).
As previously stated, modifying the SWC affects the soil adsorptive capacity and the PH’s volatilization process. Changes in air humidity and temperature are the sole factors that affect surface SWC (Ravi et al., 2004). Changes in air humidity can have a major impact on surface SWC in arid environments as changes in the SWC can inversely change the soil adsorptive capacity for PHs (Ravi et al., 2004). When the water evaporates, the PHs may hold firmly onto dry soils. The volatilization rate and the vapour density of PHs become reduced by adsorption especially on the dry soil (Yong et al., 1992). As mentioned before, the loss of compounds from the crude oils was shown to tightly correlate to their water solubility (Forsythe et al., 2017; Forsythe et al., 2019). The PHs adsorbed on the surface soil particles can be moved by wind erosion which is widespread in arid and semi-arid regions, where soils are drier and with sparse vegetation cover (Ravi et al., 2004). Intense rainfalls can significantly increase the SWC, until the saturated condition, where the adsorption of hydrocarbons can be reduced to negligible. Rainfall will cause saturation and the PHs in LNAPLs initially adsorbed on the surface soils will be carried to on top of the runoff water with the overland flow as erosion.
Sorption, volatilization, transport and biological transformations occur within soil, and are instrumental in controlling PHs distribution. The degree of hydrocarbon entrapment and sorption is controlled by the physical and chemical properties of the solid phase of soils, such as texture, water, and organic matter content. The smaller soil particles have low porosity and permeability, resulting in significant hydrocarbon adsorption and holding capacity. Changes in the SWC will inversely change the soil adsorptive ability for PHs. For the atmospheric circumstances, both soil adsorption capacity and the volatilization rate of PHs can be affected by the atmospheric temperature and pressure. However, there is no reliable evidence related to these two factors and the loss of PHs in surface soil. It was found that hydrocarbon adsorption occurs predominantly by partitioning into organic matter in the soil. Bacteria and other species capable of decomposing petroleum hydrocarbons can be found in nearly all soils and sediments. Different microbial populations, hydrocarbons, and geochemical and hydrological conditions in the subsoil affect biodegradation rates.
There are pros and cons for both ex-situ and in-situ measurement methods. It is often true that the ex-situ methods can provide higher accuracies and lower detection limits while in situ methods provide rapid results and better coverage. Nevertheless, it is a tendency to use a portable and handheld instrument for fast in-field contaminated land characterisation.
LW: Public responsibility for the content, including participation in the concept, design, analysis, writing, or revision of the manuscript. YC: Public responsibility for the content, including participation in the concept, design, analysis, writing, or revision of the manuscript. RN: Public responsibility for the content, including participation in the concept, design, analysis, writing, or revision of the manuscript. MB: Public responsibility for the content, including participation in the concept, design, writing and revision of the manuscript.
This research was funded by CRC CARE Pt Ltd. The research was conducted in the laboratories of the Global Centre for Environmental Remediation (GCER) at the University of Newcastle.
The authors declare that the research was conducted in the absence of any commercial or financial relationships that could be construed as a potential conflict of interest.
All claims expressed in this article are solely those of the authors and do not necessarily represent those of their affiliated organizations, or those of the publisher, the editors, and the reviewers. Any product that may be evaluated in this article, or claim that may be made by its manufacturer, is not guaranteed or endorsed by the publisher.
Abella, S. R. (2007). Estimating Organic Carbon from Loss-On-Ignition in Northern Arizona forest Soils. Soil Sci. Soc. America J. 71, 545–550. doi:10.2136/sssaj2006.0136
Acher, A. J., Boderie, P., and Yaron, B. (1989). Soil Pollution by Petroleum Products, I. Multiphase Migration of Kerosene Components in Soil Columns. J. Contaminant Hydrol. 4, 333–345. doi:10.1016/0169-7722(89)90032-6
Developments in Petroleum Science in 8-Interfacial Tension. Editor A. Danesh (Amsterdam, Netherlands: Elsevier), Vol. 47.
Alrumman, S. A., Standing, D. B., and Paton, G. I. (2015). Effects of Hydrocarbon Contamination on Soil Microbial Community and Enzyme Activity. J. King Saud Univ. - Sci. 27, 31–41. doi:10.1016/j.jksus.2014.10.001
Amos, R. T., Mayer, K. U., Bekins, B. A., Delin, G. N., and Williams, R. L. (2005). Use of Dissolved and Vapor-phase Gases to Investigate Methanogenic Degradation of Petroleum Hydrocarbon Contamination in the Subsurface. Water Resour. Res. 41 (2), W02001. doi:10.1029/2004wr003433
Aranda, R., Pagan, P, M., and Cano, A, F. (2012). Methodology for the Detection of Contamination by Hydrocarbons and Further Soil Sampling for Volatile and Semi-volatile Organic Enrichment in Former Petrol Stations, SE Spain. Eurasian J. Soil Sci. 1 (1), 10–15.
Asgari, N., Ayoubi, S., Dematte, J. A. M., and Dotto, A. C. (2020). Carbonates and Organic Matter in Soils Characterized by Reflected Energy from 350–25000 Nm Wavelength. J. Mountain Sci. 17 (7), 1636–1651. doi:10.1007/s11629-019-5789-9
Ayoubi, S., Khademi, H., Shirvani, M., and Gyasi-Agyei, Y. (2020). Using Magnetic Susceptibility for Predicting Hydrocarbon Pollution Levels in a Petroleum Refinery Compound in Isfahan Province, Iran. J. Appl. Geophys. 172, 8. doi:10.1016/j.jappgeo.2019.103906
Ayoubi, S., Samadi, M. J., and Shirvani, M. (2021). Changes in Iron Mineralogy and Magnetic Susceptibility during Crude Oil Incubation in Four Textural Soils in Central Iran. J. Appl. Geophys., 190, 104338. doi:10.1016/j.jappgeo.2021.104338
Azadmard, B., Mosaddeghi, M. R., AyoubiChavoshi, S. E., Chavoshi, E., and Raoof, M. (2020). Estimation of Near-Saturated Soil Hydraulic Properties Using Hybrid Genetic Algorithm-Artificial Neural Network. Ecohydrology & Hydrobiology 20, 437–449. doi:10.1016/j.ecohyd.2019.09.001
Babcock, E., and Bradford, J. H. (2014). Reflection Waveform Inversion of Ground-Penetrating Radar Data for Characterizing Thin and Ultrathin Layers of Nonaqueous Phase Liquid Contaminants in Stratified media. Geophysics 80 (2)H1-H11. doi:10.1190/geo2014-0037.1
Barakat, A. O., Qian, Y., Kim, M., and Kennicutt, M. C. (2001). Chemical Characterization of Naturally Weathered Oil Residues in Arid Terrestrial Environment in Al-Alamein, Egypt. Environ. Int. 27, 291–310. doi:10.1016/s0160-4120(01)00060-5
Behroozmand, A. A., Keating, K., and Auken, E. (2015). A Review of the Principles and Applications of the NMR Technique for Near-Surface Characterization. Surv. Geophys. 36, 27–85. doi:10.1007/s10712-014-9304-0
Benka-Cooker, M. O., and Ekundayo, J. A. (1995). Effects of Oil Spill on Soil Physio-Chemial Properties of a Spill Site in the Niger delta Area of Nigeria. Environ. Monit. Assess. 36, 93–109.
BIOWISE (2000). Contaminated Land Remediation - A Review of Biological Technology. Oxon, UK: BIOWISE.
Bittelli, M. (2011). Measuring Soil Water Content: a Review. hortte 21, 293–300. doi:10.21273/horttech.21.3.293
Bowman, G. M., and Hutka, J., Particle Size Analysis, in In Soil Physical Measurement and Interpretation for Land Evaluation. 2002, CSIRO Publishing: Victoria. p. 224–239.
Bradley, M. (2007). Curve Fitting in Raman and IR Spectroscopy: Basic Theory of Line Shapes and Applications. U. S.: Thermo Fisher Scientific.
Brassington, K. J., Hough, R. L., Paton, G. I., Semple, K. T., Risdon, G. C., Crossley, J., et al. (2007). Weathered Hydrocarbon Wastes: A Risk Management Primer. Crit. Rev. Environ. Sci. Technology 37, 199–232. doi:10.1080/10643380600819625
Bray, D. J., Anderson, R. L., Warren, P. B., and Lewtas, K. (2020). Wax Formation in Linear and Branched Alkanes with Dissipative Particle Dynamics. J. Chem. Theor. Comput. 16, 7109–7122. doi:10.1021/acs.jctc.0c00605
Care, C. “Technical Measurement Guidance for LNAPL Natural Source Zone Depletion,” in CRC CARE Technical Report No. 44. 2018 (Newcastle, Australia: CRC for Contamination Assessment and Remediation of the Environment).
Combs, S. M., and Nathan, M. V. (1998). “Soil Organic Matter,” in Recommended Chemical Soil Test Procedures for the North Central Region (Columbia, MO: Missouri Agricultural Experiment Station), 53–58.
Czarnecki, M. A., and Ozaki, Y. (1996). Determination of Integrated Intensities of Overlapped IR Bands by Curve-Fitting, Fourier Self-Deconvolution and a Combination of Both Methods. Spectrochimica Acta A (52), 1593–1601. doi:10.1016/0584-8539(96)01710-2
Czarnecki, M. A., and Ozaki, Y. (1996). Determination of Integrated Intensities of Overlapped IR Bands by Curve-Fitting, Fourier Self-Deconvolution and a Combination of Both Methods. Spectrochimica Acta A: Mol. Biomol. Spectrosc. 52, 1593–1601. doi:10.1016/0584-8539(96)01710-2
Daniels, J. J., Roberts, R., and Vendl, M. (1995). Ground Penetrating Radar for the Detection of Liquid Contaminants. J. Appl. Geophys. 33, 195–207. doi:10.1016/0926-9851(95)90041-1
Das, S. K., and Varma, A. (2011). Role Of Enzymes in Maintaining Soil Health in Soil Enzymology. Berlin/Heidelberg, Germany: Springer.
Davis, G. B., Rayner, J. L., Trefry, M. G., Fisher, S. J., and Patterson, B. M. (2005). Measurement and Modeling of Temporal Variations in Hydrocarbon Vapor Behavior in a Layered Soil Profile. Vadose Zone J. 4, 225–239. doi:10.2136/vzj2004.0029
Everett, K. R. (1978). Some Effects of Oil on the Physical and Chemical Characteristics of Wet Tundra Soils. ARCTIC 31, 260–276. doi:10.14430/arctic2657
Falahatkar, S., Hosseini, S. M., Salman Mahiny, A., Ayoubi, S., and Wang, S.-q. (2014). Soil Organic Carbon Stock as Affected by Land Use/cover Changes in the Humid Region of Northern Iran. J. Mt. Sci. 11 (2), 507–518. doi:10.1007/s11629-013-2645-1
Fine, P., Graber, E. R., and Yaron, B. (1997). Soil Interactions with Petroleum Hydrocarbons: Abiotic Processes. Soil Technology 10, 133–153. doi:10.1016/s0933-3630(96)00088-8
Forsythe, J. C., Martin, R., De Santo, I., Tyndall, R., Arman, K., Pye, J., et al. (2017). Integrating Comprehensive Two-Dimensional Gas Chromatography and Downhole Fluid Analysis to Validate a Spill-Fill Sequence of Reservoirs with Variations of Biodegradation, Water Washing and Thermal Maturity. Fuel 191, 538–554. doi:10.1016/j.fuel.2016.11.081
Forsythe, J. C., O'Donnell, M., Betancourt, S. S., Masurek, N., Gisolf, A., Bennett, B., et al. (2019). Biodegradation and Water Washing in a Spill-Fill Sequence of Oilfields. Fuel 237, 707–719. doi:10.1016/j.fuel.2018.09.144
Frysinger, G. S., Gaines, R. B., Xu, L., and Reddy, C. M. (2003). Resolving the Unresolved Complex Mixture in Petroleum-Contaminated Sediments. Environ. Sci. Technol. 37, 1653–1662. doi:10.1021/es020742n
Fung-Khee, F. (2020). “FTIR Analysis of Bacteria Biomass-Mineral Interactions in Soils,” in CUNY Academic Works. Available at: https://academicworks.cuny.edu/cc_etds_theses/841.
Gardner, W. R. (1956). Calculation of Capillary Conductivity from Pressure Plate Outflow Data. Soil Sci. Soc. America J. 20, 317–320. doi:10.2136/sssaj1956.03615995002000030006x
Garg, S., Newell, C. J., Kulkarni, P. R., King, D. C., Adamson, D. T., Renno, M. I., et al. (2017). Overview of Natural Source Zone Depletion: Processes, Controlling Factors, and Composition Change. Groundwater Monit. R. 37 (3), 62–81. doi:10.1111/gwmr.12219
Gazulla, M., F., Rodrigo, M., Orduña, M., and Gómez, C. M. (2012). Determination of Carbon, Hydrogen, Nitrogen and Sulfur in Geological Materials Using Elemental Analysers. Geostandards geoanalytical Res. 36 (2), 201–217. doi:10.1111/j.1751-908x.2011.00140.x
German, W. L., and Harding, D. A. (1969). The Adsorption of Aliphatic Alcohols by Montmorillonite and Kaolinite. Clay miner. 8, 213–227. doi:10.1180/claymin.1969.008.2.09
Ghanbarian, B., Ioannidis, M. A., and Hunt, A. G. (2017). Theoretical Insight into the Empirical Tortuosity‐Connectivity Factor in the Burdine‐Brooks‐Corey Water Relative Permeability Model. Water Resour. Res. 53 (12), 10395–10410. doi:10.1002/2017wr021753
Gogoi, B. K., Dutta, N. N., Goswami, P., and Krishna Mohan, T. R. (2003). A Case Study of Bioremediation of Petroleum-Hydrocarbon Contaminated Soil at a Crude Oil Spill Site. Adv. Environ. Res. 7, 767–782. doi:10.1016/s1093-0191(02)00029-1
Greene-Kelly, R. (1954). Sorption of Aromatic Organic Compounds by Montrnorillonite. Part II. Packing Studies with Pyridine. Trans. Faraday Soc. 51, 425–430. doi:10.1039/TF9555100425
Greene-Kelly, R. (1954). Sorption of Aromatic Organic Compounds by Montrnorillonite. Part I. Orientation Studies. Trans. Faraday Soc. 51, 412–424. doi:10.1039/TF9555100412
Griffiths, P. R., and De Haseth, J. A. (2007). Fourier Transform Infrared Spectrometry. U. S.: John Wiley & Sons.
Gudin, C. (1978). Interaction between Oil-Vegetation and Soil. International Symposium on Ground Water Pollution by Oil Hydrocarbons. Prague: International press Praha, 411–417.
Guenzi, W. D., and Bear, W. E. (1974). Volatilization of Pesticides. Chapter 6, Pesticides in Soil and Water. U S: Soil Science Society of America.
Guerin, T. F. (2000). Long-term Performance of a Land Treatment Facility for the Bioremediation of Non-volatile Oily Wastes. Resour. Conservation Recycling 28, 105–120. doi:10.1016/s0921-3449(99)00036-1
Hanks, R. J., and Ashcroft, G. L. (1980). Applied Soil Physics: Soil Water and Temperature Application. Berlin/Heidelberg, Germany: Springer-Verlag.
Havaee, S., Ayoubi, S., Mosaddeghi, M. R., and Keller, T. (2014). Impacts of Land Use on Soil Organic Matter and Degree of Compactness in Calcareous Soils of central Iran. Soil Use Manage 30 (1), 2–9. doi:10.1111/sum.12092
Hayes, M. H. B., Tseng, T. Y., and Wang, M. K. (2007). Chemistry of Soil Organic Matter. Taiwan J. Sci. 22, 215–226.
Head, I. M., Singleton, I., and Milner, M. G. (2003). Bioremediation: A Critical Review. England: Horizon Scientific Press.
Hoyle, F., C. (2013). in Managing Soil Organic Matter: A Practical Guide. Editor J. Paterson (Barton, ACT: Grains Research and Development Corporation).
Hubbard, S. S., Rubin, Y., and Majer, E. (1997). Ground-penetrating-radar-assisted Saturation and Permeability Estimation in Bimodal Systems. Water Resour. Res. 33, 971–990. doi:10.1029/96wr03979
Interim Final Petroleum Report: Development of Health-Based Alternative to the Total Petroleum Hydrocarbon (TPH) Parameter. 1994, Boston, MA, U. S.: Massachusetts Department of Environmental Protection, Executive Office of Environmental Affairs
Irwin, R. J., Stevens, L., Seese, M. D., and Basham, W. (1998). Environmental Contaminants Encyclopaedia. Washington, DC: National government publication.
Janu, R., Mrlik, V., Ribitsch, D., Hofman, J., Sedláček, P., Bielská, L., et al. (2021). Biochar Surface Functional Groups as Affected by Biomass Feedstock, Biochar Composition and Pyrolysis Temperature. Carbon Resour. Convers. 4, 36–46. doi:10.1016/j.crcon.2021.01.003
Jarsjö, J., Destouni, G., and Yaron, B. (1994). Retention and Volatilization of Kerosene: Laboratory Experiments on Glacial and post-glacial Soils. J. Contaminant Hydrol. 17, 167–185. doi:10.1016/0169-7722(94)90020-5
Johansen, S. E., Amundsen, H. E. F., Røsten, T., Ellingsrud, S., Eidesmo, T., and Bhuiyan, A. H. (2005). Subsurface Hydrocarbons Detected by Electromagnetic Sounding. First Break 23 (3). doi:10.3997/1365-2397.2005005
Johnson, P., Lundegard, P., and Liu, Z. (2006). Source Zone Natural Attenuation at Petroleum Hydrocarbon Spill Sites-I: Site-specific Assessment Approach. Groundwater Monit. Remediation 26 (4), 82–92. doi:10.1111/j.1745-6592.2006.00114.x
Jol, H. M. (2009). Ground Penetrating Radar : Theory and Applications. Amsterdam, Netherlands: Elsevier.
Karickhoff, S. W. (1981). Semi-empirical Estimation of Sorption of Hydrophobic Pollutants on Natural Sediments and Soils. Chemosphere 10, 833–846. doi:10.1016/0045-6535(81)90083-7
Keller, J. M., and Simmons, C. S. (2005). The Influence of Selected Liquid and Soil Properties on the Propagation of Spills over Flat Permeable Surfaces. Washington: Pacific Northwest National Laboratory.
Knight, R. (2001). Ground Penetrating Radar for Environmental Applications. Annu. Rev. Earth Planet. Sci. 29, 229–255. doi:10.1146/annurev.earth.29.1.229
Koçak, A., Wyatt, W., and Comanescu, M. A. (2021). Comparative Study of ATR and DRIFT Infrared Spectroscopy Techniques in the Analysis of Soil Samples. Forensic Sci. Int., 328. doi:10.1016/j.forsciint.2021.111002
Larter, S., Huang, H., Adams, J., Bennett, B., and Snowdon, L. R. (2012). A Practical Biodegradation Scale for Use in Reservoir Geochemical Studies of Biodegraded Oils. Org. Geochem. 45, 66–76. doi:10.1016/j.orggeochem.2012.01.007
Leary, P. E., Dobson, G. S., and Reffner, J. A. (2016). Development and Applications of Portable Gas Chromatography-Mass Spectrometry for Emergency Responders, the Military, and Law-Enforcement Organizations. Appl. Spectrosc. 70, 888–896. doi:10.1177/0003702816638294
McCoy, K., Zimbron, J., Sale, T., and Lyverse, M. (2014). Measurement of Natural Losses of LNAPL Using CO2Traps. Groundwater 53 (4), 658–667. doi:10.1111/gwat.12240
McDonald, R. C., Isbell, R. F., Speight, J. G., Walker, J., and Hopkins, M. S. (1998). Australian Soil and Land Survey Field Handbook (Canberra, Austrlia: ustralian Collaborative Land Evaluation Program).
Mercer, J. W., and Cohen, R. M. (1990). A Review of Immiscible Fluids in the Subsurface. J. Contam. Hydrol. 6, 7–163. doi:10.1016/0169-7722(90)90043-g
Meuzelaar, H. L. C., Dworzanski, J. P., Arnold, N. S., McClennen, W. H., and Wager, D. J. (2000). Advances in Field-Portable mobile GC/MS Instrumentation. Field Analyt. Chem. Technol. 4, 3–13. doi:10.1002/(sici)1520-6521(2000)4:1<3:aid-fact2>3.0.co;2-m
Nannipieri, P., Kandeler, E., and Ruggiero, P. (2002). “Enzyme Activities and Microbiological and Biochemical Processes in Soil,” in Enzymes in the Environment: Activity, Ecology and Applications. Editor R. P. D. R. G. Burns (New Yorker: CRC Press), 1–33.
Nath, D., Laik, R., Meena, V. S., Pramanick, B., and Singh, S. K. (2021). Can Mid-infrared (Mid-IR) Spectroscopy Evaluate Soil Conditions by Predicting Soil Biological Properties? Soil security 4, 100008. doi:10.1016/j.soisec.2021.100008
Nathwani, J. S., and Philips, C. R. (1997). Adsorption-desorption of Selected Hydrocarbons in Crude Oil and Soils. Chemosphere 4, 157–162.
National primary drinking (1995). National Primary Drinking Water Regulations, Contaminant Specific Fact Sheets, Volatile Organic Chemicals—Technical Version. U.S. Environmental Protection Agency
Nazir, A. K. (2011). Effect of Motor Oil Contamination on Geotechnical Properties of over Consolidated clay. Alexandria Eng. J. 50, 331–335. doi:10.1016/j.aej.2011.05.002
Nudelman, N. S., Rios, I. S., and Katusich, O. (2002). Fate of the Oil Residuals in Patagonian Soils Effects of the Environmental Exposure Time. J. Environ. Assess. Remediation 3, 1–8.
Nye, P. H., Yaron, B., Galin, T., and Gerstl, Z. (1994). Volatilization of a Multicomponent Liquid through Dry Soils: Testing a Model. Soil Sci. Soc. America J. 58, 269–277. doi:10.2136/sssaj1994.03615995005800020002x
Ochs, J., and Klitzsch, N. (2020). Considerations Regarding Small-Scale Surface and Borehole-To-Surface Electrical Resistivity Tomography. J. Appl. Geophys. 172, 103862. doi:10.1016/j.jappgeo.2019.103862
Odeh, A. S. (1959). Effect of Viscosity Ratio on Relative Permeability (Includes Associated Paper 1496-G). Pet. Trans. AIME 216, 346–353. doi:10.2118/1189-g
Olejnik, S., Posner, A. M., and Quirk, J. P. (1974). Swelling of Montmorillonite in Polar Organic Liquids. Clays and Clay Minerals 22, 361–365. doi:10.1346/ccmn.1974.0220407
Pan, S., Zuo, J. Y., Chen, Y., and Mullins, O. C. (2016). A Multicomponent Diffusion Model for Gas Charges into Oil Reservoirs. Fuel 180, 384–395. doi:10.1016/j.fuel.2016.04.055
Peters, K. E., and Moldowan, J. M. (1993). The Biomarker Guide: Interpreting Molecular Fossils in Petroleum and Ancient Sediments. United States.
Potter, T. L., and Simmons, K. E. (1998). “Composition of Petroleum Mixtures,” in Total Petroleum Hydrocarbon Criteria Working Group Series (Amherst: Amherst Scientific Publishers), 2, 102.
Ravi, S., D'Odorico, P., Over, T., and Zobeck, T. (2004). On the Effect of Air Humidity on Soil Susceptibility to Wind Erosion: The Case of Air-Dry Soils. Geophys. Res. Lett., 31. doi:10.1029/2004gl019485
Rezanezhad, F., Quinton, W. L., Price, J. S., Elrick, D., Elliot, T. R., and Heck, R. J. (2009). Examining the Effect of Pore Size Distribution and Shape on Flow through Unsaturated Peat Using 3-D Computed Tomography. Hydrol. Earth Syst. Sci. Discuss. 6, 3835–3862.
Rostron, P. D., Heathcote, J. A., and Ramsey, M. H. (2014). Comparison Betweenin Situandex Situgamma Measurements on Land Areas within a Decommissioning Nuclear Site: a Case Study at Dounreay. J. Radiol. Prot. 34, 495–508. doi:10.1088/0952-4746/34/3/495
Sadler, R., and Connell, D. (2003). “Analytical Methods for the Determination of Total Petroleum Hydrocarbons in Soil,” in The Fifth National Workshop on the Assessment of Site Contamination. Editors A. Langley, and M. B. GilbeyKennedy (Canberra ACT: The National Environment Protection Council), 133–150.
Saidian, M., Kuila, U., Godinez, L. J., Rivera, S., and Prasad, M. (2014). “A Comparative Study of Porosity Measurement in MudRocks,” in SEG Denver 2014 Annual Meeting. Denver, Colorado, 2433. doi:10.1190/segam2014-0426.1
Salehi, M. H., Hashemibeni, O., Beigiharchegani, H., Esfandiarpour Borujeni, I., and Motaghian, H. R. (2011). Refining Soil Organic Matter Determination by Loss-On-Ignition. Pedosphere 21, 473–482. doi:10.1016/s1002-0160(11)60149-5
Sandberg, C. R., Gournay, L. S., and Sippel, R. F. (1958). The Effect of Fluid-Flow Rate and Viscosity on Laboratory Determinations of Oil-Water Relative Permeabilities. Pet. Trans. AIME 213, 36–43. doi:10.2118/709-g
Schuler, B., Fatayer, S., Meyer, G., Rogel, E., Moir, M., Zhang, Y., et al. (2017). Heavy Oil Based Mixtures of Different Origins and Treatments Studied by Atomic Force Microscopy. Energy Fuels 31 (7), 6856–6861. doi:10.1021/acs.energyfuels.7b00805
Schuler, B., Meyer, G., Peña, D., Mullins, O. C., and Gross, L. (2015). Unraveling the Molecular Structures of Asphaltenes by Atomic Force Microscopy. J. Am. Chem. Soc. 137 (31), 9870–9876. doi:10.1021/jacs.5b04056
Schulze, S., Nikrityuk, P. A., and Meyer, B. (2015). Porosity Distribution in Monodisperse and Polydisperse Fixed Beds and its Impact on the Fluid Flow. Particularte Sci. Technology 33. doi:10.1080/02726351.2014.923960
Setia, R., Verma, S. L., and Marschner, P. (2012). Measuring Microbial Biomass Carbon by Direct Extraction - Comparison with Chloroform Fumigation-Extraction. Eur. J. Soil Biol. 53, 103–106. doi:10.1016/j.ejsobi.2012.09.005
Sihota, N. J., Singurindy, O., and Mayer, K. U. (2011). CO2-Efflux Measurements for Evaluating Source Zone Natural Attenuation Rates in a Petroleum Hydrocarbon Contaminated Aquifer. Environ. Sci. Technol. 45, 482–488. doi:10.1021/es1032585
Sookhak Lari, K., Davis, G. B., and Johnston, C. D. (2016). Incorporating Hysteresis in a Multi-phase Multi-Component NAPL Modelling Framework; a Multi-Component LNAPL Gasoline Example. Adv. Water Resour. 96, 190–201. doi:10.1016/j.advwatres.2016.07.012
Sookhak Lari, K., Davis, G. B., Rayner, J. L., Bastow, T. P., and Puzon, G. J. (2019). Natural Source Zone Depletion of LNAPL: A Critical Review Supporting Modelling Approaches. Water Res. 157, 630–646. doi:10.1016/j.watres.2019.04.001
Soriano-Disla, J. M., Janik, L. J., Viscarra Rossel, R. A., MacDonald, L. M., and McLaughlin, M. J. (2014). The Performance of Visible, Near-, and Mid-infrared Reflectance Spectroscopy for Prediction of Soil Physical, Chemical and Biological Properties. Appl. Spectrosc. Rev. 49, 139–186. doi:10.1080/05704928.2013.811081
Spencer, W. F. (1970). “Distribution of Pesticides between Soil, Water and Air,” in Pesticides in the Soils: Ecology, Degradation and Movement (Michigan, U. S.: Michigan State University), 120–128.
Spurlin, M. S., Barker, B. W., Cross, B. D., and Divine, C. E. (2019). Nuclear Magnetic Resonance Logging: Example Applications of an Emerging Tool for Environmental Investigations. Remediation 29, 63–73. doi:10.1002/rem.21590
Srinivasulu, M., and Rangaswamy, V. (2006). Activities of Invertase and Cellulase as Influenced by the Application of Tridemorph and Captan to Groundnut (Arachis hypogaea) Soil. Afr. J. Biotechnol. 5, 175–180.
Torabzadeh, S. J., and Handy, L. L. (1984). The Effect of Temperature and Interfacial Tension on Water/Oil Relative Permeabilities of Consolidated Sands. Tulsa, Oklahoma: SPE-AIME.
Uzoije, A. P., and Agunwamba, J. C. (2011). Physiochemical Properties of Soil in Relation to Varying Rates of Crude Oil Pollution. J. Environ. Sci. Technology 4, 313–323. doi:10.3923/jest.2011.313.323
van Darn, J. (1967). The Migration of Hydrocarbons in a Water-Bearing Stratum, Joint Problems of the Oil and Water Industries. London: The institution of Petroleum.
Visotin, A., and Lennard, C. (2016). Preliminary Evaluation of a Next-Generation Portable Gas Chromatograph Mass Spectrometer (GC-MS) for the On-Site Analysis of Ignitable Liquid Residues. Aust. J. Forensic Sci. 48, 203–221. doi:10.1080/00450618.2015.1045554
Volkov, D. S., Rogova, O, B., and Proskurnin, M. A. (2021). Organic Matter and Mineral Composition of Silicate Soils: FTIR Comparison Study by Photoacoustic, Diffuse Reflectance, and Attenuated Total Reflection Modalities. agronomy 11 (1879), 30. doi:10.3390/agronomy11091879
Wang, L., Cheng, Y., Lamb, D., Dharmarajan, R., Chadalavada, S., and Naidu, R. (2019). Application of Infrared Spectrum for Rapid Classification of Dominant Petroleum Hydrocarbon Fractions for Contaminated Site Assessment. Spectrochimica Acta Part A: Mol. Biomol. Spectrosc. 207, 183–188. doi:10.1016/j.saa.2018.09.024
Wang, L., Cheng, Y., Lamb, D., and Naidu, R. (2020). The Application of Rapid Handheld FTIR Petroleum Hydrocarbon-Contaminant Measurement with Transport Models for Site Assessment: a Case Study. Geoderma (114017), 361. doi:10.1016/j.geoderma.2019.114017
Wang, L., Cheng, Y., Naidu, R., Chadalavada, S., Bekele, D., Gell, P., et al. (2021a). Application of Portable Gas Chromatography-Mass Spectrometer for Rapid Field Based Determination of TCE in Soil Vapour and Groundwater. Environ. Technol. Innov. 1001274, 21. doi:10.1016/j.eti.2020.101274
Wang, L., Cheng, Y., Naidu, R., Gell, P., and Bowman, M. (2021b). Rapid In-Field Approaches for Delineating VOC in Both Soil Vapour and Groundwater for Vapour Intrusion Assessment. Front. Environ. Sci. 9. doi:10.3389/fenvs.2021.746195
Wang, Z., and Fingas, M. (1995). Differentiation of the Source of Spilled Oil and Monitoring of the Oil Weathering Process Using Gas Chromatography-Mass Spectrometry. J. Chromatogr. A 712, 321–343. doi:10.1016/0021-9673(95)00546-y
Weisman, W. (1998). Analysis of Petroleum Hydrocarbons in Environmental media. Total Pet. Hydrocarbon Criteria Working Group Ser. 1, 98.
Wenger, L. M., Davis, C. L., and Isaksen, G. H. (2002). Multiple Controls on Petroleum Biodegradation and Impact on Oil Quality. SPE Reservoir Eval. Eng. 5, 375–383. doi:10.2118/80168-pa
Wiedemeier, T. H., Wilson, J. T., Kampbell, D. H., Miller, R. N., and Hansen, J. E. (1995). “Technical Protocol for Implementing Intrinsic Remediation with Long-Term Monitoring for Natural Attenuation of Fuel Contamination Dissolved in Groundwater,” in T.T.D. Ir Force Center for Environmental Excellence (Texas, United States: Brooks Air Force Base), 295.
Wild, A. (1993). Soils and the Environment: An Introduction, 156. Cambridge,U K: Cambridge University Press, 429.
Williams, S. D., Ladd, D. E., and Farmer, J. J. (2002). “Fate and Transport of Petroleum Hydrocarbons in Soil and Ground Water at Big South Fork National River and Recreation Area,” in Geological Survey Scientific Investigations Report 2005-2014. 2003 (U.S.: Tennessee and Kentucky), 29.
Yaron, B. (1989). On the Behavior of Petroleum Hydrocarbons in the Unsaturated Zone: Abiotic Aspects. Ecol. Study 73, 211–230. doi:10.1007/978-3-642-74468-6_10
Yerokun, O. A., Chikuta, S., and Mambwe, D. (2007). An Evaluation of Spectroscopic and Loss on Ignition Methods for Estimating Soil Organic Carbon in Zambian Soils. Int. J. Agric. Res. 2 (11), 965–970. doi:10.3923/ijar.2007.965.970
Yong, R. N., Mohamed, A. M. O., and Warkentin, B. P. (1992). Principles of Contaminant Transport in Soils. Amsterdam: Elsevier.
Zolfaghari, Z., Mosaddeghi, M. R., and Ayoubi, S. (2015). ANN-based Pedotransfer and Soil Spatial Prediction Functions for Predicting Atterberg Consistency Limits and Indices from Easily Available Properties at the Watershed Scale in Western Iran. Soil Use Manage 31 (1), 142–154. doi:10.1111/sum.12167
Zolfaghari, Z., Mosaddeghi, M. R., Ayoubi, S., and Kelishadi, H. (2015). Soil Atterberg Limits and Consistency Indices as Influenced by Land Use and Slope Position in Western Iran. J. Mt. Sci. 12 (6), 1471–1483. doi:10.1007/s11629-014-3339-z
Zuo, J. Y., Jackson, A., Herold, B., Kumar, S., Santo, I. D., Dumont, H., et al. (2015). Diffusion Model Coupled with the Flory-Huggins-Zuo Equation of State and Yen-Mullins Model Accounts for Large Viscosity and Asphaltene Variations in a Reservoir Undergoing Active Biodegradation. Energy Fuels 29, 1447–1460. doi:10.1021/ef502586q
Keywords: petroleum hydrocarbons, contaminated site characterisation, soil properties, in/ex-situ measurements, handheld fourier transform infrared spectroscopy
Citation: Wang L, Cheng Y, Naidu R and Bowman M (2021) The Key Factors for the Fate and Transport of Petroleum Hydrocarbons in Soil With Related in/ex Situ Measurement Methods: An Overview. Front. Environ. Sci. 9:756404. doi: 10.3389/fenvs.2021.756404
Received: 10 August 2021; Accepted: 23 November 2021;
Published: 20 December 2021.
Edited by:
Anabela Cachada, University of Porto, PortugalReviewed by:
Veerasingam S., Qatar University, QatarCopyright © 2021 Wang, Cheng, Naidu and Bowman. This is an open-access article distributed under the terms of the Creative Commons Attribution License (CC BY). The use, distribution or reproduction in other forums is permitted, provided the original author(s) and the copyright owner(s) are credited and that the original publication in this journal is cited, in accordance with accepted academic practice. No use, distribution or reproduction is permitted which does not comply with these terms.
*Correspondence: Liang Wang, TGlhbmcuV2FuZ0BuZXdjYXN0bGUuZWR1LmF1
Disclaimer: All claims expressed in this article are solely those of the authors and do not necessarily represent those of their affiliated organizations, or those of the publisher, the editors and the reviewers. Any product that may be evaluated in this article or claim that may be made by its manufacturer is not guaranteed or endorsed by the publisher.
Research integrity at Frontiers
Learn more about the work of our research integrity team to safeguard the quality of each article we publish.