 Yueyuan Zheng
 Gang Wu*
- College of Information, Beijing Forestry University, Beijing, China
Automatic tree identification and position using high-resolution remote sensing images are critical for ecological garden planning, management, and large-scale environmental quality detection. However, existing single-tree detection methods have a high rate of misdetection in forests not only due to the similarity of background and crown colors but also because light and shadow caused abnormal crown shapes, resulting in a high rate of misdetections and missed detection. This article uses urban plantations as the primary research sample. In conjunction with the most recent deep learning method for object detection, a single-tree detection method based on the lite fourth edition of you only look once (YOLOv4-Lite) was proposed. YOLOv4’s object detection framework has been simplified, and the MobileNetv3 convolutional neural network is used as the primary feature extractor to reduce the number of parameters. Data enhancement is performed for categories with fewer single-tree samples, and the loss function is optimized using focal loss. The YOLOv4-Lite method is used to detect single trees on campus, in an orchard, and an economic plantation. Not only is the YOLOv4-Lite method compared to traditional methods such as the local maximum value method and the watershed method, where it outperforms them by nearly 46.1%, but also to novel methods such as the Chan-Vese model and the template matching method, where it outperforms them by nearly 26.4%. The experimental results for single-tree detection demonstrate that the YOLOv4-Lite method improves accuracy and robustness by nearly 36.2%. Our work establishes a reference for the application of YOLOv4-Lite in additional agricultural and plantation products.
1 Introduction
The smallest tree entity that makes up a terrestrial ecosystem is a single tree. Single-tree detection and positioning are critical components of precision forestry (Dimitrios and Azadeh, 2021; Dimitrios et al., 2021). Precision forestry is critical for reducing environmental pollution caused by catkins (BAILU, 2018) and monitoring the environmental impact of economic forests (Wang, 2019; Dong et al., 2020; Zhibin et al., 2020). With the advancement and popularization of the remote sensing image processing technology, the efficient collection of massive amounts of information about individual trees and the establishment of single-tree databases form the foundation for accurate and intensive urban forestry management and are also the developmental goal of a new generation of intelligent forestry (Olli et al., 2017; Gomes et al., 2018). Indeed, some individual forestry fields in China have implemented intensive management at the single-tree level, such as managing ancient and famous trees, managing female willow trees precisely in Beijing, and managing fruit trees (Xiao et al., 2021). However, these are primarily accomplished through traditional ground surveys, which are inefficient and require a significant amount of time. Single-tree extraction from remote sensing images is a critical technology for efficiently constructing a single-tree database built on the foundation of single-tree detection from remote sensing images. Remote sensing platforms and associated processing technologies have advanced rapidly in recent years (Toth and Jozkow, 2016). Although active remote sensing technologies such as lidar have been used to detect single trees (including their position and height) and to build inversion models (Bouvier et al., 2015), their costs are prohibitively high, and they are not suitable for large-scale acquisition. However, single-tree extraction using high-resolution optical remote sensing images remains a research hotspot due to its strong technical foundation, large image scale, widespread availability, and ease of promotion and application (Wulder et al., 2000; Picos et al., 2020). Numerous studies on passive remote sensing demonstrate that the data source, season, tree growth (Liu et al., 2018), and the location method selection (Larsen et al., 2011) are all significant factors affecting the effect of a single-tree location. Regarding the problem of locating a single tree, scholars have successively proposed two types of methods, one is the direct location method, such as the local maximum method (Wulder et al., 2000) and threshold segmentation, for locating a single-tree tip. The other is individual tree crown detection and delineation (ITCD) (Yinghai et al., 2015), such as watershed methods (Wang et al., 2004; Zheng et al., 2017), the valley floor tracking method (Gougeon, Fran ois, 2014), the regional growth method (Jiang et al., 2016), and the marker process method (Gomes et al., 2018). Recently, scholars have experimented with a variety of novel positioning techniques, including peak climbing (Zhang et al., 2014), CV model (Nasor and Obaid, 2021), template matching (Hashim et al., 2020), and machine learning (Dong et al., 2019). Currently, the accuracy of the single-tree positioning method is insufficient to meet practical requirements, and no method is adaptable to a variety of forests (Zhang et al., 2019). ICD’s primary challenges are as follows: 1) close spacing between single trees and canopy intersections results in over or under-segmentation within a single crown and between overlapping crowns, resulting in misdetection and missed detection of single-tree positioning. 2) The region background color is similar to that of a single tree, and the region background is complex and diverse. The background is incorrectly identified as the tree’s crown, and the region exhibits the phenomenon of under-segmentation, resulting in the problem of error and missing detection. 3) It is unclear how the sunlight shadow affects the shape of the trees and canopy outline. There is no way to collect all single-tree templates. 4) When multiple trees of varying sizes cover the same area, a large number of saplings can easily escape detection. As a result, it is necessary to investigate a more efficient and stable method for a single-tree location.
Traditional object detection methods can be broadly classified into three categories: 1) region selection (Zhou et al., 2021), such as sliding window; 2) classifiers, such as support vector machines (SVMs) (Rau et al., 2021); 3) feature extraction, such as scale-invariant feature transform (SIFT) (Liang et al., 2020) and histogram of oriented gradient (HOG) (Syaputra et al., 2021). There are two significant issues with it. First, the region selection is not targeted, is time-consuming, and contains numerous redundant windows. On the other hand, the characteristics have a low degree of robustness, and many small objects are overlooked. Following the advent of deep learning, object detection has made a significant leap forward (Zhao et al., 2020). There are two primary areas of emphasis: 1) CNNs based on region proposal (R-CNN) (Ma et al., 2020), spatial pyramid pooling networks (SPP-Nets) (Wang et al., 2020), and fast R-CNN (Garcia-Ortiz et al., 2020). Faster R-CNN is used to represent deep learning object detection algorithms. 2) Regression-based deep learning object detection algorithms are represented as you only look once (YOLO) (Chaitanya et al., 2020). The former predicts the speeds of between 7 and 18 frames per second, which is too time-consuming. The latter makes use of the regression concept, which determines an input image and directly regresses the object boundary and object category of multiple locations in the image, significantly speeding up the prediction process. It has a long history of use in medicine, fishing, construction, and various other fields. This study performs the urban single-tree detection and positioning using the deep learning network model YOLOv4 (Richey and Shirvaikar, 2021). This model has a high detection speed and is capable of multi-object detection. A YOLOv4-Lite single-tree detection method is proposed to further integrate the YOLOv4 network model (Meneghetti et al., 2021), simplify the entire feature extraction network, optimize loss, and enhance sample data.
2 Methodologies
2.1 Data Enhancement
By referencing CutMix (Artés-hernández et al., 2017) data enhancement, the number of reconstructed images is increased from two to four using mosaic (Hofmann, 2000) data enhancement. First, four images from the dataset are chosen. Then, as illustrated in Figure 1, the four images are flipped, scaled, rotated, and gamut-adjusted, and other processing is applied. Finally, the four images are scaled and spliced together to create a single image containing the actual box. The blank spaces are filled with gray to align the training images with the network’s characteristic size. One of the significant advantages of mosaic data enhancement approach is that it provides a rich background for object detection and can compute data from four images at once during the batch normalization calculation.

FIGURE 1. Image of data enhancement.
2.2 MobileNetv3
Deeply separable convolution is a factorized operation that can be decomposed into depthwise
The formula for
where
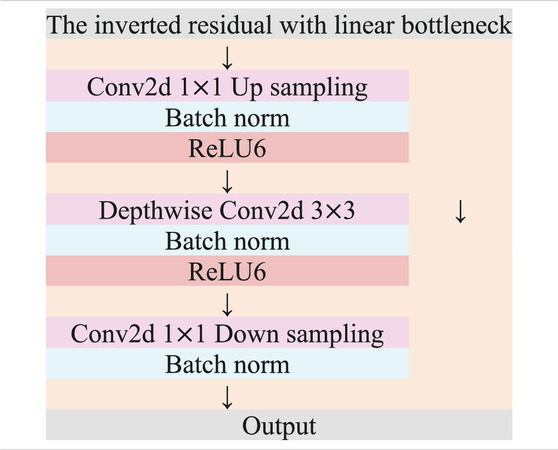
TABLE 1. Inverted residual with linear bottleneck.
The backbone network uses MobileNetv3, which employs a unique BNECK architecture. The structure of BNECK is shown in Figure 2, where
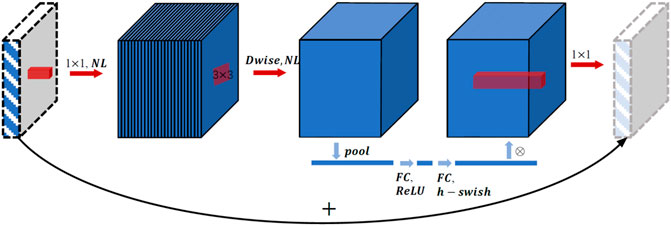
FIGURE 2. Structure of BNECK.
The detailed structural parameters of the entire MobileNetv3 are listed in Table 2. The first column, “Input,” denotes the shape changes associated with each MobileNetv3 feature layer. The second column, “Operator,” indicates the block structure through which each feature layer will pass. As it can be seen, feature extraction occurs via a variety of BNECK structures in MobileNetv3. The third and fourth columns indicate the number of channels after inverting the residual structure in BNECK and the number of channels at the characteristic layer when input to BNECK, respectively. The fifth column, “SE,” indicates whether or not this level introduces attention mechanisms. The sixth column, “NL,” represents the type of activation function, that is, “HS” for
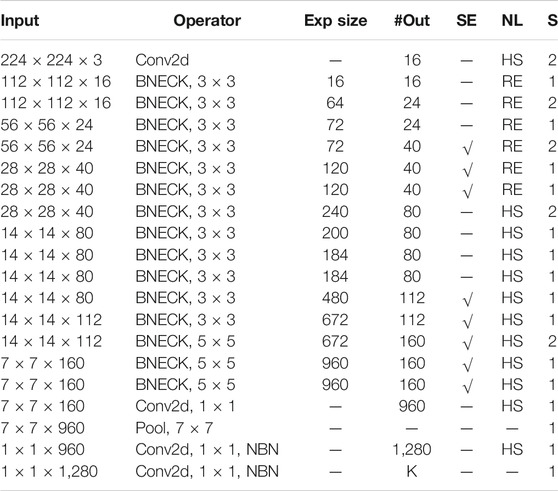
TABLE 2. Structure of MobileNetv3.
2.3 Feature Pyramid
As illustrated in Figure 3, the feature pyramid is composed of two components: SPP and PANet. Their primary purpose is to improve feature extraction. “Concat + Conv a×a” is a deeply separable convolution, where “a×a” denotes depthwise convolution with aa’s convolution kernel. The result of the backbone network is convolved by 3 × 3 in the SPP structure, and then the maximum pooling of 5, 9, and 13 is performed, finally resulting in 3 × 3 profoundly separable convolutions. PANet’s structure is depicted in Figure 3. By substituting deeply separable convolution blocks for standard convolution, the model’s parameter count can be reduced.
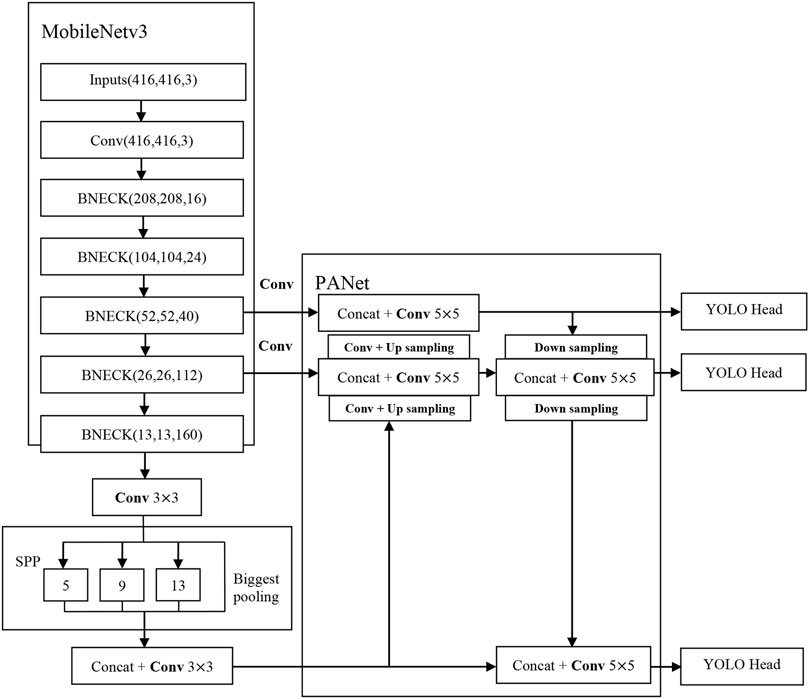
FIGURE 3. Schematic diagram of YOLOv4-Lite.
2.4 YOLO Head and Parameter Controller
As illustrated in Figure 3, YOLO Head makes predictions using the extracted features from the backbone network and strengthened by the feature pyramid. YOLO Head is primarily composed of a convolution of 3 × 3 and a convolution of 1 × 1. Convolution of 3 × 3 is used to integrate all features, whereas convolution of 1 × 1 is used for prediction.
To reduce the number of parameters and improve the detection accuracy of the whole network, the α parameter is set at feature pyramid and Yolo Head, and the formula is as follows:
where γ is the number of channels per convolution, β is quantitative and is the value each convolution needs to set in advance, and α is a global variable. The number of channels in a convolutional network can be controlled by adjusting the α parameter.
2.5 Loss Function
Due to the unbalanced and difficult-to-classify nature of the single-tree data collected in plantation monitoring, the YOLOv4-Lite uses focal loss to optimize the classification loss (Ruihuan hou, 2021; YuZ, 2021). In a one-stage model, the focal loss can be used to correct the background classification imbalance and the serious imbalance of positive and negative samples. The loss function in the YOLOv4 is divided into three components: position loss, confidence loss, and class loss. By combining the cross-entropy loss function, the sigmoid is calculated. Cross-entropy measures the distance between the actual output of the activation function and the expected output value in a multi-classification task. The lower the cross-entropy, the more compact the probability distribution. The following is the calculation formula:
where
where
3 Experiments
3.1 Experimental Platform
This study’s experimental model is built on the Keras = 2.1.5 framework, Python = 3.6, and the Spyder platform. The model is trained on an experimental 11th Gen Intel(R) Core (TM) i7-11800H at 2.30GHz, NVIDIA GeForce RTX 3060 Laptop GPU, and 16.0 GB of RAM running Windows x64.
3.2 Datasets
3.2.1 Dataset Description
There are specific management requirements for individual plants for urban plantation, such as catkin management and wind-fallen tree management. Furthermore, the technical foundation is sound. The urban plantation is classified into three types: campus, orchard, and economic plantation. To verify the single-tree detection experiment, sample sites from these three types of urban plantations were chosen.
In June 2019, the green trees surrounding Beijing Forestry University’s basketball court were located at 11,620′8.76″E, 400′6.52″N. The campus’s primary tree species were broad-leaved Sophora japonica Linn and steamed bread willow (Salix matsudana var. matsudana F. umbraculifera Rehd.). In December 2017, the litchi orchard was located in Shenzhen’s Bao ‘a District at 11,353′26.34″E, 2,238′41.22″N. The image of a section of a palm plantation in Phang Nga, Thailand, was taken at 9,820′53.22″ E, 827′18.45″ N. Google Earth images with a spatial resolution of 0.27m, a scale of 800:1, and a visual field height of 1 km were used in our experiment.
Due to Thailand’s extensive palm cultivation, the terrain is varied. We sampled palm trees from three different types of palm plantation: open plantation, complex background plantation, and dense plantation.
For each of the five sample locations, the entire image was predicted using local image features. The training data are divided into two sections. To begin, each sample site’s image was divided into numerous small pieces. Then, from a large number of small pieces of training data, a small number of images were selected. The remaining training data were gathered in the vicinity of the sample sites. Data enhancement was used to increase the training dataset to 600 pieces. Individual trees of various tree species, backgrounds, and sizes are included in the training data. Diverse backgrounds are incorporated to increase the variety of elements and the training effect.
3.2.2 Experiment Parameter
The experiment’s primary parameters are listed in Table 3. The term “Epoch” refers to the process by which a complete dataset passes through a neural network once and returns once. When a large amount of data cannot be processed in a single pass through the neural network, the dataset must be divided into several “batch sizes.” Each batch size corresponds to a new small dataset; the batch size parameter specifies the size of the new small dataset. The term “score” refers to a measure of confidence. The “weight file size (MB)” column indicates the amount of space consumed by the YOLOv4-Lite model.

TABLE 3. Training model parameters.
3.3 Process
Figure 4 illustrates the overall process of single-tree detection. The acquisition of high-resolution remote sensing image data is divided into two stages. One part contains training data. Manual labeling of training data is required. The second part contains the test data, which are displayed in the article. The YOLOv4-Lite model extracted single-tree features from training data repeatedly. On the test data, the trained YOLOv4-Lite model performs single-tree detection.
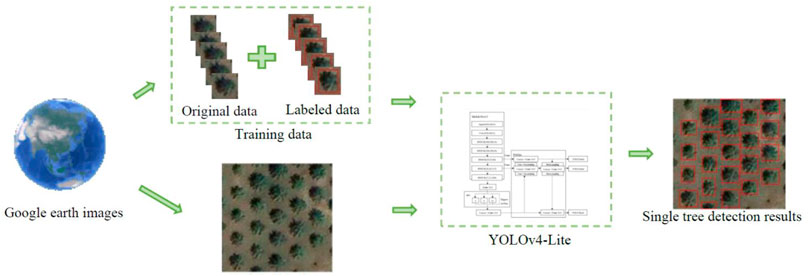
FIGURE 4. Single tree detection process based on YOLOv4-Lite.
3.4 Evaluation Criteria
A professional evaluation standard is critical when evaluating the effect of a variety of single-tree detection methods. There is no unified evaluation standard in place at the moment. Correct detection occurs when the difference between the ground reference single tree and the detected single tree is within a specified range. The location of a single tree defines the actual box’s geometric center. The position of each detected single tree is represented by
1 When
2 If
3
Based on the above conditions,

TABLE 4. Single tree detection evaluation indicators.
4 Results and Discussion
To assess the method’s effectiveness, two classical traditional methods, namely, the local maximum method and the watershed method, are compared to two novel methods, namely, the CV model and template matching method (Peng et al., 2017; Dong and Zhou, 2018; Zhang et al., 2020). This study analyzes and interprets the experimental results.
We use 416 × 416 images as the input image in this experiment. Because the experiment area is too large, it is divided into numerous small images for detection. Partitioning divides a tree in half or even a quarter.
4.1 Campus and Orchard Detection
Figures 5, 6 illustrate the results of various methods used to test the green trees surrounding the basketball court and the litchi trees near the litchi orchard. Red circles and yellow dots denote the trees that have been detected.
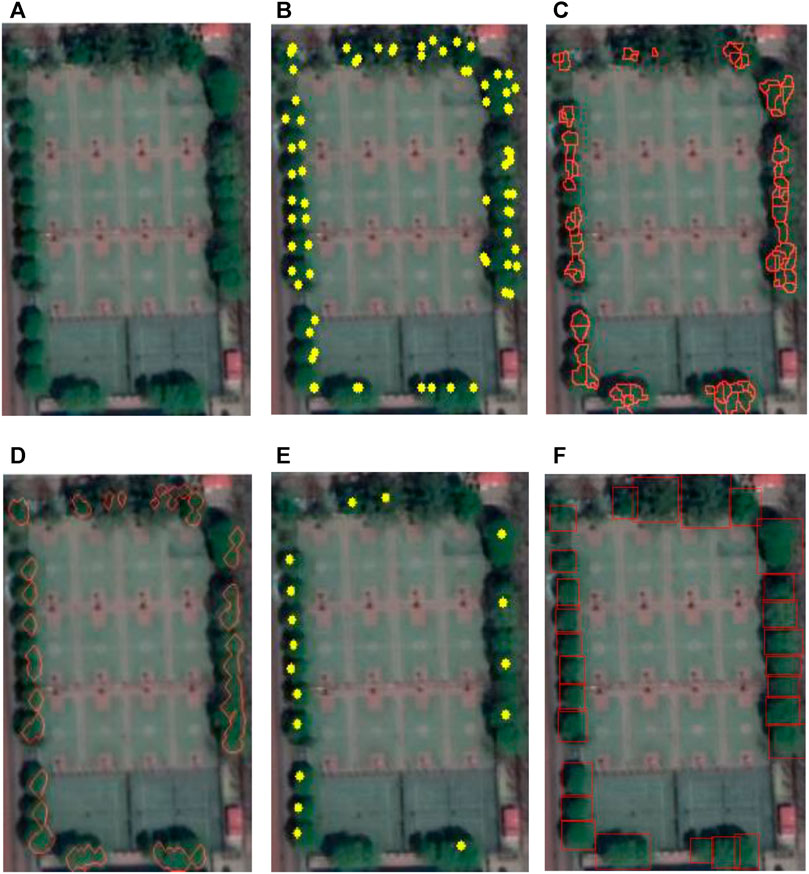
FIGURE 5. Results of different methods in campus: (A) original image, (B) local maximum, (C) watershed, (D) CV model, (E) template matching, and (F) YOLOv4-Lite.
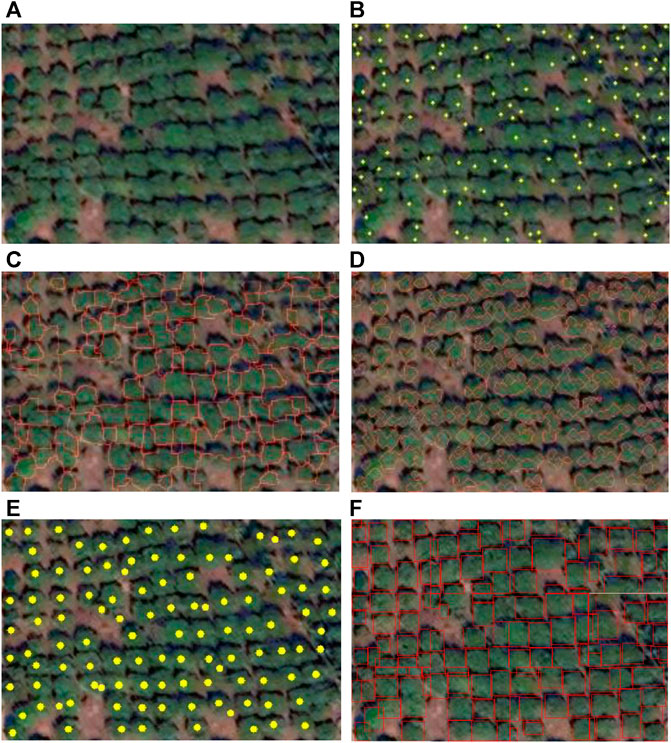
FIGURE 6. Results of different methods in litchi garden: (A) original image, (B) local maximum, (C) watershed, (D) CV model, (E) template matching, and (F) YOLOv4-Lite.
As illustrated in Figure 5, the campus experiment site resembles a plantation scene. The sliding window size is set to 23 for the local maximum method. The pixel difference threshold between the template and the sample is set to between 0.28 and 0.35 for the template matching method. The watershed method’s marker parameter is set to 24. The treetop probe window and the background label parameter of the CV model are both set to 23. Because the local maximum value extracts only the maximum value, the watershed method extracts the contour of the puddle while easily being influenced by the tree branches. Several trees on the campus site have two large branches that reach the tree’s top. As illustrated in Figure 5B and Table 5, both the local maximum and watershed methods incorrectly identify the tree branch as a tree, resulting in significant error detection. To minimize error detection, the CV model combines the advantages of the watershed and local maximum methods. On the other hand, the CV model considers two trees with a close crown connection to be a single tree, resulting in numerous detection omissions. Japonica Sophora Linn and Salix are the campus experimental site’s dominant tree species. The two trees have similar characteristics, as do the tree canopy characteristics of the same trees. Additionally, the template matching method cannot extract all tree templates for trees with close crown connections.
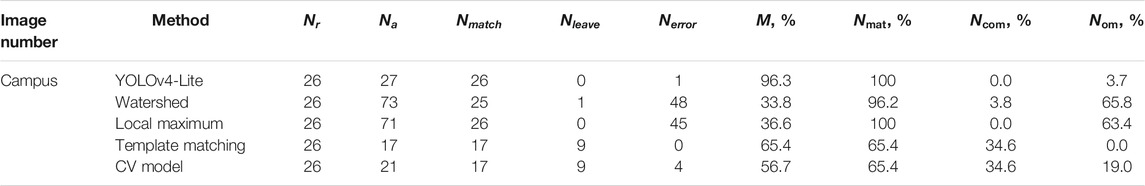
TABLE 5. Campus single-tree detection results’ statistics.
Although the template matching method has a zero-commission rate, its accuracy, recall rate, and omission rate are lower than those of the YOLOv4-Lite method.
The YOLOv4-Lite method has a single tree detection accuracy of 96.3%. In conclusion, when compared to other algorithms, the proposed YOLOv4-Lite algorithm achieves the highest detection success rate and recall rate. Due to the small tree population on the campus experimental site, the experimental effect of YOLOv4-Lite is significantly greater than that of other sample sites.
As illustrated in Figure 6, the litchi garden’s experimental site resembles an urban orchard. The sliding window size is set to 18 for the local maximum method. The template matching method sets the pixel threshold between the template and the sample to be between 0.32 and 0.38. The watershed method’s marker parameter is set to 25. The CV method’s treetop probe window is set to 20 and the background label parameter to 24.
As illustrated in Figure 6F, the single-tree detection method proposed by YOLOv4-Lite appears to have a high degree of error detection. Indeed, this phenomenon demonstrates Yolov4-Lite’s extremely low omission rate and ability to detect up to a quarter of a tree. The YOLOv4-Lite single-tree detection method successfully detects each half-crown or quarter crown in the small image. Finally, the detected images were spliced together. The tree crown shape is irregular in the experimental site of the litchi garden. The crown difference is obvious, the connection is relatively close, and some background areas have higher values. As illustrated in Table 6, the detection efficacy of several methods is quite low. The local maximum method extracts only the tree with the greatest value and performs numerous error and omission detections. The experimental site of litchi garden contains a large number of saplings, and the contours of these saplings were not detectable using the watershed method. Additionally, the CV model incorporates extensive error and omission detection. Not all templates for single trees are available in advance. Because the template matching algorithm can only match regions of the same size, a small number of trees are labeled as missing errors, and numerous connected tree crowns are misidentified as a single tree. The YOLOv4-Lite method was found to have the best anti-interference ability in this study. It is capable of distinguishing a limited number of difficult-to-distinguish samples while maintaining a 93.8% accuracy, a 95.5% recall rate, and a 1.9% omission rate.
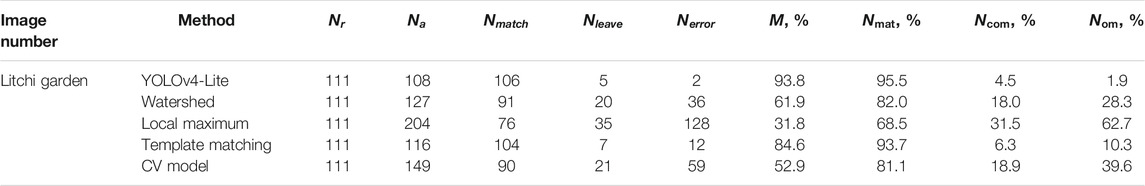
TABLE 6. Litchi garden single-tree detection results’ statistics.
4.2 Economic Plantation Detection
Palm trees are economic plantations, and many countries have a sizable artificial planting base. Palm tree monitoring and management are critical for plantation production. A stand of the open plantation has a canopy density of between 0.4 and 0.6, while a dense plantation has a canopy density of between 0.7 and 1. As illustrated in Figure 7, this study examines three distinct scenarios involving a single palm tree. The three scenes are sparse plantation with a simple background, sparse plantation with a complex background, and dense plantation. Red circles indicate correctly detected single trees. The trees that have been identified as having an error are circled in white. Blue circles indicate undetected single trees.
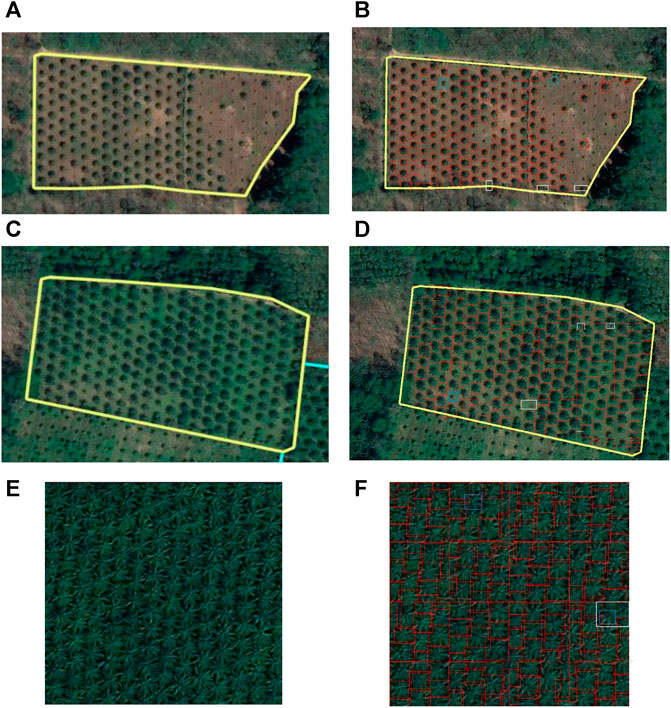
FIGURE 7. Results of different methods in palm: (A) original image of sample site 1, (B) YOLOv4-Lite of sample site 1, (C) original image of sample site 2, (D) YOLOv4-Lite of sample site 2, (E) original image of sample site 3, and (F) YOLOv4-Lite of sample site 3.
Sample site one depicts an open plantation with a simple background. The sliding window size is set to 23 for the local maximum method. The template matching method sets the pixel threshold between the template and the sample to between 0.31 and 0.35. The watershed method’s marker parameter is set to 22. The CV model’s treetop probe window is set to 23 and the background label parameter to 22. The background value of sample site one is high, which results in a high number of detected errors using the local maximum method and a high number of missed single trees using the watershed method. Many saplings are present at experimental site 1. Not all templates for single trees are available. The template matching method has a low recall rate and accuracy. As shown in Table 7, the YOLOv4-Lite method has a higher accuracy and recall rate than the template matching method.
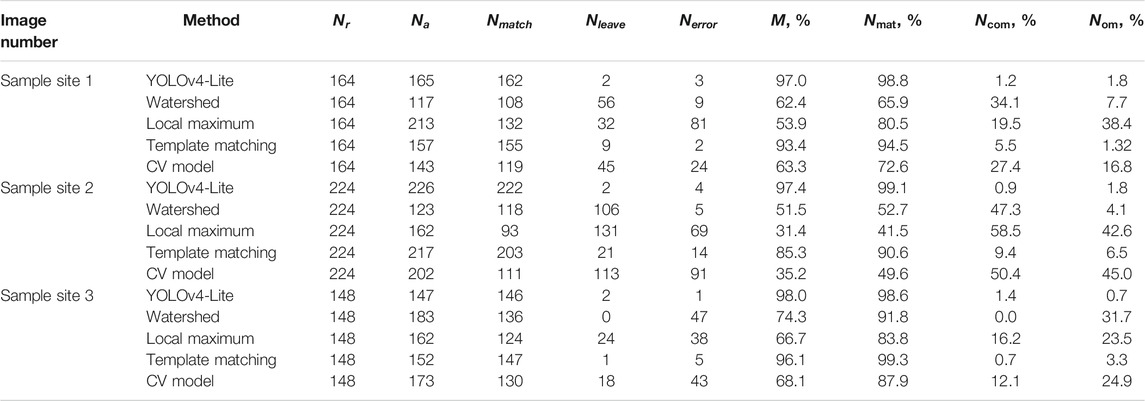
TABLE 7. Sample site single-tree detection results’ statistics.
The background has the greatest influence on the experimental results when it comes to single-tree detection. The scene in which the background color matches the color of the crown of a single tree has the most interference. Sample site two is an open plantation with a complex background plantation. Table 7 summarizes the experimental results for sample site 2. A single tree’s canopy color in site two is very similar to the background color. The sliding window size is set to 23 for the local maximum method. The pixel difference threshold between the template and the sample is set to between 0.22 and 0.26 for the template matching method. The watershed method’s marker parameter is set to 25. The CV model’s treetop probe window is set to 23 and the background label parameter to 22. Local maximum only extracts the maximum value. When the crown color of a single tree is similar to the background color, the background color is brighter. The background is frequently mistaken for the crown apex, resulting in many missed and error detection data. Watershed is also difficult to extract the correct seed points, which results in numerous missed and incorrect detections in this case. In sample site 2, there are single trees of varying sizes, and not all single-tree templates can be extracted. As a result, the template matching method’s recall rate and accuracy are low. In the scenario of sample site 2, the YOLOv4-Lite method maintains a 97.4% accuracy and a 99.1% recall rate.
Sample site three represents a dense plantation. The sliding window size is set to 35 for the local maximum method. The template matching method sets the pixel threshold between the template and the sample to between 0.16 and 0.22. The watershed method’s marker parameter is set to 34. The CV model’s treetop probe window has been set to 34, and the background label parameter has been set to 33. Dense plantations are typically mature plantations with large trees. When one tree crown is near another, the background cannot interfere with the single-tree detection effect. Because sample site three is the same age plantation as sample site 1, there are no saplings. As illustrated in Table 7, sample site 3 has the best effect for single-tree detection. If a tree has a large number of branches, multiple maximums will occur, and the local maximum method will result in a high rate of missed and error detection. Additionally, the watershed method generates a large amount of error detection. Additionally, the morphological characteristics of palm tree crowns are evident, and the template matching method detects sample site 3 with a 96.1% accuracy. The template matching method, on the other hand, is ineffective at detecting half and quarter crowns. This results in some missing tests. The accuracy of the YOLOv4-Lite method achieves 98.0%.
5 Conclusion
A YOLOv4-Lite method for single-tree detection is proposed in this study. Although it is not revolutionary in terms of object detection, it offers an excellent balance of speed and accuracy. Not only does the YOLOv4-Lite method overcome the four difficulties discussed in Chapter 1 but it also has a stronger anti-interference capability. Moreover, it performs well in various plantation types, including campus, orchards, and economic plantation, with extremely stable single-tree detection and location performance. The research presented in this article serves as a reference for the YOLOv4 model’s application in its field.
Data Availability Statement
The original contributions presented in the study are included in the article/supplementary material, further inquiries can be directed to the corresponding author.
Author Contributions
YZ contributed to conceptualization, methodology, software, formal analysis, investigation, resources, data curation, writing—original draft, writing—review and editing, and visualization. GW contributed to validation and funding acquisition.
Conflict of Interest
The authors declare that the research was conducted in the absence of any commercial or financial relationships that could be construed as a potential conflict of interest.
Publisher’s Note
All claims expressed in this article are solely those of the authors and do not necessarily represent those of their affiliated organizations, or those of the publisher, the editors, and the reviewers. Any product that may be evaluated in this article, or claim that may be made by its manufacturer, is not guaranteed or endorsed by the publisher.
References
Artés-hernández, F., Formica-Oliveira, A. C., Artés, F., and Martínez-Hernández, G. B. (2017). Improved Quality of a Vitamin B12-Fortified 'ready to Blend' Fresh-Cut Mix Salad with Chitosan. Food Sci. Technol. Int. 23, 513–528. doi:10.1177/1082013217705036
Bouvier, M., Durrieu, S., Fournier, R. A., and Renaud, J.-P. (2015). Generalizing Predictive Models of forest Inventory Attributes Using an Area-Based Approach with Airborne LiDAR Data. Remote Sensing Environ. 156, 322–334. doi:10.1016/j.rse.2014.10.004
Chaitanya, , , Sarath, S., Malavika, , , Prasanna, , , and Karthik., (2020). “Human Emotions Recognition from Thermal Images Using Yolo Algorithm,” in 2020 International Conference on Communication and Signal Processing (ICCSP), 28-30 July 2020Chennai, India (IEEE). doi:10.1109/iccsp48568.2020.9182148
Chollet, F. (2017). “Xception: Deep Learning with Depthwise Separable Convolutions,” in 2017 IEEE Conference on Computer Vision and Pattern Recognition (CVPR). doi:10.1109/cvpr.2017.195
Dimitrios, P., and Azadeh, A. (2021). Accuracy Assessment of Total Stem Volume Using Close-Range Sensing: Advances in Precision Forestry. Forests 12 (6).
Dimitrios, P., Azadeh, A., and Martin, S. (2021). Assessment of Stem Volume on Plots Using Terrestrial Laser Scanner: A Precision Forestry Application. Sensors 21 (1).
Dong, T., Shen, Y., Zhang, J., Ye, Y., and Fan, J. (2019). Progressive Cascaded Convolutional Neural Networks for Single Tree Detection with Google Earth Imagery. Remote Sensing 11 (15), 1786. doi:10.3390/rs11151786
Dong, T. Y., and Zhou, Q. Z. (2018). Single Tree Detection in Remote Sensing Images Based on Morphological Snake Model. ISPRS, Int. J. Geo-Inf. Computer Science.
Dong, Y., Ren, Z., Fu, Y., Miao, Z., Yang, R., Sun, Y., et al. (2020). Recording Urban Land Dynamic and its Effects during 2000-2019 at 15-m Resolution by Cloud Computing with Landsat Series. REMOTE SENSING 12 (15). doi:10.3390/rs12152451
Garcia-ortiz, L. B., Sanchez-Perez, G., Hernandez-Suarez, A., Olivares-Mercado, J., and Portillo-Portillo, J. (2020). A Fast-RCNN Implementation for Human Silhouette Detection in Video Sequences, Knowledge Innovation through Intelligent Software Methodologies, Tools and Techniques. doi:10.3233/FAIA200553
Gomes, M. F., Maillard, P., and Deng, H. (2018). Individual Tree crown Detection in Sub-meter Satellite Imagery Using Marked Point Processes and a Geometrical-Optical Model. Remote Sensing Environ., 211184–211195. doi:10.1016/j.rse.2018.04.002
Gougeon, F. A., and FranOis, A. (2014). A crown-following Approach to the Automatic Delineation of Individual Tree Crowns in High Spatial Resolution Aerial Images. Can. J. Remote Sensing 21 (3), 274–284. doi:10.1080/07038992.1995.10874622
Hashim, S. A., Daliman, S., Rodi, I., Aziz, N. A., and Rak, A. E. (2020). Analysis of Oil Palm Tree Recognition Using Drone-Based Remote Sensing Images. IOP Conf. Ser. Earth Environ. Sci. 596012070. doi:10.1088/1755-1315/596/1/012070
Hofmann, H. (2000). Exploring Categorical Data: Interactive Mosaic Plots. Metrika 51 (1), 11–26. doi:10.1007/s001840000041
Huiling, L., Xiaoli, Z., Ying, Z., Yunfeng, Z., Hui, L., and Longyang, W. (2018). Review on Individual Tree Detection Based on Airborne LiDAR. [J]. Prog. Laser Optoelectronics 55 (8), 082805. doi:10.3788/lop55.082805
Jiang, R., Wang, C., Shen, L., Wang, P., Koirala, A., Walsh, K., et al. (2016). “A Method for Lichee's Tree-crown Information Extraction Based on High Spatial Resolution Image,” in Transactions of the Chinese Society for Agricultural MachineryDeep Learning for Real-Time Fruit Detection and Orchard Fruit Load Estimation: Benchmarking of 'MangoYOLO, 20, 1107–1135. doi:10.6041/j.issn.1000-1298.2016.09.003
Larsen, M., Eriksson, M., Descombes, X., Perrin, G., Brandtberg, T., and Gougeon, F. A. (2011). Comparison of Six Individual Tree crown Detection Algorithms Evaluated under Varying forest Conditions. Int. J. Remote Sensing 32 (20), 5827–5852. doi:10.1080/01431161.2010.507790
Liang, Y., Liao, J. C., and Pan, J. H. (2020). Mesh-Based Scale-Invariant Feature Transform-like Method for Three-Dimensional Face Recognition under Expressions and Missing Data. J. Electron. Imaging 29 (5), 053008.
Liu, H., Zhang, X., and Zhang, Y. (2018). Advances in Single Wood Identification of Airborne Lidar. J. Laser Optoelectron. Prog. 55 (8), 39–47. doi:10.3788/LOP55.082805
Ma, K., Cheng, Y., Ge, W., Zhao, Y., and Qi, Z. (2020). Identification, Extraction and Three-Dimensional Building Model Reconstruction Though Faster R-CNN of Architectural Plans. Geoinformatics in Sustainable Ecosystem and Society, Springer.
Meneghetti, D., Homem, T., Oliveira, J., Silva, I., and Bianchi, R. (2021). Detecting Soccer Balls with Reduced Neural Networks. J. Intell. Robotic Syst. 101 (3). doi:10.1007/s10846-021-01336-y
Nasor, M., and Obaid, W. (2021). Segmentation of Osteosarcoma in MRI Images by K-Means Clustering, Chan-Vese Segmentation, and Iterative Gaussian Filtering. IET Image Process. 15.
Olli, N., Eija, H., Sakari, T., Niko, V., Teemu, H., Yu, X., et al. (2017). Individual Tree Detection and Classification with UAV-Based Photogrammetric Point Clouds and Hyperspectral Imaging. Remote Sensing.
Peng, L., Hui, Z., and Eom, K. B. (2017). Active Deep Learning for Classification of Hyperspectral Images. IEEE J. Selected Top. Appl. Earth Observations Remote Sensing 10 (2), 712–724. doi:10.1109/jstars.2016.2621416
Picos, J., Bastos, G., Míguez, D., Martínez, L. A., and Armesto, J. (2020). Individual Tree Detection in a Eucalyptus Plantation Using Unmanned Aerial Vehicle (UAV)-LiDAR. Remote Sensing 12 (5). doi:10.3390/rs12050885
Rau, A., Kim, S., Yang, S., Reisert, M., and Egger, K. (2021). SVM-based Normal Pressure Hydrocephalus Detection. Heidelberg, Germany: Springer. Clinical Neuroradiology. No. 3 17, D-69121.
Richey, B., and Shirvaikar, M. V. (2021). “Deep Learning Based Real-Time Detection of Northern Corn Leaf Blight Crop Disease Using YoloV4,” in Real-Time Image Processing and Deep Learning 2021. doi:10.1117/12.2587892
Ruihuan hou, X. Y. Z. W. (2021). A Real-Time Detection Methods for forest Pests Based on YOLO V4-TIA Algorithm. Computer Eng., 1–8.
Syaputra, R., Syamsuar, D., and Negara, E. S. (2021). Multiple Smile Detection Using Histogram of Oriented Gradient and Support Vector Machine Methods. IOP Conf. Ser. Mater. Sci. Eng. 1071 (1), 012027. doi:10.1088/1757-899x/1071/1/012027
Toth, C., and Jóźków, G. (2016). Remote Sensing Platforms and Sensors: A Survey. ISPRS J. Photogrammetry Remote Sensing 115 (may), 22–36. doi:10.1016/j.isprsjprs.2015.10.004
Wang, L., Gong, P., and Biging, G. S. (2004). Individual Tree-Crown Delineation and Treetop Detection in High-Spatial-Resolution Aerial Imagery. Photogramm Eng. Remote Sensing 70 (3), 351–357. doi:10.14358/pers.70.3.351
Wang, M. (2019). Multi-level Assessment of Mangrove Ecosystem Based on Remote Sensing Technology. Xiamen, China: Xiamen University.
Wang, X., Wang, S., Cao, J., and Wang, Y. (2020). Data-driven Based Tiny-YOLOv3 Method for Front Vehicle Detection Inducing SPP-Net, 99. IEEE Access, 1.
Wulder, M., Niemann, K. O., and Goodenough, D. G. (2000). Local Maximum Filtering for the Extraction of Tree Locations and Basal Area from High Spatial Resolution Imagery. Remote Sensing Environ. 73 (1), 103–114. doi:10.1016/s0034-4257(00)00101-2
Xiao, Y., Wang, D., and Wu, Y. (2021). Investigation and Protection of Ancient and Famous Trees Resources of Daxiong Mountain. IOP Conf. Ser. Earth Environ. Sci. 692 (37pp), 032009. doi:10.1088/1755-1315/692/3/032009
Yinghai, K., Xiaojuan, L., and Huili, G. (2015). Application of Remote Sensing Technology in Automatic forest Inventory. Beijing, China: China Environmental Press.
Yuz, S. Y. S. C. (2021). A Real-Time Detection Approach for Bridge Cracks Based on YOLOv4-FPM. Automation in Construction 103514 (122). doi:10.1016/j.autcon.2020.103514
Zhang, L., Liu, P., Zhao, L., Wang, G., and Liu, J. (2020). Air Quality Predictions with a Semi-supervised Bidirectional LSTM Neural Network. Atmos. Pollut. Res. 12 (1).
Zhang, N., Zhang, X., and Ye, L. (2014). Tree crown Extraction Based on Segmentation of High-Resolution Remote Sensing Image Improved Peak-Climbing Algorithm. Trans. Chin. Soc. Agric. Machinery 45 (12), 294–300.
Zhang, S., Hu, X., Jie, X., Li, S., Wang, Z., Zhao, Z., et al. (2019). Research on Image Detection Method for Assembly Failure of Monomer thermal Battery. Beijing, China: Journal of Electronic Measurement and Instrumentation.
Zhao, L., Zeng, Y., Liu, P., and Su, X. (2020). Band Selection with the Explanatory Gradient Saliency Maps of Convolutional Neural Networks. IEEE Geosci. Remote Sensing Lett. 99, 1–5. doi:10.1109/lgrs.2020.3012140
Zheng, X., Wang, R., Jin, M., and Cas, (2017). Extraction of High-Resolution Images of Single Tree Crown Based on Watershed Algorithm with Morphological Threshold Mark. Central South Forest Inventory and Planning.
Keywords: YOLOv4-Lite, urban plantation, tree detection, tree position, high-resolution remote sensing image
Citation: Zheng Y and Wu G (2022) YOLOv4-Lite–Based Urban Plantation Tree Detection and Positioning With High-Resolution Remote Sensing Imagery. Front. Environ. Sci. 9:756227. doi: 10.3389/fenvs.2021.756227
Received: 10 August 2021; Accepted: 29 November 2021;
Published: 14 January 2022.
Edited by:
Peng Liu, Institute of Remote Sensing and Digital Earth (CAS), ChinaReviewed by:
Konstantinos Demertzis, International Hellenic University, GreeceZhibin Ren, Northeast Institute of Geography and Agroecology (CAS), China
Copyright © 2022 Zheng and Wu. This is an open-access article distributed under the terms of the Creative Commons Attribution License (CC BY). The use, distribution or reproduction in other forums is permitted, provided the original author(s) and the copyright owner(s) are credited and that the original publication in this journal is cited, in accordance with accepted academic practice. No use, distribution or reproduction is permitted which does not comply with these terms.
*Correspondence: Gang Wu, d3VnYW5nQGJqZnUuZWR1LmNu