 Yueyuan Zheng
 Gang Wu*
- College of Information, Beijing Forestry University, Beijing, China
Using high-resolution remote sensing images to automatically identify individual trees is of great significance to forestry ecological environment monitoring. Urban plantation has realistic demands for single tree management such as catkin pollution, maintenance of famous trees, landscape construction, and park management. At present, there are problems of missed detection and error detection in dense plantations and complex background plantations. This paper proposes a single tree detection method based on single shot multibox detector (SSD). Optimal SSD is obtained by adjusting feature layers, optimizing the aspect ratio of a preset box, reducing parameters and so on. The optimal SSD is applied to single tree detection and location in campuses, orchards, and economic plantations. The average accuracy based on SSD is 96.0, 92.9, and 97.6% in campus green trees, lychee plantations, and palm plantations, respectively. It is 11.3 and 37.5% higher than the latest template matching method and chan-vese (CV) model method, and is 43.1 and 54.2% higher than the traditional watershed method and local maximum method. Experimental results show that SSD has a strong potential and application advantage. This research has reference significance for the application of an object detection framework based on deep learning in agriculture and forestry.
1 Introduction
Single tree detection based on remote sensing images is a crucial technology for establishing a single tree database and monitoring single tree plantation resources, which is of great significance to urban landscape planning and ecological environment monitoring (Congalton et al., 2014; Faridatul and Wu, 2018; Ahl et al., 2019). Single tree detection is a cross-research field of computer vision, measurement, single tree management, and remote sensing (Kupidura et al., 2019; Zhang et al., 2020; Belcore et al., 2021). Researchers began to explore single tree detection methods a long time ago. As early as 1995, Gougeon et al. (Gougeon, 1995) used aerial photos to carry out single tree identification; they searched for the local minimum value at the bottom of a tree for the first time. Larsen et al. (Larsen and Rudemo, 1998) used an improved template matching method to detect crown vertices of a single tree. Poullot et al. (Pollock, 1996) used remote sensing imagery to determine the location of a single tree by selecting a moving window from 15 × 15 to 30 × 30. Depending on the size of the canopy in the image, they determined the location of a single tree and used the local ray method to depict the young conifer forest crown. Wang et al. (Wang et al., 2004) used the watershed method to depict the canopy boundaries of white cloud fir forests. Zhang Ning et al. (Zhang et al., 2014) improved the application of the peak climbing method to the problem of canopy extraction and experimented in Quickbird images. The accuracy of experimental samples reached more than 85%. Jiang Renrong et al. (Jiang et al., 2016) used hydro analyzation and regional growth fusion methods for lychee single tree detection and canopy depiction. The overall accuracy was 78.69%. Yu et al. (Yu et al., 2018) applied the iterative threshold method to canopy extraction. The matching rate of the iterative threshold method was only 60.15%, due to complicated and discrepant texture and over-splitting phenomenon in a single tree canopy.
In recent years, researchers applied convolutional neural network (CNN) to single tree detection, solving the problems of traditional single tree detection methods (Liu et al., 2017; Zhao et al., 2020; Zhang et al., 2021). For example, traditional single tree detection methods detected seed points or matching templates by pixels, so traditional single tree detection methods required prior knowledge to specify characteristic parameters of different scenes. The traditional single tree detection method had low stability. The above problems could be solved by introducing CNN (Sharma et al., 2016; Chen et al., 2017). CNN could learn features automatically and abstract local low-level features into high-level features such as the color and the contour of trees gradually without specified parameters in advance (Chu et al., 2017; Mokroš et al., 2018). CNN showed good advantages in single tree detection (Roska and Chua, 2008; Wang et al., 2020). Weijia et al. (Weijia et al., 2016) applied the deep learning approach to detect densely planted Malaysian oil palm trees for the first time. Guirado et al. (Guirado et al., 2017) proposed a CNN-based shrub detection method. Dong Tianyang et al. (Dong et al., 2018) proposed a cascaded convolutional neural network of single tree detection in 2018. They applied it to Google Earth images in 2019 (Dong et al., 2019), and found that it was hard to repeat, had small object leakage, was inefficient, and that it was challenging to meet practical requirements.
At present, there is no single tree detection method that can adapt to various stands (Liu et al., 2019). It is a significant research direction to use existing technology to improve the accuracy of single tree detection and simplify the single tree detection process (Deng et al., 2010). Currently, object detection based on deep learning is divided into one-stage object detection and two-stage object detection. One-stage object detection is also known as end-to-end, which only takes one step to obtain results. Single shot multibox detector (SSD) is one of the most widely used in one-stage object detection. SSD uses multi-size convolutional layers to predict, adding data enhancement of small objects, which has the advantages of high accuracy and high efficiency (Li et al., 2019).
In this study, we have improved the SSD backbone feature extraction network and optimized the aspect ratio of a preset box in single tree detection. The SSD model of single tree detection has been reduced in terms of parameters and computation burden. The optimal SSD model of single tree detection was obtained by comparing the experimental results of multiple groups. The optimal SSD model was used to detect quantity identification and location management of urban plantations. The optimal SSD model achieved better accuracy than the traditional watershed method, traditional local maximum method, and the latest template matching method, the CV model method.
2 Methodologies
This section focuses on the principles, training method, and other details of SSD. The principle of SSD is shown in Figure 1. During training, we only need to enter the original image and file that marks the original image’s actual box. In multiple feature maps (e.g., 9 × 9 (Figure 1B) and 5 × 5 (Figure 1C)), SSD uses convolution kernel to calculate the category confidence of the detected box and the offset between the actual box and detected box. During training, we match these preset boxes with the actual box first. For example, if three preset boxes match three trees, they are regarded as positive samples. The remaining preset boxes are treated as negative samples.
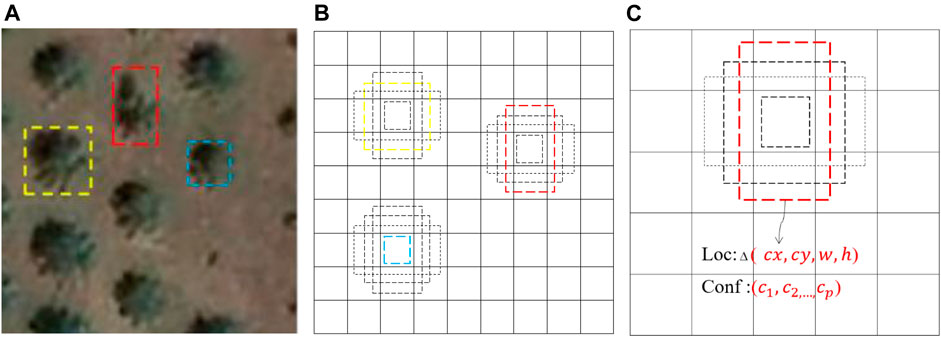
FIGURE 1. Principles of SSD. (A) Actual box. (B) 9
2.1 Single Tree Detection Process
The overall process of single tree detection based on SSD is shown in Figure 2. The process of single tree detection based on SSD is divided into five parts, including:
1) Collect high resolution remote sensing image data.
2) Separate training data from validation data and label training data.
3) The SSD model is trained to obtain single tree characteristic parameters.
4) Single tree detection is carried out by single tree characteristic parameters.
5) Evaluation of test results.
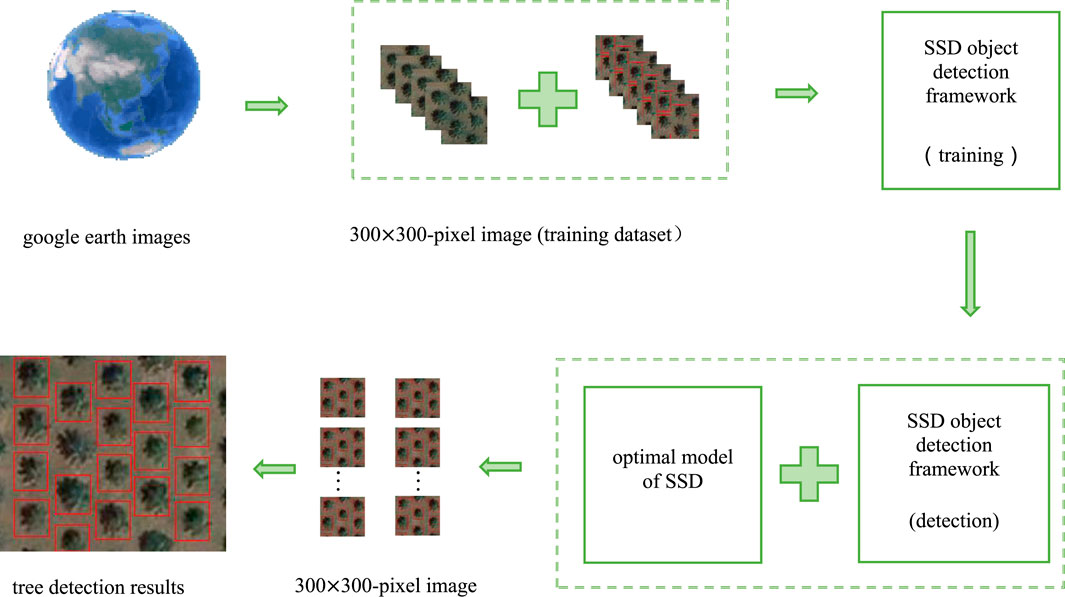
FIGURE 2. The overall process of single tree detection based on SSD.
A small number of factors can affect the quality of the SSD model, such as data richness, feature extraction accuracy, and robustness.
Simplified SSD Object Detection Framework
In this study, SSD is an object detection framework with 300 × 300×3 as the input image. SSD mainly divides into three parts: a central feature extraction network, feature layer processing network, and stacking adjustment parameters. The SSD model is simplified and shown in Figure 3. The backbone feature extraction network uses a visual geometry group network (VGG16) with the partial convolution layer removed. The optimal SSD model four extracts four feature layers for object detection, and the sizes of these four feature layers are 38 × 38×256, 19 × 19×512, 10 × 10×512, and 5 × 5×256, respectively. The 38 × 38×256 feature layer can be understood as dividing 300 × 300 image evenly into 38 × 38 parts. The center of each part generates preset boxes of different sizes and proportions for an anchor point. The preset box is introduced in Section 2.4. The size of the feature map decreases gradually. The large feature map predicts small objects, while the small feature map predicts large objects.
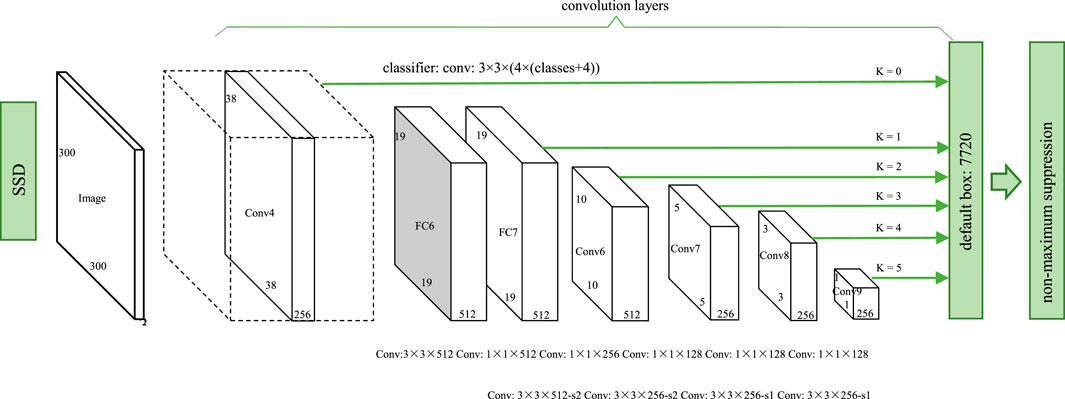
FIGURE 3. SSD object detection framework.
For feature layer processing, the extracted four feature layers are convolved twice, one convolution to extract category confidence, another convolution to extract position adjustment parameters. Four parameters are needed to control the position of each preset box, including offset abscissa of point, ordinate of point, height, and width.
2.2 Non-Maximum Suppression
The main idea of non-maximum suppression is to search for local maximum values and suppress non-maximum values. As can be known from Section 2.4, SSD produces many preset boxes, overlapping between each preset box, and each preset box has a category confidence score. By introducing a non-maximum suppression method, we find the best location for a single tree by removing excess preset boxes and only retaining the optimal preset boxes. The process of non-maximum suppression is as follows:
1) Sort each preset box by category confidence.
2) Select the preset box with the highest confidence in the category as the output box and remove it from the list of preset boxes.
3) Calculate the area of all preset boxes.
4) Calculate the intersection over union (IOU) value of the output box and other preset box. As shown in Figure 4, the intersection area of two boxes divides by their union area.
5) Remove a preset box with an IOU greater than threshold from the list of preset boxes.
6) Repeat steps (1) to (5) until the list of preset boxes is empty.
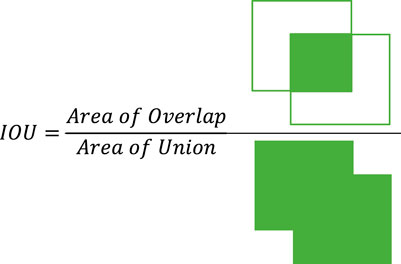
FIGURE 4. IOU calculation formula.
As shown in Figure 5, the non-maximum suppression method is used to select what is most likely a tree canopy among detected objects. A single left tree outputs three preset boxes, and a single right tree outputs two preset boxes. The score sequence of preset boxes is {0.92, 0.86, 0.81, 0.49, 0.42}, and the highest score is 0.92. The preset box of 0.92 is taken as a detected single tree prediction box, and then the IOU value of the remaining preset boxes and prediction box is calculated. If the IOU of the preset boxes of 0.81 and 0.49 and the prediction box of 0.92 exceed threshold, the two preset boxes of 0.81 and 0.49 will be deleted from the list. The remaining two IOU areas of 0.86 and 0.42 are less than the set threshold, and they are rearranged as {0.86 and 0.42} according to score. The highest score is 0.82. The preset box of 0.82 is used as the detected single tree prediction box. The final test results are obtained by excluding preset box 0.42 through IOU.
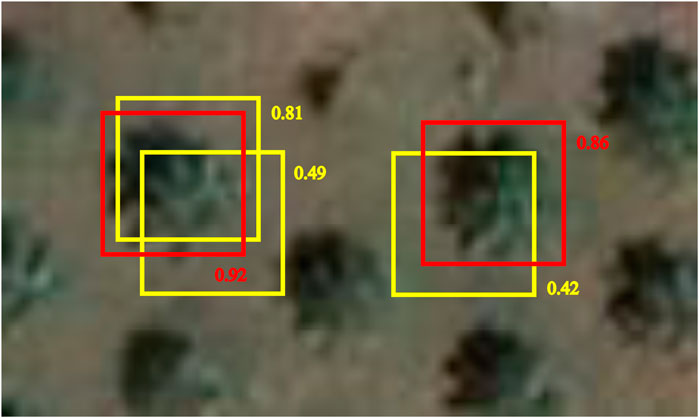
FIGURE 5. Non-maximum suppression method single tree detection results.
2.4 Preset Box
The scale of the preset box follows a linear increment rule, increasing linearly as the size of the feature map decreases:
In Eq. 1,
The shape of the crown of a single tree is mainly round and oval, so the default width to height ratio of the frame that comes to mind at first is 1:
The coordinate of anchor points can be obtained by point formula (
As shown from above, four feature layers are extracted, respectively 38 × 38×256, 19 × 19×512, 10 × 10×512, and 5 × 5×256. The number of preset boxes at each feature map is 4, 6, 6, and 6, so there are 8,692 preset boxes in each original image. The single tree position in the original image is retrieved using the thick preset box.
2.5 Loss Function
The loss function is defined on a single sample, and it is the error of a sample.
where
where
2.6 Increased Accuracy of Small Object
The main process of data enhancement is as follows:
1) Use entire original picture.
2) Take a small piece from the original image, and minimum overlap between this small piece and actual box is 0.1, 0.3, 0.5, 0.7, or 0.9.
3) Take a piece randomly from the original picture.
The ratio of sub-block size to original image size is between 0.1 and 1, and the width to height ratio is between 0.5 and 2. If the center of the actual single tree frame is within the intercepted sub-block, overlap is retained as the actual box of the sub-block. Scale the size of each subblock to 300 × 300, and each sub-block has a probability of 0.5 to flip horizontally before training.
Distorting images is a way to enhance data, including randomly changing contrast, brightness, saturation, and tone of image and randomly disrupting the three RGB channels. After data enhancement, training images have richer features, which can enhance the robustness of the model. In this study, we prove that this strategy can effectively improve the detection accuracy of the SSD model.
3 Experiments
3.1 Study Area
High-resolution remote sensing images of three groups of representative different city types are used in the study, including campus, orchard, and economic plantation. In June 2019, a campus green tree was located at 116°20′8.76″E, 40°0′6.52″N, at Beijing Forestry University in China. In December 2017, a litchi plantation was located at 113°53′26.34″E, 22°38′41.22″N in Bao’an district, Shenzhen city, China. A palm plantation was collected at 98°20′53.22″ E, 8°27′18.45″ N in Phang Nga province, Thailand. High-resolution remote sensing images are used in our experiments, with a spatial resolution of 0.27m, a scale of 800:1, and a visual field height of 1 km.
3.2 Training Dataset and Sample Dataset
The training data were collected from Google Earth images, and the training data of each experimental group are shown in Figure 6. Training data of palm trees were collected from around palm trees. Campus green tree training data were collected from universities in Beijing, China. Training data for lychee plantation were collected from around the lychee plantation.
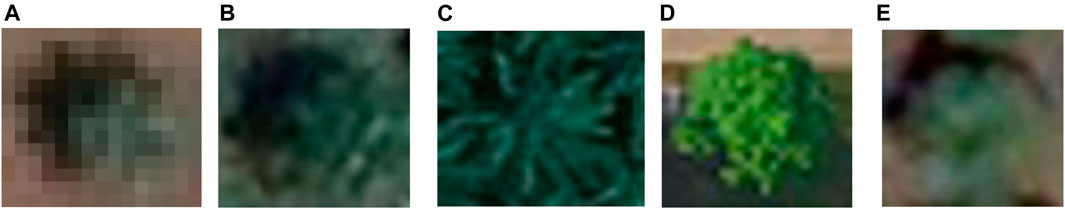
FIGURE 6. Training data sampling ground images. (A) Open palm plantation. (B) Complex background palm plantation. (C) Dense palm plantation. (D) Campus green tree. (E) Orchard.
Experimental results of the campus sample plot are shown in Figure 7A. The position data of a single reference tree were obtained from field measurements.
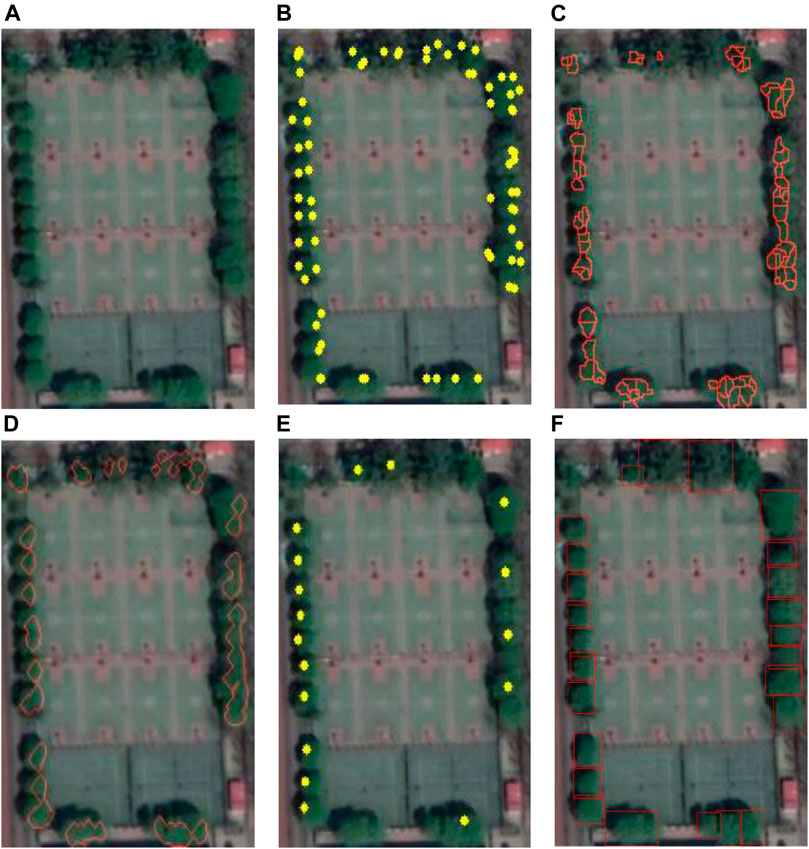
FIGURE 7. Results of different methods in campus. (A) Original image. (B) Local max. (C) Watershed. (D) CV model. (E) Template matching. (F) SSD.
The sample plot representing the orchard is shown in Figure 8A. The position data of the single reference tree are obtained by visual annotation. The palm plantation area representing economic plantation is divided into three groups according to the characteristics of the palm plantation area. The location data of the single reference palm tree were obtained by visual annotation. Open economic plantation refers to the plantation area with a canopy density between 0.4 and 0.6.
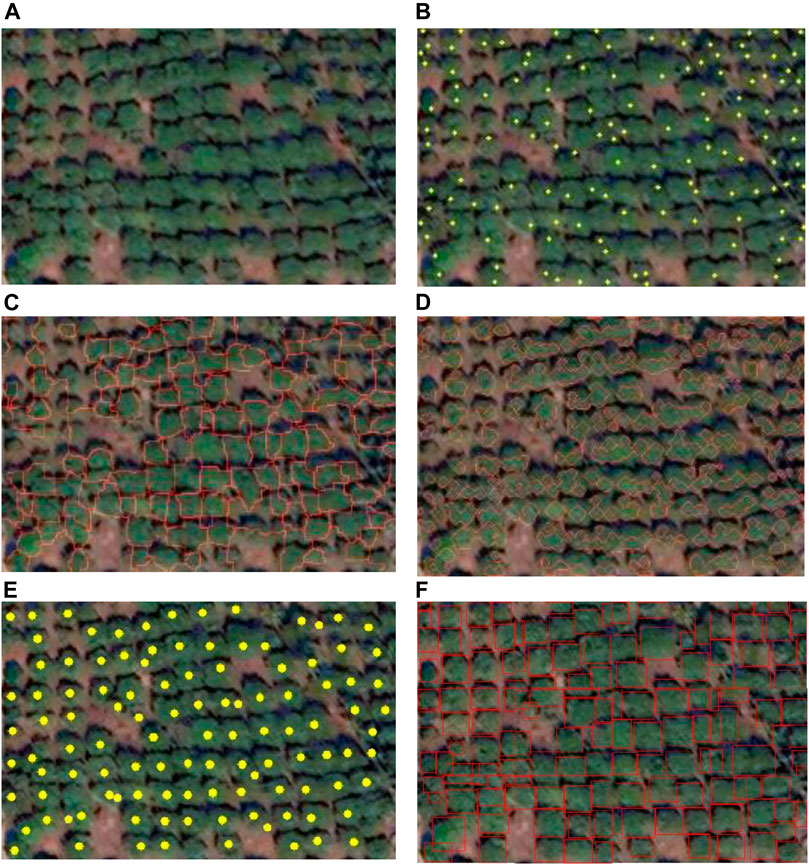
FIGURE 8. Results of different methods in lychee plantation. (A) Original image. (B) Local max. (C) Watershed. (D) CV model. (E) Template matching. (F) SSD.
The palm sample plot representing open economic plantation is shown in Figure 9A. Dense plantation refers to a plantation where the canopy density of palm plantation is between 0.7 and 1. Sample plots of palm trees representing dense economic plantations are shown in Figure 9C. Background detection in plantation areas also has a great impact on single tree detection. Especially, background color is like tree crown color, resulting in the background being wrongly identified as a single tree. In addition, complex ground features and shadow generated by sunlight in the background make the shape of a single tree abnormal, which greatly increases the difficulty of single tree detection. In this study, a plantation area with a complex background is experimented as a type alone. The sample plot representing a complex background economic plantation is shown in Figure 9E.
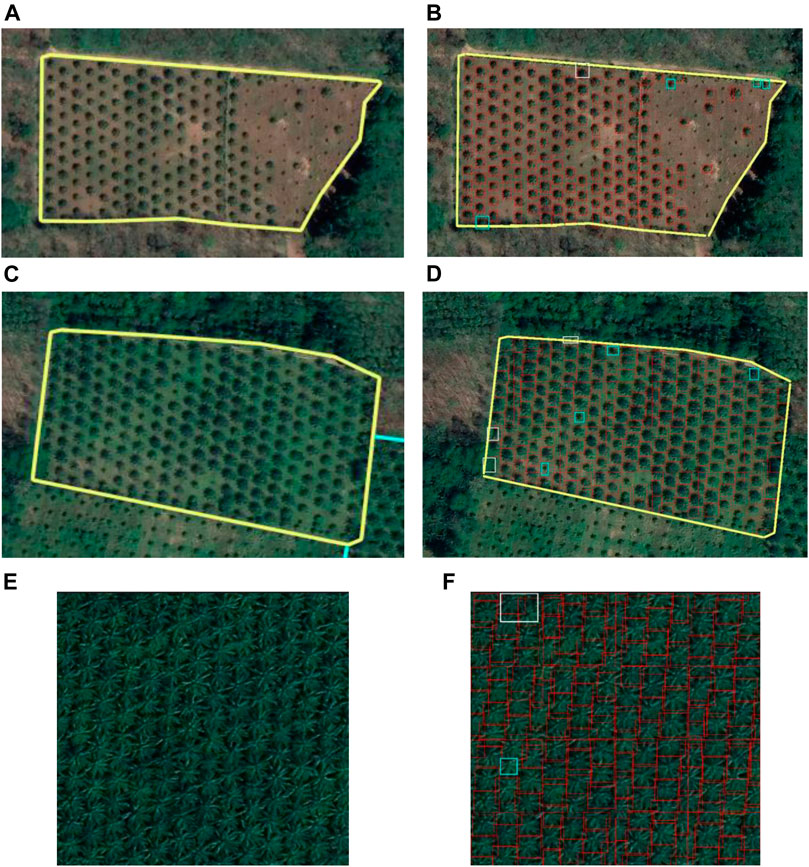
FIGURE 9. Results of different methods in palm. (A) Original image of open palm plantation. (B) SSD of open palm plantation. (C) Original image of complex background palm plantation. (D) SSD of complex background palm plantation. (E) Original image of dense palm plantation. (F) SSD of dense palm plantation.
3.3 Constant Parameters
Table 1 lists the main parameters used in the experiment. When a complete dataset passes through a neural network once and returns once, the process is called an “Epoch”. When data cannot be passed through a neural network at one time, the dataset needs to be divided into several batch-sizes. Each “Batch-size” is equivalent to a new dataset. The “Score” is a confidence score. “Weight file size (MB)” is the size of the model.

TABLE 1. Training model parameters.
3.4 Optimal SSD Model
The open economic plantation is experimentally studied. Palm trees are detected through the SSD object detection framework. Experimental results are shown in Table 2. The “trunk feature extractor” refers to the main network structure used in feature extraction. After the main network structure reframes, many feature layers are obtained. And some feature maps are selected in several feature maps to build preset boxes. The base scale of the preset box is related to the feature map. The number of parameters refers to the size of the model.
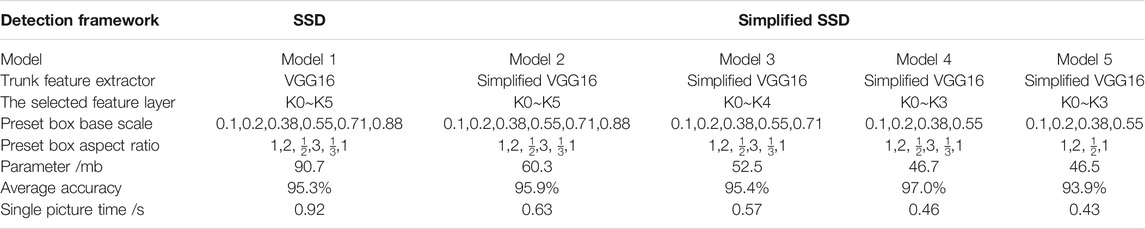
TABLE 2. Experimental results of sample plot 1 under different SSD parameters.
As shown in Table 2, SSD has been improved in many areas for single tree detection, such as omitting some VGG16 feature layers, network depth, and unwanted feature layers. The extracted feature layers by model 4 retains only K0-K3, which is approximately 13.6 and 5.8 MB less than model 2 and model 3 parameters, but accuracy does not decrease. In the process, it is found that there are more false positives in model 2 and model 3, and the deletion of feature layer can reduce false positives. Almost, no single tree has a crown height and width of 3 and
Precision-recall is one of the most useful weapons to detect the efficiency of the object detection model. As shown in Figure 10, model 5 performs the worst, AP = 89.36%; model 4 has the best performance, AP = 94.37%, in the precision-recall curve of all models. In model 4, the SSD object detection framework only extracts K0∼K3 feature layers and sets the aspect ratio to
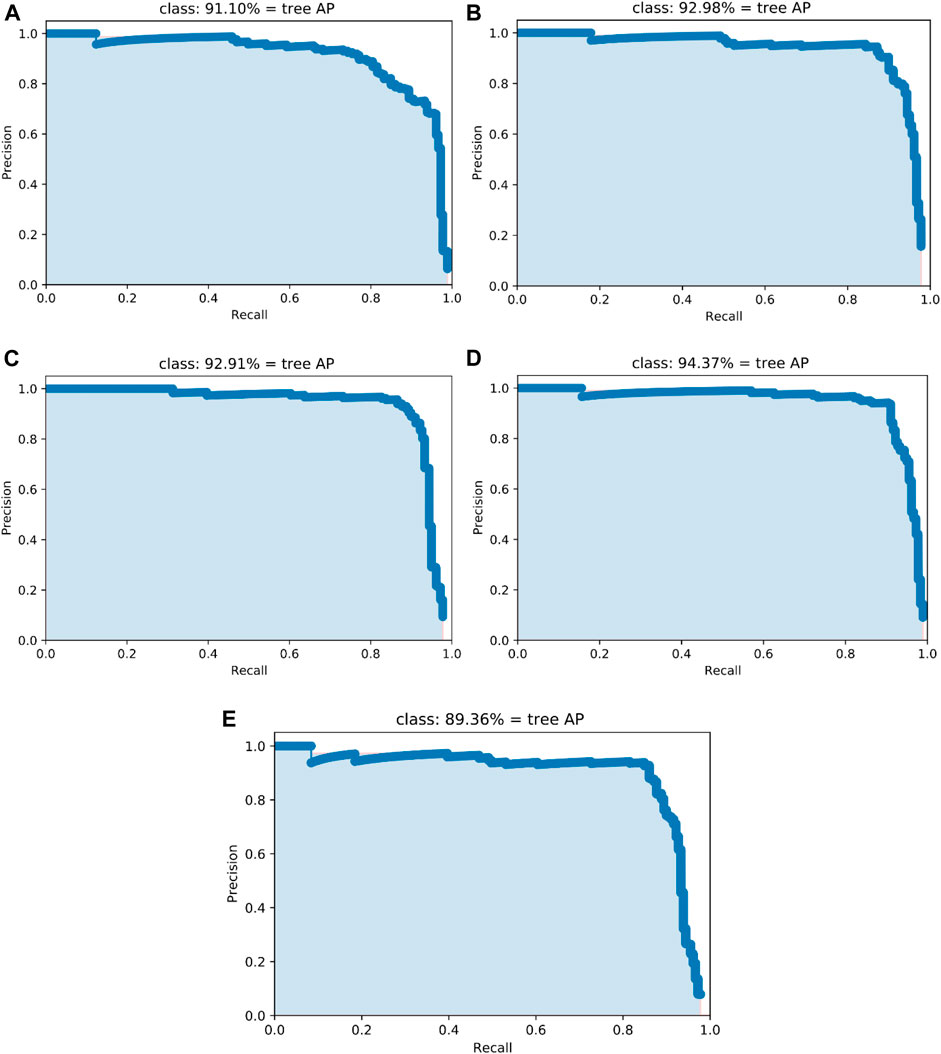
FIGURE 10. Precision-recall curves for each method. (A) Model 1 (B) Model 2. (C) Model 3. (D) Model 4. (E) Model 5.
3.5 Evaluation Criteria of Detection Accuracy
For a variety of single tree detection methods, the evaluation of their detection excellence depends on evaluation standard. At present, there is no unified evaluation standard. The spatial position difference between a ground reference single tree and a detected single tree can be considered as correct detection within a specific range. The geometric center of the actual box is the position of a single tree. The point coordinate of single tree detection and a single reference tree are denoted as
1) When
2) If there is
3) If
Based on the above conditions,

TABLE 3. Single tree detection evaluation indicators.
4 Single Tree Detection Results
The optimal SSD model is applied to the single tree detection of an urban plantation, and experimental results are compared with the latest single tree detection method. Optimal SSD model 4 is called the SSD model in the following.
4.1 Campus
The available view of single tree detection around the campus is shown in Figure 7. The statistical analysis of experimental results is shown in Table 4. The accuracy of the five methods differs significantly. From the experimental results, the traditional local maximum method and watershed method are generally effective in single tree detection. The watershed method has the worst result. The accuracy of the watershed method is 32.9%. The latest template matching method and CV model method have a good effect. The accuracy of the SSD model is 96% and has the highest accuracy in the experimental results of five methods. Specifically, the SSD model gains high scores in recall rate and omission rate. The commission rate of the template matching method is zero. The omission rate of template matching is 29.1%.
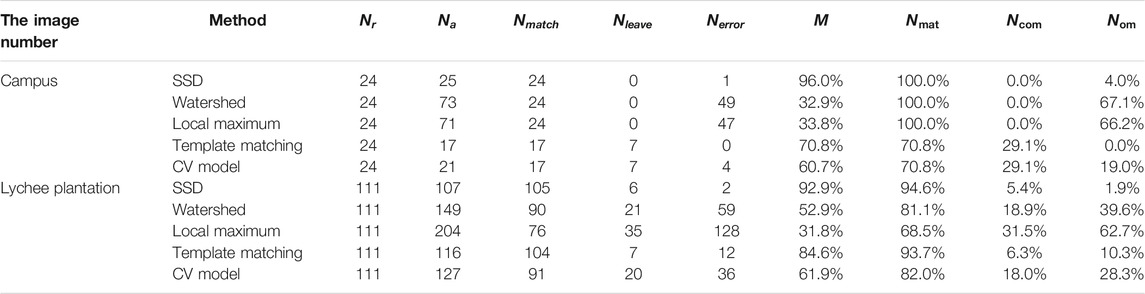
TABLE 4. Single tree inspection accuracy evaluation.
4.2 Orchard
The visual results of the experiment in the lychee plantation are shown in Figure 8. The accuracy of the five methods is significantly different, as shown in Table 4. SSD has the highest accuracy of five methods. The accuracy of SSD is 92.9%. The lowest accuracy is 31.8%. The accuracy of the local maximum method is the lowest. The accuracy of SSD is 61.1% more than the accuracy of the local maximum method. The accuracy of watershed is 52.9%. Obviously, SSD’s single tree detection effect is far better than the traditional single tree detection method. Compared with the latest CV model and template matching, the accuracy of the SSD model is 31% higher than the CV model and 8.3% higher than the template matching method. The SSD model obtains a higher score in recall rate, omission rate, and commission rate.
4.3 Economic Plantation
Palm trees are not only a treasure, but are also one of the world’s most important sources of oil (De Aguiar et al., 2020). Thailand is one of the main planting bases of palm trees, while China’s largest area of palm trees is mainly distributed in Red River county, Yunnan province, China. Palm plantations represent economic plantations.
The single palm tree detection experimental effect is shown in Figure 9, a detected box is red and a detected box outside the yellow line is cleared. Palm trees that were detected in error or missed are flagged. A white marker denotes a mistakenly detected single tree, and a blue marker means the missed detected of a single tree.
4.3.1 Open Economic Plantation
On behalf of the open economic plantation, the open palm plantation is sample plot 1. The test results of the open palm plantation are shown in Figure 9B and Table 5. The SSD model has the highest accuracy, the highest recall rate, and the lowest omission in the experimental results of the five methods. The accuracy of SSD is 96.4%. The recall rate of SSD is 98.8%. The omission rate of SSD is 1.2%. Two palm trees are missed among 164 reference palm trees in SSD-detected results. Mistakenly, the template matching method identifies two background objects as palm trees. The lowest commission rate reaches 1.3%. the SSD model has the second lowest commission rate. The commission rate of the SSD model is 2.4%. The accuracy of the local maximum is 53.9%. Watershed has the lowest recall rate. The recall rate of watershed is 65.9%. Watershed has the highest omission rate. The highest omission rate of watershed is 34.1%. The commission rate of the local maximum is 38.4%.
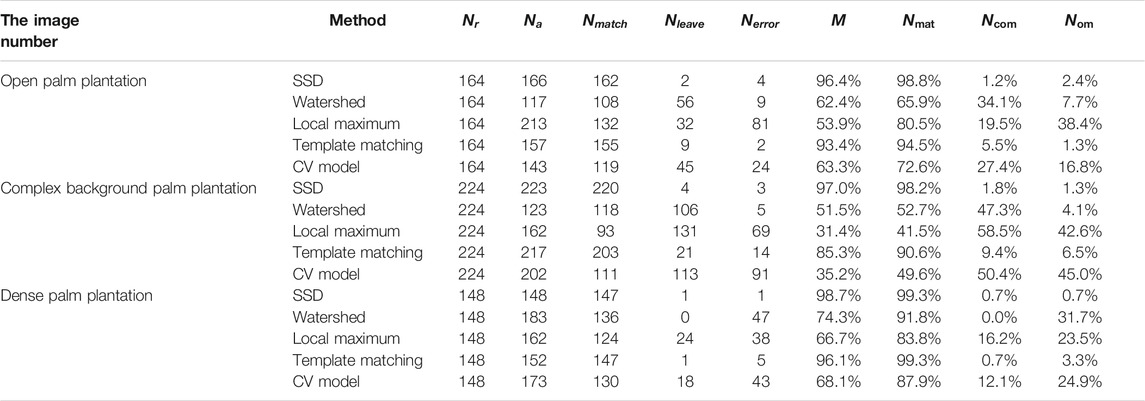
TABLE 5. Single tree inspection accuracy evaluation.
4.3.2 Complex Background Economic Plantation
In this study, sample plot 2 is a complex background palm plantation, and the experimental results are shown in Figure 9D and Table 5. The SSD model has the highest accuracy in the experimental results of the five methods. The accuracy of SSD is 97.0%. The SSD model has the highest recall in the experimental results of the five methods. The recall of SSD is 98.2%. The SSD model has the lowest omission rate in the experimental results of the five methods. The lowest omission rate of SSD is 1.8%. Four palm trees are missed among 224 reference palm trees in SSD-detected results. Mistakenly, the SSD model identifies three background objects as palm trees. The lowest commission rate reaches 1.3%. The SSD model has the lowest commission rate. The accuracy of the local maximum is 31.4% and is the lowest accuracy. The recall rate of the local maximum is 41.5% and is the lowest recall rate. The omission rate of the local maximum is 58.5% and is the highest omission rate. The CV model has the highest commission rate. The commission rate of the CV model is 45.0%. Mistakenly, the CV model identifies 91 background objects as palm trees.
4.3.3 Dense Economic Plantation
Dense palm plantations have many problems, such as the fact that dense tree crowns completely block sunlight, obscure single tree crowns, and have high canopy density, which have increased the difficulty of gaining artificial statistics for single trees. Therefore, it is difficult to improve the accuracy of single tree detection and location in dense palm plantations when using the traditional method. In this study, sample plot 3 is a dense palm plantation, and experimental results are shown in Figure 9F and Table 5.
The SSD model has the highest accuracy in the experimental results of the five methods. The accuracy of SSD is 98.7%. The SSD model has the highest recall rate in the experimental results of the five methods. The recall rate of SSD is 99.3%. The omission rate of watershed is zero. The omission rate of the SSD model and template matching method is tied for second place with one missed detection among 148 reference palm trees. The omission rate of the SSD model and template matching method is 0.7%. The SSD model has the lowest commission rate in the experimental results of the five methods. Mistakenly, the SSD model identifies one background object as a palm tree. The commission rate of the SSD model is 0.7%. The accuracy of the local maximum is the lowest in the experimental results of the five methods. The accuracy of the local maximum is 66.7%. The lowest recall rate is the local maximum in the experimental results of the five methods. The recall rate of the local maximum is 83.8%. The omission rate of the local maximum is the highest in the experimental results of the five methods. As can be seen from Table 5, 24 reference trees are missed. The omission rate of the local maximum is 16.2%. Watershed has the highest commission rate in the experimental results of the five methods. The commission rate of watershed is 31.7%. The watershed mistakes 47 background objects as reference palm trees.
5 Discussion
At present, it takes a lot of manpower and material resources to identify and locate tree species over a large area and in a scattered plantation depending on collecting information or identifying pictures with the naked eye. The manager of an artificial plantation divides it into four stages: young plantation, middle plantation, mature plantation, and overmature plantation. Each stage has different characteristics of individual trees, and machine recognition is more stable and produces fewer errors than human eye recognition. Researchers have developed a variety of methods to extract individual tree information from high-resolution remote sensing images instead of the human eye (Liu et al., 2016; Iqbal et al., 2021). However, the existing single tree detection methods still have shortcomings (Gebreslasie et al., 2011; Millikan et al., 2019; De Aguiar et al., 2020; Dersch et al., 2020).
In this study, the comparison of five experiment groups proves that single tree detection based on SSD has a better effect. According to the problems existing in single tree detection, the experimental research is carried out one by one:
1) Experiments with different canopy densities have been completed, this article makes a comparison between an open plantation and dense plantation.
2) The detection effect of the SSD model has been verified in a plantation area with a complex background.
3) The application effect of the SSD model has been verified in urban single tree detection, including a single tree on a campus, a single tree in an orchard, and a single tree in an economic plantation.
The summary of the five experiment groups shows that the lowest accuracy is the local maximum method, with an average detection accuracy of 43.52%. Local maximum extracts the maximum value of an area. If there is no single tree in the local area, the local maximum value will be wrongly judged as a single tree. If there are multiple single trees in the local area, the local maximum can only identify a single tree with the largest value. Due to the above reasons, local maximum is mediocre in single tree detection. The average detection accuracy of the watershed method is 54.8%. If a tree has too many branches, watershed can easily identify it as two trees. This leads to the high commission rate of watershed. If the distance between two trees is very close, watershed will identify it as a tree, which leads to a high omission rate of detection. The average detection accuracy of the latest template matching method is 86.04%. Template matching is not as detailed as the SSD model in extracting single tree crown features. The average detection accuracy of the CV model method is 57.84%. The CV model combines the advantages of local maximum and watershed. However, the CV model also has the problems of over-segmentation and under-segmentation. The SSD model has the highest average accuracy in the experimental results of the five methods with an average accuracy of 96.32%, because the SSD model can capture single tree canopy features from high-resolution remote sensing images well. The average recall rate of the SSD model is 97.94% which is the highest average recall rate. When category confidence exceeds 0.5, the SSD model identifies an object as a single tree. The average commission rate of the SSD model is the lowest average commission rate, which is 1.7%. The SSD model has the lowest average omission rate in the experimental results of the five methods. The average omission rate of SSD is 2.06%. Therefore, the SSD model has the best single tree detection performance.
Weijia Li et al. (Weijia et al., 2016) applied a convolutional neural network method based on deep learning to the detection of general palm trees, with an average recall rate of 96%. Dong Tianyang et al. (Dong et al., 2018) proposed a single tree detection method based on a progressive cascade convolutional neural network, which is applied to an open plantation and green trees with an average recall rate of 90%. In this study, the SSD model is applied to urban single tree detection, the average recall rate of SSD is 97.94%. So, the SSD model is more comprehensive and detailed in extracting single tree features. The SSD model is better than the common convolutional neural network in single tree detection.
6 Conclusion
Automatic identification and location of single trees based on high-resolution remote sensing images is of great significance for ecological park planning, plantation management, and large-scale ecological environment quality monitoring. In this study, the SSD model is applied to single tree detection of high-resolution remote sensing images. The study addresses a number of problems with previous approaches, such as too large trunk branches of a single tree, serious adhesion between crowns, and missing and false detection problems in complex backgrounds. The SSD model is applied to single tree detection in urban plantation. Accurately, the SSD model can capture the canopy features of single trees in high-resolution remote sensing images. The SSD model not only segments single tree crowns, but also recognizes single tree crowns in complex backgrounds. In the process of single tree detection, the SSD model has stronger anti-interference ability and is almost unaffected by the branches of a single tree. The SSD model has excellent performance in all aspects and shows good application potential. This study can be used as a reference for other agricultural and forestry products. It is also hoped that other techniques can be used to describe the crown contour of a single tree.
Data Availability Statement
The original contributions presented in the study are included in the article/Supplementary Material, further inquiries can be directed to the corresponding author.
Author Contributions
Conceptualization: YZ; Methodology: YZ; Software YZ; Validation: GW; Formal analysis: YZ; Investigation: YZ; Resources: YZ; Data Curation: YZ; Writing -Original Draft: YZ; Writing -Review and Editing: YZ; Visualization: YZ; Funding acquisition: GW.
Conflict of Interest
The authors declare that the research was conducted in the absence of any commercial or financial relationships that could be construed as a potential conflict of interest.
Publisher’s Note
All claims expressed in this article are solely those of the authors and do not necessarily represent those of their affiliated organizations, or those of the publisher, the editors, and the reviewers. Any product that may be evaluated in this article, or claim that may be made by its manufacturer, is not guaranteed or endorsed by the publisher.
References
Ahl, R., Hogland, J., and Brown, S. (2019). A Comparison of Standard Modeling Techniques Using Digital Aerial Imagery with National Elevation Datasets and Airborne LiDAR to Predict Size and Density Forest Metrics in the Sapphire Mountains MT, USA. Ijgi 8 (1), 24. doi:10.3390/ijgi8010024
Belcore, E., Angeli, S., Colucci, E., Musci, M. A., and Aicardi, I. (2021). Precision Agriculture Workflow, from Data Collection to Data Management Using FOSS Tools: An Application in Northern Italy Vineyard. Ijgi 10 (4), 236. doi:10.3390/ijgi10040236
Chen, C., Wang, Y., Li, Y., Yue, T., and Wang, X. (2017). Robust and Parameter-free Algorithm for Constructing Pit-free Canopy Height Models. Ijgi 6 (7), 219. doi:10.3390/ijgi6070219
Chu, H.-J., Huang, M.-L., Tain, Y.-C., Yang, M.-S., and Höfle, B. (2017). Historic Low Wall Detection via Topographic Parameter Images Derived from Fine-Resolution DEM. Ijgi 6 (11), 346. doi:10.3390/ijgi6110346
Congalton, R., Gu, J., Yadav, K., Thenkabail, P., and Ozdogan, M. (2014). Global Land Cover Mapping: A Review and Uncertainty Analysis. Remote Sensing 6, 12070–12093. doi:10.3390/rs61212070
De Aguiar, A., Dos Santos, F., Santos, L., and Filipe, V. M. (2020). Vineyard Trunk Detection Using Deep Learning - an Experimental Device Benchmark[J]. Comput. Elect. Agric. 175, 1. doi:10.1016/j.compag.2020.105535
Deng, G., Li, Z., and Wu, H. (2010). Tree crown Recognition Algorithm on High Spatial Resolution Remote Sensing Imagery. IEEE.
Dersch, S. D. S., Heurich, M. H. M., Krueger, N. K. N., and Krzystek, P.(2020). Combining Graph-Cut Clustering with Object-Based Stem Detection for Tree Segmentation in Highly Dense Airborne Lidar point Clouds[J]. ISPRS J. Photogrammetry Remote Sensing 172, 207–222. doi:10.1016/j.isprsjprs.2020.11.016
Dong, T. Y., Jian, Z., Gao, S., and Shen, Y. (2018). Single-Tree Detection in High-Resolution Remote-Sensing Images Based on a Cascade Neural Network[J]. Int. J. Geo-Information 7 (9), 367. doi:10.3390/ijgi7090367
Dong, T., Shen, Y., Zhang, J., Ye, Y., and Fan, J. (2019). Progressive Cascaded Convolutional Neural Networks for Single Tree Detection with Google Earth Imagery. Remote Sensing 11 (15), 1786. doi:10.3390/rs11151786
Faridatul, M. I., and Wu, B. (2018). Automatic Classification of Major Urban Land Covers Based on Novel Spectral Indices. Ijgi 7 (12), 453. doi:10.3390/ijgi7120453
Gebreslasie, M. T., Ahmed, F. B., Van Aardt, J. A. N., and Blakeway, F. (2011). Individual Tree Detection Based on Variable and Fixed Window Size Local Maxima Filtering Applied to IKONOS Imagery for Even-Aged Eucalyptus Plantation Forests. Int. J. Remote Sensing 32 (15), 4141–4154. doi:10.1080/01431161003777205
Gougeon, F. A. (1995). A Crown-Following Approach to the Automatic Delineation of Individual Tree Crowns in High Spatial Resolution Aerial Images. Can. J. Remote Sensing 21, 274–284. doi:10.1080/07038992.1995.10874622
Guirado, E., Tabik, S., Alcaraz-Segura, D., Cabello, J., and Herrera, F. (2017). Deep-learning versus OBIA for Scattered Shrub Detection with Google Earth Imagery: Ziziphus lotus as Case Study. Remote Sensing 9 (12), 1220. doi:10.3390/rs9121220
Iqbal, M. S., Ali, H., Tran, S. N., and Iqbal, T. (2021). Coconut Trees Detection and Segmentation in Aerial Imagery Using Mask Region‐based Convolution Neural Network. IET Comput. Vis. 15 (6), 428–439. doi:10.1049/cvi2.12028
Jiang, R. R., Wang, C. Y., Shen, L. Q., and Wang, P. (2016). A Method for Lichee’s Tree-crown Information Extraction Based on High Spatial Resolution Image. Trans. Chin. Soc. Agric. Machinery 47 (09), 17–22. doi:10.6041/j.issn.1000-1298.2016.09.003
Kupidura, P., Osińska-Skotak, K., Lesisz, K., and Podkowa, A. (2019). The Efficacy Analysis of Determining the Wooded and Shrubbed Area Based on Archival Aerial Imagery Using Texture Analysis. Ijgi 8 (10), 450. doi:10.3390/ijgi8100450
Larsen, M., and Rudemo, M. (1998). Optimizing Templates for Finding Trees in Aerial Photographs. Pattern Recognition Lett. 19 (12), 1153–1162. doi:10.1016/s0167-8655(98)00092-0
Li, M. H., Chen, Y. C., Zhou, S. F., and Xiao, S. Z. (2019). Extractionand Recognition of Individual Tree Information on Aerial Image Data Used Watershed Algorithm. J. Northeast For. Univ. 47 (9), 58–62. doi:10.13759/j.cnki.dlxb.2019.09.011
Liu, P., Zhang, H., and Eom, K. B. (2017). Active Deep Learning for Classification of Hyperspectral Images. IEEE J. Sel. Top. Appl. Earth Observations Remote Sensing 10, 712–724. doi:10.1109/jstars.2016.2598859
Liu, W., Anguelov, D., Erhan, D., Szegedy, C., and Scott, R. (2016). “SSD: Single Shot Multi Box Detector[J],” in European Conference on Computer Vision (Cham: Springer).
Liu, Y. F., Pan, Y., and Li, H. (2019). Study of crown Information Extraction of Picea Schrenkiana Var. Tianschanica Based on High-Resolution Satellite Remote Sensing Data. Remote Sensing Land Resour. 31 (04), 112–119. doi:10.6046/gtzyyg.2019.04.15
Millikan, P. H. K., Silva, C. A., Rodriguez, L. C. E., Oliveira, T. M. d., Carvalho, M. P. d. L. C. e., and Carvalho, S. d. P. C. e. (2019). Automated Individual Tree Detection in Amazon Tropical Forest from Airborne Laser Scanning Data. Cerne 25 (3), 273–282. doi:10.1590/01047760201925032630
Mokroš, M., Liang, X., Surový, P., Valent, P., Čerňava, J., Chudý, F., et al. (2018). Evaluation of Close-Range Photogrammetry Image Collection Methods for Estimating Tree Diameters. ISPRS Int. J. Geo-inf 7 (3), 93. doi:10.3390/ijgi7030093
Pollock, R. (1996). J. The Automatic Recognition of Individual Trees in Aerial Images of Forests Based on A Synthetic Tree Crown Image Model[D]. Vancouver: The University of British Colombia, 172.
Roska, T., and Chua, L. O. (2008). The CNN Universal Machine:[J]. J. Circuits Syst. Comput. 12 (04), 377–388. doi:10.1142/S0218126603000921
Sharma, R., Xu, Z., Sugumaran, R., and Oliveira, S. (2016). Parallel Landscape Driven Data Reduction & Spatial Interpolation Algorithm for Big LiDAR Data. Ijgi 5 (6), 97. doi:10.3390/ijgi5060097
Wang, L., Gong, P., and Biging, G. S. (2004). Individual Tree-Crown Delineation and Treetop Detection in High-Spatial-Resolution Aerial Imagery. Photogramm Eng. Remote Sensing 70 (3), 351–357. doi:10.14358/pers.70.3.351
Wang, Y., Jiang, T., Liu, J., Li, X., and Liang, C. (2020). Hierarchical Instance Recognition of Individual Roadside Trees in Environmentally Complex Urban Areas from UAV Laser Scanning Point Clouds. Ijgi 9 (10), 595. doi:10.3390/ijgi9100595
Weijia, L., Haohuan, F., Le, Y., and Cracknell, A. (2016). Deep Learning Based Oil Palm Tree Detection and Counting for High-Resolution Remote Sensing Images[J]. Remote Sensing 9 (1), 22. doi:10.3390/rs9010022
Yu, X. Z., Wang, R. R., and Cheng, W. J. (2018). Improved Watershed Algorithm Is Used in the Segmentation of Uav Remote Sensing Image Canopy. J. fujian Agric. For. Univ. 47 (04), 428–434. doi:10.13323/j.cnki.j.fafu(nat.sci.).2018.04.008
Zhang, L., Liu, P., Zhao, L., Wang, G., Zhang, W., and Liu, J. (2021). Air Quality Predictions with a Semi-supervised Bidirectional LSTM Neural Network. Atmos. Pollut. Res. 12 (1), 328–339. doi:10.1016/j.apr.2020.09.003
Zhang, M., Du, H., Mao, F., Zhou, G., Li, X., Dong, L., et al. (2020). Spatiotemporal Evolution of Urban Expansion Using Landsat Time Series Data and Assessment of its Influences on Forests. Ijgi 9 (2), 64. doi:10.3390/ijgi9020064
Zhang, N., Zhang, X. L., and Ye, L. (2014). Tree crown Extraction of High Resolution Remote Sensing Image Segmentation Based on Improved Peak Climbing Method. Trans. Chin. Soc. Agric. Machinery 45 (12), 294–300. doi:10.6041/j.issn.1000-1298.2014.12.042
Keywords: single shot multibox detector, Urban forest, tree detection, tree location, high-resolution remote sensing image
Citation: Zheng Y and Wu G (2021) Single Shot MultiBox Detector for Urban Plantation Single Tree Detection and Location With High-Resolution Remote Sensing Imagery. Front. Environ. Sci. 9:755587. doi: 10.3389/fenvs.2021.755587
Received: 09 August 2021; Accepted: 12 November 2021;
Published: 30 November 2021.
Edited by:
Peng Liu, Institute of Remote Sensing and Digital Earth (CAS), ChinaReviewed by:
Costica Nitu, Politehnica University of Bucharest, RomaniaM. Iqbal Saripan, Putra Malaysia University, Malaysia
Wei Liu, Institute of Automation (CAS), China
Copyright © 2021 Zheng and Wu. This is an open-access article distributed under the terms of the Creative Commons Attribution License (CC BY). The use, distribution or reproduction in other forums is permitted, provided the original author(s) and the copyright owner(s) are credited and that the original publication in this journal is cited, in accordance with accepted academic practice. No use, distribution or reproduction is permitted which does not comply with these terms.
*Correspondence: Gang Wu, d3VnYW5nQGJqZnUuZWR1LmNu