 Désirée Ruppen
 Owen A. Chituri
 Maideyi L. Meck
 Numa Pfenninger
 Bernhard Wehrli
- 1Institute of Science, Technology and Policy (ISTP), ETH Zürich, Zurich, Switzerland
- 2Department of Geology, University of Zimbabwe, Harare, Zimbabwe
- 3Department of Water Resources and Drinking Water, Eawag, Swiss Federal Institute of Aquatic Science and Technology, Dübendorf, Switzerland
- 4Department of Surface Waters Research and Management, Eawag, Swiss Federal Institute of Aquatic Science and Technology, Kastanienbaum, Switzerland
Although mining and mineral processing are vital for many economies in the Global South, they are associated with enormous challenges of managing potentially devastating environmental impacts. In contexts where environmental oversight agencies often lack financial and personal capacities to fulfill their role, community-based monitoring might be a valid alternative to monitor potential environmental impacts. In this study, we present the setup and the implementation of a citizen science project to monitor water quality parameters in a river downstream of a coal mining area in Hwange, Western Zimbabwe. In a joint effort over 1.5 years, community monitors and scientists took close to 800 water samples in the Deka River and effluent channels. The data allowed identifying sources of pollution and relating these to past and present mining activities. The primary source of acid mine drainage came from abandoned underground mine sites. Illegal mine water dumping from active mine sites accentuated the problem and resulted in fish kills and food risks for the local population. Concentrations of manganese, nickel and arsenic were exceeding national fresh water guidelines and international drinking water standards. Manganese concentrations exceeded guidelines by a factor of 70 resulting in a public health risk. In this study, we showed that community-based monitoring offers a promising approach to establish a high-quality dataset for assessing mining-related risks if the implementation of sampling protocols is followed tightly. The monitoring scheme significantly improves the collection and interpretation of water quality data in challenging contexts where governmental institutions and industrial players are not enforcing environmental standards.
1 Introduction
Mining and mineral processing are vital for many economies in the Global South. In 2018, over 70% of minerals and metals were produced in developing and transition countries. Their share of the global mining output is increasing every year as mineral demand is growing while the production of developed countries flattens since more than a decade (Reichl et al., 2020). Mining and mineral processing come with enormous challenges of managing potentially devastating environmental impacts such as atmospheric emissions, soil contamination, land disturbance, biodiversity loss and water pollution (Azcue, 1999; Jain et al., 2016). Areas with highest extraction growth rates per year are as well primarily located in low and middle-income countries of the Global South where mining intensification hotspots enhance water scarcity and/or threaten species-rich biomes and vulnerable ecosystems (Luckeneder et al., 2021). As average ore grades of industrial mining production are declining over time (Mudd, 2007; Calvo et al., 2016), the proportion of waste rock per unit of commodity produced is steadily increasing, and with it the challenge of managing and disposing the billions of tons of mine waste generated each year around the globe (Jones and Boger, 2012). Mine tailings and abandoned mines specifically affect water resources far beyond the lifespan of a mine via acid mine drainage (AMD) produced by accelerated oxidation and weathering of sulfide-rich ore deposits and mine waste. This results in acidic effluents with elevated concentrations of metals (Sheoran and Sheoran, 2006; Jamieson, 2011). AMD remains an important water pollution problem of the mining industry around the world (Clarke, 1996; Kuyucak, 2002; Johnson and Hallberg, 2005). In mineral-rich countries of the Global South, environmental management authorities often lack financial and personal capacities for performing periodical sampling and analysis independently and fail to enforce national environmental regulations (Natural Resource Governance Institute, 2017).
In research related to ecosystem services, citizen science projects encourage the general public to contribute to the design, collection and interpretation of environmental quality data (Buytaert et al., 2014; Commodore et al., 2017; McKinley et al., 2017). In Northern America, volunteer-based water quality monitoring is renown and hundreds of such environmental monitoring projects are on-going (Carr, 2004; Conrad, 2007; Stepenuck and Genskow, 2019). United States states such as Maine and Wisconsin have made volunteer engagement an integral part of their natural resources’ governance approach (Maine Volunteer Lake Monitoring Program VLMP, 2013; Wisconsin Department of Natural Resources, 2018). In addition, citizen science was recently promoted by the United Nations as a way to reach the sustainable development goal on water and sanitation (UN-Water, 2020). Although the number of citizen science projects in water research in the Global South is constantly growing (Walker et al., 2021), we are not aware of such projects focusing on mining-related water pollution. Sure, participative monitoring has been promoted by the World Bank and the International Council for Mining and Metals to avoid or reduce mining conflicts and increase trust between communities and mining companies (CAO, 2008; ICMM, 2015). In the Athabasca Basin in Canada for instance, a uranium mining company finances a participative environmental monitoring scheme where members of local communities take water and sediment samples in collaboration with a local environmental consultancy company (CanNorth, 2015, 2016). For the mining company, the project mainly aims at reducing resistance to the mining operations and increasing trust in the company’s activities.
Citizen science networks in general and community-based monitoring schemes in particular, could offer a complementary framework to fill the gaps of institutional monitoring and contribute to the improvement of natural resource governance in mineral producing countries with weak oversight agencies. Here, we present a citizen science approach that addresses the need for an innovative monitoring scheme with high spatial and temporal coverage demonstrating cause and effect of mining-related pollution. To this end, we focus our study on the case of the coal mining area of Hwange in Northwestern Zimbabwe where the water quality of the local river, Deka, is deteriorating and numerous fish kills afflict the river each year. Villagers reported livestock allegedly dying after herding around the Deka River. Pollution issues in Hwange allegedly related to coal mining and processing reached broader general public attention in 2011 after a newspaper reported “Stop coal miners or see Hwange die” (The Zimbabwean, 2011). Affected by the worsening environmental condition of the Deka River, communities started to mobilize against the pollution and express grievances towards the mining and processing companies in 2017. This led to an ongoing multi-stakeholder mediation process with government, industry and civil society organizations. Even though the Deka River pollution is broadly accepted by the industrial stakeholders, the contribution of each player to the overall pollution remained unclear and highly debated. Two studies of the Deka River’s water quality identified some violation of Zimbabwe effluent standards. However, due to the one-shot nature of the analysis and other methodological shortcomings, these studies were neither able to identify the pollutants causing the loss of aquatic life and livestock nor pinpoint sources to find the culprits on the side of the companies (Nhiwatiwa, 2015; Yalala, 2017).
In this highly polarizing context, we started a community-based water quality monitoring scheme that aimed at achieving three goals 1) to examine the impacts of coal mining activities on river water quality, 2) to identify potential public health risks related to river pollution and 3) to assess the effectiveness of current mine management practices. Citizen scientists took grab samples to capture spatial relationships between sources and environmental impacts and helped to install and maintain automated sensors in order to assess potential relationships between acute pollution events and the hydrological dynamics. Trained scientists complemented the dataset by sampling additional locations. We analyzed the resulting dataset to address the concerns about potential mining impacts on the environment and community health. Based on those outcomes, we further evaluated the effectiveness of community-based monitoring for mining areas in developing countries. We describe qualitatively how to set-up such a co-production of science (Nowotny et al., 2013) between an academic institution and local communities in order to overcome systemic barriers for citizen science schemes.
2 Study Area
Hwange District, with its economic center Hwange Town, is located in Northwestern Zimbabwe, at the boarder to Zambia and Botswana (Figure 1). The Deka River has its source some 80 km Southwest of Hwange Town in the pristine environment of the world renown Hwange National Park. After crossing Hwange town, the river flows northeastwards into the Zambesi River passing several villages in the rural area. In this subtropical climate, rainfall is scarce with an average annual precipitation of around 700 mm (Moyo et al., 2012) and 98% of the rainfall occurs from October to April (Chamaillé-Jammes et al., 2007). Due to climate change, the onset of the rains has significantly shifted to the end of the year (Dervieux and Belgherbi, 2020) and the region is regularly prone to severe droughts with El Niño as the major driving force for interannual climate variability (Gore et al., 2020). Community members from the villages close to Deka use the river water for catching fish as their main source of protein, breeding baskets, feeding their livestock and also as a direct source of fresh water due to lack of functioning drinking water boreholes.
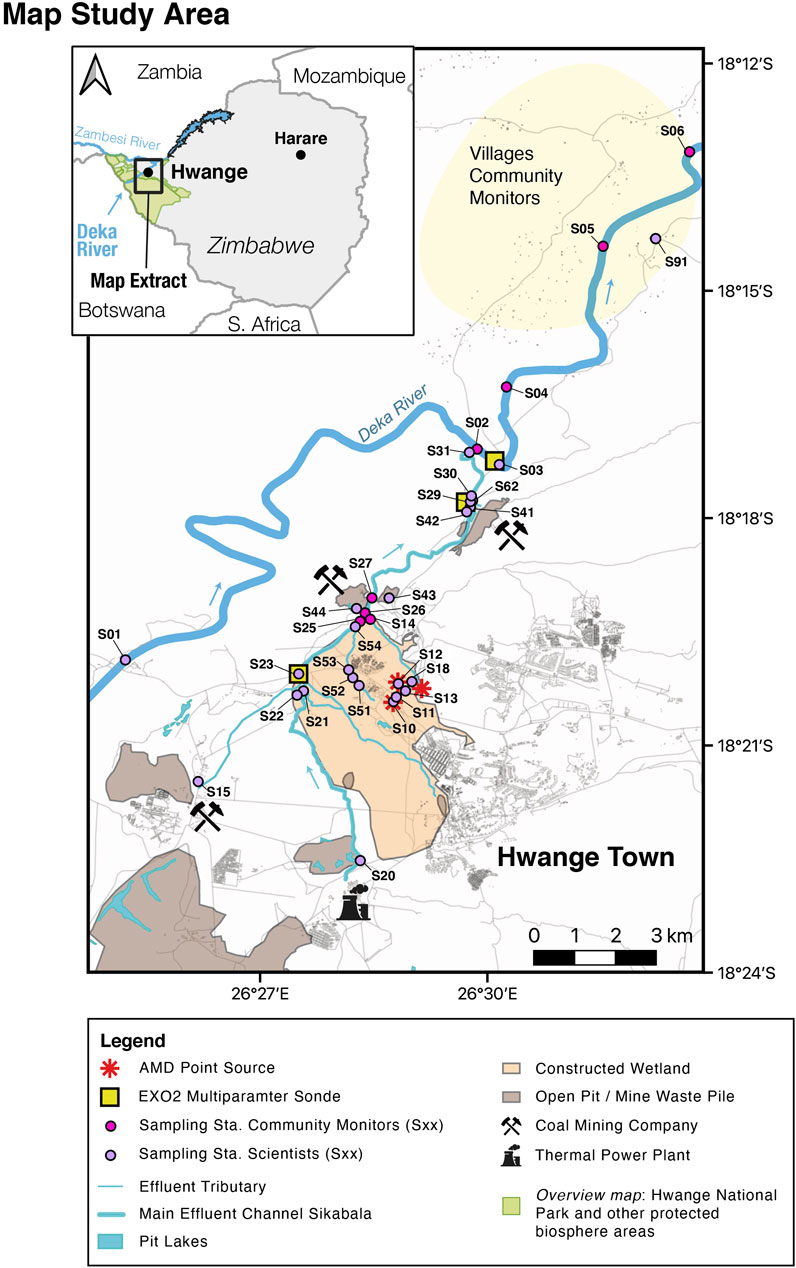
FIGURE 1. Overview map illustrating coal mining concessions and protected natural reserves in the Hwange District, Western Zimbabwe (top left). Detailed map of Hwange Town and surrounding villages with the Deka River, industrial sites and locations of the sampling station for the water quality monitoring and the placement of the in-situ sondes (center). QGIS maps contain administrative boundaries from DIVA-GIS (Hijmans et al., 2018) and infrastructure, buildings and roads from (Open Street Map, 2021). Shapefiles of the protected biosphere areas were provided by the Protected Planet Initiative (UNEP-WCMC and IUCN, 2021). Some sampling stations are located outside the map extent and are not included in this figure. Coordinates of all sampling stations are listed in the Supplementary Material.
In and around the town of Hwange, bituminous coal has been mined and processed since colonial times. Shortly after the discovery of the rich coal seams at the end of the 19th century, the colonial administration granted a concession of over 1,000 km2 to the Wankie (Rhodesia) Coal, Railway and Exploration Company that started producing coal in 1903 (Palloks, 1987). This mining company has been restructured several times, but is still operating currently. In recent years, half a dozen other mining companies have been granted concessions to extract coal in Hwange District. Although extensive areas have been mined underground in the past, open pit mines dominate today. The largest share of Hwange’s thermal coal is locally combusted at Zimbabwe’s largest thermal power plant producing 40% of the country’s electricity. For several decades, industrial effluents from coal mining and processing operations are channeled into the Deka River system via the main Sikabala channel (Figure 1). Currently, the activities of three coal mining companies and the thermal power plant mainly contribute to the discharge into Sikabala. The channel originates at the thermal power plant that continuously releases cooling water. Along its way, Sikabala is joined by a complex network of smaller effluent channels. The entire system is embedded in a patchwork of several hectares of constructed wetlands, where reeds partly treat the effluent. In between, there are areas with standing water that exhibit typical field indicators for AMD such as disturbed biota and “yellow-boy” mineral precipitates that cover stream beds and banks (Lottermoser, 2010). These areas are located on top of underground mines that have been closed in the 1960s to 1970s. Here, acidic groundwater reaches the surface through former service- and exploration boreholes. In recent years, artesian wells with water fountains of several meters’ height have built up. The boreholes have been unsuccessfully plugged and the groundwater is still reaching the surface, accumulating in small lakes. After crossing the wetlands, Sikabala episodically receives additional mine water from current open pit activities and, especially during rainy season, wash out of coal particles from mine waste heaps. After heavy rainfall events, spontaneous overflow of strongly acidic water accumulated in pit lakes or even illegal pumping of this pit lake water might significantly add to Sikabala effluent volume and contaminant load. Sikabala and the entire effluent drainage network is not fenced and is regularly accessed by the population living and working nearby. From the source to the confluence with the Deka River, Sikabala flows for around 20 km. It joins the Deka River just a few meters downstream of a small dam that was constructed during colonial times. The river upstream of the inlet of Sikabala channel runs dry approximately from July to October and therefore Sikabala is the only water feeding Deka in that period (Pictures of the Sikabala and Deka River Systems are provided in the Supplementary Material).
3 Materials and Methods
In total, 13 community members from four different villages located along the Deka River participated in the community-based monitoring. They self-identified as “community monitors” and chose to group in four teams. On a weekly to bi-weekly frequency, they sampled eight spots along the Deka and the Sikabala tributary. Regularly, two trained scientists conducted sampling campaigns taking samples at another 28 locations in the study area. Researchers also installed multiparameter in-situ probes to record water quality parameters. In a joint excursion, community monitors and scientists sampled five drinking water boreholes in the broader Hwange District (The chemistry of the drinking water boreholes is presented in the Supplementary Material).
3.1 Community-Based Environmental Quality Monitoring in Hwange
3.1.1 Training
On December 14, 2018, researchers conducted a sampling training workshop at the primary school in the village of Mashala. The training introduced community members with limited formal education and scientific literacy to fundamental knowledge about water quality and sampling. Using an illustrated training manual, the training focused on measuring pH by using test strips and taking water samples while minimizing sample contamination. The community monitors were also encouraged to store the samples safely in dry and dark places in their houses. During this training meeting and subsequent test sampling, the community members and the scientist jointly decided where to locate the sampling spots in the Deka River. We advised community monitors to catch dead fish if a fish kill occurred (Demography of the community monitors and further information on the collaboration is documented in the Supplementary Material).
3.1.2 Sampling
Community monitors took unfiltered 50 ml water samples in polyethylene falcon tubes provided by the project. In total, they collected 420 grab samples in the time span of December 2018 to March 2020. Three sampling stations were located on the Deka River downstream of the confluence with the effluent channel Sikabala while another station was situated upstream. In addition, three sampling stations were located along the Sikabala and one at a main AMD tributary (coordinates of all sampling stations in the Supplementary Material). Community monitors rinsed sampling tubes three times with the test water before taking the sample. They measured pH in the flowing water using test strips (Merck pH-Indicator strips pH 2.0–9.0 MColorpHast™) and recorded data in their notebooks including date and time of sampling, weather condition, water color, observations about the ecosystem condition such as presence of fish and insects. Their notes were later digitized. Community monitors labelled the samples with a code, including the initials of each community monitor and continuous numbers. In order to minimize contamination and health risks, community monitors took unfiltered and unacidified grab samples. While taking acid-free samples is not a standard procedure, it has been successfully used for sampling and analysis of trace metals in stream water (Erel et al., 1991). In the rainy season of 2019/2020, community monitors agreed to record rainfall data in order to fill the gap of missing rainfall records. Community monitors mounted conical rain gauges (plastic, max holding capacity 100 mm, electrosales, Zimbabwe) at three locations in the Hwange District and recorded daily precipitation.
3.1.3 Follow-Up Meetings
Every few months, researchers organized meetings in the rural area to exchange experiences and challenges of the sampling, to ensure continuity and maintain the motivation and quality of the effort (Meetings are listed in the Supplementary Material). Scientists reported and explained the chemical results of laboratory analysis of previous water sample shipments and related them to potential health impacts. Community monitors handed their water samples to the scientists for subsequent shipment and analysis in the laboratory in Switzerland. Scientists took photographs of the sampling notes in the personal notebook of each community monitor. Difficulties with regard to the sampling protocol were discussed and additional training exercises implemented. At each meeting, community monitors decided together with the scientist about the sampling day and frequency. After some meetings, the group decided to name group leaders for each sampling team in order to ease communication between scientists and community members. In between the physical meetings, scientists and community monitors kept continuous exchange via phone calls and text messages. Community monitors received 1 to 2 USD phone credit per month to their mobile phone in order to facilitate communication.
3.2 Trained Scientists Environmental Quality Monitoring
Two trained scientists collected another 354 water samples, mainly quadruplicates with different sample treatments, covering additional 28 sampling locations. They occasionally took samples to compare their results to the ones from the community monitors. However, they mainly focused their sampling campaigns on spots that were not covered by the community-monitoring scheme. This consisted in AMD point sources, minor tributaries to the Deka River and other pollution hot spots in the mining area. Further the researchers took upstream samples that were too distant from the villages of the community monitors. At sampling locations, they measured in situ parameters (pH, water temperature (°C), conductivity (μS cm−1), dissolved oxygen (mg L−1) and redox potential) using a handheld WTW Multiprobe 340i. They took 15 ml water samples in polyethylene falcon tubes and used four different sample treatments per sampling location: 1) unfiltered, unacidified, 2) filtered, unacidified, 3) unfiltered, acidified and 4) filtered, acidified. The filtered samples were immediately filtered using a pre-rinsed syringe and a 0.45-μm Millipore membrane filter mounted on the syringe. For acidification, they added a few drops of ultrapure nitric acid (69%) to the sample. Scientists also sampled AMD-related colorful yellow-white precipitates that coated the rocks.
3.2.1 Automated Multiparameter Sondes
With the support of the community monitors, scientists installed three YSI EXO2 Multiparameter Sondes in September 2019. The installation aimed at complementing the community monitoring with additional parameters. The sondes recorded water quality parameters chlorophyll a (Chl a), conductivity, temperature, fluorescent dissolved organic matter (fDOM), turbidity, pH and dissolved oxygen (DO). Before the probes were installed, the sensors were calibrated using water-saturated air for the DO sensor and pH buffer solutions (pH 4.01 and pH 7 Merck Supelco ®) for the pH sensor respectively. Readings were cross-checked with those of the handheld WTW Multiprobe 340i. One probe (named ZIM 1) was installed in Deka River downstream of the inlet of Sikabala (Figure 1). Two of the devices were placed in Sikabala effluent stream, one before (ZIM3) and one after (ZIM2) receiving the main share of the mine waste water. ZIM2 was fixed to a small bridge around 2 km before Sikabala reached the Deka River. Unfortunately, there was no opportunity to install a probe upstream. The battery-powered probes recorded water quality parameters every 30 min and where recalibrated and redeployed after 2 months of continuous measurement. We dispatched the three probes on September 21/22, 2019. On January 18, 2020 a flood event ripped off ZIM1 and ZIM3 from their anchor at concrete bridge pillars. After this loss, we removed probe ZIM2 in February 2020. The data series for all three sondes covers the period between the installation on 21/22 September to the last calibration on November 8, 2019. Only ZIM2 recorded the period between November 08, 2019 to February 13, 2020 (Data presented in the Supplementary Material).
3.3 Laboratory Analysis in Switzerland
The samples were shipped to Switzerland for chemical analysis and filtered with 0.45-μm nylon membrane filters. We diluted the samples in ratios between 1:10 and 1:1,000 with 1% HNO3 in distilled de-ionized (DDI) water depending on the metal concentration. For the chemical analysis, we used the Inductively Coupled Plasma Mass Spectrometer (ICP-MS) facilities at ETH Zurich and Eawag: Agilent models 7,500, 8,900 and 7,900. In the majority of the measurement series, we determined the concentration of 29 elements: Li, Be, B, Na, Mg, Al, Si, K, Ca, V, Cr, Mn, Fe, Co, Ni, Cu, Zn, As, Se, Rb, Sr, Mo, Cd, Cs, Ba, Tl, Pb, Bi and U using multielement standards (ICP-MS Multielement Standard Solution ROTI®STAR by Carl Roth, Art No 6802.1 and Multielement-Standard 21 Elemente by Bernd Kraft; Art No. 32195.0000). To estimate the limit of detection (LOD) and limit of quantification (LOQ) we measured a set of 12 blank samples (1% v/v HNO3 69% in DDI water). Merck X Multi element standard was used as reference standard for digestions of water samples and NIST 1643 f reference standard was used as a quality check for ICP-MS measurements. To evaluate total metal concentration, we additionally digested 231 samples using 2 ml of sample and adding 3 ml of HNO3 69% and 1 ml of H2O2. The samples were transferred into MLS-Ultraclave for microwave digestion under a pressure of 160 bar and a temperature of 200°C. For a series of 144 samples, we measured the concentration of anions such as sulphate, fluoride and chloride using Ion Chromatography (Metrohm 930 Compact IC Flex, AuA Laboratory, Eawag Dübendorf, Switzerland).
3.4 Data Treatment
We used R for data analysis (R Core Team, 2018) and plotted figures using ggplot 2 (Wickham et al., 2019). R scripts and primary data are publicly available under https://www.research-collection.ethz.ch/handle/20.500.11850/516619. The treated data used in this publication can be accessed in the Supplementary Material. The sampling points of the Deka River upstream run dry during later dry season between July and October 2019 and we excluded stagnant water data because Deka upstream was not feeding Deka downstream anymore. For our analysis, we use the rain fall recordings of the Agritex (Ministry of Agriculture) in Hwange Town to define the duration of the rainy season: November 1, 2018 to April 11, 2019 and November 12, 2019 to April 16, 2020 (Data is included in Supplementary Material).
4 Results
4.1 Water Quality of Deka River
Our water quality data shows dramatic increases in the concentrations of many elements in the Deka River as it crosses the point of mining discharge (Figure 2). Conductivity averaged 465 μS cm−1 upstream and jumped to a mean of 1,140 μS cm−1 at the first sampling location downstream. Upstream pH was 6.98 compared to average readings via pH meter of 5.56 downstream. The pH measurements of community monitors using test strips showed a similar pattern, but appeared to be biased toward more acidic values, with a minimum of pH 5 upstream during flooding and 4.5 during late rainy season at the first community monitoring sampling station downstream (Figure 2A). The pH values downstream of the effluent canal were regularly well-below fresh water guidelines of the national environmental management agency (Zimbabwe Government Gazette, 2007) and the WHO drinking water regulations (WHO, 2017) of pH 6 and 6.5 respectively. The change of water quality in the Deka River could occasionally be observed with the bare eye since its water color changed from its usual state of blue brown to a milky blue green color (see pictures provided in the Supplementary Material).
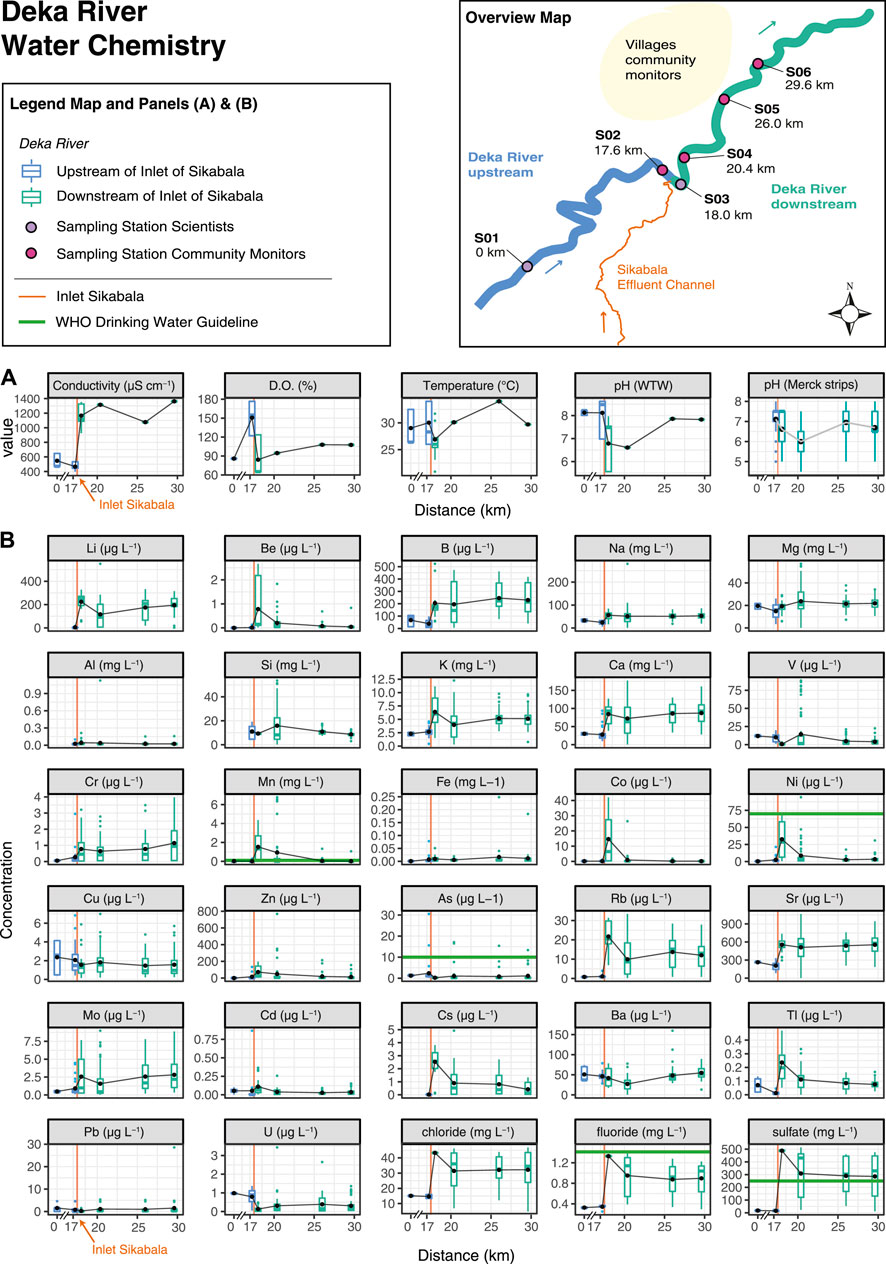
FIGURE 2. Overview map shows sampling locations in Deka River upstream (blue) and downstream (green) with respect to inlet of Sikabala effluent channel (orange). (A) Boxplots of field parameters of Deka River. (B) Boxplots of dissolved metal concentrations from 298 unacidified samples (out of which 276 grab samples) taken between December 14, 2018 and March 31, 2020 in Deka River. WHO water quality thresholds (WHO, 2017) are shown as horizontal green lines if exceeded. Black dots represent average values and black lines indicate trend between them. X-axis is discontinued between 0 and 17 km tick, namely between the two Deka River upstream sampling stations. Orange vertical line indicates position of Sikabala inlet.
Many metals and main anions show a similar behavior, jumping in concentration after passing the effluent canal Sikabala (Figure 2B). Most trace elements, however, remain below water quality thresholds with concentrations in μg L−1 range. Manganese (Mn), nickel (Ni) and arsenic (As) are notable exceptions. We detected downstream concentrations of Mn of up to 6.8 mg L−1 and many additional measurements in excess of the EMA guidelines of 0.1 mg L−1. Ni values reached up to 95 μg L−1 downstream and were sporadically above the recommended WHO drinking water values (70 μg L−1) but below national EMA river water standards (300 μg L−1). Overall, most elemental concentrations are continuously decreasing in flow direction with distance from the inlet of the effluent channel.
As values did not follow the pattern of other elements and do not appear to be related to the effluent canal, but are notably high throughout the surveyed area, especially during the peak of the rainy season in February and March. We observed the highest As value in the Deka upstream of the mine discharge, reaching up to 31 μg L−1 in March 2019 while downstream values remained below 17 μg L−1. These values did not exceed EMA fresh water standards (50 μg L−1) however, they were above WHO drinking water guidelines (10 μg L−1). The geogenic background level of fluoride reaches high levels of 2.2 mg L−1 in drinking water boreholes of the Hwange District (see data in Supplementary Material). Sulfate concentrations, a key indicator of acid mine drainage related sulphide-weathering (Dold, 2014), exceed national and international water guidelines downstream in the Deka River around 2-fold.
Community monitors reported fish kills on several occasions, among which January 05, 2019, September 25, 2019 and October 13, 2020. Dissolved aluminum (Al) concentrations in the Deka downstream reached up to 2 mg L−1, total concentrations even up to 5.3 mg L−1. Al is known for its toxicity to fish in acid to circumneutral water conditions. The phenomenon has been studied intensively during the fresh water acidification and decline in fish populations in Scandinavia (Poléo et al., 1997). At acidic pH values, Al has an effect on the ion regulation in the gills whereas at neutral to alkaline pH condition it has physical effects resulting in asphyxiation once coating happens at respiratory membranes with Al hydroxides (Exley et al., 1991; Gensemer and Playle, 1999; Rodriguez et al., 2019).
4.2 Main Effluent Channel Sikabala and Source Attribution of Tributaries
The industrial effluents in Hwange form a complex network of channels which is partly embedded into a constructed wetland. Sikabala is the main channel that discharges effluent into Deka, and it drains various potential sources from different coal mining and processing activities. We monitored metal concentrations in different sections of the Sikabala channel to estimate the relative contribution of the tributaries on pollutant loads (Figure 3, pictures of different Sikabala sections provided in the Supplementary Material). In Section A, Sikabala is mainly carrying cooling water from the thermal power plant. Afterwards tributaries add discharge from concessions of three different coal mining companies which are labeled as Section B, C and D respectively. A selection of elements for the dry and rainy season illustrates the seasonal effects on water chemistry (Figure 3).
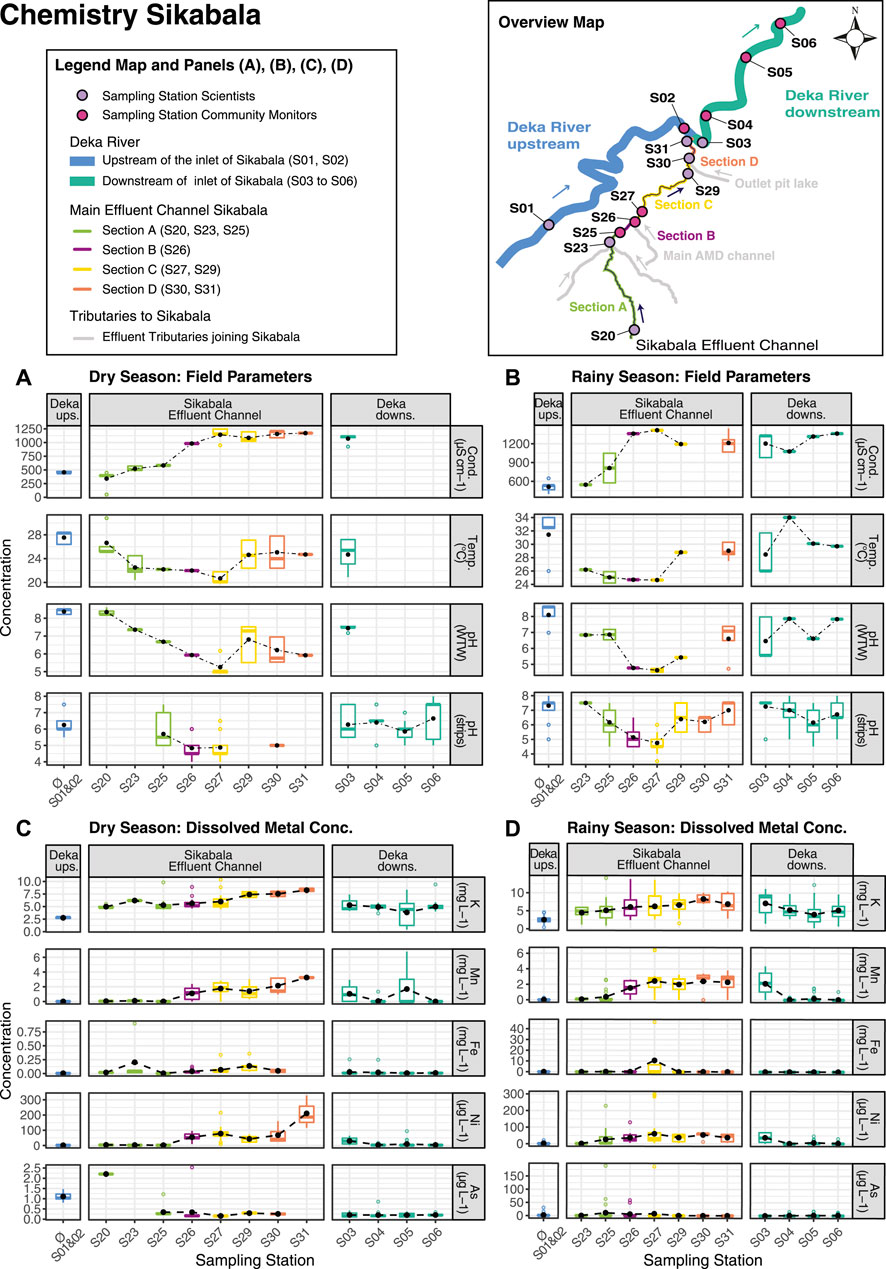
FIGURE 3. (A,B) Boxplots of field parameters in the dry and rainy season, respectively. (C,D) Boxplots of dissolved metal concentrations for the dry and rainy season, respectively. Water sampled between December 2018 and March 2020: 379 grab samples from community monitors, 173 triplicates from scientists (filt./acid.; unfilt./unacid.; filt./unacid.). Black dots represent average values and dashed lines show trend between them. In each panel, the first and last facet show data in Deka River up- and downstream of the inlet of effluent channel Sikabala, respectively. The middle facet shows data of sampling stations within Sikabala. Color code relates to the different sections in Sikabala. Concentrations of Deka River upstream are depicted for comparison by averaging the data measured at sampling points S01 and S02 (Ø S01 & 02). Scale of Y-axis varies between dry (A,C) and rainy season (B,D).
At the source of Sikabala where the thermal power plant released cooling water (S20), we observed low transition metal concentrations, with Ni 5.1 μg L−1, iron (Fe) 14 μg L−1 and Mn 41 μg L−1. Other elements are comparably low with calcium (Ca) 34 mg L−1, magnesium (Mg) 5.9 mg L−1 and sulfate 99 mg L−1. The pH values are in the lower alkaline range (average pH 8.41) and conductivity was comparably low with an average of 410 μS cm−1. After some flow distance in NE direction, Sikabala enters a constructed wetland and is joined by partly treated sewage from Hwange Town and partly attenuated waste water from industrial processes such as the coal preparation plant. As the other sampling stations of Section A, notably S23 and S25, illustrate, this has a minor impact on the dissolved metal concentration in Sikabala. The pattern changes at sampling station S26, when specific metal concentrations shoot up, most notably Mn and Ni. The sampling station S26 is located after the most important AMD tributary, the outlet from a constructed wetland of the largest mining company in the area, joined Sikabala. This channel has high metal concentrations reaching up to Mn 11.6 mg L−1, Fe 1.7 mg L−1 Ni 539 μg L−1, sulfate 1.4 g L−1 and showing pH values as low as 3.28 and conductivity as high as 2,630 μS cm−1. Pollutant concentrations in Sikabala remain at high levels and tend to increase in flow direction. In the rainy season, we observed a slight attenuation linked to a dilution effect downstream of this AMD tributary. Section C receives non-point discharges from a second mining operator with open pits close to Sikabala. Here, rainwater washed out coal fines from waste heaps during the wet season. Within the 500 m flow direction that separate S27 and S29, a third mining operator episodically discharges effluent. This operator was on halt at the beginning of the community-based monitoring and resumed operations in September 2019. The discharge of that mine episodically doubled the concentration of specific metals such as Mn, Ni, zinc (Zn). The Sikabala collected all mining effluents in Section D, where the runoff estimated via a mobile-phone app in mid-September 2019 (late dry season) was around 650 L s−1 (Information about mobile-phone app in Supplementary Material).
4.3 Sources of Metal Pollutants
At AMD point sources, electrical conductivity reaches close to 4,000 μS cm−1 with pH values as low as 2.54. Dissolved metal concentrations at the sources are up to 13 mg L−1 for Mn and 160 mg L−1 for Fe (S12) and episodically exceed EMA Red Effluent standard (Zimbabwe Government Gazette, 2007) by factors of 30 (Mn: 0.5 mg L−1) and 20 (Fe: 8 mg L−1), respectively. Because of low pH at AMD sources, total concentrations of Fe and Mn are close to dissolved ones, which also holds for aluminum concentrations of up to 60 mg/L. The Fe data illustrate the attenuation effect of the artificial wetlands, where cations are removed from the water by adsorption, co-precipitation or sedimentation. The concentration of total Fe was as high as 160 mg L−1 at specific point sources and after passing the reeds, they dropped by almost two orders of magnitude to 1.7 mg L−1. The neutral cooling water from the upper Sikabala diluted the Fe load by another order of magnitude to 0.12 mg L−1. High concentrations of ferric iron are usually hydrolyzed and precipitated at pH > 2, as different ochreous minerals such as jarosite (pH 2), schwertmannite (pH 2.5–4), or ferrihydrite (pH 5) form (Sánchez España, 2008). Precipitates have the characteristic yellow-red coloring at point sources of AMD also known as “yellow-boy” (Lottermoser, 2010). Whitish precipitates coated the rocks of the streambed of Sikabala at sampling station S27 (see pictures in the Supplementary Material). Those efflorescences consist of Al-(oxy)hydroxides (data in Supplementary Material) that precipitate at pH > 5 and that were observed in other AMD environments after Al- rich acid waters reach more neutral pH levels through dilution or neutralization (Nordstrom, 2011). The precipitation of nanocrystalline Al-phases as white coatings on the bedload has also been observed in undisturbed alpine environments where acidic metal-rich mountainous streams are neutralized after mixing with neutral tributaries (Wanner et al., 2018). Secondary Al-phases would therefore explain the milky white color that the Sikabala sporadically takes after the acidic AMD effluent channel mixes in (see pictures in Supplementary Material). In contrast, iron precipitates within the wetland and along Sikabala, with new secondary minerals precipitating each time at the confluence with a more neutral effluent. This results in rather low iron concentrations in the Deka River downstream of Sikabala. Copper (Cu) concentrations decreased by about five times after passing the constructed wetland and lead (Pb), molybdenum (Mo), caesium (Cs) and Ni were reduced by a factor of 2. Mn, however, remained almost as high as at the source. We observed no major dilution effect at point sources during the rainy season. Mn concentrations at the point sources of AMD were only about a 10th of iron concentration, but after reaching the Deka River, Mn exceeded the Fe concentrations about 1000-fold. Pit lakes, where mine water accumulates in mined-out pits, show similar values, but with even more extreme maxima. One deep red colored pit lake (S44) showed pH values as low as 2.65, conductivity of 4,180 μS cm−1 and dissolved concentrations reached 3 g L−1 sulfate, 250, 200 and 30 mg L−1 Fe, Al, and Mn, respectively, while Zn, Ni and Cu were at 40, 6, and 3 mg L−1, respectively.
As described above, the source of mine water is much more concentrated than Sikabala. Pollutants such as Fe, can strongly be attenuated via the wetlands or the dilution with less polluted waste water streams. Without the mitigation effect of the wetland for instance, concentrations in Sikabala could possibly be an order of magnitude or more higher. In the Hwange area, hundreds of thousands of cubic meters of highly concentrated mine water reside in pit lakes that are potential sources for future river pollution.
4.4 In-situ Sensors Combined With Community-Based Monitoring Data
The YSI EXO2 Multiparameter Sondes recorded data every 30 min and provided a clear picture of the dynamic range of water quality parameters and the dramatic effects of illegal mine water pumping.
During the first days after the deployment, ZIM1 (Deka River downstream of inlet of Sikabala) and ZIM2 (Sikabala) show a perfectly parallel behavior for pH and conductivity (Figure 4). In the morning of September 25, 2019, ZIM2 measured an abrupt drop from pH 7.39 to 4.0, lasting only about 1 hour before recovering to pH values above 7. Simultaneously, conductivity values shot up to over 5,000 μS cm−1 (Figure 4). The probe located in the Deka River (ZIM1) also recorded a drop in pH but the values took several days to recover. These changes were not recorded by the sonde located upstream in Sikabala (ZIM3). For the same date, community monitors and government officials reported that the recently reopened coal mine had illegally pumped old pit water for several hours into Sikabala resulting in a fish kill in the Deka River. Several thousand cubic meters of contaminated pit water reached the Sikabala just a few meters downstream of the probe ZIM 2. The inflowing pit water created a backflow and ZIM2 recorded the change in water quality. A few days later on 30 September 2019, the environmental management of the concession owner attempted to stabilize pH by with adding bags of lime to the Sikabala stream. This neutralization attempt was recorded by the pH signal at ZIM2 shooting up from 7.47 to 9.17 and ZIM1 at Deka River climbing up to pH 8.06.
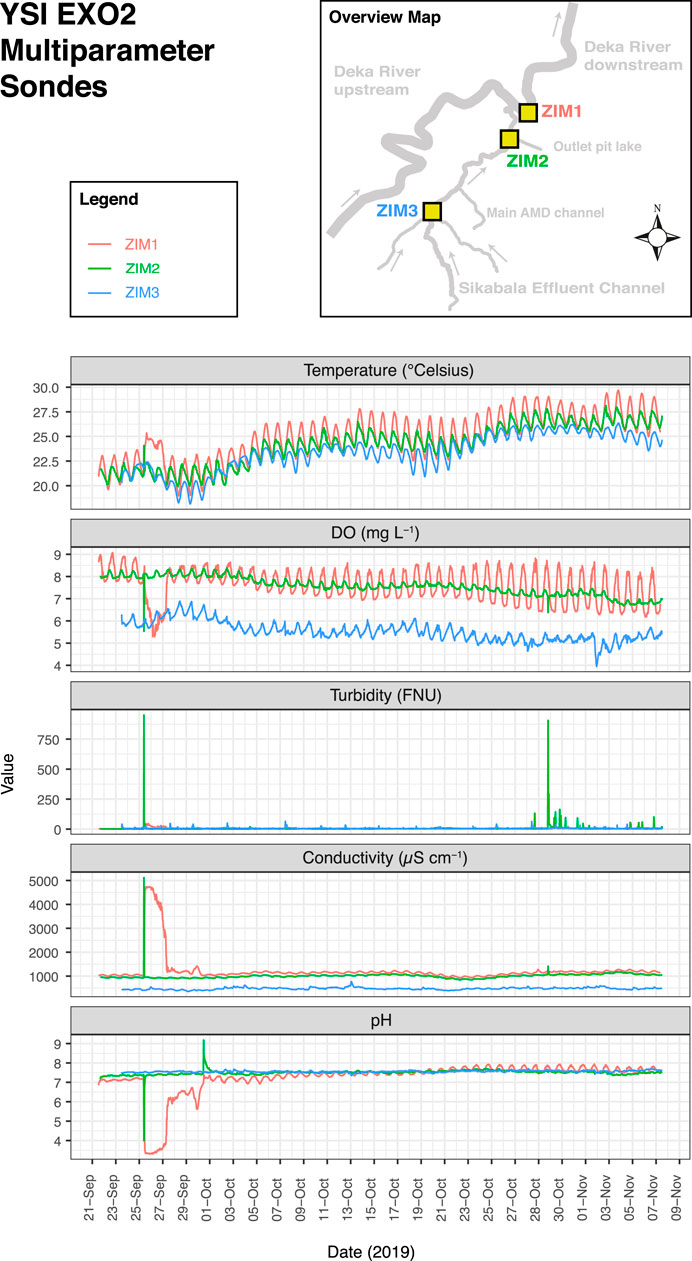
FIGURE 4. Temperature, dissolved oxygen (DO), turbidity, conductivity and pH measured by the YSI EXO2 Multiparameter Sondes (ZIM1, ZIM2, and ZIM3) from September 23 to November 8, 2019. Overview map shows probe locations: ZIM1 monitored the Deka River downstream of the Sikabala inlet. ZIM3 was located in Sikabala upstream of the main inflow of mine water and ZIM2 downstream of it.
5 Discussion
5.1 Geochemistry
Analyzing the water quality of the Deka River before and after the inlet of the main effluent channel Sikabala proves that the Deka River’s water quality is satisfactory upstream of the inlet of Sikabala and clearly deteriorates afterwards. Generally, the more mine water enters the Sikabala, the higher the pollutant concentrations. The water chemistry data allowed to trace the parameters from the actual sources of metal pollution, to the channels and ultimately to the Deka River. We followed a variety of specific metals and field parameters such as pH and conductivity from the mining concessions all the way to the river evidencing cause and effect. The water chemistry of Sikabala and of the confluence with the Deka River reveals the presence of a broad range of metals that are characteristic of acid mine drainage of coal seams. Here, bivalent cations such as Mn2+, Fe2+, Ni2+ are main indicators and can be followed along flow direction documenting that mine drainage contaminates the Deka River and violates drinking water regulations during the dry and wet season. Our data provides strong evidence that the pollutant concentrations in Deka River attenuate with increasing distance from Sikabala, which supports the assertion of the community members that Sikabala is the main source of pollution.
5.1.1 Manganese and Arsenic as Public Health Risks
Specifically, Mn exceeds national and international water standards by almost two orders of magnitudes. Manganese causes major challenges in the treatment of acid mine waters: In contrast to Fe2+ (Singer & Stumm, 1970; Wehrli, 1990), the oxidation of dissolved Mn2+ proceeds extremely slowly at low pH (Diem and Stumm, 1984; Morgan, 2005). The kilometers-long transport of Mn from AMD sources over Sikabala to the Deka River is illustrative to the difficulty of removing it from mine waters and its persistence as a metal pollutant. Precipitating manganese requires either high pH values (Morgan, 2005) or the presence of strongly sorbing mineral particles or active bacteria (Davies and Morgan, 1989; Friedl et al., 1997).
As mentioned previously, the Deka River is also used as source of drinking water for community members that do not have access to functioning boreholes. Although manganese is an essential nutrient that is relevant for bone formation and for amino acid, cholesterol and carbo-hydrate metabolism, excess Mn can have adverse effects on the central nervous system with lesions and symptoms similar to those of Parkinson’s disease (Russell et al., 2001). In the Deka River downstream of Sikabala, concentrations of Mn episodically reached close to 7 mg L−1. These elevated concentrations of Mn represent a public health risk for communities who regularly drink this water.
Unlike many of the other compounds of interest, arsenic showed roughly equal and elevated concentrations throughout the local waterscape. Values are highest before the mine water mixes and they largely exceed concentrations measured at AMD point sources. The peaks in As concentrations in the upstream Deka and in the Sikabala River coincide with periods of abundant rainfall and flooding (see rainfall data in Supplementary Material). Therefore, atmospheric deposition is more likely to be the process driving the concentration of the metalloid in the Deka River. Geogenically, the occurrence of arsenic is mainly linked to the abundance of pyrite in the coal and adjacent lithologies (Yudovich and Ketris, 2005). Our results indicate that arsenic might enter the environment through the combustion of coal at the thermal power plant. Analyses of wet deposition would be required to test this hypothesis. The share of arsenic released to the atmosphere at thermal power plants depends on the combustion regimes and efficiency of pollution control systems and might reach up to 50% of the total arsenic present in the coal (Yudovich and Ketris, 2005). Hwange Power Station was designed to utilize low-grade high-sulfur coal which was discarded as waste prior to the thermal power plant’s commissioning in 1983 (Palloks, 1987). According to a local professional, a lack of investment and maintenance caused a failure of the pollution control systems of the Hwange Power Station. Therefore, large pollutant loads were emitted to the atmosphere potentially causing human health risks for chronic As exposure.
5.1.2 Effectiveness of Environmental Management
In contrast to manganese, iron is effectively removed from the Sikabala before reaching the Deka River. The results of the Fe chemistry show the importance of the constructed wetland system for attenuating the total metal load before reaching the Deka River. These removal processes can be observed comparing the concentration of metals at AMD point sources with respect to values after the wetland. Iron oxyhydroxides such as goethite are important secondary minerals formed in AMD environments and important sink for various other elements: Nickel does not form discrete secondary nickel hydroxide or oxide phases but the bulk of Ni2+ is co-precipitated along with goethite (Alpers, et al., 1994). Surface adsorption of Ni2+ on the other hand, is most effective at pH > 5 (Senthil Kumar et al., 2010). At the time of our field study, the wetland had a reduced removal capacity compared to the initial state. Constructed wetlands need maintenance and among other factors, weed invasion, loss of plants and bank erosion should be monitored and managed (Beharrell, 2004), which was not the case. To the contrary, around a third of the wetland area had dried up because a coal mining company constructed a road through the wetland. The remaining wetland is fragmented and its patches sum up to an area of around 1.3 km2 on the northern side of the main road (Figure 1). At known AMD point sources, we observed that the mining company in charge regularly performs liming by throwing bags of lime into the effluent without estimating the necessary buffer capacity.
The artificial wetlands successfully remove the major part of the Fe load and other metals that coprecipitate with iron hydroxides, but the neutralization capacity is not sufficient and effluents downstream of the wetlands were not attenuated. When acute mine water spills happened, concession owners proceeded to liming without dosing system.
5.2 The Important Contribution of Local Knowledge in Co-production
The weekly to biweekly sampling over 1.5 years in a dozen locations was only possible in a team effort between community monitors and scientists. With 420 water samples, the community monitors collected most of the water samples covering the entire hydrological year. Together with the samples from the scientists, this effort resulted in a rich dataset on water quality of the Deka River and its seasonal dynamics. This outcome would not have been possible in a classic international scientific project with short sampling campaigns. Community monitors were able to react to observed changes in their environment and sample spontaneously. During their numerous field visits, they took notes about environmental conditions and contextualized the changing water quality in the Deka River with their valuable long-term experience. This allowed scientists to interpret peak events in the water chemistry. This local point of view was especially valuable for interpreting the continuous data of the YSI EXO2 probes in the river. These devices allow to recording water quality parameters remotely. However, in a complex system where biogeochemical processes overlap with human activity such as illicit mine water pumping, every field observation is valuable to interpret automatic recordings.
5.3 Challenges and Limits of the Community-Based Monitoring
5.3.1 Data Quality
Citizen science literature suggests that knowledge and data collection experience figure among decisive success factors of projects (San Llorente Capdevila et al., 2020). Community members in rural mining communities mainly have a low education level and poor scientific literacy related to elevated poverty rates (Castañeda et al., 2016). This suggests the need of an in-depth training that is adapted to the competences of the citizens. Our experiences support not only the need of such in-depth training, but specifically a tight follow-up on the sampling protocol to identify potential errors. Although most community monitors had a similar level of basic formal education, for some of them it was easier to follow the sampling protocol than for others. Once for instance, the scientists delivered another type of pH strips with an alternative color-coding. This led to confusion among some of the community monitors and resulted in incorrect pH measurements. During the following project meeting, scientists discussed sampling challenges with the community monitors and identified these mistakes. This allowed excluding the invalid data. Therefore, physical encounters and face-to-face discussions were key to judge the personal capacities of each community monitor and eased the interpretation of the community monitors’ notebook observations. Overall, pH strips are valuable indicators but have a limited accuracy. In the field, scientists compared pH measurements from test strips with the digital multimeter and detected that users of pH strips (both, scientists and community monitors) tend to underestimate pH in the circumneutral range by around 1 pH unit. pH strips are interpreted more accurately in the acidic range of pH 3 to 4.5 (Data comparison provided in the Supplementary Material).
5.3.2 Communication Equipment
In many rural areas of Sub-Saharan Africa, poor service provision from lacking mobile phone network coverage (GSMA, 2021) to inexistent electricity grids (Arderne et al., 2020) are prevailing. Only 20% or less of the population of Sub-Saharan Africa have access to modern smartphone- or other information technologies (Poushter, 2016). In our citizen science project, these boundary conditions shaped communication and observations protocols limiting the response capacity of the community-based monitoring during acute pollution events. At specific occasions when community members observed peak pollution events like fish kills, only few community monitors spontaneously went sampling but they failed to alert others. This missing coordination was related to a lack of mobile phone equipment, phone credit and insufficient network coverage. Some community members did not have a phone at the beginning of the project and only two members had smartphones and access to internet messaging. We decided to work only with the resources available to the local community instead of providing additional electronic equipment. Since communication via internet was limited, a direct contact person in Hwange or at least in Zimbabwe had the important role to keep regular phone contact with community monitors to stay informed.
5.3.3 Lack of Local Laboratory Infrastructure and Role of Scientific Partner
Like in most developing countries, local universities in Zimbabwe often lack analytical equipment for trace element analysis and commercial laboratories delivered poor quality results at a comparatively high cost (Data comparison provided in the Supplementary Material). Shipping samples abroad for analysis, as performed during this project, is logistically challenging and costly. In addition, it was not possible to find a strong partner, in civil society or else, with enough interest, scientific literacy and financial resources to continue to manage the monitoring project. In the multi-stakeholder meetings, no participant questioned the quality of the community-based monitoring data and the impartiality and fairness of its interpretation. We assume that the close support and lead of the community monitoring by a case-independent scientific unit fulfilled the role of a “honest broker” (Pielke, 2007) and was key for the acceptance of the monitoring results in such a politicized context.
5.3.4 Short- and Long-Term Outcomes
The data generated in the community-based monitoring was presented by researchers and community monitors in a multi-stakeholder meeting in April 2019 and in the following, new insights from the monitoring have regularly been exchanged with various stakeholders from local government and mining industry. Most outspoken community monitors formed a pressure group and used the chemical data to advocate for their grievances, which reactivated the mediation process. About a year after the onset of the community-based monitoring, one company had finally sunk three boreholes in the villages affected by the pollution and another company had commissioned a feasibility study. These measures at least partly responded to the main grievances of the community monitors. The requests of drilling additional boreholes and the long-term objective of improving mine management remain open.
Even though the monitoring project was able to fulfill its key objectives of identifying the sources of pollution and evaluate health risks, the long-term improvement of the pollution situation in Hwange would need a commitment that exceeds the time-frame of a research funding scheme. In Hwange, some highly motivated community monitors wanted to continue sampling after the official closure of the project but we could not provide the analytical infrastructure any longer, which illustrates the limitations of short-term research projects.
6 Conclusion
Based on the data of the community-based monitoring, we showed that coal mining and combustion are degrading the water quality of the Deka River. The main effluent channel Sikabala that joins Deka River carries along a variety of metals that relate to those found in very high concentrations at the point sources of acid mine drainage (AMD). These AMD sources are mining legacies from former underground mines. Our findings show that AMD formation is mainly responsible for critical loads of Mn2+ and other bivalent transition metals in the river downstream of the inlet of the main effluent channel Sikabala. The constructed wetlands remove the major part of the iron load and other metals that coprecipitate with Fe, but the neutralization capacity is not sufficient. Active open pit mines located along Sikabala add to the pollution concentration of this main effluent tributary by punctually discharging additional mine water. These sources emit effluent after the wetlands and subsequently metal concentrations are poorly attenuated. Pollutants are most probably also entering the river system via the atmosphere, as punctually high arsenic concentrations during rain events suggest. A potential source of these emissions is the thermal power plant.
Since the Deka River also provides drinking water, mainly manganese and to a lesser degree nickel and arsenic are of concern for a human health perspective. These elements regularly exceed drinking water standards, with manganese being the most drastic case, surpassing standards around 70- fold. We suggest commissioning a public health study in the Hwange District to determine potential health effects related to high manganese exposure. We also recorded illegal pumping of pit water that deliberately violate environmental emission standards and reflect worst mining practice. Therefore, the strongly acidic pit lakes in the Hwange area present a high-risk factor for Deka’s ecosystem health if mine managements continue to neglect environmental issues. Our results suggest that the practice of coal mining and power generation in Hwange need improvement on each level, from dealing with AMD mine legacies over mining practice for active open pit mines to limiting toxic atmospheric emissions.
The community-based monitoring in Hwange proved that citizen science works in a low-resource setting, including taking water samples in a technically correct manner, measuring quality parameters, and reporting field observations. It also showed that a science-society collaboration is a promising approach to establish an extended dataset in a remote area over a longer period. A tight follow-up on the sampling protocol via personal encounters and an in-depth training of community monitors with low formal education were crucial to ensure satisfactory data quality and the success of the project. Regular meetings are not only key to re-iterate training, identify low quality or biased data and adapt sampling protocols, but also to deepen trust relationships and keep motivation levels high. We conclude that community-based monitoring can be a valuable scientific scheme that allows collecting and interpreting data in challenging contexts where governmental institutions and industrial player are not fulfilling their role of monitoring environmental quality, enforcing environmental law and protecting the environment.
Data Availability Statement
The raw data from the chemical analysis and all field measurements supporting the conclusions of this article are available under the following link: https://www.research-collection.ethz.ch/handle/20.500.11850/516619.
Author Contributions
DR designed the project under supervision of BW, DR directed and implemented all stages of the project in Zimbabwe and in Switzerland and wrote the manuscript. OC performed additional field sampling and assisted the community monitoring in Hwange. MM was involved in planning and implementing the field work in Zimbabwe. NP performed ICP-MS analysis at the Eawag Dübendorf. BW aided in interpreting the results and editing the manuscript. All authors discussed the results and commented on the manuscript.
Funding
This work was supported by an ETH Zürich ISTP Research Incubator Grant. It was implemented in a collaboration between the School of Earth and Mineral Sciences, University of Zimbabwe and the ISTP, ETH Zürich. The research permit was granted by the Research Council of Zimbabwe.
Conflict of Interest
The authors declare that the research was conducted in the absence of any commercial or financial relationships that could be construed as a potential conflict of interest.
Publisher’s Note
All claims expressed in this article are solely those of the authors and do not necessarily represent those of their affiliated organizations, or those of the publisher, the editors, and the reviewers. Any product that may be evaluated in this article, or claim that may be made by its manufacturer, is not guaranteed or endorsed by the publisher.
Acknowledgments
The authors most importantly thank the 13 courageous and kind community members from the villages Mashala Top, Mashala Down, Shashachunda and Zwabo that have collaborated so intensely during 1.5 years. We send special gratitude to Pottar Muzamba from the NGO Basilwizi to introduce us to the community members and support the study during its implementation. The authors thank the employees of the Hwange Office of the Environmental Management Agency for their support and exchange of ideas, most notably Ntando Mayisa for introducing us to the relevant field sites. Further all other representatives of industrial stakeholders, civil society and government institutions in Hwange are acknowledged for sharing their insights and their experience. We thank Ancette Moyo from the Agricultural Service Agritex in Hwange Town for providing precipitation recordings. We thank Samuel Kusangaya from the Department of Geography and Environmental Science, University of Zimbabwe for sharing data. The colleagues from the Department of Geology and Kudzai Musiwa from the Department of Mining Engineering, University of Zimbabwe, are thanked for the numerous fruitful exchanges. Michelle Ammann assisted in the laboratory and Christian Dinkel installed the YSI EXO2 probes in the field. Maxence Carrel from Photrack AG supported the use of the Discharge phone app. We acknowledge the discussions with Prof. Helmut Segner from University of Bern about the chemical results and fish toxicology. Björn Studer and Kurt Barmettler from IBP, ETH Zürich, performed analytical measurements with ICP-MS and ICP-OES respectively. Dr. Christoph Wanner from University of Bern provided ICP-OES measurements of the efflorescences. We further acknowledge Dr. Scott Winton for his helpful comments on the manuscript and Marco Wirthlin for his support of R analysis. We are also thankful to Prof. Dr. Gerhard Furrer for his support throughout the project.
Supplementary Material
The Supplementary Material for this article can be found online at: https://www.frontiersin.org/articles/10.3389/fenvs.2021.754540/full#supplementary-material
References
Alpers, C., Blowes, D. W., Nordstrom, D. K., and Jambor, J. L. (1994). “Secondary Minerals and Acid Mine-Water Chemistry,” in The Environmental Geochemistry of Sulfide Mine- Wastes: Short Course Handbook. Editors D. W. Blowes, and J. L. Lambor (Waterloo, Ontario: Mineralogical Association of Canada), 247–270.
Arderne, C., Zorn, C., Nicolas, C., and Koks, E. E. (2020). Predictive Mapping of the Global Power System Using Open Data. Sci. Data 7 (1), 1–12. doi:10.1038/s41597-019-0347-4
Beharrell, M. (2004). Operation and Maintenance for Constructed Wetlands. Wetlands Ecosyst. Asia 1 (04), 347–359. doi:10.1016/b978-044451691-6/50022-3
Buytaert, W., Zulkafli, Z., Grainger, S., Acosta, L., Alemie, T. C., Bastiaensen, J., et al. (2014). Citizen Science in Hydrology and Water Resources: Opportunities for Knowledge Generation, Ecosystem Service Management, and Sustainable Development. Front. Earth Sci. 2 (October), 1–21. doi:10.3389/feart.2014.00026
Calvo, G., Mudd, G., Valero, A., and Valero, A. (2016). Decreasing Ore Grades in Global Metallic Mining: A Theoretical Issue or a Global Reality. Resources 5, 36–14. doi:10.3390/resources5040036
CanNorth, (2015). Athabasca Working Group. Environmental Monitoring Program. Saskatchewan, Canada: Canada North Environmental Services.
CanNorth, (2016). Eastern Athabasca Regional Monitoring Program 2015 Technical Report. Saskatoon, Canada: Canada North Environmental Services.
CAO (2008). Participatory Water Monitoring. A Guide for Preventing and Managing Conflict. Advisory Note. Washington D.C.: Office of the Compliance Advisor/Ombudsman (CAO). International Finance Corporation IFC & Multilateral Investment Guarantee Agency.
Carr, A. J. L. (2004). Policy Reviews and Essays. Soc. Nat. Resour. 17 (9), 841–849. doi:10.1080/08941920490493846
Castañeda, A., Doan, D., Newhouse, D., Cong, M., Hiroki, N., João, U., et al. (2016). Who are the Poor in the Developing World? Poverty and Shared Prosperity Report 2016: Taking on Inequality, Policy Research Working Paper. Washington, DC: World Bank Group.
Chamaillé-Jammes, S., Fritz, H., and Murindagomo, F. (2007). Detecting Climate Changes of Concern in Highly Variable Environments: Quantile Regressions Reveal that Droughts Worsen in Hwange National Park, Zimbabwe. J. Arid Environments 71 (3), 321–326. doi:10.1016/j.jaridenv.2007.05.005
Commodore, A., Wilson, S., Muhammad, O., Svendsen, E., and Pearce, J. (2017). Community-based Participatory Research for the Study of Air Pollution: a Review of Motivations, Approaches, and Outcomes. Environ. Monit. Assess. 189 (8), 378. doi:10.1007/s10661-017-6063-7
Conrad, C. (2007). “Community-based Monitoring and the Science of Water Quality,” in Water Quality and Sediment Behaviour of the Future: Predictions for the 21st Century (Proceedings of Symposium HS2005 at IUGG2007, Perugia, July 2007) (Perugia: IAHS Press), 217–228.
Davies, S. H. R., and Morgan, J. J. (1989). Manganese(II) Oxidation Kinetics on Metal Oxide Surfaces. J. Colloid Interf. Sci. 129 (1), 63–77. doi:10.1016/0021-9797(89)90416-5
Dervieux, Z., and Belgherbi, M. (2020).““We Used to Go Asking for the Rains”: Local Interpretations of Environmental Changes and Implications for Natural Resource Management in Hwange District, Zimbabwe,” in Changing Climate, Changing Worlds (Springer), 35–54. doi:10.1007/978-3-030-37312-2_3
Diem, D., and Stumm, W. (1984). Is Dissolved Mn2+ Being Oxidized by O2 in Absence of Mn-Bacteria or Surface Catalysts. Geochimica et Cosmochimica Acta 48 (7), 1571–1573. doi:10.1016/0016-7037(84)90413-7
Dold, B. (2014). Evolution of Acid Mine Drainage Formation in Sulphidic Mine Tailings. Minerals 4 (3), 621–641. doi:10.3390/min4030621
Erel, Y., Morgan, J. J., and Patterson, C. C. (1991). Natural Levels of lead and Cadmium in a Remote Mountain Stream. Geochimica et Cosmochimica Acta 55 (3), 707–719. doi:10.1016/0016-7037(91)90335-3
Exley, C., Chappell, J. S., and Birchall, J. D. (1991). A Mechanism for Acute Aluminium Toxicity in Fish. J. Theor. Biol. 151 (3), 417–428. doi:10.1016/S0022-5193(05)80389-3
Friedl, G., Wehrli, B., and Manceau, A. (1997). Solid Phases in the Cycling of Manganese in Eutrophic Lakes: New Insights from EXAFS Spectroscopy. Geochimica et Cosmochimica Acta 61 (2), 275–290. doi:10.1016/S0016-7037(96)00316-X
Gensemer, R. W., and Playle, R. C. (1999). The Bioavailability and Toxicity of Aluminum in Aquatic Environments. Crit. Rev. Environ. Sci. Techn. 29 (4), 315–450. doi:10.1080/10643389991259245
Gore, M., Abiodun, B. J., and Kucharski, F. (2020). Understanding the Influence of ENSO Patterns on Drought over Southern Africa Using SPEEDY. Clim. Dyn. 54 (1), 307–327. doi:10.1007/s00382-019-05002-w
GSMA (2021). Network Coverage Maps. Available from https://www.gsma.com/coverage/(Retrieved January 25, 2021).
Hijmans, R., Rojas, E., Cruz, M., O’Brien, R., and Barrantes, I. (2018). DIVA-GIS. Available from country level data website: http://www.diva-gis.org/Data (Retrieved October 10, 2020).
ICMM (2015). A Practical Guide to Catchment-Based Water Management for the Mining and Metals Industry. London, UK: International Council on Mining and Metals (ICMM).
Jain, R. K., Cui, Z. C., and Domen, J. K. (2016). “Environmental Impacts of Mining,” in Environmental Impact of Mining and Mineral Processing. Management, Monitoring and Auditing Strategies. Editors R. K. Jain, Z. C. Cui, and J. K. Domen, 53–157. doi:10.1016/B978-0-12-804040-9.00004-8
Jamieson, H. E. (2011). Geochemistry and Mineralogy of Solid Mine Waste: Essential Knowledge for Predicting Environmental Impact. Elements 7 (6), 381–386. doi:10.2113/gselements.7.6.381
J. M. Azcue (Editor) (1999). Environmental Impacts of Mining Activities: Emphasis on Mitigation and Remedial Measures. doi:10.1007/978-3-642-59891-3
Johnson, D. B., and Hallberg, K. B. (2005). Acid Mine Drainage Remediation Options: A Review. Sci. Total Environ. 338 (1-2 SPEC. ISS.), 3–14. doi:10.1016/j.scitotenv.2004.09.002
Jones, H., and Boger, D. V. (2012). Sustainability and Waste Management in the Resource Industries. Ind. Eng. Chem. Res. 51, 10057–10065. doi:10.1021/ie202963z
Lottermoser, B. (2010). Mine Wastes. Characterization, Treatment and Environmental Impacts. 3rd Edn. Berlin, Heidelberg: Springer-Verlag. doi:10.1007/978-3-642-12419-8
Luckeneder, S., Giljum, S., Schaffartzik, A., Maus, V., and Tost, M. (2021). Surge in Global Metal Mining Threatens Vulnerable Ecosystems. Glob. Environ. Change 69, 102303. doi:10.1016/j.gloenvcha.2021.102303
Maine Volunteer Lake Monitoring Program VLMP (2013). The Water Column. A Publication of the Maine Volunteer Lake Monitoring Program. Available from https://www.mainevlmp.org/wp-content/uploads/2013/04/VLMPNewsletterFall2013forWeb.pdf#page=10 (Retrieved July 1, 2021).
McKinley, D. C., Miller-Rushing, A. J., Ballard, H. L., Bonney, R., Brown, H., Cook-Patton, S. C., et al. (2017). Citizen Science Can Improve Conservation Science, Natural Resource Management, and Environmental protection. Biol. Conservation 208, 15–28. doi:10.1016/j.biocon.2016.05.015
Morgan, J. J. (2005). Kinetics of Reaction between O2 and Mn(II) Species in Aqueous Solutions. Geochimica et Cosmochimica Acta 69 (1), 35–48. doi:10.1016/j.gca.2004.06.013
Moyo, M., Mvumi, B. M., Kunzekweguta, M., Mazvimavi, K., and Craufurd, P. (2012). Farmer Perceptions on Climate Change and Variability in Semi-arid Zimbabwe in Relation to Climatology Evidence. Afr. Crop Sci. J. - A J. Trop. Crop Sci. Prod. 20 (2), 317–335.
Mudd, G. M. (2007). Global Trends in Gold Mining: Towards Quantifying Environmental and Resource Sustainability. Resour. Pol. 32, 42–56. doi:10.1016/j.resourpol.2007.05.002
Natural Resource Governance Institute (2017). Resource Governance Index 2017. Available from https://resourcegovernanceindex.org/data (Retrieved October 1, 2020).
Nhiwatiwa, T. (2015). in Report on Water Quality of the Deka River and Other Rivers Receiving Mine Effluent, Hwange, Zimbabwe: Environmental Impacts of Coal Mining. Editor S. House (Harare, Zimbabwe, Zimbabwe: University of Zimbabwe).
Nordstrom, D. K. (2011). Mine Waters: Acidic to Circmneutral. Elements 7 (6), 393–398. doi:10.2113/gselements.7.6.393
Nowotny, H., Scott, P. B., and Gibbons, M. T. (2013). Re-thinking Science: Knowledge and the Public in an Age of Uncertainty. John Wiley & Sons.
Open Street Map (2021). Open Database License. Available from made available under the Open Database License website: http://opendatacommons.org/licenses/odbl/1.0/(Retrieved February 22, 2021).
Palloks, H. H. (1987). Records of Zimbabwe Coalfields V: The Wankie Concenssion Area. Harare, Zimbabwe: Zimbabwe Geological Survey.
Pielke, R. A. (2007). Making Sense of Science in Policy and Politics, The Honest Broker: Making Sense of Science in Policy and Politics. Cambridge: Cambridge University Press. doi:10.1017/CBO9780511818110.009
Poléo, A. B. S., Østbye, K., Øxnevad, S. A., Andersen, R. A., Heibo, E., and Vøllestad, L. A. (1997). Toxicity of Acid Aluminium-Rich Water to Seven Freshwater Fish Species: A Comparative Laboratory Study. Environ. Pollut. 96 (2), 129–139. doi:10.1016/S0269-7491(97)00033-X
Poushter, J. (2016). Smartphone Ownership and Internet Usage Continues to Climb in Emerging Economies. Retrieved Available from Pew Research Center website: http://www.pewglobal.org/2016/02/22/smartphone-ownership-and-internet-usage-continues-to-climb-in-emerging-economies/.
R Core Team (2018). R: A Language and Environment for Statistical Computing. Vienna: R Foundation for Statistical Computing.
Reichl, C., Schatz, M., and Zsak, G. (2020). World Mining Data 2020. Federal Ministry of Agriculture, Regions and Tourism. Austria, Vienna.
Rodriguez, P. H., Arbildua, J. J., Villavicencio, G., Urrestarazu, P., Opazo, M., Cardwell, A. S., et al. (2019). Determination of Bioavailable Aluminum in Natural Waters in the Presence of Suspended Solids. Environ. Toxicol. Chem. 38 (8), 1668–1681. doi:10.1002/etc.4448
Russell, R., Beard, J. L., Cousins, R. J., Dunn, J. T., Ferland, G., Hambidge, K. M., et al. (2001). Dietary Reference Intakes for Vitamin A, Vitamin K, Arsenic, boron, Chromium, Copper, Iodine, Iron, Manganese, Molybdenum, Nickel, Silicon, Vanadium, and Zinc: A Report of the Panel on Micronutrients, Subcommittees on Upper Reference Levels of Nutrients a. Retrieved Available from National Academy Press website: http://www.nap.edu/catalog/10026.html.
Sánchez España, J. (2008). Acid Mine Drainage in the Iberian Pyrite Belt : An Overview with Special Emphasis on Generation Mechanisms, Aqueous Composition and Associated Mineral Phases. Rev. la Soc. Española Mineral. 10, 34–43.
San Llorente Capdevila, A., Kokimova, A., Sinha Ray, S., Avellán, T., Kim, J., and Kirschke, S. (2020). Success Factors for Citizen Science Projects in Water Quality Monitoring. Sci. Total Environ. 728, 137843. doi:10.1016/j.scitotenv.2020.137843
Senthil Kumar, P., Ramakrishnan, K., and Gayathri, R. (2010). Removal of Nickel(II) from Aqueous Solutions by Ceralite Ir 120 Cationic Exchange Resins. J. Eng. Sci. Technol. 5 (2), 234–245.
Sheoran, A. S., and Sheoran, V. (2006). Heavy Metal Removal Mechanism of Acid Mine Drainage in Wetlands: a Critical Review. Minerals Eng. 19 (2), 105–116. doi:10.1016/j.mineng.2005.08.006
Singer, P. C., and Stumm, W. (1970). Acidic Mine Drainage: The Rate-Determining Step. Science 167 (3921), 1121–1123. doi:10.1126/science.167.3921.1121
Stepenuck, K. F., and Genskow, K. D. (2019). Traits of Volunteer Water Monitoring Programs that Influence Natural Resource Management and Policy Impacts. Soc. Nat. Resour. 32 (3), 275–291. doi:10.1080/08941920.2018.1511022
The Zimbabwean (2011). Stop coal miners or see Hwange die. Retrieved Available from https://www.thezimbabwean.co/2011/07/stop-coal-miners-or-see/.
UN-Water (2020). Monitoring Water and Sanitation in the 2030 Agenda for Sustainable Development Integrated Monitoring Initiative for SDG 6. Retrieved Available from United Nations Water website: https://www.unwater.org/publications/monitoring-water-and-sanitation-in-the-2030-agenda-for-sustainable-development/.
UNEP-WCMC and IUCN (2021). Protected Planet: The World Database on Protected Areas (WDPA)/OECM Database: WDPA_WDOECM_Jun2021_Public_ZWE. Available from www.protectedplanet.net (Retrieved March 10, 2021).
Walker, D. W., Smigaj, M., and Tani, M. (2021). The Benefits and Negative Impacts of Citizen Science Applications to Water as Experienced by Participants and Communities. WIREs Water 8 (1), 1–32. doi:10.1002/wat2.1488
Wanner, C., Pöthig, R., Carrero, S., Fernandez-Martinez, A., Jäger, C., and Furrer, G. (2018). Natural Occurrence of Nanocrystalline Al-Hydroxysulfates: Insights on Formation, Al Solubility Control and as Retention. Geochimica et Cosmochimica Acta 238, 252–269. doi:10.1016/j.gca.2018.06.031
Wehrli, B. (1990). “Redox Reations of Metal Ions at Mineral Surfaces,” in Aquatic Chemical Kinetics: Reaction Rates of Processes in Natural Waters. Editor W. Stumm, 35, 1865. doi:10.4319/lo.1990.35.8.1865
WHO (2017). Guidelines for Drinking-Water Quality: Fourth Edition Incorporating the First Addendum. Geneva, Switzerland: World Health Organisation.
Wickham, H., Chang, W., Henry, L., Pedersen, T. L., Takahashi, K., Wilke, C., et al. (2019). ggplot2: Elegant Graphics for Data Analysis. Available from https://ggplot2.tidyverse.org (Retrieved October 15, 2020).
Wisconsin Department of Natural Resources (2018). Citizen-based Monitoring. Available from https://dnr.wi.gov/volunteer/CitizenBasedMonitoring.html (Retrieved May 21, 2018).
Yalala, B. (2017). Report on the Water Quality of the Deka River - Environmental Impact Assessment of Coal Mining. Bulawayo, Zimbabwe: Applied Chemistry Department, NUST.
Yudovich, Y. E., and Ketris, M. P. (2005). Arsenic in Coal: A Review. Int. J. Coal Geology. 61 (3–4), 141–196. doi:10.1016/j.coal.2004.09.003
Keywords: coal mining, citizen science (CS), metal pollution, acid mine drainage (AMD), mineral resources, environmental governance, water quality, community-based monitoring
Citation: Ruppen D, Chituri OA, Meck ML, Pfenninger N and Wehrli B (2021) Community-Based Monitoring Detects Sources and Risks of Mining-Related Water Pollution in Zimbabwe. Front. Environ. Sci. 9:754540. doi: 10.3389/fenvs.2021.754540
Received: 06 August 2021; Accepted: 17 November 2021;
Published: 16 December 2021.
Edited by:
Teresa Ferreira, University of Lisbon, PortugalReviewed by:
Richard Greenfield, University of Johannesburg, South AfricaAna Filipa Filipe, University of Lisbon, Portugal
Copyright © 2021 Ruppen, Chituri, Meck, Pfenninger and Wehrli. This is an open-access article distributed under the terms of the Creative Commons Attribution License (CC BY). The use, distribution or reproduction in other forums is permitted, provided the original author(s) and the copyright owner(s) are credited and that the original publication in this journal is cited, in accordance with accepted academic practice. No use, distribution or reproduction is permitted which does not comply with these terms.
*Correspondence: Désirée Ruppen, ZGVzaXJlZS5ydXBwZW5AaXN0cC5ldGh6LmNo