- 1Institute of Agricultural Economics and Development, Chinses Academy of Agricultural Sciences, Beijing, China
- 2State Key Laboratory of Urban and Regional Ecology, Research Center for Eco-Environmental Sciences, China Academy of Sciences, Beijing, China
Climate change endangers food security worldwide, especially in developing countries. Livestock husbandry is one of the essential livelihoods for farmers and herders in remote arid and semiarid regions. However, it remains unclear how climate change will impact livestock husbandry in the future. This study collected sheep and goat distributions from the “gridded livestock of the world” (GLW) dataset for 1943 counties in Mainland China. Current climate data include precipitation and temperature from the National Meteorological Information Center (NMIC). We disentangled the effects of precipitation and temperature on current distributions of sheep and goats with the Bayesian Hierarchical Model by Integrated Nest Laplace Approximation (INLA). Further, we forecasted the potential sheep and goat distributions in 2030 and 2050 under Coupled Model Intercomparison Project (CMIP) scenarios. Our result showed that sheep distribution is significantly correlated with elevation, slope, market density, and highway distance, with absolute correlation coefficients ranging from 0.019 to 0.411. In addition to elevation, slope, and market density, goat distribution is also affected by gain production, with a correlation coefficient of 0.055. There is a dynamic correlation of temperature and precipitation with sheep and goat density. The sheep density distribution is predicted to increase in Northwest China, while the goat density distribution might increase in farming areas under climate change. Finally, this study suggests for the sheep and goat breeding industry to respond to climate change.
1 Introduction
Climate change threatens human society in the 21st century, especially on food security globally (Nemani, et al., 2003). China is the largest developing country in the world. Ensuring food provision safety is one of the most crucial issues the Chinese government faces (Zhang, et al., 2016). As reported, the per capita consumption of animal food, including mutton, milk, eggs, and beef, has increased by 160% in China, relative to the beginning of ‘Reform and Opening up’ (Han, et al., 2020). Climate change is another threat to China, where the warming rate is about twice the global average, and the flooding and droughts are becoming more frequent recently (Qian and Zhu, 2001). Livestock husbandry is important in food security and sustainable supply, especially under climate change. Therefore, it needs to disentangle, evaluate, and predict how climate change will affect livestock husbandry in the future.
Identifying and quantifying the climate effects on sheep and goat distributions is a hot topic in recent research. The standard Ricardian model is widely used to investigate climatic influences on agriculture (Mendelsohn, et al., 1994; Wang, et al., 2014; Gbetibouo and Hassan, 2005). Numerous studies have revealed how agricultural production responds to climate change (Thornton and Herrero, 2015), with much emphasis on decadal and interannual climate variability (Marumbwa, et al., 2019) and climate extremes (Moustakis, et al., 2021). Some studies have investigated the impacts of climate change on grassland degradation at the county scale (Gao, et al., 2010). A few studies also focused on the effects of extreme weather, such as snowstorms and droughts, on livestock production (Liu and Wang, 2012). However, it is hard to predict livestock distribution precisely under changing climate.
Several approaches, including linear regression (Leta and Mesele, 2014a), geographically weighted regression (GWR) (Velado-Alonso, et al., 2020), and Bayesian modeling (Rinella, et al., 2011), are developed for spatial simulation in agricultural studies. However, such data-driven methods cannot well address spatial correlations in agricultural systems (Homburger, et al., 2015). Failure to account for spatial uncertainty violates the assumption of independent and identically distributed data and may lead to biased model estimates (Anselin, 2001). Therefore, it is essential to explore uncertainties in spatial modeling to ensure that the final results are reliable (Rong, et al., 2017). Various uncertainties have been contributed to spatial models, input data, and analytical errors (Chen, et al., 2014; Heuvelink, et al., 2006; Nelson, et al., 2011). However, few studies highlight the uncertainty and potential drivers for sheep and goat distributions for sustainable policy-making (Illian, et al., 2013).
Bayesian statistics have been successfully used to explore the uncertainty in spatial modeling (Liang, et al., 2016; Williamson, et al., 2020). Simulation-based approaches such as Markov Chain Monte Carlo (MCMC) simulation are common to obtain the posterior distribution of model parameters (Taylor and Diggle, 2014). However, MCMC is computationally intensive and time-costing. The integrated nested Laplace approximations method (INLA) offers a simple way to compute complicated data across hierarchical scales (Huang, et al., 2017) and explore spatial correlation problems. That is because INLA can construct flexible fields by using stochastic partial differential equations (SPDE) to handle complicated-structured spatial data (Huang, et al., 2017).
This study proposes a hierarchical spatial framework fitted with SPDE and a dataset with sheep and goat distributions of 1943 counties in Mainland China. We aim to identify how climate drivers affect sheep and goat distributions along with social-economic variables. Further, we predict the possible distribution of sheep and goats in China under climate scenarios in 2035 and 2050. Our findings are expected to guide livestock husbandry development and help make climate adaptation and mitigation policies.
2 Materials and Methods
2.1 Study Area
This study covered 1943 counties in Mainland China. In 2002, per capita mutton consumption reached 1.91 kg in China, surpassing Organisation for Economic Co-operation and Development (OECD) countries (Figure 1). The mutton industry development plays a vital role in improving residents’ dietary structure, increasing farmers’ income, and ensuring livestock production and supply. In 2020, there were 0.133 billion for goats and 0.173 billion for sheep in China (Supplementary Figure S1). Sheep mainly distributes in Inner Mongolia (26.92%) and Xinjiang Uygur Autonomous Region (22.83%), while goats in Inner Mongolia (12.26%), Sichuan (10.32%), Henan (10.22%), and Yunnan (8.31%) (see more details in Supplementary Figure S2).
2.2 Data Collection
Previous research (Gowane, et al., 2017; Sejian, et al., 2017) shows that climate, especially temperature and precipitation, significantly affects sheep and goat growth, development, and breeding. Therefore, we employed precipitation and temperature as primary explanatory variables for sheep and goat distributions across Mainland China. In addition, geomorphic factors including elevation and slope (Gong, et al., 2017), market factors in terms of market access, density, and influence indices (Mu, et al., 2017), and grain production, as well as grassland area (Aby, et al., 2014), were also considered (Table 1).
The dependent variable was sheep and goat density in each county, which was derived from the “gridded livestock of the world” dataset (GLW) (Gilbert, et al., 2018). We validated the GLW data for each county with statistic records from Agricultural Bureaus at province and prefecture levels. The result shows that the GLW dataset matched well with statistic records (R-squared: 0.945, RMSE: 23.83, Supplementary Figure S3, Supplementary Table S1). Then, we calculated the mean density of sheep and goat, respectively, for each of the 1943 counties in Mainland China, for further analyses.
Climate data were collected from National Meteorological Information Center (NMIC), China Meteorological Administration (CMA). Yearly temperature and precipitation records of over 800 meteorological stations across China were downloaded. We interpolated annual precipitation and temperature into rasters with a 1 km spatial resolution using the Kriging method with ArcGIS 10.8 (see isolines in Figure 2). Finally, we extracted climate data for each county to match with other explanatory variables.
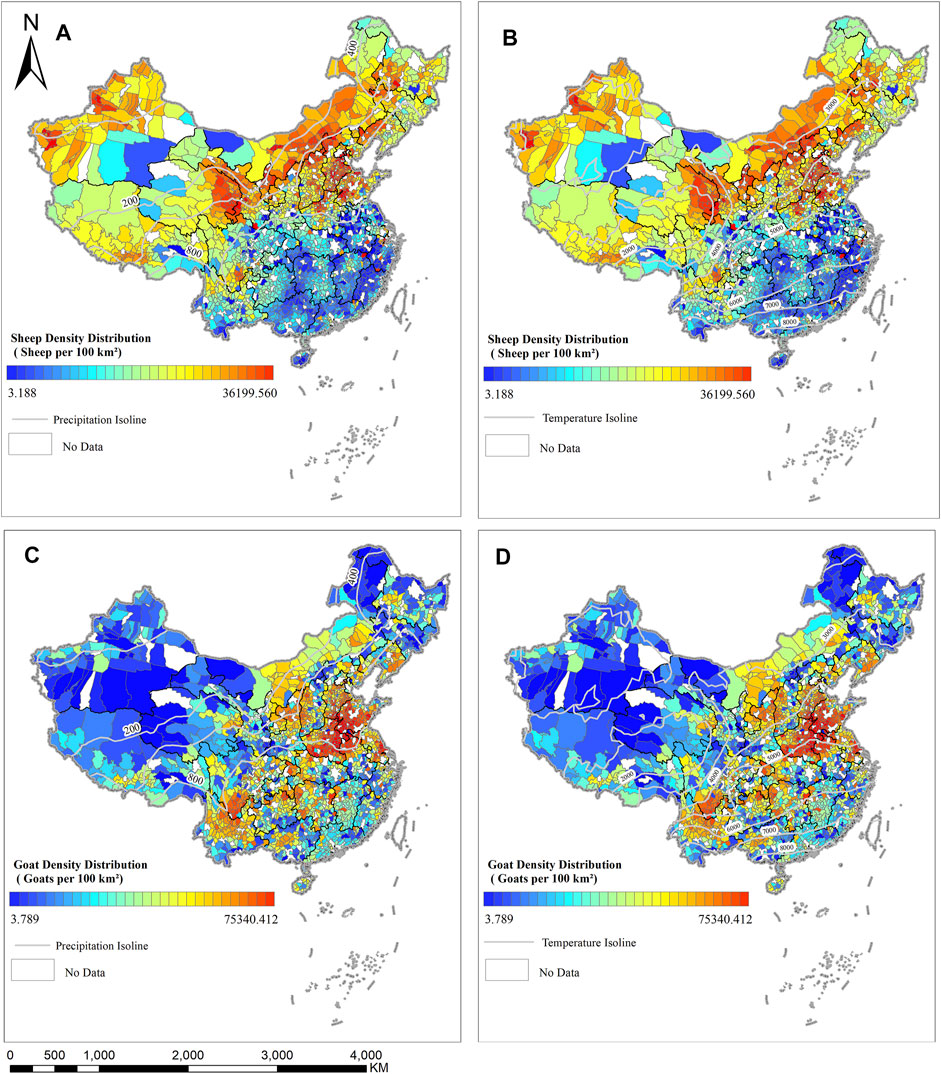
FIGURE 2. Sheep (A, B) and goat (C, D) density distributions with sum precipitation (A, C) and accumulative temperature isolines (B, D) in China.
Geomorphic factors are also seriously considered in sheep and goat distributions modeling because they can affect the combination of available water, light, and heat, and indirectly limit plant settlement, sheep growth, and breeding (Gong, et al., 2017; Sholagberu, et al., 2017). Exactly, we calculated each county’s mean elevation and slope based on digital elevation model (DEM) data from moderate resolution imaging spectroradiometer (MODIS). Land cover can also affect sheep and goat distributions (Qian, et al., 2012). So, we also calculated the grassland area for each county, according to China’s National Land Use/Cover Dataset (NLCD).
Market factors are also important in livestock distribution (Mu, et al., 2017; Ou and Mendelsohn, 2017). We used the dataset of Verburg (2011), which includes market access, market density, and market influence, to assess the market influence on sheep and goat distributions (Verburg, et al., 2011). Such data can jointly represent market strength and accessibility and are widely used to highlight market influences in recent studies (Sloat, et al., 2018). Finally, we resampled and averaged the three market indices and for each of the 1943 counties.
Further, the mean distance of highways within each county was calculated as another economic-social factor. Eco-economic policies can significantly affect sheep and goat husbandry (Hu, et al., 2019). We collected all policies related to sheep and goat husbandry proclaimed by the government at all levels. We evaluated different weights to calculate the policy index according to the effectiveness of different-level policies in different counties (Formula 1).
where
Finally, we employed the grain production for each county to assess the feed supply ability based on a previous study. Thus, we calculated the county spatial mean for all variables we collected and correlated into the county by the ArcGIS 10.8.
This study also predicted sheep and goat distributions under different climate change scenarios. The sixth phase of Coupled Model Intercomparison Project (CMIP6) was used in this study. Exactly, we employed the future scenarios, including SSP1-2.6, SSP2-4.5, and SSP5-8.5 (Supplementary Table S2). The SSP1-2.6 scenario represented the low ending range of future scenarios measured by its radiative forcing pathway. This scenario will produce a multi-model mean of significantly less than 2.0°C warming by 2,100; thus, it could support the 2.0°C temperature rise target study. The SSP2-4.5 scenario considers a medium stabilization scenario, while the SSP5-8.5 was a scenario that stabilizes radiative forcing at 8.5 Wm2 in 2,100 and is regarded as a high radiative forcing scenario.
2.3 Analyses
We employed the Bayesian hierarchical model to estimate the spatial distributions of sheep and goats, respectively, across 1943 counties in China. Parameter estimates and marginal posterior probability distributions were obtained by using the integrated nest Laplace approximation (INLA) approach. In this study, weakly informative penalized-complexity priors were generated for all regression coefficients (fixed-effect parameters) and hyperparameters. Sheep and goats distributed in nearby regions were often exposed to similar social environments and climate conditions. We used the INLA-SPDE approach to deal with spatial covariance among explanatory variables. The residual errors may reflect the influences of unmeasured or unmeasurable predictors that vary across space. The potential Bayesian hierarchical spatial framework (Morris, et al., 2019) is used to calculate sheep and goat distributions below (Formula 2).
where the response variable
The spatial effect was assessed by fitting the model with and without random effects. An information criterion based on the most significant length of the triangle edge was used to solve the trade-off. Exactly, we employed the Deviance Information Criterion (DIC) and Watanabe-Akaike Information Criterion (WAIC) to compare the performance of various candidate models (Sutanto et al., 2021). The model with the smallest value of WAIC is preferred as it achieved the most combination of fitness and parsimony.
It is common to split data into training and validation sets, especially with predictive modeling purposes applied in empirical analysis. This study employs K-fold cross-validation to determine if the model correctly estimates the observed data (Wong and Yeh, 2019). The procedure has a single parameter called k that refers to the number of groups that a given data sample is grouping. We conducted a 10-fold cross-validation experiment by randomly removing 10% of the county in 10 independent estimates, respectively (Supplementary Material S5). These accuracy criteria reflect that the prediction in this study based on the INLA approach is maintained accuracy in both sheep and goat distributions estimation. Besides, the Pearson’s correlation coefficient and concordance correlation coefficient indicate that the prediction in this study is valid. The outcomes show that the model predicts better than chance alone (Table 2).
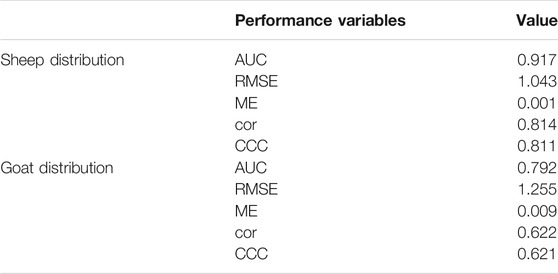
TABLE 2. Result of the statistical evaluation obtained using 10-fold cross-validation. AUC: area under curve. RMSE: root mean square error. ME: mean error. cor: Pearson’s correlation coefficient. CCC: concordance correlation coefficient.
These accuracy criteria reflect that the prediction in this study based on the INLA approach is maintained accuracy in both sheep and goat distributions estimation. Besides, the Pearson’s correlation coefficient and concordance correlation coefficient indicate that the prediction in this study is valid. Further, an Area Under Curve (AUC) > 0.5 indicates that the model predicts better than chance alone. The AUC for the validation dataset is 0.792 for goats and 0.917 for sheep.
3 Results
3.1 Fixed Effect Covariates
The mean posterior coefficient of the fixed effect covariates is presented in log-odds and signifies the estimated response to a one standard deviation change in the sheep and goat distributions when all other variables are held constant. Fixed effect coefficients and 95% credible intervals for covariates are provided in Table 3. Both sheep and goat distributions were influenced significantly by geomorphic factors. As expected, a significant association is observed between elevation and both sheep and goat distributions in China. For a one standard deviation increase in elevation, the expected change in goat density log odds is 0.291, and sheep density log odds is 0.223. Further, for a one standard deviation decrease in the average slope of each county, the expected change in goat and sheep density log odds is 0.321 and 0.411, respectively.
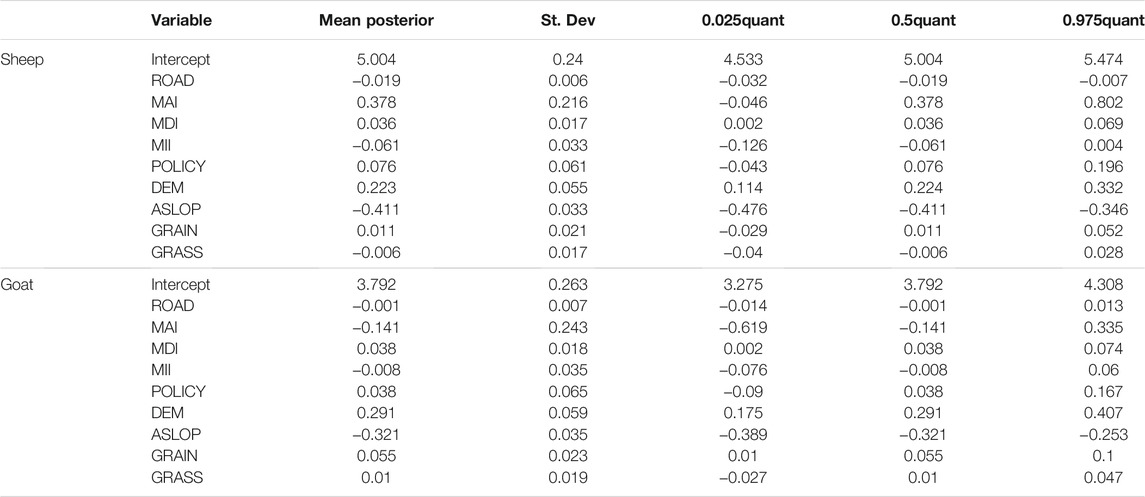
TABLE 3. Posterior estimates (mean, St. Dev., quantiles) for fixed effects in sheep and goat distributions (abbreviation same as Table 1).
Both goat and sheep density distribution were also positively affected by market density (Tables 3). An increase in one standard deviation in market density might increase 0.038 and 0.036 in log-odds for goat and sheep density, respectively. The developed social-economic condition might restrict sheep distribution by comparative industrial advantage for the county with a higher market influence index. Grain production has a significant positive connection with goat density, while for one standard deviation increase, the expected change in goat density log odds is 0.055. For sheep husbandry, sheep breeding activity might be more suitable for areas where have lower highway density. For one standard deviation decrease, the expected change in sheep density log odds is 0.019.
3.2 Random Effects and Hyperparameters
The spatial model component shows how the spatial and climate affect odds of sheep and goat density distribution. The spatial random effect indicates a significant amount of spatial variation in both sheep and goat density distribution (Figure 3). The spatial random effect indicates a significant spatial variation in the sheep and goat density across China. Higher random effect located in the North and North-west of China for the sheep density. Meanwhile, an intensive spatial effect focused on the farming area, including the North China Plain and southwest China, for goat density.
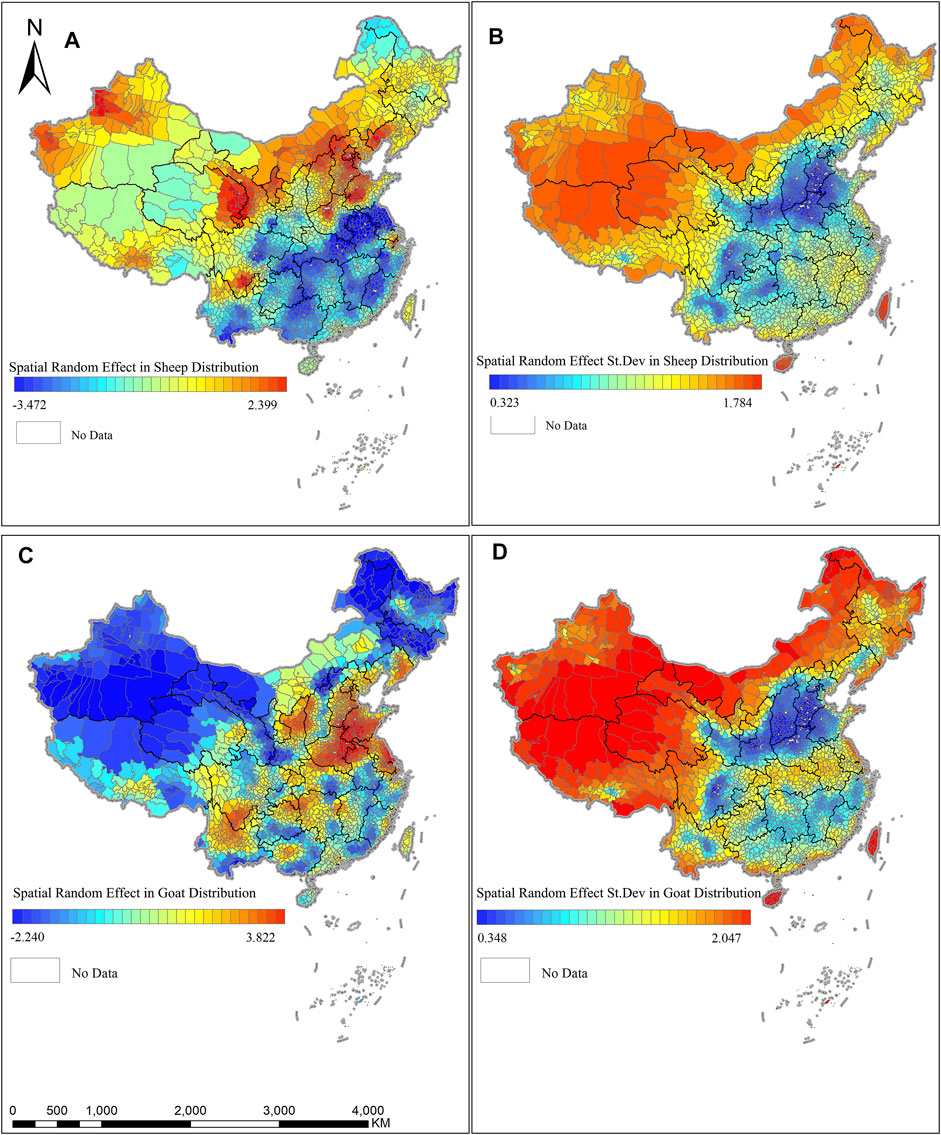
FIGURE 3. Spatial random effect (A, C) and standard deviation (B, D) of sheep (A, B) and goat (C, D) distributions.
The marginal distribution of scale parameter, variance parameter of the random field, and the practical range are shown in Table 4. The variance of the spatial effect showed a relatively wide posterior distribution, indicating that the variability in sheep and goat density to location is high. The posterior mean of the spatial correlation range was 618.69 km for sheep and 642.89 km for goats. These ranges indicate the approximate distance between counties where sheep and goat density distribution could be considered correlated. The ratio of range parameter indicates the moderation of spatial autocorrelation of sheep and goat density. Further, the uncertainties of these parameters are minor, indicated by their standard deviation and quantiles in Table 4.

TABLE 4. Posterior estimates (mean, St. Dev., quantiles) for random effects on sheep and goat distribution.
Finally, Figure 4 reflects the impact of precipitation on sheep and goat density distribution in China. The precipitation might affect sheep distribution dynamically. The summit effect concentrates on around 400 mm annual precipitations, which means that the sheep husbandry industry in China might have an optimal area correlated with precipitation. This could explain the spatial sheep distribution centralized on the North China Plain and Inner Mongolia Plateau and the other regions with proper climate environment. There is a more sensitive effect for temperature on goats distribution than sheep (Figure 4), and a higher annual cumulative temperature could be more favorable for goats relative to sheep husbandry.
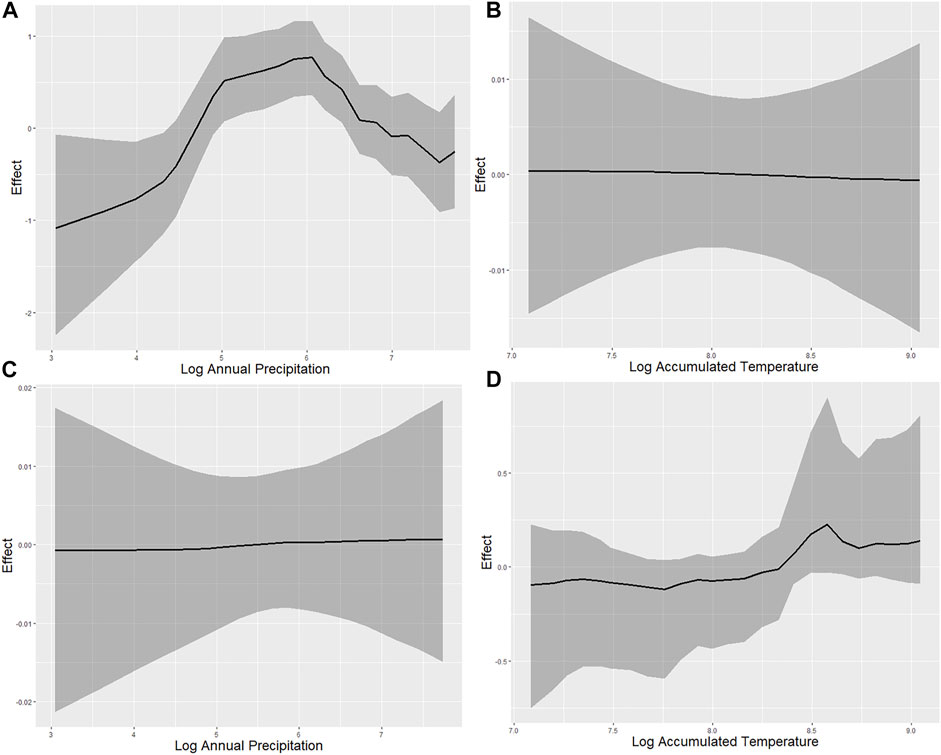
FIGURE 4. Annual precipitations effect on sheep distribution (A). Annual accumulated temperature effect on sheep distribution (B). Annual precipitations effect on goat distribution (C). Annual accumulated temperature effect on goat distribution (D). The shaded area represents the 95% credible interval. Prediction of sheep and goat density under climate change.
Figures 5, 6 presents the predicted density distribution change of sheep and goats in 2035 and 2050 in China under different climate scenarios. Figure 5 highlights the area at sheep density distribution change of climate change in various climate change scenarios. The maps show where the model predicts sheep density distribution change over the next 15 and 30 years. Climate change would intensify the sheep distribution in Northwest China, especially Xingjiang, Gansu, and Inner Mongolia (Figure 5). The sheep might be decreased based on the climate change under upon North-East of Qinghai province, and sector of Huabei areas to some extent. Compared with the altered sheep distribution, the goat might be more stable under climate change. The goat would concentrate on the North China Plain and South-West area of China. For goat husbandry (Figure 6), the increased space is located in Liaoning province, Hunan province, and Jiangsu province where local goat breeding, including Liuyang Black goat, White fuzz goat of Liaoning, and Haimen goats, is developed.
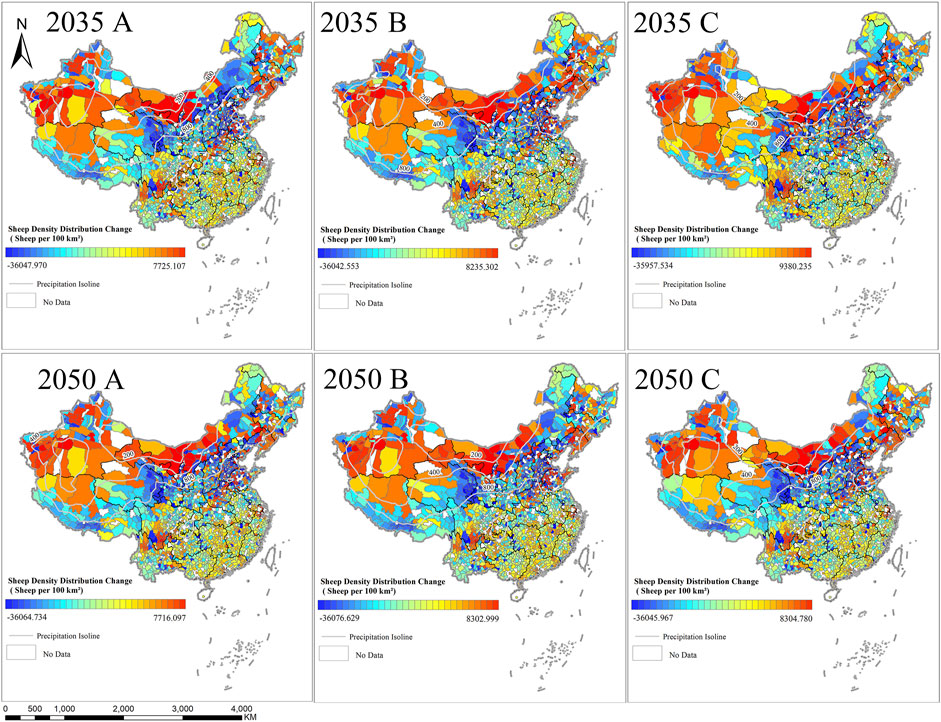
FIGURE 5. Forecast sheep density distribution change under SSP585 (A), SSP245 (B), and SSP126 (C) scenario.
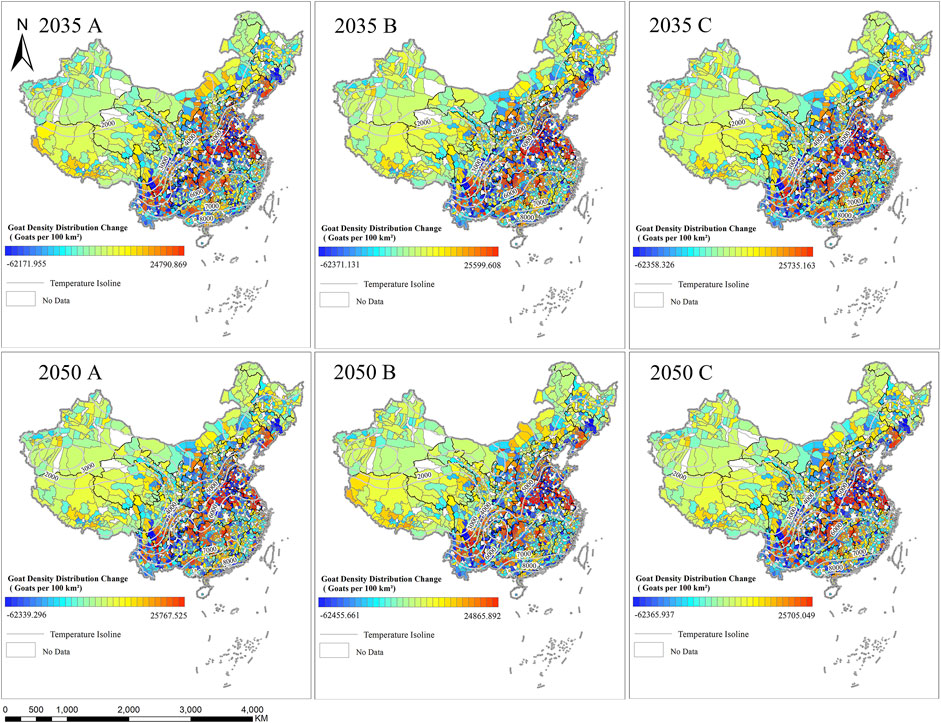
FIGURE 6. Forecast goat density distribution change under SSP585 (A), SSP245 (B), and SSP126 (C) scenario.
4 Discussion
4.1 Climate Effect on Sheep and Goat Distributions
Climate factors, including precipitation and temperature, are the key to analyzing and predicting sheep and goat density distribution, an association that has been observed in many studies to date (Anya, et al., 2013). A vast amount of literature has concentrated on examining the mutual influences between climate environment and animal husbandry behavior (Batsuuri and Wang, 2017; Duricic, et al., 2019; Petit and Boujenane, 2018; Sloat, et al., 2018). Several mechanisms operate concurrently to the advantage of sheep and goat distributions at moderate climate conditions (Stanimirova, et al., 2019).
Precipitation affects sheep husbandry dynamic; this is consistent with studies on a country level, and global scale agrees with animal experiments (Duricic, et al., 2019). A potential explanation is that grassland and feed supply are affected by precipitation (Derbile and Kasei, 2012). The specific precipitation conduct suitable moisture for sheep growth, decreasing the risk of epidemic disease (Rinaldi, et al., 2015). High humidity might increase the probability of blight and other diseases in sheep growth (Qamar, et al., 2009). The optimal annual precipitation is about 400 mm, which could hold the moisture for livestock grazing. The East of Inner Mongolia and North-East China might decrease the sheep husbandry scale upon climate change (Wang, et al., 2021).
For goat husbandry, a higher annual accumulated temperature could positively affect goat production in a particular range. The most suitable environment temperature range for goats is 5–25°C (Joyce, et al., 1966). When the environment temperature exceeds 25°C, the goat’s body temperature will rise, and their forage intake will decrease (Moustakis, et al., 2021). The high temperature will adversely affect goat growth, such as heat stress and disease risk (Godde et al., 2020; Havlik et al., 2014).
Climate is forecasted to be warmer and wetter with shifting precipitation spatiotemporally soon in China. Therefore, it becomes urgent to analyze the variation of sheep distribution response to precipitation change and formulate sustainable and adaptive policies on animal products industry regulation. Our study confirmed that such a variety of sheep and goat distributions responses to climate change is heterogeneous at the county level. Sheep distribution sensitivity varies along with precipitation values (Castillo, et al., 2021; Epps, et al., 2004). The effect of precipitation on sheep distribution is positive around precipitation of 400 mm. This might be because ecosystems in arid and semiarid areas are fragile.
Further, an excessively high rainfall scale would not help sheep grow and feed. In the spatial realm, sheep husbandry is located in the North China Plain and Inner Mongolia Plateau, within precipitation of 400 mm. The sheep husbandry might be adversely affected by climate change in the north of Qinghai and the east of Inner Mongolia, likely due to increasing precipitation trends (Figure 5). However, the areas of northwest China might benefit sheep husbandry because of the increasing trend of precipitations, where there are significant advances in soil moisture and livestock grazing. The forecasting of goats distribution alter in China is more stable compared with sheep husbandry. There is no significant change in pasture areas in China. The increased trend concentrates on the areas which maintain the breeds of advantages, including Jiangsu, Hunan, and Liaoning province. The adaptability of the goat could explain this trend. Further, goat husbandry might be developing in the south of China, which mountainous region upon grassland.
4.2 Importance of Geomorphic and Social-Economic Factors in Sheep and Goat Distributions
Classic industrial economic models posit a substantial assumption in agricultural spatial distribution with livestock distribution with traffic, social-economic, and natural conditions (Behnke, et al., 2008). As expected, a significant association is observed between traffic conditions and sheep distribution in China. A higher average highway density not only means better transportation conditions but also presents a higher population density. The sheep husbandry has to move into areas far away from the city to maintain the profit. This finding agrees with the classic agricultural location theory (Dawkins, 2003). Compared with other agricultural industries, sheep husbandry might need to be located in areas with an inexpensive cost for higher marginal profits. Grain production posts a strong positive effect on goat husbandry. A potential explanation is the feeding structure of China, which is focused on grain straw (Liu, et al., 2008). This finding might partially explain the concentrated trend of goat husbandry in the North China Plain. The household could feed the goats with straw, as the by-product of grain crops, with a lower marginal cost.
Second, our fitting model partially agrees with (Leta and Mesele, 2014b) that market influence is a critical accelerate factor for sheep husbandry. This study found that market density is the key market factor for both sheep and goat distributions in China’s mainland, which the index combines the effect of market accessibility, per-GDP, and population density. This might explain the concentration on the North China Plain in sheep and goat distributions for Shandong and Henan province in China. Because these areas were located in high population density areas, they require a large scale of sheep consumption demand.
Third, we found that geographic factors are critical for both sheep and goat husbandry in China. Geomorphic features, including slope and elevation, affect sheep and goat husbandry significantly, being consistent with (Dwyer, 2009). High elevation areas with flat terrain are more suitable for sheep and goat husbandry in China. The sheep and goat both require suitable geographic and geomorphic conditions. Further, it is noticeable that the fixed effect of slope on goats is lower than sheep, which means that sheep husbandry might be more sensitive to geomorphic change. It could be supported by recent animal science literature that compared to sheep, goat is more adaptive in mountainous and hilly regions (Raoult, et al., 2021).
4.3 Policy Implication and Limitation
Differences in climate effect on sheep and goat husbandry call for resilience-enhancing actions that are region-specific and context-specific and guided by principles of equity and fairness. Most urgent are actions and investment for counties that faced compound climate risk across livestock husbandry outcomes, requiring a transformative change to reduce the negative effect of climate change. For example, there might be a tremendous demand for fodder with the alter of sheep and goat density distribution under climate change. The government needs to balance grain security and protein supply to ensure the fodder supply and promote the livestock husbandry industry. Also, sheep distribution prediction under different climate scenarios indicates the vast increase of sheep breeding stock in the northwest of China, with many livestock pollutants to challenge the local ecological carrying capacity. We need to focus on the balance between the ecology effect and livestock pressure. Through the accurate acquisition of livestock waste information, we can adjust herd sizes, use precise grazing, and apply knowledge and lessons learned from ecological livestock breeding. Further, the possible distribution of sheep and goats demands a better mechanism for preventing and controlling animal epidemics and increasing the investment for animal epidemics monitor and warning, enhancing the technology application on animal epidemics prevention. Finally, effort should also be made to promote the breeding management ability of the livestock breeding operators, improve people’s livelihoods, and coordinate the development of regional economies.
Although we have developed a reliable model for predicting sheep and goat distributions under climate change, this study has several limitations. The GLW dataset in China still limits our predictive ability in small areas. As a result, some counties with large acreage may be underrepresented vs. counties with tiny areas in some variables. This study incorporated several environmental and social-economic covariates known to be associated with sheep and goat distributions. However, our results showed a strong spatial effect, the cause of which is undetermined in the present analysis. Future studies could add more other social and cultural determinants. The market effect is the key to livestock husbandry and grazing distribution. Therefore, we limited the model to data that could be readily available and most relevant to sheep and goat distributions.
5 Conclusion
We investigated the sheep and goat distributions in China and estimated the spatial factor in sheep and goat distributions using the Bayesian hierarchical model with the INLA approach. The findings of this study reveal that the sheep density distribution is highly correlated with elevation, slope, market density, and Highway distance, with absolute correlation coefficients ranging from 0.019 to 0.411. In addition to elevation, slope, and market density, goat distribution is also affected by gain production, with correlation coefficient of 0.055. For precipitation factors to sheep distributions, with a non-linear and dynamic effect, proper annual precipitation around 400 mm would produce a higher positive effect with sheep production. For temperature factors to goat distributions, a higher accumulated temperature means a positive impact on goat husbandry. To predict sheep distribution under climate change by CMIP6, we found the sheep density distribution might be an increase in the northwest of China, and the goat density distribution might increase in farming areas. Based on our comprehensive analysis of sheep and goat distributions in China, in light of the climate effect on sheep and goat density distribution, this study offers several policy suggestions for the sheep and goat breeding industry to respond to climate change.
Further, we forecasted the potential sheep and goat distributions in 2030 and 2050 under Coupled Model Intercomparison Project (CMIP) scenarios. Our result showed that sheep distribution is significantly correlated with elevation, slope, market density, and highway distance, with absolute correlation coefficients ranging from 0.019 to 0.411. In addition to elevation, slope, and market density, goat distribution is also affected by gain production, with correlation coefficient of 0.055. There are dynamic correlation of temperature and precipitation with sheep and goat density. The sheep density distribution is predicted to increase in Northwest China, while the goat density distribution might increase in farming areas under climate change. Finally, this study suggests for the sheep and goat breeding industry to respond to climate change.
Data Availability Statement
The original contributions presented in the study are included in the article/Supplementary Material, Further inquiries can be directed to the corresponding author.
Author Contributions
YZ and GW developed the project, gathered data, and conducted the initial round of analysis including determining variable used. SZ and CH provided editing and technical advice during the initial analysis round. YZ and YZ conducted the final analysis. All authors contributed equally to the writing of the final manuscript.
Funding
This work was supported by National Natural Science Foundation of China (41871184; 41401203), Central Public-interest Scientific Institution Basal Research Fund (Y2021ZK02), and Science and Technology Innovation Project of Chinese Academy of Agricultural Sciences: Food security and animal husbandry economy (ASTIP-IAED-2021-01).
Conflict of Interest
The authors declare that the research was conducted in the absence of any commercial or financial relationships that could be construed as a potential conflict of interest.
Publisher’s Note
All claims expressed in this article are solely those of the authors and do not necessarily represent those of their affiliated organizations, or those of the publisher, the editors, and the reviewers. Any product that may be evaluated in this article, or claim that may be made by its manufacturer, is not guaranteed or endorsed by the publisher.
Acknowledgments
The first author is grateful to Qionghua Li for answering all my questions promptly and wish you could accompany me on my academic journey.
Supplementary Material
The Supplementary Material for this article can be found online at: https://www.frontiersin.org/articles/10.3389/fenvs.2021.748734/full#supplementary-material
References
Anselin, L. (2001). Spatial Econometrics. A companion to theoretical econometrics. Blackwell Press, 310–330.
Anya, M. I., Ayuk, A. A., Umoren, E. P., and Lifu, E. O. (2013). Mobile Livestock Keeping and Climate Change Challenges in Africa. Outlook Agric. 42 (1), 53–57. doi:10.5367/oa.2013.0113
Batsuuri, T., and Wang, J. (2017). The Impacts of Climate Change on Nomadic Livestock Husbandry in Mongolia. Clim. Change Econ. 8 (3), 1740003. doi:10.1142/s2010007817400036
Behnke, R., Davidson, G., Jabbar, A., and Coughenour, M. (2008). Human and Natural Factors that Influence Livestock Distributions and Rangeland Desertification in Turkmenistan. Berlin/Heidelberg,Germany: Springer, 141–168.
Castillo, D. A., Gaitán, J. J., and Villagra, E. S. (2021). Direct and Indirect Effects of Climate and Vegetation on Sheep Production across Patagonian Rangelands (Argentina). Ecol. Indicators 124, 107417. doi:10.1016/j.ecolind.2021.107417
Chen, L., Shen, Z., Yang, X., Liao, Q., and Yu, S. L. (2014). An Interval-Deviation Approach for Hydrology and Water Quality Model Evaluation within an Uncertainty Framework. J. Hydrol. 509, 207–214. doi:10.1016/j.jhydrol.2013.11.043
Dawkins, C. J. (2003). Regional Development Theory: Conceptual Foundations, Classic Works, and Recent Developments. J. Plann. Lit. 18 (2), 131–172. doi:10.1177/0885412203254706
Derbile, E. K., and Kasei, R. A. (2012). Vulnerability of Crop Production to Heavy Precipitation in north-eastern Ghana. Int. J. Clim. Change Strateg. Manag. 4(1), 36–53. doi:10.1108/17568691211200209
Duricic, D., Benic, M., Zaja, I. Z., Valpotic, H., and Samardzija, M. (2019). The Effects of Monthly Air Temperature and Rainfall Variations on the Reproductive Performance and Lambing Distribution of the Jezersko-Solava Sheep. Int. J. Biometeorology 63 (2), 153–158.
Dwyer, C. (2009). “The Behaviour of Sheep and Goats,”. An Introductory Text in The Ethology of Domestic Animals. 2nd Edition (Wallingford, Oxfordshire, UK: CAB International), 161–176. doi:10.1079/9781845935368.0161
Epps, C. W., Mccullough, D. R., Wehausen, J. D., Bleich, V. C., and Rechel, J. (2004). Effects of Climate Change on Population Persistence of Desert-Dwelling Mountain Sheep in California. Conservation Biol. 18 (1), 102–113. doi:10.1111/j.1523-1739.2004.00023.x
Gao, Q., Wan, Y., Xu, H., Li, Y., Jiangcun, W., and Borjigidai, A. (2010). Alpine Grassland Degradation index and its Response to Recent Climate Variability in Northern Tibet, China. Quat. Int. 226 (1-2), 143–150. doi:10.1016/j.quaint.2009.10.035
Gbetibouo, G. A., and Hassan, R. M. (2005). Measuring the Economic Impact of Climate Change on Major South African Field Crops: A Ricardian Approach. Glob. Planet. Change 47 (2-4), 143–152. doi:10.1016/j.gloplacha.2004.10.009
Gilbert, M., Nicolas, G., Cinardi, G., Van Boeckel, T. P., Vanwambeke, S. O., Wint, G. R. W., et al. (2018). Global Distribution Data for Cattle, Buffaloes, Horses, Sheep, Goats, Pigs, Chickens and Ducks in 2010. Sci. Data 5, 180227. doi:10.1038/sdata.2018.227
Gong, W., Wang, H., Wang, X., Fan, W., and Stott, P. (2017). Effect of Terrain on Landscape Patterns and Ecological Effects by a Gradient-Based RS and GIS Analysis. J. For. Res. 28 (5), 1061–1072. doi:10.1007/s11676-017-0385-8
Gowane, G. R., Gadekar, Y. P., Prakash, V., Kadam, V., Chopra, A., and Prince, L. L. L. (2017). Climate Change Impact on Sheep Production: Growth, Milk, Wool, and Meat. Berlin/Heidelberg,Germany: Springer, 31–69. doi:10.1007/978-981-10-4714-5_2
Han, C., Wang, G., Zhang, Y., Song, L., and Zhu, L. (2020). Analysis of the Temporal and Spatial Evolution Characteristics and Influencing Factors of China's Herbivorous Animal Husbandry Industry. PLoS One 15 (8), e0237827. doi:10.1371/journal.pone.0237827
Heuvelink, G. B., Burrough, P. A., and Stein, A. (2006). Developments in Analysis of Spatial Uncertainty since 1989. Classics from IJGIS. CRC Press, 91–95.
Homburger, H., Lüscher, A., Scherer-Lorenzen, M., and Schneider, M. K. (2015). Patterns of Livestock Activity on Heterogeneous Subalpine Pastures Reveal Distinct Responses to Spatial Autocorrelation, Environment and Management. Mov Ecol. 3, 35. doi:10.1186/s40462-015-0053-6
Hu, Y., Huang, J., and Hou, L. (2019). Impacts of the Grassland Ecological Compensation Policy on Household Livestock Production in China: An Empirical Study in Inner Mongolia. Ecol. Econ. 161, 248–256. doi:10.1016/j.ecolecon.2019.03.014
Huang, J., Malone, B. P., Minasny, B., McBratney, A. B., and Triantafilis, J. (2017). Evaluating a Bayesian Modelling Approach (INLA-SPDE) for Environmental Mapping. Sci. Total Environ. 609, 621–632. doi:10.1016/j.scitotenv.2017.07.201
Illian, J. B., Martino, S., Sørbye, S. H., Gallego-Fernández, J. B., Zunzunegui, M., Esquivias, M. P., et al. (2013). Fitting Complex Ecological point Process Models with Integrated Nested Laplace Approximation. Methods Ecol. Evol. 4 (4), 305–315. doi:10.1111/2041-210x.12017
Joyce, J. P., Blaxter, K. L., and Park, C. (1966). The Effect of Natural Outdoor Environments on the Energy Requirements of Sheep. Res. Vet. Sci. 7, 342–359. doi:10.1016/s0034-5288(18)34687-3
Leta, S., and Mesele, F. (2014a). Spatial Analysis of Cattle and Shoat Population in Ethiopia: Growth Trend, Distribution and Market Access. SPRINGERPLUS 3, 310. doi:10.1186/2193-1801-3-310
Leta, S., and Mesele, F. (2014b). Spatial Analysis of Cattle and Shoat Population in Ethiopia: Growth Trend, Distribution and Market Access. SpringerPlus 3 (1), 310–10. doi:10.1186/2193-1801-3-310
Liang, S., Jia, H., Xu, C., Xu, T., and Melching, C. (2016). A Bayesian Approach for Evaluation of the Effect of Water Quality Model Parameter Uncertainty on TMDLs: A Case Study of Miyun Reservoir. Sci. Total Environ. 560-561, 44–54. doi:10.1016/j.scitotenv.2016.04.001
Liu, H., Jiang, G., Zhuang, H., and Wang, K. (2008). Distribution, Utilization Structure and Potential of Biomass Resources in Rural China: With Special References of Crop Residues. Renew. Sustainable Energ. Rev. 12 (5), 1402–1418. doi:10.1016/j.rser.2007.01.011
Liu, S., and Wang, T. (2012). Climate Change and Local Adaptation Strategies in the Middle Inner Mongolia, Northern China. Environ. Earth Sci. 66 (5), 1449–1458. doi:10.1007/s12665-011-1357-5
Marumbwa, F. M., Cho, M. A., and Chirwa, P. W. (2019). Analysis of Spatio-Temporal Rainfall Trends across Southern African Biomes between 1981 and 2016. Phys. Chem. Earth 114. doi:10.1016/j.pce.2019.10.004
Mendelsohn, R., Nordhaus, W. D., and Shaw, D. (1994). The Impact of Global Warming on Agriculture: A Ricardian Analysis. The American economic review 84, 753–771.
Morris, M., Wheeler-Martin, K., Simpson, D., Mooney, S. J., Gelman, A., and DiMaggio, C. (2019). Bayesian Hierarchical Spatial Models: Implementing the Besag York Mollié Model in Stan. Spat. spatio-temporal Epidemiol. 31, 100301. doi:10.1016/j.sste.2019.100301
Moustakis, Y., Papalexiou, S. M., Onof, C. J., and Paschalis, A. (2021). Seasonality, Intensity, and Duration of Rainfall Extremes Change in a Warmer Climate. Earths Future 9 (3). doi:10.1029/2020ef001824
Mu, J. E., Sleeter, B. M., Abatzoglou, J. T., and Antle, J. M. (2017). Climate Impacts on Agricultural Land Use in the USA: The Role of Socio-Economic Scenarios. Climatic Change 144 (2), 329–345. doi:10.1007/s10584-017-2033-x
Nelson, M. A., Bishop, T. F. A., Triantafilis, J., and Odeh, I. O. A. (2011). An Error Budget for Different Sources of Error in Digital Soil Mapping. Eur. J. Soil Sci. 62 (3), 417–430. doi:10.1111/j.1365-2389.2011.01365.x
Nemani, R. R., Keeling, C. D., Hashimoto, H., Jolly, W. M., Piper, S. C., Tucker, C. J., et al. (2003). Climate-driven Increases in Global Terrestrial Net Primary Production from 1982 to 1999. Science 300 (5625), 1560–1563. doi:10.1126/science.1082750
Ou, L., and Mendelsohn, R. (2017). An Analysis of Climate Adaptation by Livestock Farmers in the Asian Tropics. Clim. Change Econ. 8 (3), 1740001. doi:10.1142/s2010007817400012
Petit, D., and Boujenane, I. (2018). Importance of Determining the Climatic Domains of Sheep Breeds. Animal 12 (7), 1501–1507. doi:10.1017/s1751731117002944
Qamar, M. F., Maqbool, A., Khan, M. S., Ahmad, N., and Muneer, M. A. (2009). Epidemiology of Haemonchosis in Sheep and Goats under Different Managemental Conditions. Vet. World 2 (11), 413–417.
Qian, S., Wang, L. Y., and Gong, X. F. (2012). Climate Change and its Effects on Grassland Productivity and Carrying Capacity of Livestock in the Main Grasslands of China. Rangel. J. 34 (4), 341–347. doi:10.1071/rj11095
Qian, W., and Zhu, Y. (2001). Climate Change in China from 1880 to 1998 and its Impact on the Environmental Condition. Climatic Change 50 (4), 419–444. doi:10.1023/a:1010673212131
Raoult, C. M. C., Osthaus, B., Hildebrand, A. C. G., McElligott, A. G., and Nawroth, C. (2021). Goats Show Higher Behavioural Flexibility Than Sheep in a Spatial Detour Task. R. Soc. Open Sci. 8 (3), 201627. doi:10.1098/rsos.201627
Rinaldi, L., Catelan, D., Musella, V., Cecconi, L., Hertzberg, H., Torgerson, P. R., et al. (2015). Haemonchus contortus: Spatial Risk Distribution for Infection in Sheep in Europe. Geospat Health 9 (2), 325–331. doi:10.4081/gh.2015.355
Rinella, M. J., Vavra, M., Naylor, B. J., and Boyd, J. M. (2011). Estimating Influence of Stocking Regimes on Livestock Grazing Distributions. Ecol. Model. 222 (3), 619–625. doi:10.1016/j.ecolmodel.2010.10.004
Rong, Q., Cai, Y., Chen, B., Yue, W., Yin, X. a., and Tan, Q. (2017). An Enhanced export Coefficient Based Optimization Model for Supporting Agricultural Nonpoint Source Pollution Mitigation under Uncertainty. Sci. Total Environ. 580, 1351–1362. doi:10.1016/j.scitotenv.2016.12.099
Sejian, V., Bhatta, R., Gaughan, J., Malik, P. K., Naqvi, S., and Lal, R. (2017). Sheep Production Adapting to Climate Change. Berlin/Heidelberg,Germany: Springer.
Sholagberu, A. T., Raza, M. M., Yusof, K. W., and Mustafa, H. A. (2017). Assessing the Influence of Terrain Characteristics on Spatial Distribution of Satellite Derived Land Surface Parameters in Mountainous Areas. Proceedings of the IAHR World Congress 2017, August 2017, Kuala Lumpur, Malaysia, 37, 2897–2906.
Sloat, L. L., Gerber, J. S., Samberg, L. H., Smith, W. K., Herrero, M., Ferreira, L. G., et al. (2018). Increasing Importance of Precipitation Variability on Global Livestock Grazing Lands. Nat. Clim Change 8 (3), 214–218. doi:10.1038/s41558-018-0081-5
Stanimirova, R., Arévalo, P., Kaufmann, R. K., Maus, V., Lesiv, M., Havlík, P., et al. (2019). Sensitivity of Global Pasturelands to Climate Variation. Earth's Future 7 (12), 1353–1366. doi:10.1029/2019ef001316
Sutanto, T. S., Pramoedyo, H., and Wardhani, W. S. (2021). The Selection of Bayesian Polynomial Regression with INLA by Using DIC, WAIC and CPO. J. Phys. Conf. Ser. 1747 (1), 012029. doi:10.1088/1742-6596/1747/1/012029
Taylor, B. M., and Diggle, P. J. (2014). INLA or MCMC? A Tutorial and Comparative Evaluation for Spatial Prediction in Log-Gaussian Cox Processes. J. Stat. Comput. Simulation 84 (10), 2266–2284. doi:10.1080/00949655.2013.788653
Thornton, P. K., and Herrero, M. (2015). Adapting to Climate Change in the Mixed Crop and Livestock Farming Systems in Sub-saharan Africa. Nat. Clim Change 5 (9), 830–836. doi:10.1038/nclimate2754
Velado-Alonso, E., Morales-Castilla, I., Rebollo, S., and Gomez-Sal, A. (2020). Relationships between the Distribution of Wildlife and Livestock Diversity. Divers. Distributions 26 (10), 1264–1275.
Verburg, P. H., Ellis, E. C., and Letourneau, A. (2011). A Global Assessment of Market Accessibility and Market Influence for Global Environmental Change Studies. Environ. Res. Lett. 6 (3). doi:10.1088/1748-9326/6/3/034019
Wang, J., Huang, J., Zhang, L., and Li, Y. (2014). Impacts of Climate Change on Net Crop Revenue in North and South China. China Agric. Econ. Rev. doi:10.1108/caer-12-2012-0138
Wang, X., Gao, R., and Yang, X. (2021). Responses of Soil Moisture to Climate Variability and Livestock Grazing in a Semiarid Eurasian Steppe. Sci. Total Environ., 781, 146705.doi:10.1016/j.scitotenv.2021.146705
Williamson, M. A., Fleishman, E., Mac Nally, R. C., Chambers, J. C., Bradley, B. A., Dobkin, D. S., et al. (2020). Fire, Livestock Grazing, Topography, and Precipitation Affect Occurrence and Prevalence of Cheatgrass (Bromus Tectorum) in the central Great Basin, USA. Biol. Invasions 22 (2), 663–680. doi:10.1007/s10530-019-02120-8
Wong, T., and Yeh, P. (2019). Reliable Accuracy Estimates from K-fold Cross Validation. Ieee Trans. Knowledge Data Eng. 32 (8), 1586–1594.doi:10.1109/TKDE.2019.2912815
Keywords: integrated nest laplace approximation (INLA), bayesian hierarchical model, rainfall, CMIP 6, market factors
Citation: Zhang Y, Wang G, Zhang Y, Zhao S and Han C (2021) Climate Change is Likely to Alter Sheep and Goat Distributions in Mainland China. Front. Environ. Sci. 9:748734. doi: 10.3389/fenvs.2021.748734
Received: 28 July 2021; Accepted: 09 November 2021;
Published: 13 December 2021.
Edited by:
Mesenbet Yibeltal, Bahir Dar University, EthiopiaReviewed by:
Xun Zhang, Beijing Technology and Business University, ChinaBin He, Beijing Normal University, China
Copyright © 2021 Zhang, Wang, Zhang, Zhao and Han. This is an open-access article distributed under the terms of the Creative Commons Attribution License (CC BY). The use, distribution or reproduction in other forums is permitted, provided the original author(s) and the copyright owner(s) are credited and that the original publication in this journal is cited, in accordance with accepted academic practice. No use, distribution or reproduction is permitted which does not comply with these terms.
*Correspondence: Guogang Wang, d2FuZ2d1b2dhbmdAY2Fhcy5jbg==
 Yongxiang Zhang
 Guogang Wang1*
