 Liang Wang
 Ying Cheng1,2
 Ravi Naidu
94% of researchers rate our articles as excellent or good
Learn more about the work of our research integrity team to safeguard the quality of each article we publish.
Find out more
ORIGINAL RESEARCH article
Front. Environ. Sci., 18 October 2021
Sec. Toxicology, Pollution and the Environment
Volume 9 - 2021 | https://doi.org/10.3389/fenvs.2021.746195
This article is part of the Research TopicEnvironmental Contamination Solutions for Complex Heterogeneous SystemsView all 10 articles
Traditional contaminated site characterisation approaches are time-consuming, labour-intensive, and demand a high level of expertise. This case study provides a rapid field-based solution to investigating a VOC contaminated site and its vapour incursion by combining soil vapour and groundwater survey. To fully assess the volatile organic compound (VOC) distribution in a contaminated site, a number of self-developed soil vapour sampling probes (SVSPs) were placed vertically at different locations in a grid with different depths. Hence, 3D subsurface contour maps for VOC concentrations in soil vapour can be obtained and used to help identify hot spots and the migration patterns of VOCs. This SVSP is “easy-to-install” in the field and a cost-effective solution for rapid assessment of soil vapour samples. The SVSPs can be installed both vertically and horizontally. If there is a requirement to take soil vapour samples beneath an existing building from a potential contamination source zone, SVSPs can be horizontally installed beneath the building without compromising its structural integrity. In addition, to ascertain the correct groundwater channels that are likely to carry contaminants from a potential source zone, an electrical resistivity tomography technique was employed to provide the preliminary information for groundwater delineation in a complex groundwater channel network.
Groundwater flows through a contaminated area can carry volatile organic compound (VOC) contaminants off-site, where VOC vapours could migrate vertically and laterally through the soil in a residential area, and subsequently through building foundations to contaminate residential indoor air, a process known as vapour intrusion. For a vapour intrusion risk assessment, the conventional method is to install a network of groundwater monitoring wells around targeted locations. Nevertheless, using this conventional method to locate and identify the correct groundwater channels that require the most treatment is costly and inefficient without firstly being able to identify the source zone.
A solution for identifying the source zone is to install a network of soil vapour monitoring bores. Traditional vapour sampling bores take time to construct and install and is technically challenging. Furthermore, monitoring soil vapour beneath a functional building without jeopardising its structural integrity presents some difficulties. Horizontal vapour probes or wells are commonly used for soil vapour extraction and remediation because they provide good access to horizontally moving contaminants or subsurface areas without causing damage to surface structures (Spuij et al., 1995; Armstrong et al., 1996; Osborn et al., 2011). However, it appears that horizontal soil vapour probes have not been utilised for soil vapour sampling and monitoring. Most likely, this is because of the need to isolate the sampling/monitoring probes to avoid ambient air intrusion on the underground sampling point.
In our prior study (Wang et al., 2021), an easy-to-install and retractable soil vapour sampling probe (SVSP) was introduced to rapidly sample soil vapour (Ayolabi et al., 2013). After being installed in a pre-drilled borehole and sealed with bentonite, it was found to work satisfactorily for soil vapour samples collecting from a range of soil depths. In this current study, using the horizontal drilling approach, the SVSP was further designed to be able to be horizontally installed beneath a functioning building to assess a possible contamination source zone. This study also showed that sampling with the SVSP is a cost-effective way to rapidly identify a potential source zone.
Following the identification of a source zone, groundwater remediation treatments are normally applied to the groundwater channels that intersect the source zone which may appear in the subsurface as a complex network of channels. The earth resistivity topology (ERT) technique can be used to outline the groundwater channel distribution in an intricate groundwater channel network situation, making it easier to identify areas for groundwater well placement. Over the past decade, ERT is a technology that has been widely used to identify and delineate groundwater channels (Mastrocicco et al., 2010; Müller et al., 2010; Saad et al., 2012; Meyerhoff et al., 2014). ERT is a geophysical technique that produces vertical 2D (length and depth) images of the electrical resistivity distribution in the subsoil. To conduct an ERT survey, cables connected to the ERT instrument leading to several steel electrodes are placed on the ground. The electrodes are attached at a set distance according to a specific electrode configuration. Using a four-electrode measurement methodology, the ERT techniques can be applied to investigate electrical resistivity in the subsurface. By producing changes in the electrical potential a known current flow is introduced to two electrodes to another set of electrodes at a set distance away. The potential difference between the electrodes is recorded (Meyerhoff et al., 2014) and inversion algorithms, such as Res2Dinv, are applied to generate electrical resistivity tomography. Changes in soil lithology, saturation, and salinity, as well as groundwater and groundwater contamination, all contribute to geologic variations in ground resistivity values. Furthermore, ERT can be used to relate soil contaminant characteristics, such as hydrocarbon pollution (Arrubarrena Moreno and Arango-Galván, 2013; Ayolabi et al., 2013) and heavy metals (Bravo and Benavides-Erazo, 2020). In this study, ERT was used to identify and locate naturally developed groundwater channels that cross the source zone. Several groundwater monitoring wells were installed and sampled to validate the ERT findings.
In this study, instead of employing typical laboratory analytical procedures, such as USEPA Methods TO-14 and TO-15 (Compendium Method TO-15, 1997; Method-14, 1999), a portable gas chromatography-mass spectrometer (GC/MS) was used to determine VOCs in the field. The analysis of VOCs and SVOCs in indoor and outdoor air samples has been extensively used by portable GC/MS in a variety of applications (Shakoor et al., 1997; Barnes et al., 2004; Fair et al., 2010; Gorder and Dettenmaier, 2011; Hopler, 2012; Leary et al., 2016) and the instrument can approach detection limits that satisfy criteria required by environmental protection authorities (EPA). With the fast in-field sample preparation and pre-concentration processes, such as employing the solid-phase micro-extraction (SPME) approach to sample conditioning, studies have demonstrated that the portable GC/MS instrument is reliable for rapid in-field quantitative analysis of VOCs for contaminated site vapour intrusion assessment (Hook et al., 2002; Wang et al., 2021).
In a prior paper (Wang et al., 2021), the self-developed SVSP was introduced with results that it worked faultlessly when installed in a pre-drilled borehole and back-filled with bentonite and soil to isolate the sampling point from. The SVSP comprises a 100 mm long and 80 mm diameter stainless steel cylindrical vapour chamber coupled to a non-absorbent Teflon sampling tube, 6 mm inner diameter, that connects the vapour chamber to the ground level, from which samples can be gathered. By preventing soil particles from clogging the sampling tube, the chamber permits soil vapour to be collected from the surrounding subsurface soil. The sampler tubing protrudes above the soil surface and is protected by a rigid galvanised pipe with a diameter of 20 mm that is attached to the chamber. The pipe is sealed internally with bentonite to guarantee that vapour is only sampled through the soil surrounding the chamber. The SVSP was fitted with brass fittings, and the depth of the SVSP in the subsoil was modified using different lengths of galvanised pipe to meet a specific sampling demand. At the soil surface, Tedlar bags or vapour canisters are utilised to collect the sample. In this case study, 84 SVSPs were installed vertically at 28 locations over an area of 320 m × 160 m on a seven by four grid, at depths of 1, 2, and 3 m at each location, to obtain data to prepare sub-surface contour maps showing the VOC concentrations in soil vapour at different depths. Figure 1 shows the locations of the SVSP installation and the source zone.
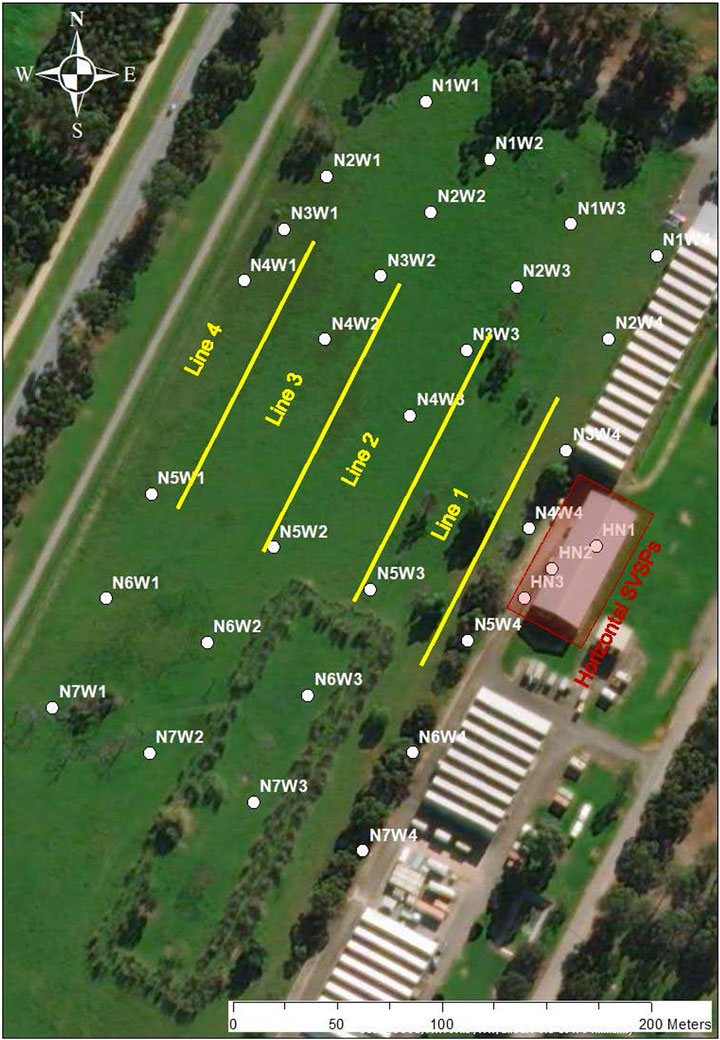
FIGURE 1. Locations of SVSP installation and ERT measurement lines (in yellow). SVSP locations: NxWx are the locations of vertical SVSPs, and NHx are the locations of horizontal SVSPs.
To access the soil vapour samples beneath a building without compromising the building’s structural integrity, three of SVSPs were installed horizontally (Figure 2) into pre-drilled boreholes. A Ditch Witch®fitted with a directional drill with a 95 mm wide bit was utilised to construct the boreholes. The initial plan was to drill a pilot hole and then open up with a back reamer drilling in the reverse direction, however, it was found that the pilot holes were wide enough for the installation of the SVSPs. The borehole was developed at a drilling angle (Ø) of 20° downward from horizontal, with a finished borehole length of 15 m. Using trigonometry, the depth of the wells was calculated to be about 5 m below the surface. Once the borehole (95 mm diameter) had been drilled, the vapour bore chamber fitted with a suitable length Teflon sample tubing was pushed into the borehole using 50 mm diameter PVC pipes. The borehole was then backfilled with dry fine sand to cover the chamber, then dry bentonite is filled through the channel borehole to provide a seal to separate the sampling point from the ambient air, which could result in sample dilution. Finally, the borehole is backfilled with clean soil. The Teflon sample tubing connected to the sampling chamber was long enough to extend from the backfilled borehole to allow for soil vapour sampling.
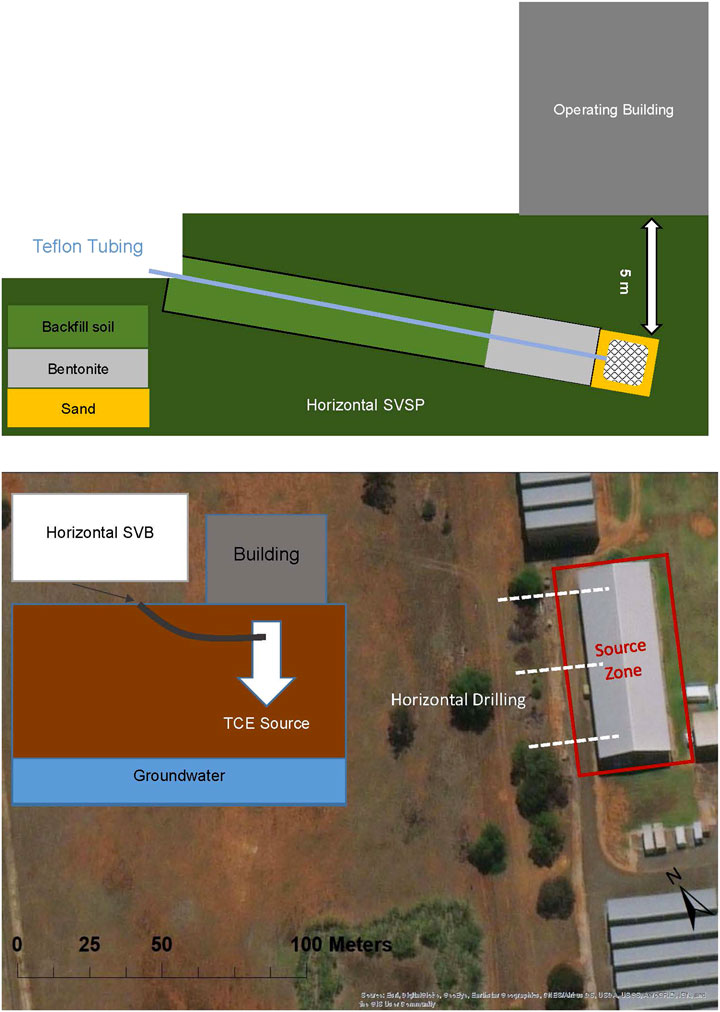
FIGURE 2. Description of horizontal SVSP installation.
For the in-field VOC measurements, a Torion T-9 Portable GC/MS was employed (Wang et al., 2021). A 5 m length and 0.18 mm inner diameter MXT-5 stainless steel column, inner coating with 0.4 µm thickness diphenyl dimethylpolysiloxane, is used in the portable GC/MS. With the temperature programming mode to increase the resolution of GC separation. The temperature was set initially at 50°C and held for 10 s before it was increased by 2°C per second to 200°C. Under this temperature sequence, the retention time for TCE was at 25.5 s, with the molecular fragments from 130 to 136 m/z. The battery or external power supply can be used to power the portable GC/MS. At 170 kPa GC column head pressure, the portable instrument has a 90 ml stainless steel helium cylinder, with about 1–2 ml/min flow rate, which can support about 8 h of field measurement.
Using this sampling preparation method can optimise the SPME extraction efficiency. Extraction duration, temperature, and solvent have been investigated as causal factors that affect the extraction efficiency of SPME in laboratory benchtop experiments (Zhao et al., 2011; Zhang and Harrington, 2015; Jia et al., 2000). Based on our investigation, an infield soil gas sample preparation method was introduced in our previous study (Wang et al., 2021). Soil vapour samples were obtained using 1 L Tedlar sample bags. The sample bags were placed over ice in a cooler box during the sample extraction and after collection to keep the samples close to 4°C after 1 µl of ethanol had been injected. To collect a sample for analysis, a solid-phase micro-extraction (SPME) syringe needle pierced through the sample bag’s septum and the internal SPME fibre, 65 µm polydimethylsiloxane/divinylbenzene, then exposed to the vapour sample for 8 min to extract the analytes from the vapour. By using this sample conditioning method for TCE vapour determination, the detection limit of the portable GC/MS has been improved from 1,000 to approximately 100 µg/m3fn3. However, because sampling conditioning caused the SPME to become saturated more quickly than unconditioned samples, different calibration curves for concentrations exceeding saturation were necessary. For calibration, the standard TCE solutions were prepared with ethanol, then injected into the Tedlar bags. The vapour was then collected and transferred to the portable GC/MS using the SPME with the same conditioning procedure.
To measure the concentration of VOCs in groundwater, 10 ml of groundwater was sampled into a clean container and mixed with 3 g of sodium chloride in a 40 ml vial. For extraction of the sample for analysis, the SPME fibre was exposed to the headspace above the water sample for 10 min at ambient temperature (Fabbri et al., 2007; Zhou et al., 2013; George et al., 2015). After the sample molecules were collected on the fibre, the SPME was immediately inserted into a portable GC/MS for the VOC analysis. The OpenChrom software was employed to analyse the portable GC/MS results. The contour maps of TCE concentrations for both soil vapour and groundwater samples were generated using the Krig interpolation algorithm in ArcGIS.
The correlations between the GC signal (peak area) and TCE concentrations for both soil vapour and groundwater were applied for the calibration. As demonstrated in our previous study (Wang et al., 2021), the mean of relative errors between the predicted results from the portable GC/MS and the convention air canister sampling method (TO-15), was about 9% for the measurement of the conditioned samples.
The Universal64 resistivity imaging instrument (ZZ Resistivity Imaging Pty Ltd., Australia) with FlashRES resistivity meter was applied in this application. The system which applies the electrode potential uses an external 12 V battery to supply the transmitter with the 250 W of power to provide a current of up to 3 A for the earth resistivity measurements. The sequence of measurements, including survey parameter, and electric current duration, can be set manually on the field or planned and uploaded to the system’s microcontroller via laptop. Wenner configuration was used in the 2D electrical resistivity tomography survey (Perrone et al., 2014; Cheng et al., 2019). During the in-field procedure, 64-electrode arrays were laid out in a line on the ground at a separation distance of 2 m between electrodes to achieve a survey distance of 128 m. Four 128 m survey lines were completed in this study - the locations are shown in Figure 1. The resistivity values between every two individual electrodes were measured with a FlashRES resistivity meter, yielding a total of 62,000 data points. The instrument calculates the resistance using the ratio of voltage to current. The received voltage causes an average of 6% noise. Using the acquired data, the 2.5D inversion software (F-INV, ZZ), with Occam’s inversion model was used to create resistivity inversion imaging of the area under the investigated ERT line, with the resolution value of 0.25.
According to the results from the portable GC/MS, a chlorinated VOC, trichloroethylene (TCE), was found at various concentrations following the analysis of vapour in the headspace of soil samples taken in the soil profile at 1, 2, and 3 m depths. There is no other VOC detected in the soil vapour samples. The TCE concentration distribution contours were plotted using ArcGIS, as presented in Figure 3. The TCE concentrations in the soil vapour samples collected from SVSPs with Summa Canisters at the same locations and respective sample depths were compared. The mean of relative errors between the predicted results from the portable GC/MS and the convention air canister sampling method (TO-15), was about 9% for the measurement of the conditioned samples.
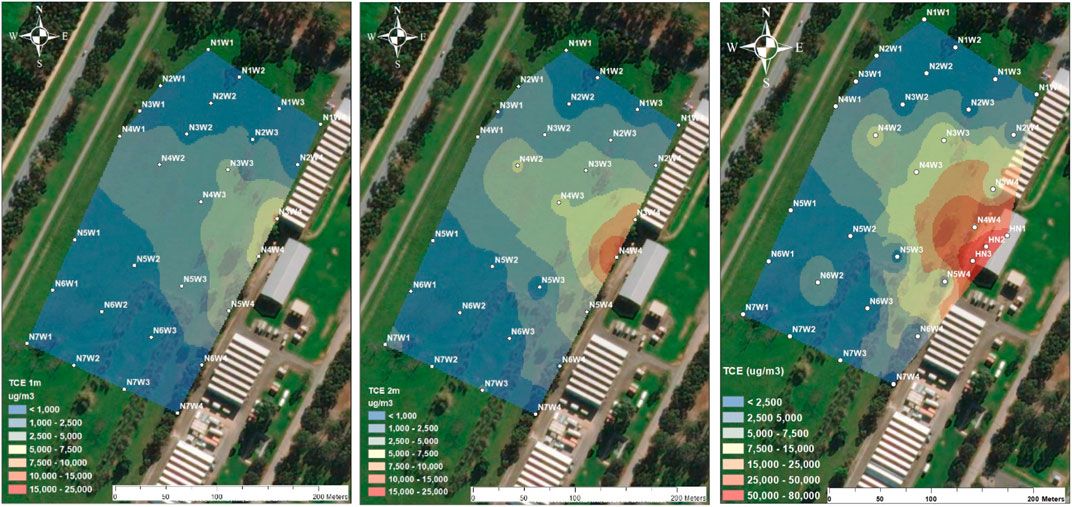
FIGURE 3. Trichloroethylene (TCE) contours (at 1, 2 and 3 m depths) using 28 vertical SVSPs and three horizontal SVSPs. (A) TCE contour at 1 m depth; (B) TCE contour at 2 m depth; (C) TCE contour combing 3 m and three horizontal SVSPs (HN1, HN2 and HN3) below the functioning building. SVSP locations: NxWx are the locations of vertical SVSPs, and NHx are the locations of horizontal SVSPs.
The TCE concentrations were generally higher in the soil vapour samples collected from the deeper SVSPs. For example, the TCE concentration in soil vapour samples from the three SVSPs at location N4W4, was around 5,000 μg/m3 at 1 m depth but more than 20,000 and 30,000 μg/m3 at 2 and 3 m, respectively. According to our hydrological report, the groundwater layer is around 10–12 m below the ground and the free-product and dissolved TCE is thought to be carried by groundwater that intersects with the source zone, which then is then released as a vapour which migrates to the ground surface as per vapour intrusion theory (Unnithan et al., 2021). The deeper the soil vapour samples obtained, the closer to the groundwater and the higher the detected concentration. Additionally, vapour in the topsoil profile has more opportunity to come into contact with the ambient air, resulting in dilution of the TCE and hence a lower detected concentration.
The TCE hotspot was detected along the south-eastern boundary of the investigation site, with the highest TCE concentrations detected in the soil vapour samples collected from the deeper vertical SVSPs at location N4W4, and from three horizontal SVSPs, NH1, NH2 and NH3, which were installed from the close vicinity of N4W4 to beneath an in-use building adjoining the initial investigation site. The TCE concentrations in the soil vapour samples collected from the three horizontal SVSPs were substantially greater than in the samples collected from the vertical SVSPs at N4W4. The results from the portable GC/MS indicated that the TCE concentrations in the soil vapour samples from the three horizontal SVSPs were all above 50,000 μg/m3, nearly double the TCE concentrations detected in the soil vapour samples from N4W4. The horizontal SVSPs were installed at around 5 m beneath the building or below ground level. Comparatively, the vertical SVSPs were installed at only about 3 m below ground level. Based on the vapour intrusion theory, the sampling point of the horizontal SVSPs, at 5 m below ground level, was closer to the groundwater, and therefore less contact with the atmosphere. There is another assumption, as the building is located at the potential source zone, the significantly higher concentrations of TCE could be from the contaminated soil in the vadose zone, where the groundwater is at about 10–12 m below ground level.
The significant TCE concentrations detected in the soil vapour samples collected from the three horizontal SVSPs demonstrate the use of horizontally installed SVSPs are a functional device for soil vapour sampling and monitoring purposes. In previous studies, horizontal soil vapour wells were predominantly applied for remediation and vapour extractions and no horizontal soil vapour wells were identified from the literature as being employed for soil vapour sampling and monitoring. This is most likely because, for soil vapour sampling and monitoring, the installation of SVSP requires better separation between the below-ground sampling point and the surface atmosphere. In horizontal SVSP installation, backfilling of the pre-drilled hole after insertion and positioning of the SVSP is difficult to achieve. Backfilling is usually done with mud concrete, made by mixing soil, cement, and water. However, when filling the pre-drilled hole with mud concrete using an air compressor could result in isolation of the sampling point from the surrounding soil and a blockage so that no sample can be collected. In our application, the borehole was backfilled with dry fine sand to cover the chamber, then dry bentonite is filled through the channel borehole to provide a seal to separate the sampling point from the ambient air, which could result in sample dilution. Finally, the borehole is backfilled with clean soil. After the backfilling, the SVSPs work satisfactorily for soil vapour samples collecting from a range of soil depths.
In the first trial, an air compressor was used to force dry sand through a slide tunnel into the end of the borehole to cover the SVSP chamber after it had been positioned. Backfilling with sand keeps the soil vapour mobile, allowing for sampling from the surface through the Teflon tubing (Figure 2). The evidence of high TCE from the horizontal SVSPs indicated a potential contaminant source beneath the building. According to the site history report, a demolished factory was located in the vicinity. As purported by the South Australian Environment Protection Authority (Talbot), in most instances TCE contamination is the result of historical disposal practices. Before legislative controls were applied, it was common practice for the industry to have on-site areas in which the chemical would be disposed of simply by pouring it onto the ground - assuming that it would then evaporate. Some industrial sites utilised more sophisticated methods for disposal including concrete-walled sumps and steel line bores drilled into the groundwater. According to the contour maps (Figure 3), except for the N4W4 hot spot area and the sampling point locations of the three horizontal SVSPs, the other relatively high TCE concentrations were observed SVSPs samples collected at the locations of N4W3, N4W2 and N4W1. This may indicate that groundwater, which may intersect with the source zone, flows toward the northwest, from N4W4 to N4W1. Figure 4 demonstrates a 3D model of TCE in soil vapour at the contaminated site.
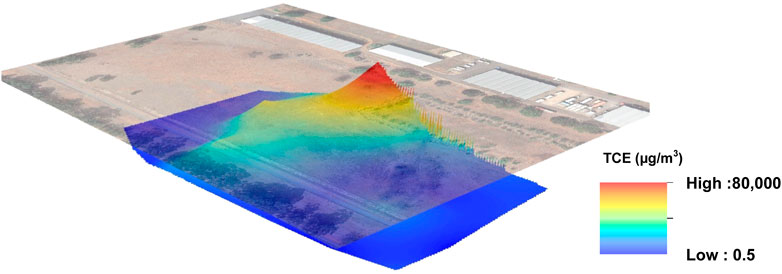
FIGURE 4. 3D map of TCE contour in soil vapour at the contaminated site.
Our hydrological report has confirmed the northwest direction of groundwater flow. Groundwater may occur in the subsurface as a complex network of channels, and therefore a site investigation must delineate the groundwater channels that intersect with the contaminant source zone.
To investigate the groundwater contamination, 11 groundwater monitoring wells were installed at the site. Using a portable GC/MS in the field, the TCE concentration in the groundwater samples was analysed from which the TCE contour was generated as shown in Figure 5. The highest TCE concentrations were found in groundwater samples obtained from three monitoring wells located across the middle of the site, GW 2169, GW 2171, and GW 0948. GW2171 with TCE concentrations in the order of 4,500 μg/L.
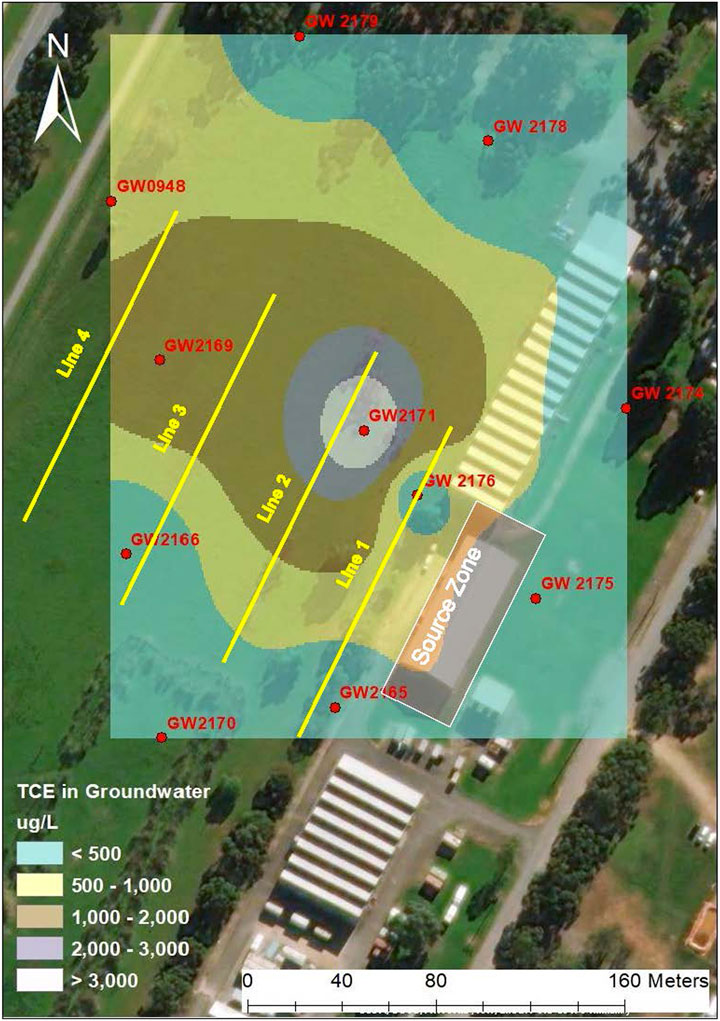
FIGURE 5. TCE concentration in groundwater (µg/L) and four ERT survey lines (in yellow).
TCE concentrations of less than 5 μg/L were identified in well GW 2175, which is located on the eastern extent of the potential source zone. Two wells, GW 2170 and GW 2178, in the south and north of the map, respectively, also indicated low TCE concentrations of less than 10 μg/L.
The groundwater contour result can be another part of the evidence to show the interaction between the source zone and the groundwater channels. When the groundwater contour is viewed alone, it appears that the TCE hotspot was at GW 2171 then migrated to GW2169, whereas the groundwater sample from GW 2176 located to the east of GW 2171, contained only 190 g/L of TCE. Nevertheless, there is no historical documentation indicating that this groundwater sampling location was ever used for industry.
When the soil vapour and groundwater contour maps are combined, it is clear that a groundwater channel flow exists from a potential source zone beneath the building to the groundwater monitoring well GW 2171. According to the data relating to GW 2176, there may be another groundwater route that does not cross the source zone. To understand this intricate groundwater channel network, the ERT technique can be used to delineate the distribution of groundwater channels so that there can be more accurate in the selection of the locations for groundwater well installation. Taking into account both soil vapour and groundwater contours, four ERT survey lines were used to delineate the groundwater channels that cross the source zone. The locations of the four ERT survey lines are depicted in Figure 5. The four survey lines were selected to intersect the groundwater channels across the source zone.
The electrical conductivity (EC) measurements of all the groundwater samples were between 2,000 and 5,000 μs/cm. Groundwater with high EC values can be presented as low resistivity (<5 Ω/m) by using the ERT technique (Mastrocicco et al., 2010; Meyerhoff et al., 2014). In regards to the soil structure on the site, a layer of black loamy soil sits as a textural contrast on top of the less fertile, calcareous limey sandy soil. The resistivity of this underlying soil type is normally above 10 Ω/m, depending on soil moisture, and as the soil closer to the groundwater channels becomes saturated it has a decreased resistivity. This resistivity is detected by the ERT and with Universal64 resistivity imaging the data can be exhibited with the lowest resistivity shown in darker colours as in Figure 6; the assumption being that the black colour zones where the resistivity value is less than 2 Ω/m are most likely the groundwater channel intersections. The blue colour regions, where resistivity values range from 2 to 10 Ω/m, are most likely the surrounding soils that have been saturated by groundwater. The unsaturated clay soil is shown as the green areas, and soil with increased sand content likely occurs where the yellow, red, and white colour zones are indicated. According to our soil texture measurement, soil contains about 24–40% clay (Wang et al., 2021). The soil is a mixture of fertile black loamy texture contrast soils and less fertile highly calcareous sandy soils.
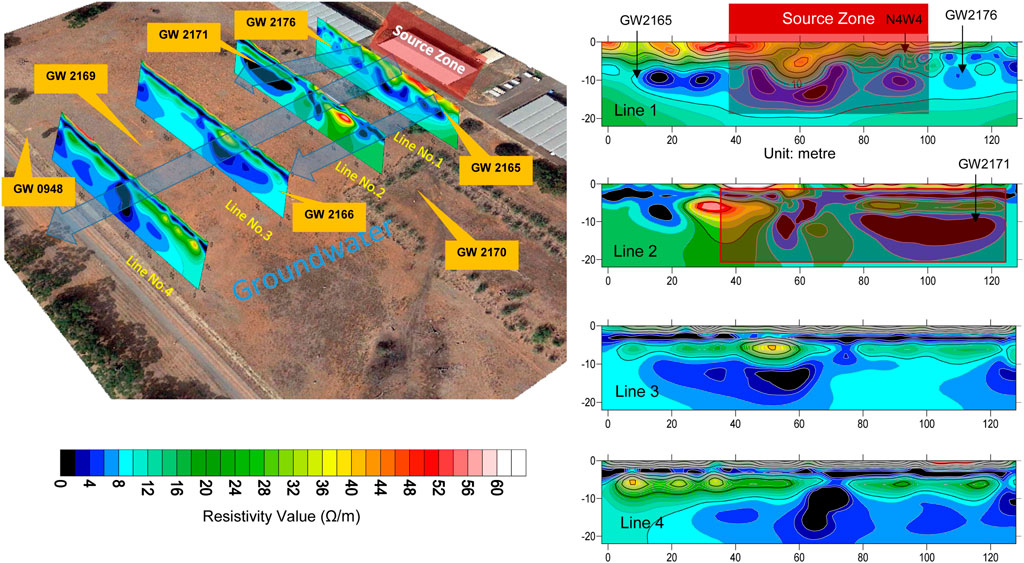
FIGURE 6. ERT imaging (unit in meters) - The survey images present the measurement results in the distance (m) - the X-axis, and depth below the ground (m) - the Y-axis.
Figure 6 also indicates the potential groundwater pathways beneath the TCE source zone. The survey images present the measurement results in the distance (m) - the X-axis, and depth below the ground (m) - the Y-axis. For example, based on the colour along ERT survey line 1, there are likely six groundwater channels intersected by the ERT survey at about 10 m below the ground (Y-axis), and the middle three groundwater channels, from 40 to 100 m (X-axis), are likely to cross the source zone. From the ERT plots, it is apparent that the two groundwater monitoring wells, GW 2165 and GW 2176, are located beyond the source zone (Figure 6).
There is a considerable black colour segment in the ERT second survey area (survey line 2) from 80 to 120 m, which implies that significant TCE-contaminated groundwater is trapped or retained in this area. The TCE results from the analysis of the groundwater samples from GW 2171 and the N4W3 soil vapour samples support this assumption. On all of the four survey lines, as shown in the ERT images there are continuous black colour areas at around 60 m (X-axis). This may indicate that the groundwater channels that transport TCE away from the source zone were intercepted by the four-line ERT survey and is supported by the soil vapour contours in Figure 4 and the groundwater flow direction.
This case study provides a novel approach to investigating a VOC-contaminated site and its vapour incursion by combining a soil vapour survey with an earth resistivity survey. The “easy to install” and retractable SVSP is demonstrated to be a useful field solution for the installation of sampling points for the rapid assessment of soil vapour samples both vertically and horizontally. The self-developed SVSP is inexpensive and therefore a large number of SVSPs can be deployed across a grid at varying depths to obtain data to generate 3D subsurface contour maps for VOC soil vapour concentrations. These distribution contour maps can then be used to assist in the identification of hot spots and the migration patterns of VOCs which can be carried down gradient from a source zone and result in vapour intrusion into buildings.
The ERT technique can be used to delineate the groundwater channel distribution so that there can be a more accurate selection of the locations for groundwater and soil vapour monitoring well installation. The resistivity difference between groundwater and the surrounding soil can be presented as an ERT plot with different colours showing the differing resistivity across the soil profile and hence the groundwater channel or stream. It should be noted that groundwater resistivity is determined by water quality and salt concentration, therefore groundwater with a low EC or salt content will have high resistivity, making separation of groundwater from the surrounding soil problematic. Hence other subsurface imaging techniques such as induced polarization and self-potential can be applied to provide additional information for the groundwater identification (Cygal et al., 2016; Heritiana et al., 2019). In conclusion, these non-destructive physical-geological survey methods can provide a preliminary indication of groundwater locations, which can then assist in determining the correct groundwater channels for investigation in a complex groundwater channel network.
The raw data supporting the conclusions of this article will be made available by the authors, without undue reservation.
LW: Public responsibility for the content, including participation in the concept, design, analysis, writing, or revision of the manuscript. YC: Public responsibility for the content, including participation in the concept, design, analysis, writing, or revision of the manuscript. RN: Public responsibility for the content, including participation in the concept, design, analysis, writing, or revision of the manuscript. PG: Public responsibility for the content, including participation in the concept, design, analysis, writing, or revision of the manuscript. MB: Public responsibility for the content, including participation in the concept, design, analysis, writing, or revision of the manuscript.
This research was funded by CRC CARE Pty Ltd. The research was conducted in the laboratories of the Global Centre for Environmental Remediation (GCER) at the University of Newcastle.
The authors declare that the research was conducted in the absence of any commercial or financial relationships that could be construed as a potential conflict of interest.
The reviewer (LD) declared a past co-authorship with one of the authors (RN) and a shared affiliation with the authors (LW, YC, RN) to the handling Editor.
All claims expressed in this article are solely those of the authors and do not necessarily represent those of their affiliated organizations, or those of the publisher, the editors and the reviewers. Any product that may be evaluated in this article, or claim that may be made by its manufacturer, is not guaranteed or endorsed by the publisher.
The authors would like to thank the Cooperative Research Centre for Contamination Assessment and Remediation of the Environment (CRC CARE); The Department of Defence, Australia; Perkin Elmer; and the University of Newcastle for making this research possible. The horizontal drilling service was provided by Collision Drilling, Westco Pty Ltd. The ERT survey was conducted by ZZ Resistivity Imaging Pty Ltd.
Armstrong, J. E., Moore, B. J., and Dupont, R. R. 1996. Horizontal Soil Vapour Extraction: Subsurface Remedial Technology Research and Demonstration Program – Pilot Test Summary Report, .
Arrubarrena Moreno, M., and Arango-Galván, C. (2013). Use of Electrical Resistivity Tomography in the Study of Soil Pollution Caused by Hydrocarbons: Case Study in Puebla (México). Bsgm 65, 419–426. doi:10.18268/bsgm2013v65n2a21
Ayolabi, E. A., Folorunso, A. F., and Idem, S. S. (2013). Application of Electrical Resistivity Tomography in Mapping Subsurface Hydrocarbon Contamination. Esr 2. doi:10.5539/esr.v2n1p93
Barnes, A. T., Dolan, J. A., Kuk, R. J., and Siegel, J. A. (2004). Comparison of Gasolines Using Gas Chromatography-Mass Spectrometry and Target Ion Response. J. Forensic Sci. 49 (5), 1018–1023. doi:10.1520/jfs2004029
Bravo, D., and Benavides-Erazo, J. (2020). The Use of a Two-Dimensional Electrical Resistivity Tomography (2D-ERT) as a Technique for Cadmium Determination in Cacao Crop Soils. Appl. Sci. 10, 4149. doi:10.3390/app10124149
Cheng, Q., Tao, M., Chen, X., and Binley, A. (2019). Evaluation of Electrical Resistivity Tomography (ERT) for Mapping the Soil-Rock Interface in Karstic Environments. Environ. Earth Sci. 78, 439. doi:10.1007/s12665-019-8440-8
Compendium Method TO-15 (1997). “Determination of Volatile Organic Compounds (VOCs),” in Air Collected in Specially Prepared Canisters and Analyzed by Gas Chromatography/mass Spectrometry (GC/MS), (U.S. EPA).
Cygal, A., Stefaniuk, M., Kret, A., and Kurowska, M. (2016). The Application of Electrical Resistivity Tomography (ERT), Induced Polarization (IP) and Electromagnetic Conductivity (EMC) Methods for the Evaluation of Technical Condition of Flood Embankment Corpus. geol 42, 279–287. doi:10.7494/geol.2016.42.3.279
Fabbri, D., Bezzi, R., Torri, C., Galletti, P., and Tagliavini, E. (2007). Determination of Tetrachloroethylene and Other Volatile Halogenated Organic Compounds in Oil Wastes by Headspace SPME GC-MS. Chroma 66, 377–382. doi:10.1365/s10337-007-0353-0
Fair, J. D., Bailey, W. F., Felty, R. A., Gifford, A. E., Shultes, B., and Volles, L. H. (2010). Quantitation by Portable Gas Chromatography: Mass Spectrometry of VOCs Associated with Vapor Intrusion. Int. J. Anal. Chem. 2010, 6. doi:10.1155/2010/278078
George, M. J., Marjanovic, L., Williams, D. B. G., and Williams, G. (2015). Solvent-Assisted Headspace Sampling Using Solid Phase Microextraction for the Analysis of Phenols in Water. Anal. Chem. 87, 9559–9562. doi:10.1021/acs.analchem.5b02539
Gorder, K. A., and Dettenmaier, E. M. (2011). Portable GC/MS Methods to Evaluate Sources of cVOC Contamination in Indoor Air. Ground Water Monit. Remediation 31 (4), 113–119. doi:10.1111/j.1745-6592.2011.01357.x
Heritiana, A, R., Riva, R., Ralay, R., and Boni, R. (2019). Evaluation of Flake Graphite Ore Using Self-Potential (SP), Electrical Resistivity Tomography (ERT) and Induced Polarization (IP) Methods in East Coast of Madagascar. J. Appl. Geophys. 169, 134–141. doi:10.1016/j.jappgeo.2019.07.001
Hook, G. L., Kimm, G. L., Hall, T., and Smith, P. A. (2002). Solid-phase Microextraction (SPME) for Rapid Field Sampling and Analysis by Gas Chromatography-Mass Spectrometry (GC-MS). Trac Trends Anal. Chem. 21 (8), 534–543. doi:10.1016/s0165-9936(02)00708-2
Hopler, R. B. (2012). “The History, Development, and Characteristics of Explosives and Propellants,” in Forensic Investigations of Explosives. Editor A. Beveridge (U. S: Taylor & Francis Group), 1–18. doi:10.1201/b11282-2
Jia, M., Koziel, J., and Pawliszyn, J. (2000). Fast Field Sampling/sample Preparation and Quantification of Volatile Organic Compounds in Indoor Air by Solid-phase Microextraction and Portable Gas Chromatographyfication of Volatile Organic Compounds in Indoor Air by Solid-phase Microextraction and Portable Gas Chromatography. Field Analyt. Chem. Technol. 4, 73–84. doi:10.1002/1520-6521(2000)4:2/3<73::aid-fact2>3.0.co;2-7
Leary, P. E., Dobson, G. S., and Reffner, J. A. (2016). Development and Applications of Portable Gas Chromatography-Mass Spectrometry for Emergency Responders, the Military, and Law-Enforcement Organizations. Appl. Spectrosc. 70 (5), 888–896. doi:10.1177/0003702816638294
Mastrocicco, M., Vignoli, G., Colombani, N., and Zeid, N. A. (2010). Surface Electrical Resistivity Tomography and Hydrogeological Characterization to Constrain Groundwater Flow Modeling in an Agricultural Field Site Near Ferrara (Italy). Environ. Earth Sci. 61, 311–322. doi:10.1007/s12665-009-0344-6
Method TO-14 (1999). Compendium of Methods for the Determination of Toxic Organic Compounds in Ambient Air, Washington, DC, U.S. EPA.
Meyerhoff, S. B., Maxwell, R. M., Revil, A., Martin, J. B., Karaoulis, M., and Graham, W. D. (2014). Characterization of Groundwater and Surface Water Mixing in a Semiconfined Karst Aquifer Using Time-Lapse Electrical Resistivity Tomography. Water Resour. Res. 50, 2566–2585. doi:10.1002/2013WR013991
Müller, K., Vanderborght, J., Englert, A., Kemna, A., Huisman, J. A., Rings, J., et al. (2010). Imaging and Characterization of Solute Transport during Two Tracer Tests in a Shallow Aquifer Using Electrical Resistivity Tomography and Multilevel Groundwater Samplers. Water Resour. Res. 46, 1–23. doi:10.1029/2008WR007595
Osborn, S. G., Vengosh, A., Warner, N. R., and Jackson, R. B. (2011). Methane Contamination of Drinking Water Accompanying Gas-Well Drilling and Hydraulic Fracturing. Proc. Natl. Acad. Sci. 108, 8172–8176. doi:10.1073/pnas.1100682108
Perrone, A., Lapenna, V., and Piscitelli, S. (2014). Electrical Resistivity Tomography Technique for Landslide Investigation: A Review. Earth-Science Rev. 135, 65–82. doi:10.1016/j.earscirev.2014.04.002
Saad, R., Nawawi, M. N. M., and Mohamad, E. T. (2012). Groundwater Detection in Alluvium Using 2-D Electrical Resistivity Tomography (ERT). Eletronic J. Geotechnical Eng. 17, 369–376.
Shakoor, O., Taylor, R. B., and Behrens, R. H. (1997). Assessment of the Incidence of Substandard Drugs in Developing Countries. Trop. Med. Int. Health 2 (9), 839–845. doi:10.1046/j.1365-3156.1997.d01-403.x
Spuij, F., Otten, A., and Otten, A. (1995). Risk Reduction by Soil Vapour Extraction Remediation Based on Transport Mechanisms. Contaminated Soil 95, 1361–1362. doi:10.1007/978-94-011-0421-0_148
Talbot, M., Beverley Assessment Area – Summary of Historical Activities, Available at: http://www.epa.sa.gov.au/data_and_publications/site_contamination_monitoring/assessment_areas/beverley_woodville_west_south_findon_allenby_gdns (Accessed Jun 17, 2019).
Unnithan, A., Bekele, D. N., Chadalavada, S., and Naidu, R. (2021). Insights into Vapour Intrusion Phenomena: Current Outlook and Preferential Pathway Scenario. Sci. Total Environ. 796, 148885. doi:10.1016/j.scitotenv.2021.148885
Wang, L., Cheng, Y., Naidu, R., Chadalavada, S., Bekele, D., Gell, P., et al. (2021). Application of Portable Gas Chromatography-Mass Spectrometer for Rapid Field Based Determination of TCE in Soil Vapour and Groundwater. Environ. Technology Innovation 21, 101274. doi:10.1016/j.eti.2020.101274
Zhang, M., and Harrington, P. (2015). Determination of Trichloroethylene in Water by Liquid-Liquid Microextraction Assisted Solid Phase Microextraction. Chromatography 2, 66–78. doi:10.3390/chromatography2010066
Zhao, G., Song, S., Wang, C., Wu, Q., and Wang, Z. 2011. Solid-phase Microextraction with a Novel Graphene-Coated Fiber Coupled with High-Performance Liquid Chromatography for the Determination of Some Carbamates in Water Samples. Anal. Methods 3, 2929 2935. doi:10.1039/C1AY05358B
Zhou, Y. Y., Yu, J. F., Yan, Z. G., Zhang, C. Y., Xie, Y. B., Ma, L. Q., et al. (2013). Application of Portable Gas Chromatography-Photo Ionization Detector Combined with Headspace Sampling for Field Analysis of Benzene, Toluene, Ethylbenzene, and Xylene in Soils. Environ. Monit. Assess. 185, 3037–3048. doi:10.1007/s10661-012-2771-1
Keywords: vapour intrusion assessment, horizontal soil vapour probes, volatile organic compound, portable gas chromatography - mass spectrometer, earth resistivity tomography, subsurface imaging
Citation: Wang L, Cheng Y, Naidu R, Gell P and Bowman M (2021) Rapid In-Field Approaches for Delineating VOC in Both Soil Vapour and Groundwater for Vapour Intrusion Assessment. Front. Environ. Sci. 9:746195. doi: 10.3389/fenvs.2021.746195
Received: 23 July 2021; Accepted: 30 September 2021;
Published: 18 October 2021.
Edited by:
Jane A. Entwistle, Northumbria University, United KingdomReviewed by:
Luchun Duan, The University of Newcastle, AustraliaCopyright © 2021 Wang, Cheng, Naidu, Gell and Bowman. This is an open-access article distributed under the terms of the Creative Commons Attribution License (CC BY). The use, distribution or reproduction in other forums is permitted, provided the original author(s) and the copyright owner(s) are credited and that the original publication in this journal is cited, in accordance with accepted academic practice. No use, distribution or reproduction is permitted which does not comply with these terms.
*Correspondence: Liang Wang, TGlhbmcuV2FuZ0BuZXdjYXN0bGUuZWR1LmF1
Disclaimer: All claims expressed in this article are solely those of the authors and do not necessarily represent those of their affiliated organizations, or those of the publisher, the editors and the reviewers. Any product that may be evaluated in this article or claim that may be made by its manufacturer is not guaranteed or endorsed by the publisher.
Research integrity at Frontiers
Learn more about the work of our research integrity team to safeguard the quality of each article we publish.