 José Moleiro Martins1,2
 Tomiwa Sunday Adebayo3,4*
 Mário Nuno Mata1Seun Damola Oladipupo5Ibrahim Adeshola6Zahoor Ahmed7Anabela Batista Correia1
- 1ISCAL-Instituto Superior de Contabilidade e Administração de Lisboa, Instituto Politécnico de Lisboa, Lisboa, Portugal
- 2Instituto Universitário de Lisboa (ISCTE-IUL), Business Research Unit (BRU-IUL), Lisboa, Portugal
- 3Department of Business Administration, Faculty of Economics and Administrative Science, Cyprus International University, Nicosia, Turkey
- 4Department of Finance and Accounting, Akfa University, Tashkent, Uzbekistan
- 5Department of Science, Faculty of Earth Science, Olabisi Onabanjo University, Ago Iwoye, Nigeria
- 6Department of Information Technology, School of Computing and Technology, Eastern Mediterranean University, Mersin, Turkey
- 7Department of Economics, Faculty of Economics and Administrative Science, Cyprus International University, Nicosia, Turkey
The continuous growth in CO2 emissions of nations around the globe has made achieving the aim of sustainable development extremely challenging. Therefore, the current research assesses the connection between CO2 emissions and economic complexity in the top 7 economic complexity countries while taking into account the role of economic growth, renewable energy consumption, and globalization for the period between 1993 and 2018. The research aims to answer the following questions: 1) What is the association between CO2 and the regressors in the long-run? 2) What are the effects of renewable energy consumption, economic growth, economic complexity, and globalization on CO2 emissions? The research utilized the CS-ARDL, CCEMG and panel causality approaches to investigate these interconnections. The empirical outcomes revealed that economic growth and economic complexity increase CO2 emissions while renewable energy consumption and globalization mitigate CO2 emissions. The outcomes of the causality test revealed a feedback causal connection between economic growth and CO2, while a unidirectional causality was established from economic complexity, globalization and renewable energy consumption to CO2 emissions in the top 7 economic complexity countries.
Introduction
Environmental quality and pollution concerns have become a subject of discussion for economist’s ecologists, policymakers, and researchers over the past two decades. Human demand for natural resources puts strain on the environment, resulting in a slew of environmental concerns such as climate change, soil degradation, pollution, and biodiversity loss (Adebayo and Kirikkaleli, 2021; Soylu et al., 2021). Humanity’s unrestricted exploitation of natural resources produces irreparable harm to the biosphere, which has a detrimental impact on the globe’s sustainable social development and economic goals (Shahbaz et al., 2021). Excessive exploitation and use of natural resources, as well as growing pollution and waste emissions, pose a danger to national economies. Carbon emissions (CO2) are now causing serious environmental issues such as global warming, climate change, and biodiversity loss. As a result, nations have taken steps to reduce CO2 at international gatherings, including the Stockholm Conference, the Montreal and Kyoto Protocols, and the Paris Agreement. Notwithstanding all attempts, CO2 keeps rising globally. The level of economic growth is a critical component influencing environmental deterioration. The environmental and ecological cost of economic progress, in particular, is a source of worry (Ozturk and Acaravci, 2016; Adebola Solarin et al., 2017; Rjoub et al., 2021). The study of Grossman and Krueger (1991) was the first to examine the inverted U-shaped connection between numerous environmental degradation indices and economic development. This connection demonstrates that as the degree of development increases, degradation of the environment rises initially, and then when a specific limit is reached, economic growth lowers the environmental deterioration.
Furthermore, several academics have recently added the economic complexity index as a measure of economic progress in their study (Ahmad et al., 2021; Pata, 2021). Dreher (2006) constructing the economic complexity index (ECI) to calculate a nation’s technology-intensive exports. ECI is an indication of a country’s economic progress in terms of export since this data only covers exported items. ECI is described in the international trade literature as the technological level and understanding of the production process (Abbasi et al., 2021; Pata, 2021). In other words, a nation’s productive output necessitates a high degree of ingrained skills and knowledge (Hidalgo and Hausmann, 2009). ECI varies according to the diversity and sophistication of each nation’s exports (Doğan et al., 2019). On the one hand, as the economy’s complexity grows, so does product diversity, and more output contributes to higher emissions. Moreover, ECI can have a beneficial impact on the quality of the environment since it involves research and development activities as well as the ability to promote eco-friendly goods and clean technology (Neagu, 2020). As Hidalgo and Hausmann (2009) stated, ECI remains at the center of the rationale for the disparity in per capita income between nations. As a result, ECI is closely related to a nation’s per capita income and wellbeing (Abbasi et al., 2021).
Energy is also critical to economic progress and environmental degradation. Economic activities that consume a lot of energy result in increased CO2 emissions (Adebola Solarin et al., 2017). Excessive usage of fossil fuels in the industrial production process raises CO2 and inhibits sustainable growth by creating climate change and ecological problems. With the population of the globe growing, the continued usage of fossil fuel sources including oil, coal, and gas resulted in military and geopolitical conflicts, an increase in environmental concerns, and oil price instability (Orhan et al., 2021). Renewable energy sources, as opposed to fossil fuels, are clean, limitless, and ecologically beneficial. Since the massive growth in fossil fuel consumption has resulted in catastrophes and severe ecological harm, renewable energy should be utilized in place of fossil fuels to improve the sustainability of the environment while also providing energy diversity and security (Sarkodie and Strezov, 2019).
Globalization is another element that contributes to environmental deterioration. Globalization influences human demand on the environment by facilitating economic, technical, and cultural progress. (Dreher, 2006) (KOF) index can be used to gauge globalization. This indicator is divided into three complementary components: political, social, and economic. Globalization, which has gained traction during the 1990s, has resulted in significant economic developments such as capital flows and international trade liberalization. Globalization boosts total factor productivity, opens up new investment options, and strengthens financial markets (Kirikkaleli et al., 2021). To sum up, globalization can affect environmental pollution positively or negatively. Most economists believe that globalization has a positive net impact on the degradation of the environment (Dreher, 2006). Since globalization does not give an exact impact (positive or negative), its influence on the degradation of the environment should be investigated (Pata, 2021).
Over the years, several studies have been done to inform the public on the influence of economic complexity, economic growth, globalization, and renewable energy consumption on CO2 emissions; however, findings mixed. For instance, some studies (Dogan and Seker, 2016; Pata, 2021; Rafique et al., 2021) found CO2-ECI positive connections while some studies (Can and Gozgor, 2016; Doğan et al., 2019; Boleti et al., 2021) established negative CO2-ECI association. Moreover, the studies of Koengkan et al. (2020), Pata (2021), and Khan et al. (2019) disclosed CO2-GLO positive interrelation whereas the studies of He et al. (2021) and Koengkan et al. (2020) confirmed negative CO2-GLO association. Additionally, the majority of the studies found that economic expansion triggers emissions of CO2 (Adebayo, 2020; Coelho et al., 2021; Kirikkaleli and Adebayo, 2021).
In this regard, our study attempts to overcome the gap in the literature by focusing on the top seven economic complexity nations (Japan, Switzerland, South Korea, Germany, Singapore, Australia and Czech) (see Figure 1)1 which are ranked as developed nations. This research adds to the current literature in the following ways: First, we assess not only the influence of economic complexity but also the influence of REC, economic growth, and globalization on environmental deterioration. Second, this research introduces the interaction term to assess the influence of renewable energy and economic complexity on CO2 emissions to capture whether globalization among these nations has any implications on renewable energy utilization and economic complexity and, as a result, for CO2. To the authors’ understanding, this is the first study to explore these associations using the interaction term. Therefore, the present research fills the gap in the ongoing literature. Third, the current study adds by employing a unique CS-ARDL to address the concerns of heterogeneity and CSD in panel data, which have been overlooked in earlier studies. This approach is resistant to misspecification bias endogeneity cross-sectional dependence, nonstationarity, and heterogeneity (Lin et al., 2021). Thirdly, we applied the CCEMG approach as a robustness check.
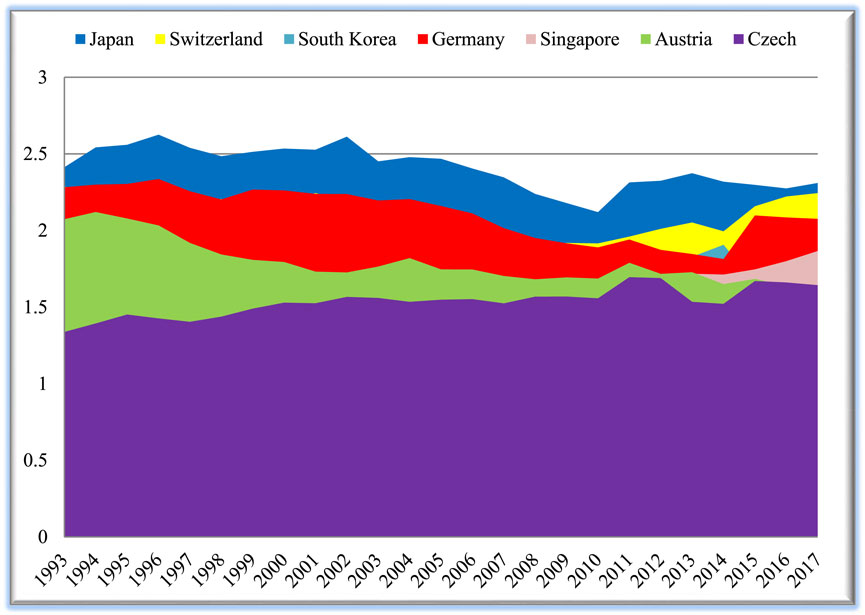
FIGURE 1. Top 7 economic complexity nations trends from 1993 to 2017.
The remaining sections of this research are compiled as follows: Literature Review present the data and methods. Findings and Discussion illustrates the findings and discussion and the conclusion is presented in Conclusion and Policy Path.
Literature Review
This section of the study presents a summary of the studies conducted regarding the connection between carbon emissions (CO2) and economic growth (GDP), globalization (GLO), economic complexity (ECI), and renewable energy utilization (REC). Regarding the interrelationship between CO2 and economic growth, several studies have been conducted; however, mixed findings are reported. For instance, Using G7 countries and data from 1970 to 2015, (Cai et al., 2018) assessed the GDP-CO2 interrelationship. The investigators applied Granger Causality based on bootstrap ARDL and the study outcomes unveiled that GDP dampens the quality of the environment. Furthermore, there is proof of unidirectional causal linkage from GDP to CO2. Similarly, Wang and Ye (2017) using the BRICS Nations assessed the GDP-CO2 interrelationship using PLS and the study outcome disclosed positive GDP-CO2 interrelationship. Moreover, Ahmad et al. (2021) study on the GDP-CO2 association in 30 Chinese provinces and cities using the panel method disclosed that an upsurge in GDP mitigates CO2. Also, the EKC hypothesis is validated. Moreover, the study of Leitão (2021a) in Portugal using FMOLS disclosed that an increase in GDP contributes to the degradation of the environment. Using the ARDL approach, Khan et al. (2019) assessed the connection between GDP and CO2 from 1965 to 2015 and their outcome disclosed a positive GDP-CO2 interrelationship. Using Brazil as a case study, Hdom and Fuinhas (2020) investigated the EKC hypothesis using data from 1975 to 2016 and DOLS, FMOLS, and Causality approaches. The study affirmed the EKC hypothesis also, there is unidirectional causality from GDP to CO2. Furthermore, the study of Salari et al. (2021) in the United States from 1997 to 2016 disclosed positive CO2-GDP interconnection.
Globalization boosts total factor productivity (TFP) by increasing trade. Foreign direct investment (FDI) and the transfer of sophisticated technologies between industrialized and developing nations stimulate economic growth. Furthermore, globalization creates investment possibilities via FDI and strengthens financial markets via financial deregulation. Certainly, this process improves trade, economic growth, and financial markets as well as the consumption of energy which increases CO2 emissions. On the association between globalization and CO2 emissions, several studies have been done with mixed findings. For instance, Muhammad and Khan (2021) research on the globalization-emissions association using 31 developed and 155 developing countries disclosed that in both developed and developing nations an upsurge in globalization triggers emissions levels. Moreover, the study of Leal and Marques (2021) using 23 African countries from 1999 to 2017 disclosed a positive globalization-emissions association. On the contrary, the study of He et al. (2021) in Mexico established a negative globalization-emissions association interrelationship. The negative globalization-emissions association is also supported by the study of Koengkan et al. (2020) for Latin America and Caribbean Countries between 1975 and 2016. Using South Asian countries, the study of Khan et al. (2019) confirmed a negative GLO-CO2 interrelationship.
Renewable energy sources, as opposed to fossil fuels, are clean, limitless, and ecologically beneficial. Since the massive growth in fossil fuel consumption has resulted in catastrophes and severe ecological harm, renewable energy should be utilized in place of fossil fuels to improve the sustainability of the environment while also providing energy diversity and security (Sarkodie and Strezov, 2019). On this note, several studies have been done on renewable energy use and CO2 emissions association. For example, using 25 selected African countries, the study of Zoundi (2017) on the REC-CO2 interrelationship and Panel FMOLS from 1980 to 2012 disclosed negative CO2-REC association. Moreover, using Portugal, Italy, Greece, and Spain as a case study, the study of Balsalobre-Lorente et al. (2021) established that renewable energy usage helps to abate CO2 emissions. Likewise, using European nations as a case study, the study of Leitão and Lorente (2020) established that renewable energy utilization plays a significant role in decreasing emissions of CO2. In India, Kirikkaleli and Adebayo (2021) assessed the CO2-REC connection using frequency domain causality test and their outcome disclose that an upsurge REC contributes to the degradation of the environment. Similarly, the study of Leitão (2021b) on the REC-GDP connection using FMOLS disclosed that an upsurge in REC mitigates CO2 emissions. Furthermore, REC can predict CO2. Moreover, the study of Cherni and Essaber Jouini (2017) on the REC-CO2 interrelationship unveiled that an upsurge in REC mitigates CO2 pollution. This outcome is also validated by the studies of Adams and Nsiah (2019) for 28 Sub-Sahara African countries and Haseeb et al. (2018) for BRICS countries.
Furthermore, several academics have recently added the economic complexity index as a measure of economic progress in their study (Ahmad et al., 2021; Pata, 2021). ECI is an indication of a country’s economic progress in terms of export since this data only covers exported items. ECI is described in the international trade literature as the technological level and understanding of the production process (Abbasi et al., 2021; Pata, 2021). In other words, a nation’s productive output necessitates a high degree of ingrained skills and knowledge (Hidalgo and Hausmann, 2009). ECI varies according to the diversity and sophistication of each nation’s exports (Doğan et al., 2019). Several studies have been done on renewable energy use and CO2 emissions association. For example, using 55 countries and data from 1971 to 2014, the study of Dogan and Seker (2016) established positive ECI-CO2 interrelationship. Similarly, the study of Neagu (2020) on the ECI-CO2 interrelationship using European Union countries from 1990 to 2018, and DOLS, FMOLS, and Panel Causality approaches disclosed that an upsurge in ECI triggers CO2 emissions. Contrarily, the study of Doğan et al. (2019) established negative ECI-CO2 interrelationship in 28 OECD countries from 1990 to 2014 using Panel ARDL. Likewise, the study of Boleti et al. (2021) using 88 developed and developing countries an data from 2002 to 2012 revealed negative ECI-CO2 interrelationship. Table 1 presents the summary of discussed studies.
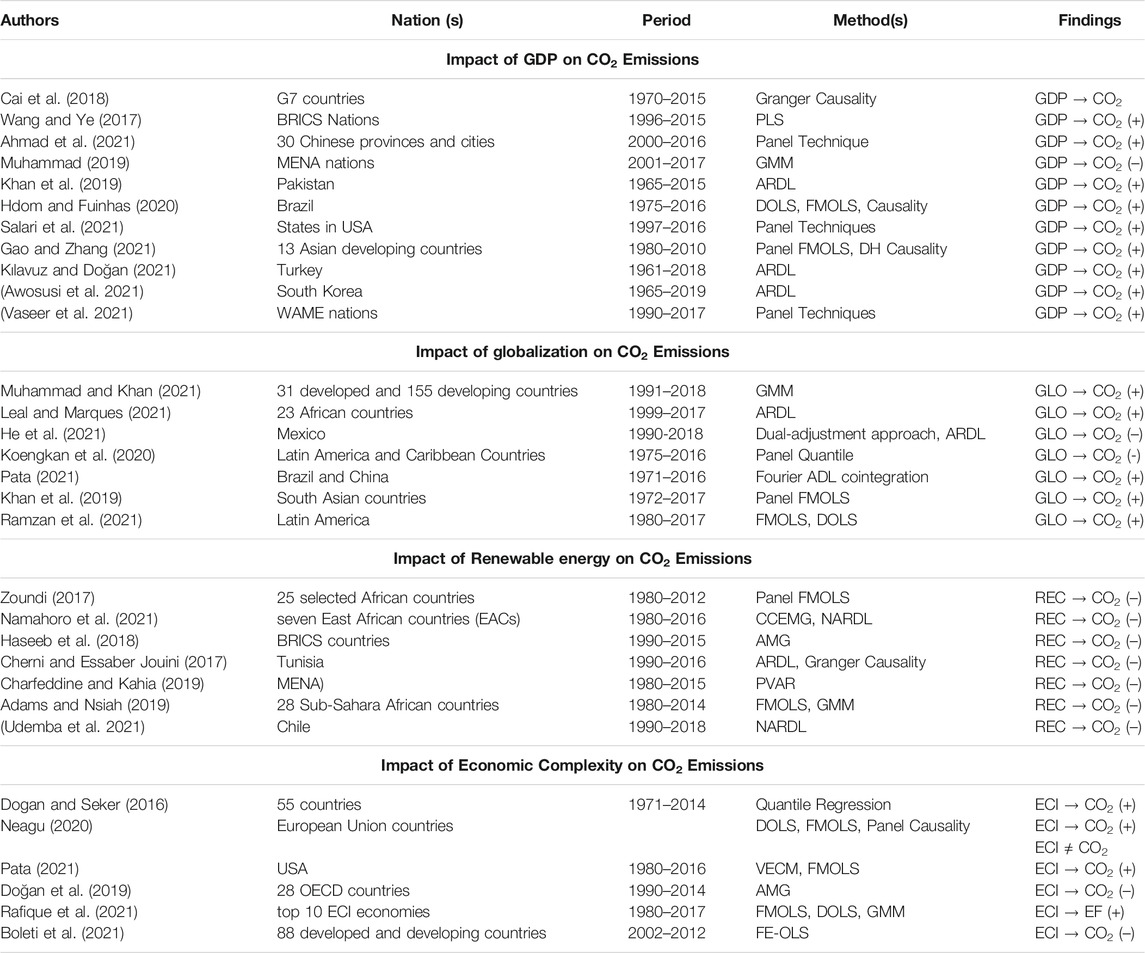
TABLE 1. Summary of studies.
Methodology
Theoretical Underpinning and Data
The theoretical foundation of this research is centered on the EKC theory. Economic growth can have three separate effects on environmental degradation. CO2 is impacted by economic growth in three dissimilar ways namely scale, composition, and technique effects. According to the scale effect, economic development leads to environmental pollution at first because it requires more energy and resources, culminating in more waste and pollution (Alola, 2019; Shan et al., 2021). The structure of a country, on the other hand, influences the degree of emissions and materials required in the production process. Additionally, the composition effect predicts that structural changes from the industrial to service sectors would minimize the negative environmental consequences of economic development. Finally, the technique effect shows that when a country’s wealth grows, it adopts new and enhanced technology that boosts productivity while lowering emissions.
Economic complexity (ECI) is another major factor that may impact environmental quality. Economic complexity is a broader assessment of a country’s size, structural changes, and technological progress (Mealy and Teytelboym, 2020). Nonetheless, the complexity of an economy may assist governments in managing research, information, skills, and technical advancement, all of which support greener goods and ecologically friendly technologies, culminating in less ecological destruction (Abbasi et al., 2021). On the flipside, simple economies lack the means to manage efficient knowledge; as a result, goods are produced utilizing conventional technologies and nonrenewable energy sources. As a result, nonrenewable energy and old technology have a negative impact on the environment (Kirikkaleli and Adebayo, 2021).
Renewable energy is the cleanest kind of energy available, with no pollution or resource depletion, thus its use improves the environment. The most ecologically friendly sources of energy are solar and wind. Unlike fossil fuels, renewables are limitless. On the other hand, nonrenewable resources are limited and unsustainable, and their extensive usage amplifies climate change and global warming by increasing GHGs emissions (Ozturk and Acaravci, 2016). This implies that using nonrenewable energy produces more CO2, but using renewable energy reduces emissions.
Globalization boosts trade and economic expansion, which has an impact on energy consumption and the environment. While globalization has exacerbated the climate issue, it can also help to mitigate it. Moreover, globalization hastens the spread of eco-friendly technology via worldwide networks of industry flows of capital, and R&D (Ramzan et al., 2021). Furthermore, the proliferation of new technologies will make monitoring and openness on climate action easier. The present study is centered on the studies of Abbasi et al. (2021) and Ahmad et al. (2021) by incorporating renewable energy consumption into the model as follows:
Where “i,” denotes the cross-section, i.e., the top economic complexity economy. The period which is from 1993 to 2018 is depicted by t and α denotes the intercept term. The error term and parameters are illustrated by ε and
Estimation Strategy
Cross-Sectional Dependence Test
This study commenced by examining cross-sectional dependency (CD) because nations are linked via numerous economic, social, and cultural networks that may produce spillover effects. Consequently, the present research utilized CD tests to ascertain the cross-sectional dependence. The CSD test equation is stipulated as follows:
Where pairwise correlation is illustrated by ρij.
The null and alternative hypotheses are “there is no CD in the data” and “CD is present” respectively.
Slope Homogeneity Test
The next phase assesses the existence of slope heterogeneity amongst the cross-section units. The issue of heterogeneity must be determined because, due to differences in developing nation’s economic and demographic structure, there is a possibility of slope heterogeneity, which could potentially affect the consistency of panel estimators. For this reason, this study utilized the slope homogeneity method. The Hashem Pesaran and Yamagata (2008) test is illustrated below;
Where
The null and alternative hypotheses are “there is homogeneity” and “there is no homogeneity” respectively.
Stationarity Test
In the empirical analysis, it is essential to understand the stationarity features of series. Thus, we applied cross-sectionally augmented IPS (CIPS) to capture the series stationarity features. This approach is effective, specifically for heterogeneous slope and CD. The equations for these tests are as follows:
Where the first difference between averages and the lagged are illustrated by
The null and alternative hypotheses are “there is unit root” and “there is no unit root”.
Cointegration Test
It is essential to capture the long-run association among the variables of interest. Thus, the present research applied the Westerlund (2007) cointegration test to capture the long-run association between CO2 and regressors. Unlike the traditional cointegration tests (e.g., Kao and Pedroni), this test offers impartial outcomes in the presence of CD and heterogeneity. The cointegration test is presented as follows:
Where
The Westerlund cointegration statistics are presented as follows:
Where
Cross-Sectionally Augmented ARDL
Next, we used the cross-sectional augmented ARDL (CS-ARDL) model established by Chudik and Pesaran (2015) to evaluate the long-run and short-run effects of economic development, economic complexity, globalization, and renewable energy use on CO2 emissions. The CS-ARDL yields trustworthy results since it is resistant to endogeneity and non-stationarity issues, and it also overcomes cross-sectional dependency and heterogeneity challenges (Wang et al., 2021). The CS-ARDL Equations are presented as follows:
Where
Panel Causality
After verifying the connection between the independent and dependent variables, policymakers must understand the causal connection between the series under investigation. Therefore, the present research applied the Dumitrescu and Hurlin (2012) causality test to assess the variables causal association. As heterogeneity existed in the panels, the present study applied this test. In comparison with other panel causality tests, the DH causality test offers various benefits: 1) It regulates the panel data’s unobserved heterogeneity. 2) In the presence of heterogeneity and CSD, the test is appropriate. 3) It regulates the regression model’s heterogeneity as well as the causal relationship’s heterogeneity. 4) There are no requirements for the test in terms of cross-sectional unit size or time dimension. 5) In the event of imbalanced panels, the test is equally effective (Tufail et al., 2021). The panel DH causality equation is illustrated as follows:
The null and alternative hypotheses are “no causality” and “there is causality”.
Findings and Discussion
The empirical analyses commenced by taking a look at the descriptive statistics of CO2, ECI, GLO, REC, and GDP, which is reported in Table 2. GDP (39914.13) has the highest mean value, followed by GLO (79.52386), CO2 (9.628900), REC (4.936359), and ECI (1.772849). ECI (0.520993) has a more consistent score which is followed by CO2 (2.381198), REC (5.704039), GLO (8.262817), and GDP (17947.880) as revealed by the standard deviation. Furthermore, the skewness value disclosed that ECI and GLO are negatively skewed while CO2, GDP, and REC are skewed positively. The kurtosis value uncovered that all the series (GDP, REC, and GLO) are platykurtic (less than 3) whilst ECI and CO2 are leptokurtic (greater than 3).
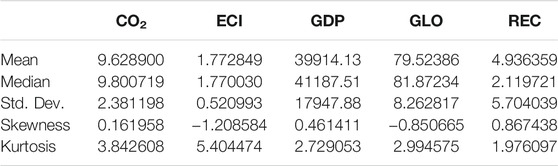
TABLE 2. Descriptive statistics.
The study proceeds by examining the cross-section dependence (CSD) and Slope heterogeneity which are reported in Tables 3, 4 respectively. The CSD results reported in Table 3 unveiled the issue of CSD as revealed by Breusch-Pagan LM, Pesaran scaled LM, Bias-corrected scaled LM, and Pesaran CD tests. Therefore, we fail to accept the null hypothesis. The CSD’s significance originates from the reality that advanced economies are interconnected in today’s globalized world. This indicates that any disturbance in the underlying variables of a nation might extend to other economies. As a result of the spillover effects, the variables are cross-sectionally dependent. Table 4 shows that the panel of the top seven economic complexity countries exhibit varying levels of technological advancement and growth. As a consequence, the findings suggest the occurrence of variation in slope coefficients. The study further applied the CIPS unit root test which is a second-generation test to detect the stationarity features of series and the outcomes are reported in Table 5. The outcomes of the test revealed that all the series are stationary at first difference.
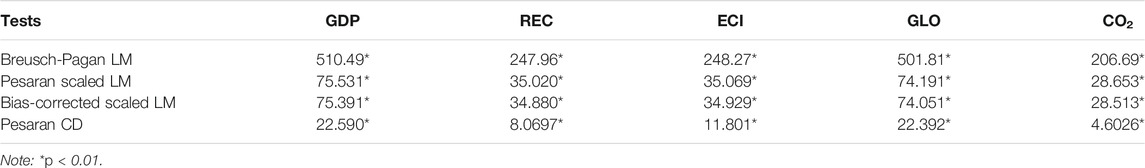
TABLE 3. CSD tests.
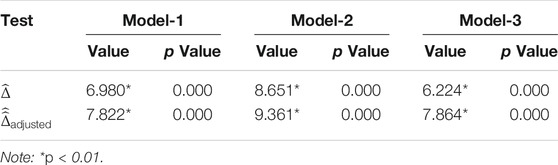
TABLE 4. slope Homogeneity Outcomes.
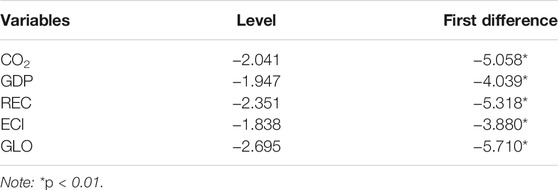
TABLE 5. CIPS.
To identify the cointegration between CO2 and the regressors, we applied the Westerlund cointegration test which is reported in Table 6. The outcomes from the test unveiled that in the long-run, the series are cointegrated. Therefore, the null hypothesis of “no cointegration” is refuted in this study. Therefore, the outcomes uncovered that there is longrun association between CO2 and REC, GDP, ECI, and GLO.
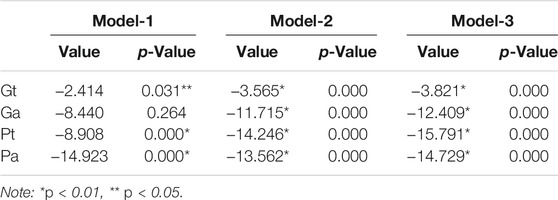
TABLE 6. cointegration test.
After the long-run association between CO2 and ECI, GDP, REC, and GLO has been confirmed, we continued by assessing the long-run and short-run influence of ECI, GDP, REC and GLO via the CS-ARDL. The outcomes of the CS-ARDL are presented in Table 7 and the outcomes disclosed the followings:
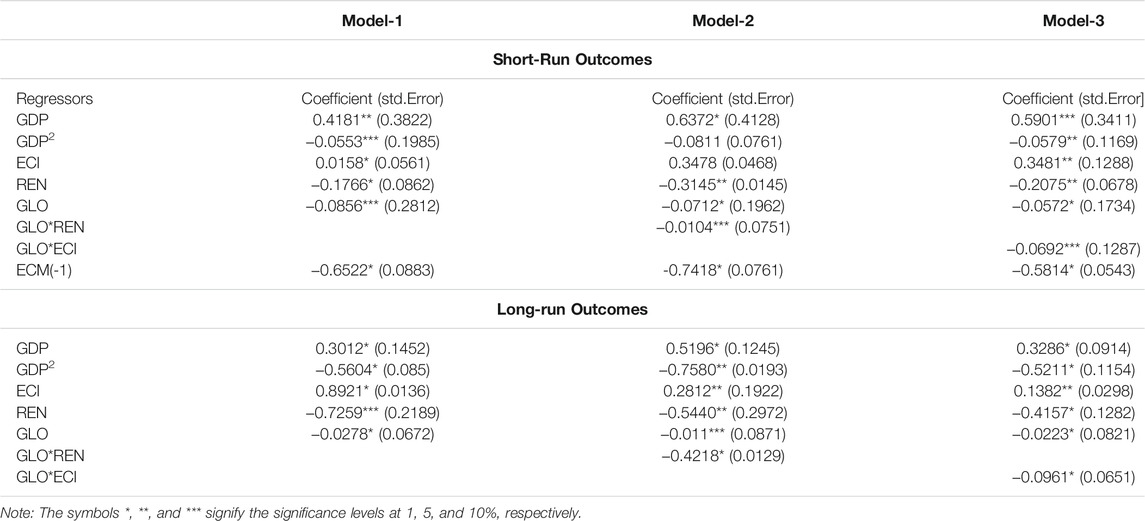
TABLE 7. CS-ARDL short and long-run outcomes.
The influence of GDP on CO2 emissions is positive and significant which implies that a 1% upsurge in GDP will trigger CO2 by 0.3012% in Model-1, 0.5196% in Model-2, and 0.3286 in Model-3 keeping other indicators constant. This implies that an upsurge in growth contributes to emissions in these nations. Similar results are also observed in the short-run. The findings show that in these nations, the scale impact outweighed the composition and technique effects, implying that economic expansion is driving environmental degradation by consuming more energy and producing more pollutants. This further indicates that these countries prioritize economic growth over environmental degradation. As a result, the environmental quality of these nations has degraded in the course of obtaining higher economic expansion. This outcome is in line with the study of Usman et al. (2020) in the United States who established negative and significant CO2-GDP connections. Furthermore, the study of Abbasi et al. (2021) corroborates this finding. However, this outcome is not consistent with the studies of Coelho et al. (2021) for South Korea, Akinsola et al. (2021) for Indonesia, Zhang et al. (2021) for Malaysia and Su et al. (2021) for Brazil and Yuping et al. 2021) for Argentina.
Moreover, the CO2-GDP2 interrelationship is negative which infers that a 1% upsurge in GDP2 mitigates CO2 by 0.5604% (model-1), 0.7580% (model-2), and 0.5211% (model-3) when other factors are kept constant. The negative CO2-GDP2 interrelationship was also confirmed by the short-run coefficients. As a result, in these countries, there is an inverted U-shaped link between economic expansion and environmental degradation. It demonstrates that after achieving a certain level of income, ecological problems can be mitigated with improved environmental law, technical advancements, sustainable manufacturing, and consumption habits. It also shows that these nation’s present policies are on the correct track, as their economies steadily transition away from polluting sectors and technology and toward green technologies and low-carbon clean industries. The inverted U-shaped growth-CO2 emissions nexus is verified in the long term by the negative and statistically significant CO2-GDP2 connection. As a result, economic expansion can be considered to damage the environment at first before benefiting it afterward. This result is consistent with the work of Lin and Zhu (2019) for Chinese province analysis and (Kihombo et al., 2021) WAME nations.
Furthermore, the outcomes from the Table disclosed that in the three models, the influence of economic complexity (ECI) on CO2 is positive and significant. This outcome demonstrates that an upsurge in ECI contributes to the degradation of the ecosystem. Therefore, ECI does not play a vital role in mitigating emissions in the selected countries. The possible explanation for this association is ascribed to the fact that product complexity and structural changes (production activities) are detrimental to the environment. More precisely, the study finds that diversifying export items increases CO2 emissions. The study outcome aligns with the studies of Abbasi et al. (2021) and Ahmad et al. (2021) who established that ECI harms the quality of the environment Nevertheless, this outcome refutes the finding of and Neagu (2020) (1) who found ECI-CO2 negative interrelation.
Moreover, in the three models, the renewable energy usage (REN) influence on CO2 is negative and significant which implies that REN can play a vital role in combating the degradation of the environment. This demonstrates that cleaner and greener energy sources lower emission levels in the atmosphere. These findings corroborate the theoretical expectation that renewable energy is environmentally friendly. The findings show that renewable energy is an effective instrument for achieving environmental and economic sustainability by reducing the negative consequences of human activities, such as land usage and water and commodities utilization. This outcome is anticipated and it concurs with the works of Apergis and Payne (2014) for sub-Saharan Africa nations, Adebayo and Kirikkaleli (2021) for Japan, and Tufail et al. (2021) for highly decentralized economies.
There effect of globalization on CO2 is negative which implies that 1% upsurge in GLO caused CO2 to decrease by 0.0278 (Model-1), 0.011 (Model-2), and 0.0223 (Model-3) respectively, keeping other factors constant. This infers that GLO helps in abating degradation of the environment in the top 7 economic complexity nations. Given that the globalization index and CO2 emissions levels have both increased over the years, this research contradicts the premise that globalization causes higher CO2 emissions. This research outcome complies with the study of Yuping et al. (2021) for Argentina who established that globalization helps in mitigating emissions levels in Argentina. The study of He et al. (2021) for Mexico between 1990 and 2018 also validates this outcome by establishing a negative connection between globalization and CO2. Nonetheless, this result is not consistent with the findings of Kirikkaleli et al. (2021) who discovered that the globalization process produces a significant increase in CO2 emissions due to the widespread use of energy in production and consumption activities in advanced and developing economies.
We examine the combined effects of globalization and renewable energy use to better understand the explanation for such a puzzling outcome. In the context of Model-2, it is observed that renewable energy consumption and globalization jointly mitigate the emissions level in the long run and short-run. Moreover, in model 3, globalization and economic complexity are found to jointly mitigate emissions of CO2 which implies that globalization plays a vital role in mitigating CO2 emissions.
The present study applied the CCEMG long-run estimator to check the consistency of the panel quantile regression outcomes in the top seven economic complexity countries (Japan, Germany, South Korea, Singapore, Czech, Austria, and Switzerland). The CS-ARDL estimator has been chastised for imposing a homogeneity constraint on long-run parameters when countries differ in socioeconomic structure and size. therefore, we utilized the Common Correlated Effect Mean Group (CCEMG) initiated (Pesaran, 2006) which allows the parameters to be heterogeneous in the long run as a robustness check. Table 8 presents the outcomes of the CCEMG. The CCEMG findings reinforce the reliability of the CS-ARDL outcomes since these other techniques provided outcomes that were identical with the CS-ARDL results.
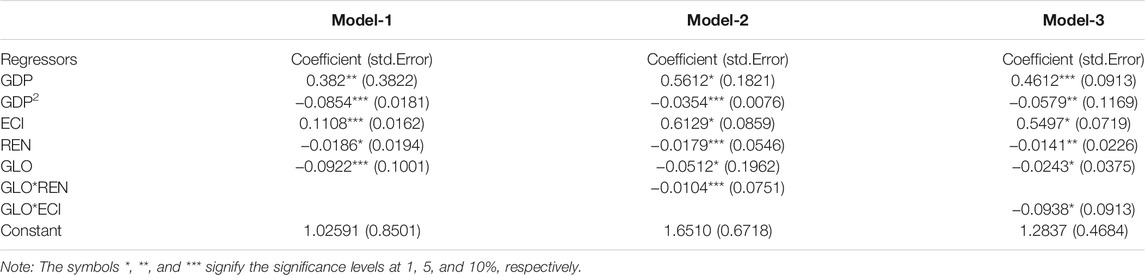
TABLE 8. Robustness check (CCEMG) outcomes.
The study assesses the causal interrelation between CO2 and GDP, ECI, GLO, and REC by applying the Dumitrescu and Hurlin panel causality test. The outcomes of the causality test are presented in Table 9 and the outcomes unveiled unidirectional causality from economic complexity to CO2. Furthermore, there is a feedback causal linkage between CO2 and GDP which suggests that GDP can predict CO2 and vice-versa. Moreover, one-way causality was observed from GLO to CO2 emissions. Lastly, there is proof of unidirectional causal interrelation from REC to CO2 which illustrates that REC can predict CO2 in the top seven economic complexity nations.
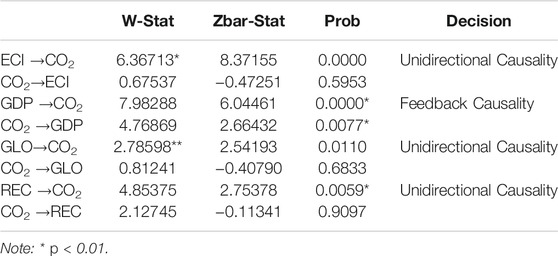
TABLE 9. Panel causality test.
Conclusion and Policy Path
Conclusion
The present research investigates the influence of economic growth (GDP), renewable energy consumption (REC), economic complexity index (ECI), and globalization (GLO) on CO2 emissions (CO2) utilizing the top 7 economic complexity economies. The study utilized panel data stretching from 1993 to 2018 to assess these connections. The present research utilized second-generation techniques to investigate these dynamics. The slope heterogeneity and Pesaran CD testing findings indicate a cross-sectional and slope heterogeneity across countries, allowing us to progress with the 2nd generation cointegration and unit root approaches. The CIPS unit root test outcomes unveiled that the variables are I(1). Furthermore, the outcomes of the cointegration tests (Westerlund and Pedroni) disclosed that the series have long-run association, i.e., CO2, and ECI, GLO, REC, and GDP cointegrated in the long run. Moreover, we applied CS-ARDL and CCEMG to identify the influence of ECI, GLO, REC, and GDP on CO2. The outcomes of the CS-ARDL and CCEMG unveiled that GDP and ECI contribute to the degradation of the environment, while REC and GLO mitigate CO2 emissions. Furthermore, the interaction between globalization and renewable energy utilization helps in abating CO2. In addition, the interaction between globalization and economic complexity helps in curbing CO2. The outcomes of CCEMG also validate the CS-ARDL outcomes. Furthermore, we applied the panel causality test to identify the causal impact of ECI, GLO, REC, and GDP on CO2, and the outcomes disclosed feedback causal linkage between CO2 and GDP while unidirectional causal linkage was found from REC, ECI and GLO to CO2. This outcome illustrates that any policy that will influence ECI, GLO and REC will have a significant impact on environmental sustainability. Additionally, any policy that will promote economic growth will impact CO2 and vice versa.
Policy Recommendation
In reaction to the ECI outcome, we recommend that the top seven economic complexity nations develop more sophisticated environmental quality modification goods. Furthermore, if nations accelerate their transition from a primary structure to a higher technological structure, they may have a positive ecological effect. Furthermore, authorities should delegate responsibility to lower authorities to modify the environment. A decentralizing state is more keen to encourage carbon-emitting operations by upholding high-quality standards and establishing a freeloader program to sell its polluting industries to nearby areas. Smaller state entities, on the other hand, are more inclined to track heavily polluting businesses and improve environmental efficiency.
In addition, government officials and policymakers should improve programs that encourage successful renewable energy usage policies. This would reduce the degree of ecological damage while increasing the real output and ensuring the sustainability of the environment. Furthermore, the significance of renewable energy consumption indicates that these economies are on the correct track towards decarbonization and sustainable growth. Nonetheless, policymakers must take proactive steps to diversify sources of energy to reduce reliance on fossil fuels and increase the use of greener energy.
Although globalization has been proven to contribute to environmental sustainability in these nations, it is critical to guarantee that the increase in energy demand caused by globalization is matched by renewable energy supplies. In this sense, policymakers in these countries can aim to trade REC from neighboring nations, therefore enhancing the beneficial environmental results connected with trade globalization. Likewise, policymakers in these countries should consider soliciting FDI to help expand their renewable energy sectors. It is reasonable to assume that financial globalization-induced FDI inflows can culminate into technical spillover, which will alleviate the technological restrictions that have hampered renewable energy adoption in these countries.
Moreover, economic efforts aimed at creating a low-carbon ecosystem will encourage long-term investment in clean technologies, preventing further carbonization of the top 7 economic complexity countries structures. If the necessary actions are taken, the economic system will gradually decarbonize.
In the future, researchers may examine the influence of economic complexity on the environment by employing alternative time series and panel techniques for dissimilar nations or groups of nations. Nation groupings may also be evaluated as emerging and advanced economies. These efforts would aid in our understanding of the influence of economic complexity on ecological damage.
Data Availability Statement
The original contributions presented in the study are included in the article/Supplementary Material, further inquiries can be directed to the corresponding author.
Author Contributions
All authors listed have made a substantial, direct, and intellectual contribution to the work and approved it for publication.
Funding
This research was supported by Instituto Politécnico de Lisboa. We thank Instituto Politécnico de Lisboa for providing funding for this study.
Conflict of Interest
The authors declare that the research was conducted in the absence of any commercial or financial relationships that could be construed as a potential conflict of interest.
Publisher’s Note
All claims expressed in this article are solely those of the authors and do not necessarily represent those of their affiliated organizations, or those of the publisher, the editors and the reviewers. Any product that may be evaluated in this article, or claim that may be made by its manufacturer, is not guaranteed or endorsed by the publisher.
Footnotes
1https://oec.world/en/rankings/country/eci/ (Accessed: January, 2021).
References
Abbasi, K. R., Lv, K., Radulescu, M., and Shaikh, P. A. (2021). Economic Complexity, Tourism, Energy Prices, and Environmental Degradation in the Top Economic Complexity Countries: Fresh Panel Evidence. Environ. Sci. Pollut. Res. doi:10.1007/s11356-021-15312-4
Adams, S., and Nsiah, C. (2019). Reducing Carbon Dioxide Emissions; Does Renewable Energy Matter? Sci. Total Environ. 693, 133288. doi:10.1016/j.scitotenv.2019.07.094
Adebayo, T. S., Akinsola, G. D., Kirikkaleli, D., Bekun, F. V., Umarbeyli, S., and Osemeahon, O. S. (2021). Economic Performance of Indonesia amidst CO2 Emissions and Agriculture: A Time Series Analysis. Environ. Sci. Pollut. Res. 28, 47942–47956. doi:10.1007/s11356-021-13992-6
Adebayo, T. S., Coelho, M. F., Onbaşıoğlu, D. Ç., Rjoub, H., Mata, M. N., Carvalho, P. V., et al. (2021). Modeling the Dynamic Linkage between Renewable Energy Consumption, Globalization, and Environmental Degradation in South Korea: Does Technological Innovation Matter? Energies 14 (14), 4265. doi:10.3390/en14144265
Adebayo, T. S., and Kirikkaleli, D. (2021). Impact of Renewable Energy Consumption, Globalization, and Technological Innovation on Environmental Degradation in Japan: Application of Wavelet Tools. Environ. Dev. Sustain. doi:10.1007/s10668-021-01322-2
Adebayo, T. S., Ramzan, M., Iqbal, H. A., Awosusi, A. A., and Akinsola, G. D. (2021). The Environmental Sustainability Effects of Financial Development and Urbanization in Latin American Countries. Environ. Sci. Pollut. Res. doi:10.1007/s11356-021-14580-4
Adebayo, T. S. (2020). Revisiting the EKC Hypothesis in an Emerging Market: An Application of ARDL-Based Bounds and Wavelet Coherence Approaches. SN Appl. Sci. 2 (12), 1945. doi:10.1007/s42452-020-03705-y
Adebayo, T. S., Rjoub, H., Akinsola, G. D., and Oladipupo, S. D. (2021). The Asymmetric Effects of Renewable Energy Consumption and Trade Openness on Carbon Emissions in Sweden: New Evidence from Quantile-On-Quantile Regression Approach. Environ. Sci. Pollut. Res., 1–12. doi:10.1007/s11356-021-15706-4
Adebola Solarin, S., Al-Mulali, U., and Ozturk, I. (2017). Validating the Environmental Kuznets Curve Hypothesis in India and China: The Role of Hydroelectricity Consumption. Renew. Sustain. Energ. Rev. 80, 1578–1587. doi:10.1016/j.rser.2017.07.028
Ahmad, M., Ahmed, Z., Majeed, A., and Huang, B. (2021). An Environmental Impact Assessment of Economic Complexity and Energy Consumption: Does Institutional Quality Make a Difference? Environ. Impact Assess. Rev. 89, 106603. doi:10.1016/j.eiar.2021.106603
Alola, A. A. (2019). The Trilemma of Trade, Monetary and Immigration Policies in the United States: Accounting for Environmental Sustainability. Sci. Total Environ. 658, 260–267. doi:10.1016/j.scitotenv.2018.12.212
Apergis, N., and Payne, J. E. (2014). Renewable Energy, Output, CO2 Emissions, and Fossil Fuel Prices in Central America: Evidence from a Nonlinear Panel Smooth Transition Vector Error Correction Model. Energ. Econ. 42, 226–232. doi:10.1016/j.eneco.2014.01.003
Awosusi, A. A., Kirikkaleli, D., Akinsola, G. D., Adebayo, T. S., and Mwamba, M. N. (2021). Can CO2 emissions and energy consumption determine the economic performance of South Korea? A time series analysis. Environ. Sci. Pollut. Res. 1–16.
Balsalobre-Lorente, D., Leitão, N. C., and Bekun, F. V. (2021). Fresh Validation of the Low Carbon Development Hypothesis under the EKC Scheme in Portugal, Italy, Greece and Spain. Energies 14 (1), 250. doi:10.3390/en14010250
Boleti, E., Garas, A., Kyriakou, A., and Lapatinas, A. (2021). Economic Complexity and Environmental Performance: Evidence from a World Sample. Environ. Model. Assess. 26 (3), 251–270. doi:10.1007/s10666-021-09750-0
Cai, Y., Sam, C. Y., and Chang, T. (2018). Nexus between Clean Energy Consumption, Economic Growth and CO2 Emissions. J. Clean. Prod. 182, 1001–1011. doi:10.1016/j.jclepro.2018.02.035
Can, M., and Gozgor, G. (2016). Dynamic Relationships Among CO2 Emissions, Energy Consumption, Economic Growth, and Economic Complexity in France. SSRN J. doi:10.2139/ssrn.2756638
Charfeddine, L., and Kahia, M. (2019). Impact of Renewable Energy Consumption and Financial Development on CO2 Emissions and Economic Growth in the MENA Region: A Panel Vector Autoregressive (PVAR) Analysis. Renew. Energ. 139, 198–213. doi:10.1016/j.renene.2019.01.010
Cherni, A., and Essaber Jouini, S. (2017). An ARDL Approach to the CO2 Emissions, Renewable Energy and Economic Growth Nexus: Tunisian Evidence. Int. J. Hydrogen Energ. 42 (48), 29056–29066. doi:10.1016/j.ijhydene.2017.08.072
Chudik, A., and Pesaran, M. H. (2015). Common correlated effects estimation of heterogeneous dynamic panel data models with weakly exogenous regressors. J. Econ. 188 (2), 393–420.
Dogan, E., and Seker, F. (2016). Determinants of CO2 Emissions in the European Union: The Role of Renewable and Non-renewable Energy. Renew. Energ. 94, 429–439. doi:10.1016/j.renene.2016.03.078
Doğan, B., Saboori, B., and Can, M. (2019). Does Economic Complexity Matter for Environmental Degradation? an Empirical Analysis for Different Stages of Development. Environ. Sci. Pollut. Res. 26 (31), 31900–31912. doi:10.1007/s11356-019-06333-1
Dreher, A. (2006). Does Globalization Affect Growth? Evidence from a New index of Globalization. Appl. Econ. 38 (10), 1091–1110. doi:10.1080/00036840500392078
Dumitrescu, E.-I., and Hurlin, C. (2012). Testing for Granger Non-causality in Heterogeneous Panels. Econ. Model. 29 (4), 1450–1460. doi:10.1016/j.econmod.2012.02.014
Gao, J., and Zhang, L. (2021). Does Biomass Energy Consumption Mitigate CO2 Emissions? the Role of Economic Growth and Urbanization: Evidence from Developing Asia. J. Asia Pac. Economy 26 (1), 96–115. doi:10.1080/13547860.2020.1717902
Grossman, G. M., and Krueger, A. B. (1991). “Environmental Impacts of a North American Free Trade Agreement,” in Papers (No. 158; Papers) (Princeton: Woodrow Wilson School - Public and International Affairs). doi:10.3386/w3914Available at: https://ideas.repec.org/p/fth/priwpu/158.html
Gygli, S., Haelg, F., Potrafke, N., and Sturm, J. E. (2019). The KOF Globalisation Index–Revisited. Rev. Int. Org. 14 (3), 543–574.
Haseeb, A., Xia, E., Baloch, M. A., and Abbas, K. (2018). Financial Development, Globalization, and CO2 Emission in the Presence of EKC: Evidence from BRICS Countries. Environ. Sci. Pollut. Res. 25 (31), 31283–31296. doi:10.1007/s11356-018-3034-7
Hashem Pesaran, M., and Yamagata, T. (2008). Testing Slope Homogeneity in Large Panels. J. Econom. 142 (1), 50–93. doi:10.1016/j.jeconom.2007.05.010
Hdom, H. A. D., and Fuinhas, J. A. (2020). Energy Production and Trade Openness: Assessing Economic Growth, CO2 Emissions and the Applicability of the Cointegration Analysis. Energ. Strategy Rev. 30, 100488. doi:10.1016/j.esr.2020.100488
He, X., Adebayo, T. S., Kirikkaleli, D., and Umar, M. (2021). Consumption-based Carbon Emissions in Mexico: An Analysis Using the Dual Adjustment Approach. Sustainable Prod. Consumption 27, 947–957. doi:10.1016/j.spc.2021.02.020
Hidalgo, C. A., and Hausmann, R. (2009). The Building Blocks of Economic Complexity. Proc. Natl. Acad. Sci. 106 (26), 10570–10575. doi:10.1073/pnas.0900943106
Khan, M. K., Teng, J.-Z., Khan, M. I., and Khan, M. O. (2019). Impact of Globalization, Economic Factors and Energy Consumption on CO2 Emissions in Pakistan. Sci. Total Environ. 688, 424–436. doi:10.1016/j.scitotenv.2019.06.065
Kihombo, S., Vaseer, A. I., Ahmed, Z., Chen, S., Kirikkaleli, D., and Adebayo, T. S. (2021). Is There a Tradeoff between Financial Globalization, Economic Growth, and Environmental Sustainability? an Advanced Panel Analysis. Environ. Sci. Pollut. Res.. doi:10.1007/s11356-021-15878-z
Kirikkaleli, D., and Adebayo, T. S. (2021). Do public-private Partnerships in Energy and Renewable Energy Consumption Matter for Consumption-Based Carbon Dioxide Emissions in India?. Environ. Sci. Pollut. Res. 28 (23), 30139–30152. doi:10.1007/s11356-021-12692-5
Kirikkaleli, D., Adebayo, T. S., Khan, Z., and Ali, S. (2021). Does Globalization Matter for Ecological Footprint in Turkey? Evidence from Dual Adjustment Approach. Environ. Sci. Pollut. Res. 28 (11), 14009–14017. doi:10.1007/s11356-020-11654-7
Koengkan, M., Fuinhas, J. A., and Santiago, R. (2020). Asymmetric Impacts of Globalisation on CO2 Emissions of Countries in Latin America and the Caribbean. Environ. Syst. Decis. 40 (1), 135–147. doi:10.1007/s10669-019-09752-0
Kılavuz, E., and Doğan, İ. (2021). Economic Growth, Openness, Industry and CO2 Modelling: Are Regulatory Policies Important in Turkish Economies? Int. J. Low-Carbon Tech. 16 (2), 476–487. doi:10.1093/ijlct/ctaa070
Leal, P. H., and Marques, A. C. (2021). The Environmental Impacts of Globalisation and Corruption: Evidence from a Set of African Countries. Environ. Sci. Pol. 115, 116–124. doi:10.1016/j.envsci.2020.10.013
Leitão, N. C., and Lorente, D. B. (2020). The Linkage between Economic Growth, Renewable Energy, Tourism, CO2 Emissions, and International Trade: The Evidence for the European Union. Energies 13 (18), 4838. doi:10.3390/en13184838
Leitão, N. C. (2021a). Testing the Role of Trade on Carbon Dioxide Emissions in Portugal. Economies 9 (1), 22. doi:10.3390/economies9010022
Leitão, N. C. (2021b). The Effects of Corruption, Renewable Energy, Trade and CO2 Emissions. Economies 9 (2), 62. doi:10.3390/economies9020062
Lin, B., and Zhu, J. (2019). Determinants of Renewable Energy Technological Innovation in China under CO2 Emissions Constraint. J. Environ. Manage. 247, 662–671. doi:10.1016/j.jenvman.2019.06.121
Lin, X., Zhao, Y., Ahmad, M., Ahmed, Z., Rjoub, H., and Adebayo, T. S. (2021). Linking Innovative Human Capital, Economic Growth, and CO2 Emissions: An Empirical Study Based on Chinese Provincial Panel Data. Int. J. Environ. Res. Public Health 18 (16), 8503. doi:10.3390/ijerph18168503
Mealy, P., and Teytelboym, A. (2020). Economic Complexity and the green Economy. Res. Pol. 2020, 103948. doi:10.1016/j.respol.2020.103948
Muhammad, B. (2019). Energy Consumption, CO2 Emissions and Economic Growth in Developed, Emerging and Middle East and North Africa Countries. Energy 179, 232–245. doi:10.1016/j.energy.2019.03.126
Muhammad, B., and Khan, S. (2021). Understanding the Relationship between Natural Resources, Renewable Energy Consumption, Economic Factors, Globalization and CO 2 Emissions in Developed and Developing Countries. Nat. Resour. Forum 45 (2), 138–156. doi:10.1111/1477-8947.12220
Namahoro, J. P., Wu, Q., Xiao, H., and Zhou, N. (2021). The Impact of Renewable Energy, Economic and Population Growth on CO2 Emissions in the East African Region: Evidence from Common Correlated Effect Means Group and Asymmetric Analysis. Energies 14 (2), 312. doi:10.3390/en14020312
Neagu, O. (2020). Economic Complexity and Ecological Footprint: Evidence from the Most Complex Economies in the World. Sustainability 12 (21), 9031. doi:10.3390/su12219031
Orhan, A., Adebayo, T. S., Genç, S. Y., and Kirikkaleli, D. (2021). Investigating the Linkage between Economic Growth and Environmental Sustainability in India: Do Agriculture and Trade Openness Matter? Sustainability 13 (9), 4753. doi:10.3390/su13094753
Ozturk, I., and Acaravci, A. (2016). Energy Consumption, CO2 emissions, Economic Growth, and Foreign Trade Relationship in Cyprus and Malta. Energ. Sourc. B: Econ. Plann. Pol. 11 (4), 321–327. doi:10.1080/15567249.2011.617353
Pata, U. K. (2021). Renewable and Non-renewable Energy Consumption, Economic Complexity, CO2 Emissions, and Ecological Footprint in the USA: Testing the EKC Hypothesis with a Structural Break. Environ. Sci. Pollut. Res. 28 (1), 846–861. doi:10.1007/s11356-020-10446-3
Pesaran, M. H. (2006). Estimation and Inference in Large Heterogeneous Panels with a Multifactor Error Structure. Econometrica 74 (4), 967–1012. doi:10.1111/j.1468-0262.2006.00692.x
Rafique, M. Z., Nadeem, A. M., Xia, W., Ikram, M., Shoaib, H. M., and Shahzad, U. (2021). Does Economic Complexity Matter for Environmental Sustainability? Using Ecological Footprint as an Indicator. Environ. Dev. Sustain.. doi:10.1007/s10668-021-01625-4
Salari, M., Javid, R. J., and Noghanibehambari, H. (2021). The Nexus between CO2 Emissions, Energy Consumption, and Economic Growth in the U.S. Econ. Anal. Pol. 69, 182–194. doi:10.1016/j.eap.2020.12.007
Sarkodie, S. A., and Strezov, V. (2019). Effect of Foreign Direct Investments, Economic Development and Energy Consumption on Greenhouse Gas Emissions in Developing Countries. Sci. Total Environ. 646, 862–871. doi:10.1016/j.scitotenv.2018.07.365
Shahbaz, M., Sharma, R., Sinha, A., and Jiao, Z. (2021). Analyzing Nonlinear Impact of Economic Growth Drivers on CO2 Emissions: Designing an SDG Framework for India. Energy Policy 148, 111965. doi:10.1016/j.enpol.2020.111965
Shan, S., Ahmad, M., Tan, Z., Adebayo, T. S., Man Li, R. Y., and Kirikkaleli, D. (2021). The Role of Energy Prices and Non-linear Fiscal Decentralization in Limiting Carbon Emissions: Tracking Environmental Sustainability. Energy 234, 121243. doi:10.1016/j.energy.2021.121243
Soylu, Ö. B., Adebayo, T. S., and Kirikkaleli, D. (2021). The Imperativeness of Environmental Quality in China amidst Renewable Energy Consumption and Trade Openness. Sustainability 13 (9), 5054. doi:10.3390/su13095054
Su, Z.-W., Umar, M., Kirikkaleli, D., and Adebayo, T. S. (2021). Role of Political Risk to Achieve Carbon Neutrality: Evidence from Brazil. J. Environ. Manage. 298, 113463. doi:10.1016/j.jenvman.2021.113463
Tufail, M., Song, L., Adebayo, T. S., Kirikkaleli, D., and Khan, S. (2021). Do fiscal Decentralization and Natural Resources Rent Curb Carbon Emissions? Evidence from Developed Countries. Environ. Sci. Pollut. Res. 28, 49179–49190. doi:10.1007/s11356-021-13865-y
Udemba, E. N., Ahmed, Z., Adebayo, T. S., and Kirikkaleli, D. (2021). Determinants of consumption-based carbon emissions in Chile: an application of non-linear ARDL. Environ. Sci. Pollut. Res. 1–15.
Usman, O., Iortile, I. B., and Ike, G. N. (2020). Enhancing Sustainable Electricity Consumption in a Large Ecological reserve-based Country: the Role of Democracy, Ecological Footprint, Economic Growth, and Globalisation in Brazil. Environ. Sci. Pollut. Res. 27 (12), 13370–13383. doi:10.1007/s11356-020-07815-3
Vaseer, A. I., Ahmed, Z., Chen, S., Kihombo, S., Kirikkaleli, D., and Adebayo, T. S. (2021). Is there a tradeoff between financial globalization, economic growth, and environmental sustainability? An advanced panel analysis. Environ. Sci. Pollut. Res. 1–11.
Wang, Z., and Ye, X. (2017). Re-examining Environmental Kuznets Curve for China's City-Level Carbon Dioxide (CO2) Emissions. Spat. Stat. 21, 377–389. doi:10.1016/j.spasta.2016.09.005
Westerlund, J. (2007). Testing for Error Correction in Panel Data. Oxford Bull. Econ. Stats 69 (6), 709–748. doi:10.1111/j.1468-0084.2007.00477.x
Yuping, L., Ramzan, M., Xincheng, L., Murshed, M., Awosusi, A. A., Bah, S. I., et al. (2021). Determinants of Carbon Emissions in Argentina: The Roles of Renewable Energy Consumption and Globalization. Energ. Rep. 7, 4747–4760. doi:10.1016/j.egyr.2021.07.065
Zhang, L., Li, Z., Kirikkaleli, D., Adebayo, T. S., Adeshola, I., and Akinsola, G. D. (2021). Modeling CO2 Emissions in Malaysia: An Application of Maki Cointegration and Wavelet Coherence Tests. Environ. Sci. Pollut. Res. 28 (20), 26030–26044. doi:10.1007/s11356-021-12430-x
Keywords: CO2 emissions, economic complexity, globalization, renewable energy consumption, economic growth
Citation: Martins JM, Adebayo TS, Mata MN, Oladipupo SD, Adeshola I, Ahmed Z and Correia AB (2021) Modeling the Relationship Between Economic Complexity and Environmental Degradation: Evidence From Top Seven Economic Complexity Countries. Front. Environ. Sci. 9:744781. doi: 10.3389/fenvs.2021.744781
Received: 20 July 2021; Accepted: 01 September 2021;
Published: 21 September 2021.
Edited by:
Faik Bilgili, Erciyes University, TurkeyReviewed by:
Nuno Carlos Leitão, Polytechnic Institute of Santarém, PortugalBuket Altinoz, Nişantaşı University, Turkey
Copyright © 2021 Martins, Adebayo, Mata, Oladipupo, Adeshola, Ahmed and Correia. This is an open-access article distributed under the terms of the Creative Commons Attribution License (CC BY). The use, distribution or reproduction in other forums is permitted, provided the original author(s) and the copyright owner(s) are credited and that the original publication in this journal is cited, in accordance with accepted academic practice. No use, distribution or reproduction is permitted which does not comply with these terms.
*Correspondence: Tomiwa Sunday Adebayo, dHdhaWtsaW5lQGdtYWlsLmNvbQ==