 Muntjeer Ali1*
 Abdulaziz Ibrahim Almohana2
 Abdulrhman Fahmi Alali2
 Mohab Amin Kamal2
 Abbas Khursheed3
 Anwar Khursheed2,3
 A. A. Kazmi1
- 1Environmental Engineering Group, Civil Engineering Department, Indian Institute of Technology Roorkee (IITR) Uttarakhand (India), Roorkee, India
- 2Department of Civil Engineering, College of Engineering, King Saud University, Riyadh, Saudi Arabia
- 3Department of Civil Engineering, Z.H. College of Engineering and Technology, AMU, Aligarh, India
- 4School of Civil Engineering, Vellore Institute of Technology (VIT), Chennai, India
The stringency in effluent discharge and reuse standards has made it extremely expensive to discharge the effluents safely or reuse them. Therefore, existing wastewater treatment plants should be evaluated and improved or augmented. With this aim, five existing common effluent treatment plants (CETPs) in North India were evaluated, including: the State infrastructure Development Corporation Uttrakhand Limited (SIDCUL) Haridwar, which processes 4.5 Million Liters per day (MLD); the Industrial Model Township (IMT) Manesar Gurgaon, 55 MLD (comprising two streams of 25 and 30 MLD each); the Lawrence Road Industrial Area (LRIA), Delhi, 12MLD (12MLD LRIA); Mayapuri Industrial Area (MIA), Delhi, 12MLD; and the Integrated Industrial Estate (IIE) SIDCUL Pantnagar, 4.0 MLD. These plants were designed to produce treated effluent for non-potable reuse. Results showed that the integrated efficiency (IEa) of all CETPs was 10–20% larger than standard integrated efficiency (IEs), indicating the suitability of the technology, except for 12MLD at MIA CETP where the IEa was 20% lower than IEs, due to the absence of any biological unit in the process. Combined post-treatment of secondary effluent by coagulation, Ultrafiltration (UF), followed by ozonation for CETP SIDCUL Haridwar, was also conducted for its non-potable water reuse. This process was able to reduce Biochemical Oxygen Demand (BOD) by 77%, Chemical Oxygen Demand (COD) by 76%, turbidity by 96%, and Total Suspended Solids (TSS) by 100%. All these parameters confirmed the effluent standards for non-potable reuse. The color was reduced to 4.0 from 42.0 Pt-Co units by the exposure ozone concentration of 8.3 mg/L for up to 4.0 min on the treated water from SIDCUL CETP, which reduced the color by 90% and complied with reuse standards. Hence Combined post treatment by coagulation, UF followed Ozonation of secondary treated effluent could be a better option for the potable reuse of treated water in various domestic and industrial applications.
Introduction
Globally, approximately 80 countries and 40% of the world’s population are facing water scarcity, and the demand for water doubles every 2 decades (Aziz et al., 2008). In India, about 500 billion cubic meters of fresh water are used annually for industrial activities including about 10 billion cubic meters by processing industries, 30 million cubic meters for refrigeration purposes, despite restrictions on direct use of freshwater in every category of industry. Various studies have shown that small and medium industries are the major contributor to water pollution. Industries such as Thermal power plants, Pulp and Paper, Textile, Steel, Sugar, Fertilizer, Heavy Engineering, and others that discharge 30,729 m3 of wastewater annually and/or consume 40,012 m3 annually. This amounts to 76.8% conversion of fresh water to wastewater, which ultimately ends up in natural water bodies. This indiscriminate disposal causes water pollution of natural resources and makes them unsafe for future potable reuse, increasing the cost of industries located downstream and higher industrial production costs, which eventually burden consumers.
Current wastewater treatment approaches are becoming increasingly expensive, as effluent discharge standards become more stringent day by day. However, technological advancement now makes it possible to treat wastewater for a variety of industrial reuse (Visvanathan and Asano, 2014). Small to medium scale industries often do not comply with these stringent reuse standards due to well-documented reasons, such as a lack of footprint assessment, specialized manpower, limited financial assets/funds, and high capital cost (Pathe et al., 2004). These problems could be reduced by the collective treatment of effluents from a large number of small-scale facilities at a single site where the effluent from each undergoes treatment (Padalkar, Kaur, and Kumar, 2016). This helps in terms of land conservation, better treatment at one location, easy operation and maintenance, shared expenses and is encouraged by regulating state agencies (Vyas et al., 2011).
The collective treatment of effluent at a CETPs is a suitable and recommended solution for small/medium scale industries. CETPs typically consist of the combined arrangements of separate unit processes, supporting the performance of other unit processes during wastewater treatment. The wastewater characteristics at the inlet and the anticipated quality of treated water determine the quantum of treatment required and hence the size and complex design of the plant (Jern, 2006; Ghumra D.P et al., 2021). Preliminary and primary treatment units are generally size-based separation units, which are required for a basic clean-up of the industrial effluents and hence followed by secondary and tertiary treatment methods. The primary treatment units can remove the COD and TSS over a range of 10–40% depending on the content of the effluent and applied technology. The secondary treatment processes reduce the COD, BOD, and TSS up to 85–95% for the industrial effluent. Tertiary units are typically required for final polishing the effluent by elimination of toxic and hazardous contaminants to the desired level. It has been reported that up to 99% of contaminant removal can be successfully obtained by the implementation of tertiary units (Ranade and Bhandari, 2014). The performance of CETPs in India until now has been unsatisfactory because of a wide variety of effluents, damage to treatment units, and clogging of the pumping system, etc. The presence of organic contaminants and pharmaceuticals is likely to affect the efficiency of CETPs (Padalkar and Kumar, 2019). As a result, secondary or tertiary treated effluent from CETPs has progressively been used to produce alternative water resources due to their accessibility (Michael-Kordatou et al., 2015). Namibia, California (United States), and Singapore have employed these efforts to overcome water scarcity and potable reuse (Harris-Lovett et al., 2015; Warsinger et al., 2018). Non-potable reuse of water from the effluent of sewage treatment plants (STP) is an economical and preferred way of saving water and has become a common practice. A number of studies have examined the reuse of greywater from domestic sewage (Grüttner et al., 1994). Since, CETP treats water both from domestic and industrial discharge, achieving standards for non-potable reuse from the effluent of a CETP is a challenging task because it is a huge capital cost intensive activity and there are stringent effluent reuse standards. In India, there are approximately 193 CETPs, out of which 45 units are operated in North India (14 in Haryana, 1 in Himachal Pradesh, 1 in Jammu and Kashmir, 13 in National Capital Territory (NCT), Delhi, 4 in Punjab, 8 in Uttar Pradesh and 4 in Uttarakhand) (CPCB, 2018). Most of the CETPs were designed and installed for reuse of treated water for non-potable purposes in industrial or other activities. The installed CETPs are equipped with primary to secondary biological treatment followed by tertiary treatment including pressure sand/activated carbon filtration. However, the CETPs may still require further evaluation to remove trace organics, heavy metals, and color (Gerrity et al., 2013). Regulating agencies have observed that CETPs do not discharge satisfactory effluent for reuse, because of technological/process design limitations and the massive fluctuation in the organic load of primary treated effluent from industries, which hampers the biological activity of aeration tanks due to varied pH and other operational parameters.
This study (funded by GIZ Germany and Gurugram Metropolitan Development Authority (GMDA), India) aimed at examining the status and performance evaluation of existing CETPs in northern India and undertook a lab-scale study based on combined coagulation, ultrafiltration, and ozonation of the secondary effluent from CETPs to produce water for non-potable reuse (Table 1). Figure 1 includes a detailed flow chart of the methodology adopted for this study.
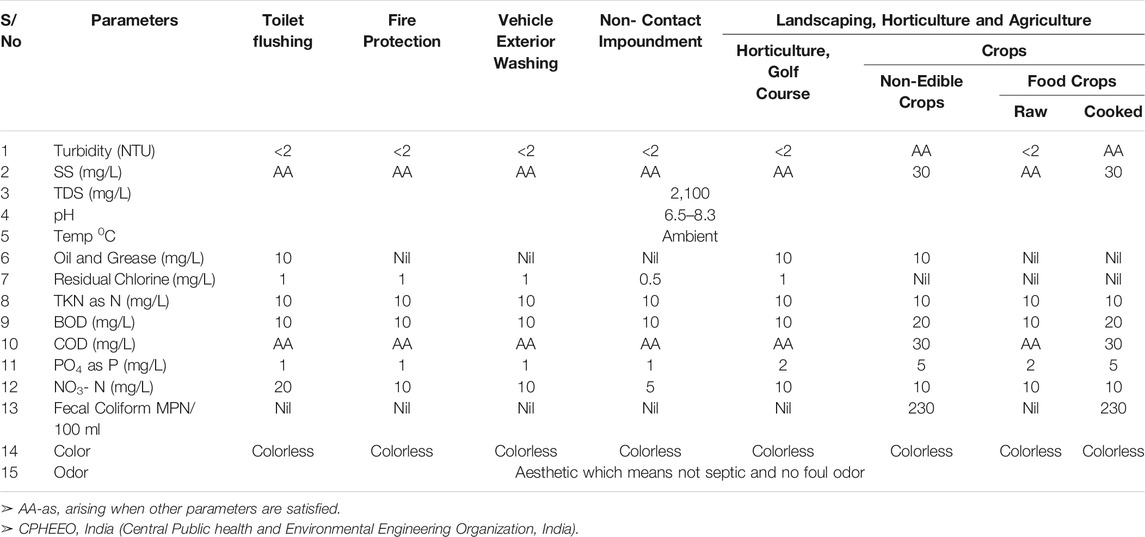
TABLE 1. Effluent Reuse recommendations (CPHEEO, 2013). Standards for treated wastewater reclamation and reuse, set by the Government of India regulating agency.
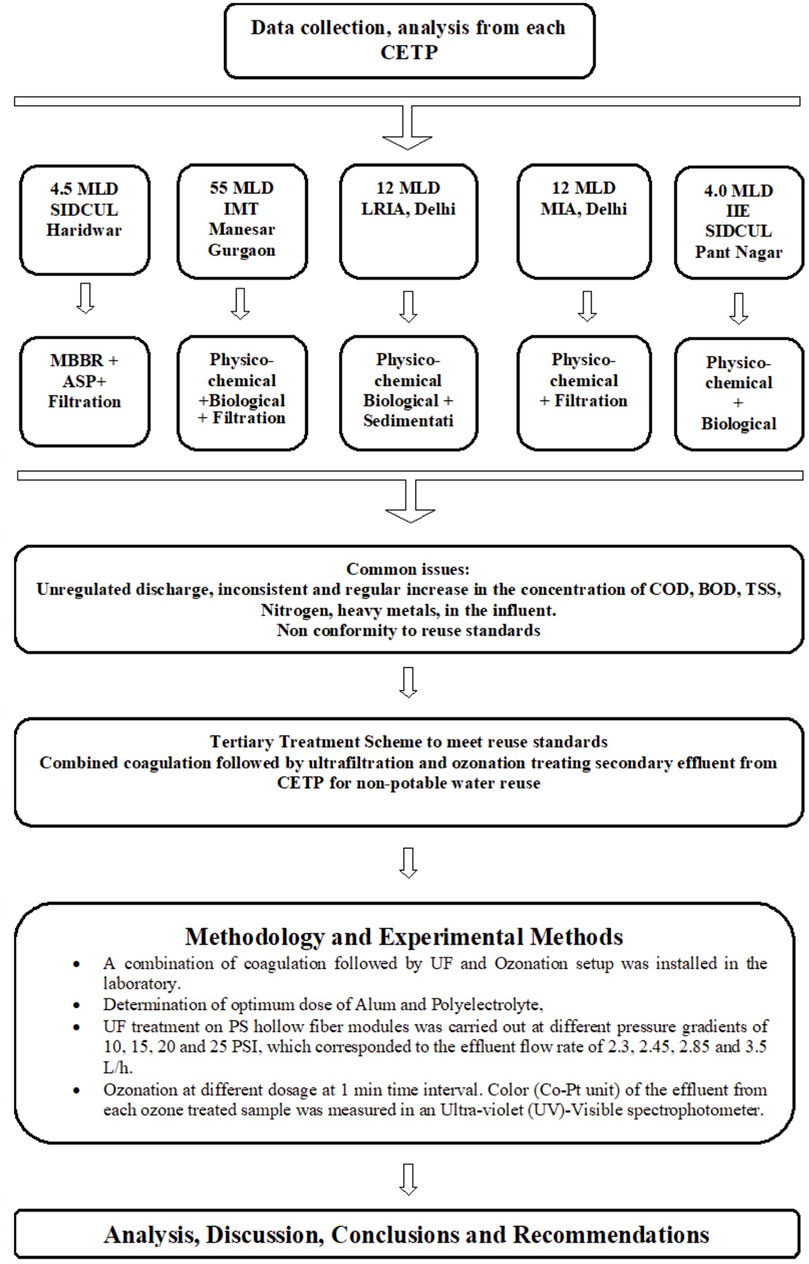
FIGURE 1. Detailed flow showing the adopted methodology for the Monitoring of five CETPS and process augmentation options to conform non-potable reuse.
Materials and Methods
Status of Common Effluent Treatment Plants
The current status of CETPs is given in Table 2. The 4.5 MLD CETP at IIE SIDCUL Haridwar, was operating at 100% capacity. It was upgraded and inserted the MBBR process by removing Physico-chemical treatment due to a variety of contributing industries, its unregulated discharge, inconsistent and regular increase in the concentration of COD, BOD, TSS, Nitrogen, heavy metals, and other pollutants in the influent. It was commissioned in 2008, and the treated effluent was discharged in the Sukhi river, which finally merges with the Ganga River. CETP at IMT Manesar was designed for 55 MLD and operates at 45 MLD (80% capacity). Since it receives wastewater from two equally divided areas it consisted of two streams of 25 and 35 MLD. Both streams have identical treatment processes (physical-chemical + Biological treatment and filtration). Between 10–15% of the treated effluent is reused in horticulture and gardening, while the rest is discharged to the Yamuna River. The CETPs at LRIA and MIA were both designed for 12 MLD and commissioned in 2004 and 2003, respectively. Both the CETPs operate at a very low capacity of 1.5 and 3.5 MLD due to the changes adopted by the industries in their manufacturing process. CETP at IIE Pantnagar was designed for 4 MLD and operates under capacity, at 2.1 MLD. The treatment scheme of this CETP includes physic-chemical and Biological + rapid sand and carbon filtration. The treated effluent is discharged to the Ganga river. All the CETPs in this study are located in a zone of 200–400 km in Northern India, where the climate, infrastructural, socio-economic, and political conditions are largely similar.
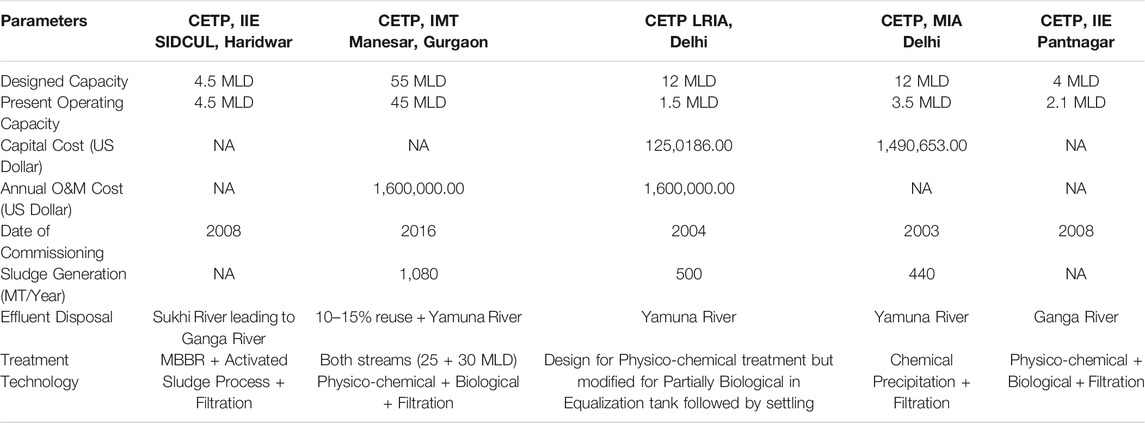
TABLE 2. Status of studied CETPs. Status report of 5 CETPs in three North Indian states, including design capacity and utilization, treatment scheme, disposal point, capital cost, O and M cost, and commissioning date.
Detailed Description of Common Effluent Treatment Plants
Treatment Scheme of 4.5 Million Liters Per Day Common Effluent Treatment Plants, Industrial Estate State Infrastructure Development Corporation Uttrakhand Limited, Haridwar
This CETP operates on a fully biological process, without any chemical addition. The influent flows through a rapid mixing and flocculation tank. First stage tube settlers then act as pre-settling tanks. The CETP scheme comprises one Raw Effluent Pump House (REPH), having course screen at upstream and fine screen downstream, one oil and grease trap unit, two equalization tanks, two pre-settling tanks (PSTs), an MBBR tank, aeration tank, secondary clarifier, Pressure Sand Filter (PSF), and Activated Carbon Filter (ACF). The schematic flow diagram of CETP is depicted in Figure 2.
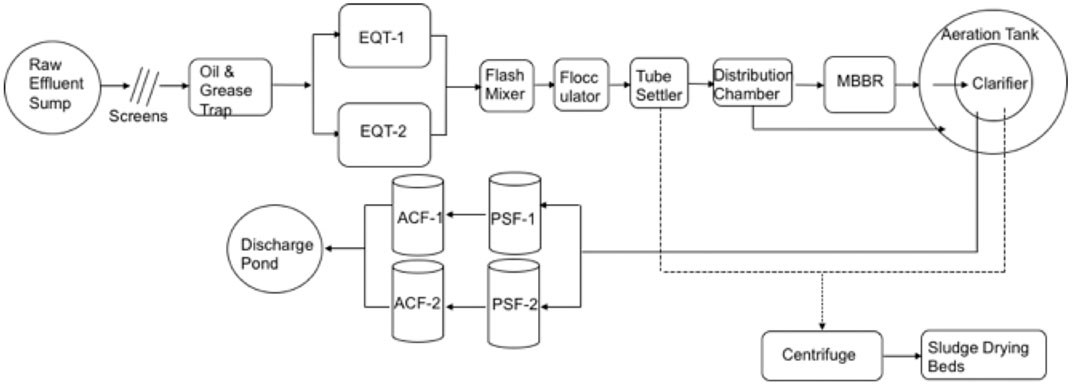
FIGURE 2. Schematic floe diagram of 4.5 MLD CETP IIE SIDCUL, Haridwar. Physico-chemical + MBBR base bilogical scheme (EQT - Equalization tanks).
Treatment Scheme of Common Effluent Treatment Plants 55 Million Liters Per Day at Industrial Model Township Manesar, Gurgaon
The integrated CETPs (25 MLD and 30 MLD) treatment system involved raw effluent collection followed by preliminary treatment (Screening, Grit Removal and, Equalization), Physico-chemical treatment (Clariflocculator for 25 MLD, and separate flocculators and clarifiers for 30 MLD), secondary biological treatment (Extended Aeration), and tertiary treatment by Dual Media Filtration (DMF) (Figure 3). Primary and secondary sludge generated by Physico-chemical and biological treatment is handled together in a gravity thickener and belt press. The dewatered sludge is disposed of in a hazardous waste disposal site.
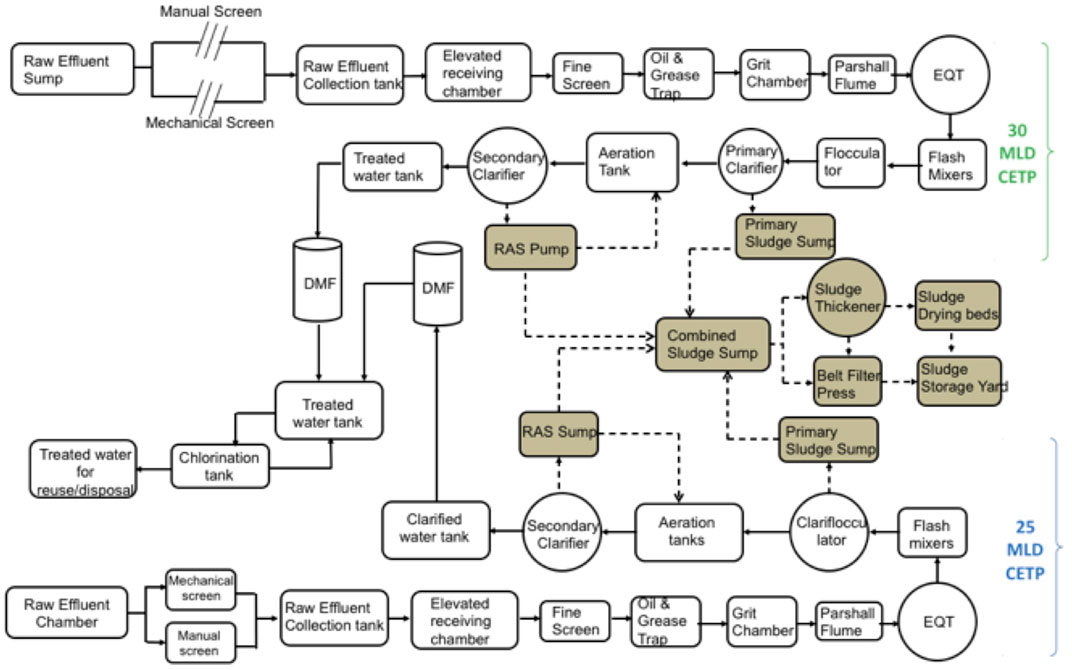
FIGURE 3. Schematic flow diagram of Integrated CETP (25 MLD and 30 MLD) in Manesar Gurgon. Physico-chemical + ASP base biological schemes (EQT - Equalization tanks, DMF - Dual Media Filter).
Treatment Scheme of Common Effluent Treatment Plants 12 Million Liters Per Day Lawrence Road, Delhi
This CETP was designed for a capacity of 12 MLD of industrial effluent but the flow was 2.5 MLD during the sampling period. At the time of the planning and design of the CETP in early 2000, the wastewater (primarily from a mix of several micro-, small- and medium-scale electroplating and other similar industrial units) was expected to carry higher levels of heavy metals, while its organic load was estimated to be very low, i.e., the BOD was estimated to be 89 mg/L. Given the expected nature of the wastewater, the treatment scheme comprised a series of Physico-chemical unit operations and did not include any biological unit process (Figure 4).
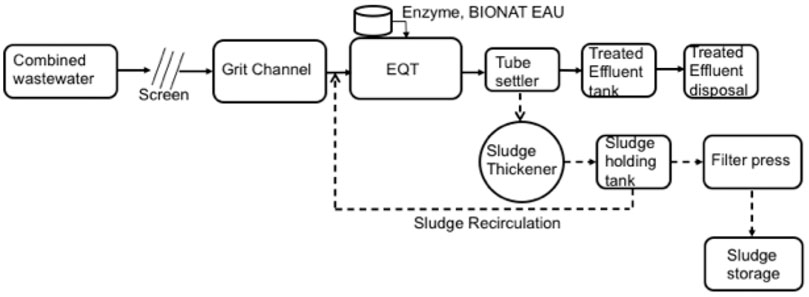
FIGURE 4. The Upgraded Process flow diagram of LRIA CETP. Physico-chemical + Enzyme base treatment schemes (EQT - Equalization tank).
As the CETP does not have a biological unit process for the removal of organics, i.e., reduction of BOD and ammonical nitrogen, etc., the operator adopted the practice of dosing commercially available bioculture. Dosage was reported to be 280 gm/MLD. To enhance the efficiency of the biological treatment, sludge recirculation an extent of 40% was being practiced.
Treatment Scheme of Common Effluent Treatment Plants 12 Million Liters Per Day Mayapuri, Delhi
Similar to the 12 MLD CETP at LRIA in Delhi, this treatment scheme lacks any biological unit process. Interestingly, the scheme consisted of pre-chlorination, which appeared to be not very relevant for an industrial wastewater treatment plant.
In addition, it was envisioned that this plant would reuse the treated effluent for horticulture purposes, possibly, and accordingly, the original scheme also included a tertiary treatment stage, which comprised a combination of dual media filters and activated carbon filters. The schematic process flow diagram is presented in Figure 5.
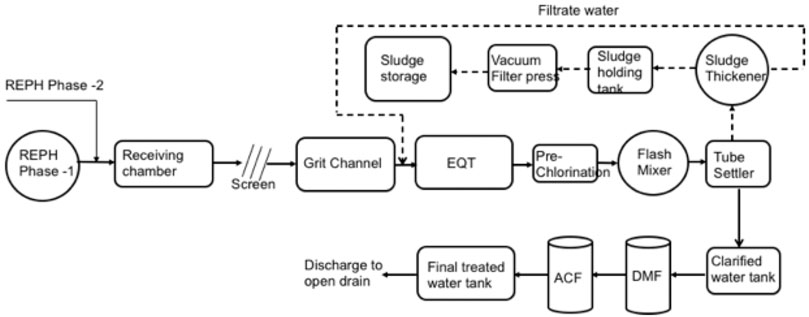
FIGURE 5. The Process flow diagram for MIA CEPT. Physico-chemical scheme (EQT - Equalization tanks, DMF - Dual Media Filter, ACF - Activated Carbon Filter).
Treatment Scheme of 4 Million Liters Per Day Common Effluent Treatment Plants Pantnagar
CETP at IIE SIDCUL Pantnagar is designed as Physico-chemical, followed by biological treatment and filtration. The CETP scheme comprised one Raw Effluent Pump chamber then mechanical bar screen and manual bar screens, one raw effluent sump, grit chamber, an oil and grease chamber, one equalization tank, flash mixer, Clariflocculator, pH correction tank, aeration tank, secondary clarifier, two pressure sand filters, and a treated water tank. Chemical Sludge from the Clariflocculator was transferred to a sludge storage tank followed by sludge drying beds. Biological sludge from the secondary clarifier was then transferred to sludge thickener followed by sludge drying beds. Some fraction of biological sludge is transferred as return sludge to the aeration tank to maintain optimal MLSS (3,000–4,000 mg/L) for biological activity. The process flow diagram of 4.0 MLD CETP IIE SIDCUL Pantnagar is given in Figure 6.
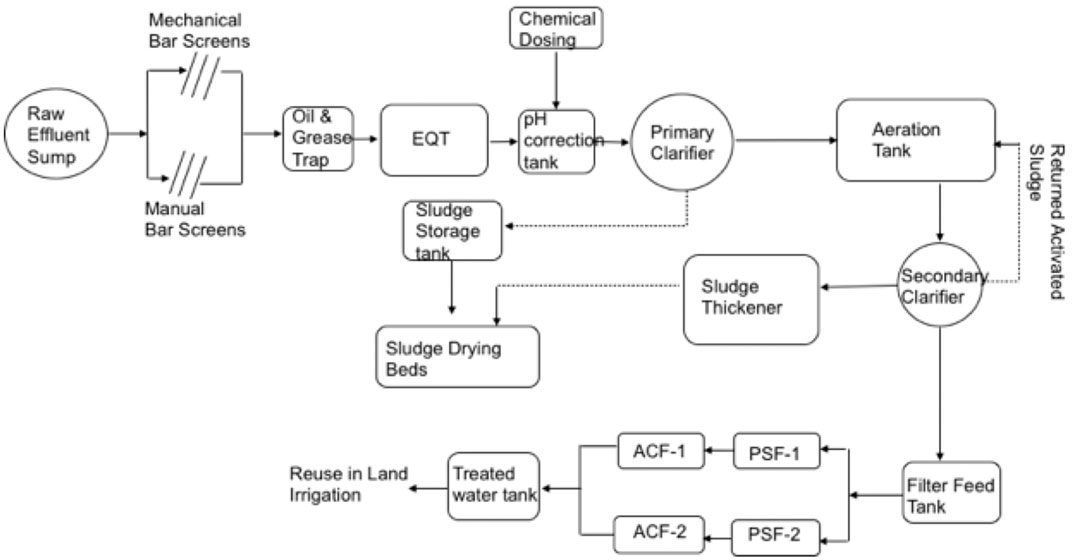
FIGURE 6. The Process flow diagram 4.0 MLD CEPT IIE Pantnagar SIDCUL. Physico-chemical + ASP base biological scheme (EQT - Equalization tanks, ACF - Activated Carbon Filter, PCF - Pressure Sand Filter).
Sampling and Analytical Methods
Grab samples were collected from the operational units of each CETPs (two sampling for 4.5MLD CETP at SIDCUL Haridwar during March-April 2018, two sampling for 4.0 MLD CETP at IIE SIDCUL Pantnagar during Dec-Jan 2020, two sampling for 55.0 MLD CETP at IMT Manesar during June-July 2018 and two samplings for 12.0 MLD CETP at LRIA &MIA Delhi during April-July 2017). The performance evaluation included samples for physicochemical parameters such as pH, turbidity, biochemical oxygen demand (BOD), chemical oxygen demand (COD), total suspended solids (TSS), oil and grease, ammonia nitrogen (NH3-N), nitrate-nitrogen (NO3-N), Total Kjeldahl Nitrogen (TKN), ortho phosphate (PO43−P), Total Phosphorus (TP), chloride (Cl−), sulfate (SO4−2), Fluoride (F−), Sulphide (S−2). These were collected in 1 L plastic bottles from the various sampling points namely, the influent (after equalization tank), the effluent of each biological reactor, each clarifier, the filter, and the final treated effluent (after chlorination). Waste sludge samples from the clarifiers were also taken. For the determination of heavy metals, samples were collected in 500 ml glass bottles and preserved by adding conc. HCl to reduce the pH to 2. All the samples were transported to the laboratory, preserved at 4°C, and analyzed according to Standard Methods (APHA, AWWA, WEF., 2012) (Rice et al., 2012). Online parameters such as Dissolve oxygen (DO), pH, Sludge Volume Index (SVI), and Specific Oxygen Uptake Rate (SOUR) were performed and recorded at the CETPs. The data were analyzed as per selected objectives.
Experimental Setup for the Treatment of Secondary Effluent by Combined Coagulation Followed by Ultrafiltration and Ozonation
Parameters such as COD, BOD, TSS, turbidity, and Color did not conform to the non-potable reuse guidelines of CETPs effluent but satisfied Indian Effluent Discharge Standards (Central Public Health and Environmental Engineering Organisation CPHEEO, 2013). Hence, the secondary treated effluent of CETP SIDCUL Haridwar was examined for combined coagulation followed by UF (ultrafiltration) process to reduce BOD, COD, TSS, and turbidity followed by ozonation.
A combination of coagulation followed by UF and Ozonation setup was installed in the laboratory. secondary treated effluent was first treated through the coagulation-flocculation process by optimal dosing of Alum and Polyelectrolyte (100 and 0.8 mg/L respectively) in Jar test followed by UF and Ozonation.
The ultrafiltration hollow fiber modules are extruded in an in-house extrusion machine. The molecular weight of Polysulfone (PS) made membranes was 70 amu. The inner and outer diameter of hollow fibers was 0.7 and 1.3 mm respectively. The length of each fiber was 16 cm. A total of 80 numbers of such fibers are packed in a ½” internal diameter PVC pipe. Thus, the effective membrane surface area of this cartridge was 280 cm2. The Molecular Weight Cut Off (MWCO) of the module was 44 kDa, and the pore size was 6.46 nm.
The UF treatment was carried out at different pressure gradients of 10, 15, 20, and 25 PSI, which corresponded to the effluent flow rate of 2.3, 2.45, 2.85, and 3.5 L/h.
Ozonation of Effluent From Ultrafiltration
The ozone doze experiments were carried out using a 1,000 ml Pyrex glass reactor designed to provide good contact between the liquid and gas phases. An Indoz model ozone generator was used for generating the ozone needed for the reaction. The ozone produced by using oxygen with a purity of 99.5% was bubbled into a reactor through a diffuser. The experiments with ozone were carried out at room temperature by 1,000 ml of DI (Deionized) water taken in the reactor. The pH of the DI water was reduced to two using 0.1 M Hydrochloric acid (HCl). The ozone dose was bubbled into DI water using an Ozone Generator and the absorbance was recorded at 254 nm using a spectrophotometer at 1 min interval time.
Treated effluent from UF was subjected to ozonation with different ozone concertation at 1 min time intervals. The color (Co-Pt unit) of the effluent from each Ozone treated sample was measured in an Ultra-violet (UV)-Visible spectrophotometer.
Results and Discussions
The results and subsequent discussion describe the results after the tertiary treatment of secondary effluent by combined coagulation. This was followed by UF and Ozonation augmentation processes, which were used to make reclaimed water fit for reuse.
Hydraulic Retention Time
The CETPs used in the present study operated at different Hydraulic retention times (HRTs) due to the different wastewater treatment units. For the 4.5 MLD SIDCUL CETP at Haridwar, the combined calculated HRT of all the units was 29 h (16.5 h for equalization tank, 2.58 h for primary treatment, 2.69 h for MBBR tank, 6.46 h for secondary clarifier, 0.3 h for PSF and ACF). For the 55 MLD IMT CETP at Manesar, the total HRT for the first Stream (25 MLD) was 25.2 h (0.5 h for preliminary treatment, 2.6 h for equalization tank, 3.7 h for primary treatment, 8.6 h for the aeration tank, 5 h for secondary clarifier, 1 h for the Dual media filter, 3.8 h for chlorination tank) and for its Second Stream (30 MLD) was 15 h (1 h for preliminary treatment, 2.7 h for equalization tank, 1.5 h for primary treatment, 5.8 h for aeration tank, 3.3 h for secondary clarifier, 0.4 h for Dual media filter, 0.36 h for chlorination tank. For CETP 12 MLD LRIA Delhi, the total HRT was 9.3 h (0.06 h min for preliminary treatment, 8 h for equalization tank, 0.5 h pre-chlorination, 0.16 h Flocculation tank, 0.25 h in Tube settlers, 0.3 h Post chlorination). For CETP 12 MLD MIA Delhi, the total HRT was 11 h (0.15 h for preliminary treatment, 8 h for equalization tank, 0.5 h pre-chlorination, 0.25 h Tube settlers, 0.5 h clarified effluent sump, 0.16 h Multimedia filters, 0.16 min for ACF, 1 h Chlorination.) and for 4.0 MLD CETP Pantnagar, the total calculated HRT was 29.50 h (20 h for oil and grease, the grit chamber, and equalization tank, 3.0 h for primary treatment 6.5 h for secondary clarifier, 0.3 h for PSF).
Operational Control Parameters
SVI was measured to assess the sludge quality. SVI <120 ml/g was designated good quality while sludge bulking was represented by SVI>150 ml/g. If the settling happened too quickly, as seen in longer sludge age, there may have been pin floc or high turbidity in the supernatant. Mixed Liquor Suspended Solids (MLSS) and Mixed Liquor Suspended Volatile Solids (MLVSS) determined the concentration of biological solids in the aeration tank (Metcalf and Eddy, 2003). The sludge quality data on these operational control parameters are presented in Table 3.
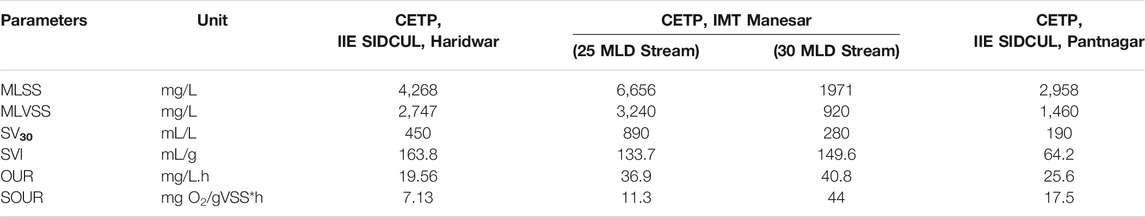
TABLE 3. Process operational parameters related to sludge quality. Waste sludge quantity with respect to total suspended solids its organic fraction, settleability, and biological activity in terms of SOUR.
The CETPs SIDCUL Haridwar, IMT Manesar (both streams), showed the bulky sludge with an SVI value > 120 ml/g. While in the CETP of SIDCUL Pantnagar, appropriate settling was taking place as the SVI value was <120 ml/g, which resulted in satisfactory performance of the treatment plant compared to other CETPs. Typically, SOUR, more than 20–30 mg O2/g volatile suspended solids (VSS)*h, suggested the rapid uptake of the substrate under a high food/microorganism (F/M) ratio and lower sludge retention time (SRT), however, values of less than 10 mg O2/gVSS*h indicates slower uptake of BOD under lower F/M ratio and high SRT (Metcalf and Eddy, 2003). However, the SOUR of the aeration tank of CETP SIDCUL Haridwar showed >10 mg O2/gVSS*h compared to other CETPs of IMT Manesar and SIDCUL Pantnagar, which might be due to the introduction of MBBR unit before aeration tank, showing an enhanced longer SRT and lower F/M in the later aeration stage. Since the CETPs at LRIA and MIA Delhi did not have any biological unit in the treatment process, the process control parameters were not available.
Performance Evaluations of Common Effluent Treatment Plants
It was difficult to make common criteria of evaluation of the performance of all five CETPs because of the different treatment schemes. Moreover, the variable HRT in types and contributing pollution loads from the contributing industries and changes in the industrial manufacturing process further complicated the performance evaluation. Nevertheless, a consensus close to all the present CETPS was achieved, because the pollution abatement standard parameters were the same. All the plants, irrespective of biological or chemical or combined the common macro pollutant parameters, included COD, BOD, TSS, Nitrogen, Phosphorus, Chloride, Fluoride, Sulphate, and Sulphide, and therefore each was analyzed and evaluated critically, as shown in Table 4. The selection of all heavy metals (14) was so precise that most of them were detected in the samples, as given in Table 5.
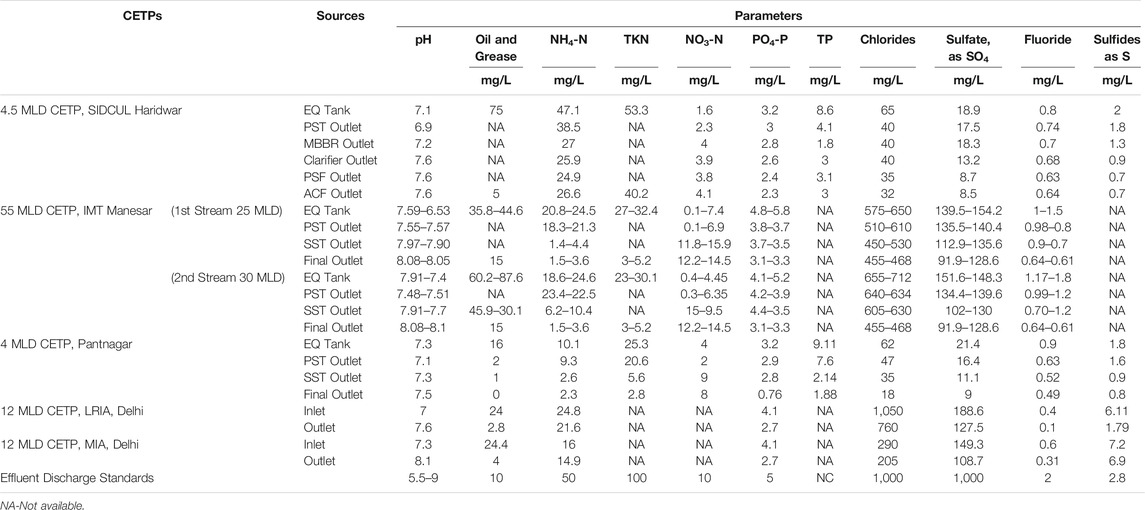
TABLE 4. Nutrients and the removal of other contaminants in five different CETPs. Monitoring status of five CETPs in terms of basic pollution parameters namely; COD, BOD, TSS, Nitrogen, Phosphorus, Chloride, Fluoride, Sulphate, and Sulphide.
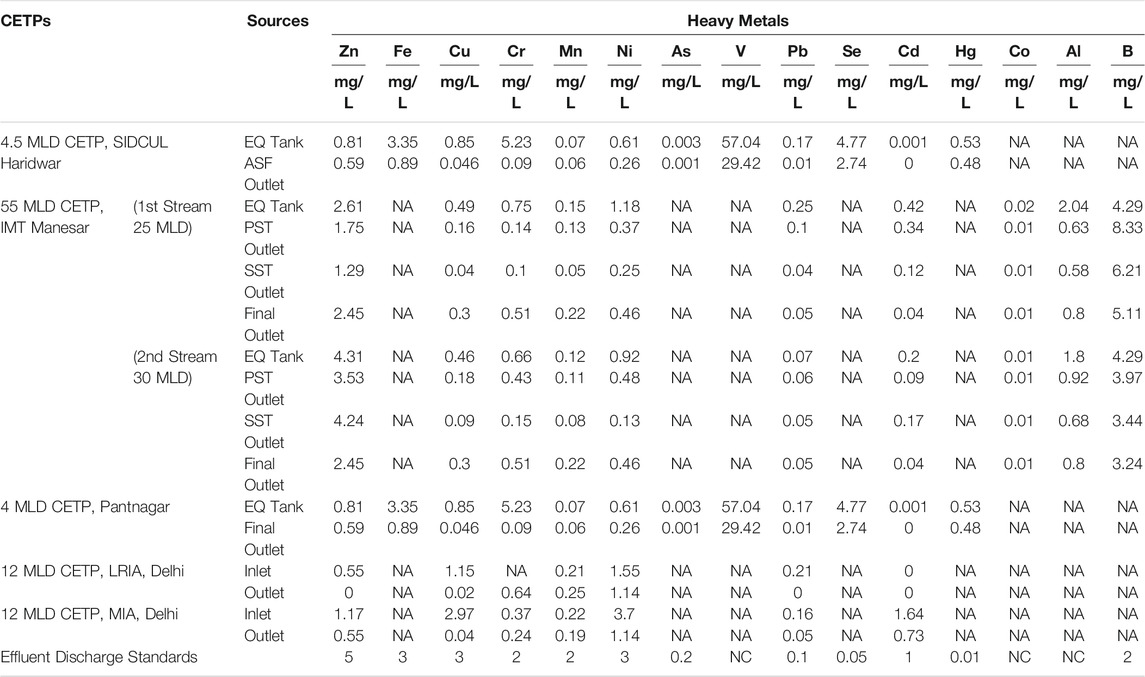
TABLE 5. Heavy metal concentrations and removal in percentage. Detailed 14 selected heavy metal analyses at the inlet and outlet of each treatment unit operation/process in all CETPS.
Organic Matter Removal
The efficiency of plants is generally measured in terms of the removal of organic matters. All the CETPs in North India are designed to produce an effluent COD of less than 250 mg/L, a BOD of less than 30 mg/L, and a TSS of less than 100 mg/L (CPHEEO, 2013). Figure 7 presents the removal of the target parameters of the CETPs included in the present study.
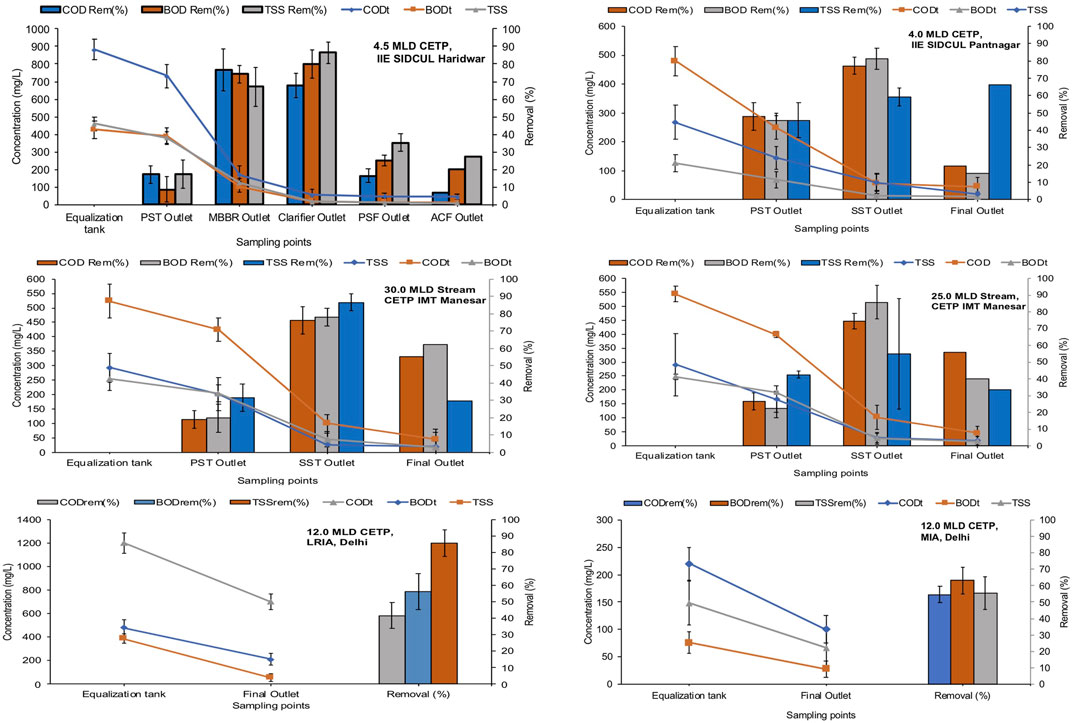
FIGURE 7. THe concentration of COD, BOD, and TSS in different optionl units of CETPs and removal efficiencies.
Evaluation of SIDCUL CETP, Haridwar It was observed that the total COD, BOD, and TSS in the influent were 883 mg/L, 426 mg/L, and 460 mg/L respectively, which was reduced to 731, 389, 380 mg/L after primary settling tank (PST). The 17, 9, and 17% removal efficiencies were followed by 170, 100, 125 mg/L. The 77, 74, and 67% removal efficiencies in the effluent of the MBBR tank, had 55 mg/L, 20 mg/L, and 17 mg/L. The 68, 80, and 86% removal efficiencies after the SST were further reduced to 43 mg/L 11 mg/L, and 8 mg/L. There were 23, 40, and 53% removal efficiencies in the PSF and ACF units. The overall removal efficiencies of the COD, BOD, and TSS of the plant were found to be 79, 85, and 85%, respectively.
In the CETP at IMT Manesar, the influent COD of 25 and 30 MLD streams varied from 563 to 524 mg/L and 574–472 mg/L, which was reduced to 406–392 mg/L and 485–362 mg/L after PST. The removal efficiency of the chemically treated PST system was 28 and 25% for the 25 MLD stream and 16 and 23% for the 30 MLD stream. Generally, the COD removal efficiency of chemically treated PST systems varied from 20 to 40%, and any value of less than 20% was considered acceptable. During the first sampling operation of 30 MLD CETP, the primary treatment system was not functioning properly, and the efficiency was only 16%; however, during the second sampling operation the chemical dosing was adjusted and the efficiency improved to 30%.
The COD was further reduced to 132–72 mg/L and 126–76 mg/L by SST of both 25 and 30 MLD streams. The removal efficiencies of SST were 67 and 81% for 25 MLD stream and 74 and 79% for 30 MLD stream. Meanwhile, the COD removal efficiency of the biological treatment system varied from 80 to 95%; which was well above the minimum acceptable level of 70%.
The secondary treated effluent COD was further reduced to 63–27 mg/L by sand filtration. The sand filtered effluent COD of the combined 25 and 30 MLD streams was 63 mg/L on first sampling, which was reduced to 27 mg/L on second sampling by adopting standard operating procedures such as regular filter backwashing. The influent BOD of 25 and 30 MLD streams varied from 240–255 and 237–271 mg/L, which reduced to 190–195 and 220–188 mg/L after PST. The removal efficiency of the chemical pre-treatment system was 20.8 and 23.5% for the 25 MLD stream and 7 and 30.6% for the 30 MLD stream. Meanwhile, the BOD removal efficiency of the chemical pre-treatment system varied from 20 to 40%. During the first sampling of the 30 MLD stream, the primary treatment system was not functioning properly, and the efficiency was only 7%; however, after adjusting chemical dosing, the efficiency improved to 30% on the second sampling.
The BOD was further reduced to 42–13 mg/L and 60–30 mg/L by biological treatment of both 25 and 30 MLD streams, which resulted in 77–95% and 72–84% efficiencies for the respective streams. This value was well above the minimum removal of 70%, however, there was still scope for improvement. The improvement in the efficiency of both CETPs was observed in the second sampling due to regular sludge wastage.
The secondary treated effluent BOD was further reduced from 28 on first sampling to 5 mg/L by sand filtration on second sampling. Hence, the CETP satisfied the effluent BOD standard for reuse. The inlet TSS of the 25 and 30 MLD CETPs varied from 211–370 to 276–309 mg/L, which reduced to 134–200 and 171–230 mg/L after primary chemical treatment. The removal efficiency of the chemical pre-treatment system was 36 and 46% for the 25 MLD stream and 38 and 26% for 30 MLD stream. These values indicated that the primary treatment system fairly removed the TSS from the raw influent.
The TSS was further reduced to 17–40 mg/L and 33–20 mg/L by biological treatment of the 25 and 30 MLD streams. The removal efficiency of biological treatment was 87 and 80% for the 25 MLD stream and 81 and 91% for the 30 MLD stream, meaning the biological treatment system removed the desired level of TSS from the effluent.
The secondary treated effluent TSS was further reduced from 30 during the first sampling and to 8 mg/L by sand filtration during the second sampling. Hence, the CETP satisfied the effluent TSS standard for reuse.
Evaluation of 12 MLD CETP at LRIA, Delhi. Given the two-point sampling of CETP at LRIA (Inlet and Outlet), it was observed that the BOD of raw effluent reaching the CETP corresponded to diluted sewage. However, BOD was consistently above the original design value of 89 mg/L. The average BOD was found to have come down from around 120 mg/l to 35–40 mg/l (67–71% removal efficiency), which was marginally above the discharge limit of 30 mg/L. The COD of raw effluent was 340 mg/L, which was reduced to 128 mg/L in the treated effluent, resulting in 62% removal efficiency. TSS reduction was from 268 mg/L to 76 mg/L, thereby giving 72% removal efficiency.
Evaluation of 12 MLD MIA CETP at Delhi observed that the BOD of raw effluent reaching the CETP corresponded to diluted sewage. However, BOD was consistently below the original design value of 89 mg/L. For instance, BOD was reduced from around 76 mg/l down to 28 mg/l, which was marginally below the discharge limit of 30 mg/L. The removal of BOD was found to be 63%. The COD of the raw effluent was 220 mg/L, which was reduced to 100 mg/L in the treated effluent. The removal efficiency for COD was found to be 55%. The TSS in the raw wastewater was 148 mg/L and reduced to 66 mg/L in treated effluent with a removal efficiency of 54%.
In the CETP 4 MLD Pantnagar it was observed that the COD, BOD and TSS in the influent were 480 mg/L, 127 mg/L and 269 mg/L respectively, which were reduced to 250, 69, 145 mg/L after PST (48, 46 and 46% removal efficiencies), followed by 57, 13, 59 mg/L (77, 81and 69% removal) in SST outlet, and further dropped to 46 mg/L, 11 mg/L and 20 mg/L (19, 15 and 66% removal efficiencies) after the sand filtration. The overall COD, BOD, and TSS removal efficiencies of the plant were found to be 90%, >92%, and 93%, respectively.
Nutrient Removal
Table 4 shows the comparative overview of the CETPs regarding nutrients and other contaminant removal in relation to treated effluent discharge standards (Ministry of Environment Forest and Climate Change MoEFCC, 2016).
CETP 4.5 MLD SIDCUL Haridwar. Regarding nitrogen removal efficiency, the present analysis results showed that the concentration of ammonia nitrogen decreased from 47.1 mg/L in influent to 26.6 mg/L in final effluent (43.5% removal). Even though the concentration of ammonia in the effluent was higher, the quality was below effluent discharge standards. A similar scenario was observed for nitrate levels (influent 1.6 mg/L, effluent 4.1 mg/L) and TKN (influent 53.3 mg/L, effluent 40.2 mg/L), thereby satisfying effluent standards. Total nitrogen in the influent was 54.9 mg/L, which was reduced 44.3 mg/L after PSF and ACF units (19.3% removal). Concerning phosphorus removal, the ortho-phosphate decreased from 3.2 mg/L to 2.3 mg/L. The total phosphorus in the influent was 8.6 mg/L, which was reduced to 3 mg/L after PSF and ACF units (65.2% removal). Inlet oil and grease (O and G) of the plant was 75 mg/L, which reduced to 5 mg/L after tertiary treatment, and conformed to effluent treatment standards. It was observed that the Chloride (as Cl), Fluoride (as F), Sulphate (as SO4), and Sulphide (as S) in the influent were 65 mg/L, 0.8 mg/L, 18.9 mg/L, and 2 mg/L respectively, which was reduced to 32 mg/L, 0.64 mg/L, 8.5 mg/L, and 0.7 mg/L respectively (50.8, 20, 55 and 65% removal efficiencies) after PSF and ACF unit.
In the CETP 55 MLD at IMT Manesar. Regarding nitrogen removal efficiency, Table 2 shows the average concentration of ammonia nitrogen for the two sampling campaigns. The inlet ammonia nitrogen of 25 and 30 MLD CETPs varied from 20.8–24.5 mg/L and 18.6–24.6 mg/L, which reduced to 1.5–3.6 and 1.5–3.6 mg/L on effluent after final treatment. The removal efficiency was 85–92% for 25 MLD CETP and 85–91% for 30 MLD CETP. Although the concentration of ammonia in the effluent was higher, the quality was below the effluent discharge standards in both the 25 MLD and 30 MLD CETPs.
Similar scenario was observed for nitrate (influent 0.1–7.4 mg/L in 25 MLD and 0.4–4.5 mg/L in 30 MLD CETPs and effluent 12.2–14.5 mg/L in 25 MLD, and again 12.2–14.5 in 30 MLD CETPs) and TKN (in influent 27–32.4 mg/L in 25 MLD and 23–30.1 mg/L in 30 MLD CETPs and in effluent 3–5.2 mg/L in 25 MLD and again 3–5.2 in 30 MLD CETP), conforming to effluent standards. The total nitrogen of the 25 and 30 MLD CETP varied from 27.1–39.8 and 23.4–34.5 mg/L, which reduced to 15.2–19.7 and again to 15.2–19.7 mg/L in effluent after final treatment. The removal efficiency was 43–50% for 25 MLD CETP and 35–42% for 30 MLD CETP. Ortho-phosphorus (In influent 4.8–5.8 mg/L in 25 MLD and 4.1–5.2 mg/L in 30 MLD CETP and in effluent 3.1–3.3 mg/L in 25 MLD and again 3.1–3.3 in 30 MLD CETP) satisfying effluent standards. The inlet oil and grease of the 25 and 30 MLD CETPs varied from 35.8–44.6 to 60.2–87.6 mg/L, and reduced to 10–15 mg/L after tertiary treatment.
It was observed that the Inlet Chloride (as Cl) levels of 25 and 30 MLD CETP varied from 575 to 650 mg/L and 655–712 mg/L, which reduced to 455–468 mg/L (20–28 and 30–34% removal in 25 and 30 MLD CETP, respectively) after tertiary treatment. It was observed that the Fluoride (as F) of the 25 and 30 MLD CETP varied from 1 to 1.5 mg/L to 1.17–1.8 mg/L, which reduced to 0.61–0.64 mg/L (39–57 and 47–65% removal in 25 and 30 MLD CETPs respectively) after tertiary treatment. The Sulphate (as SO4) in the 25 and 30 MLD CETP varied from 140 to 155 mg/L to 149–152 mg/L, and reduced to 92–122 mg/L (21–34 and 21–38% removal in 25 and 30 MLD CETPs respectively) after tertiary treatment.
CETP 12 MLD LRIA, Delhi. Regarding nitrogen removal efficiency, the present analysis results indicated that the concentration of ammonia nitrogen decreased from 24.8 mg/L in influent to 21.6 mg/L in final effluent (13% removal efficiency). Eventhough the concentration of ammonia in the effluent is higher, the quality is below effluent discharge standards. Concerning phosphorus removal, the ortho-phosphate decreased from 4.1 to 2.7, which was below the effluent discharge standard. The inlet oil and grease of the plant was 24 mg/L, which was reduced to 2.8 mg/L after tertiary treatment. However, the sample taken after the removal of a malfunctioning oil and grease removal mechanism satisfied the oil and grease effluent standard of 5 mg/L. It was observed that the Chloride (as Cl), Fluoride (as F), Sulphate (as SO4), and Sulphide (as S) in the influent were 1,050 mg/L, 0.4 mg/L, 188.6 mg/L, and 6.11 mg/L, which were reduced to 760 mg/L, 0.1 mg/L, 127.5 mg/L, and 1.8 mg/L respectively (28, 75, 33 and 71% removal efficiencies) after tertiary treatment.
In the CETP 12 MLD MIA, Delhi. For nitrogen removal efficiency, the present analysis results showed that the concentration of ammonia nitrogen decreased from 16 mg/L in influent to 14.9 mg/L in final effluent (7% removal efficiencies). Despite the fact that the concentration of ammonia in the effluent is higher, the quality was below effluent discharge standards. With respect to phosphorus removal, the ortho-phosphate decreased from 4.1 to 2.7 mg/L, which is below the effluent discharge standard. The inlet oil and grease of the plant was 24.4 mg/L, which reduced to 4 mg/L after tertiary treatment. The system did satisfy the oli and grease effluent standard of 5 mg/L. It was observed that the Chloride (as Cl), Fluoride (as F), Sulphate (as SO4), and Sulphide (as S) in the influent were 290 mg/L, 0.6 mg/L, 149.3 mg/L, and 7.2 mg/L, which reduced to 205 mg/L, 0.31 mg/L, 108.7 mg/L, and 6.9 mg/L, respectively (30, 49, 28 and 5% removal efficiencies) after tertiary treatment.
In the CETP 4.0 MLD IIE Pantnagar SIDCUL. the Nitrogen removal results showed that the concentration of ammonia nitrogen decreased from 10.1 mg/L in the influent to 2.3 mg/L in the final effluent (77% removal efficiency); however, the concentration of ammonia in the effluent was lower, meaning it was below effluent discharge standards. For phosphorus removal, the ortho-phosphate decreased from 3.2 to 0.46 mg/L, which was also below the effluent discharge standard. It was observed that the Chloride (as Cl), Fluoride (as F), Sulphate (as SO4), and Sulphide (as S) in the influent were 62 mg/L, 0.9 mg/L, 21.4 mg/L, and 1.8 mg/L, which reduced to 18.0 mg/L, 0.49 mg/L, 9.0 mg/L, and 0.8 mg/L respectively (70, 45, 57, and 55% removal efficiencies) after sand filtration.
Heavy Metal Removal
As the influents to the CETPs were a mixture of both industrial and domestic discharge, heavy metals were present. Table 5 shows a comparative overview of the CETPs regarding heavy metal concentrations and removal and the standards for discharge after treatment. The heavy metals were contributed to by untreated discharge from electrical, electronics, electroplating, and allied industries present in the industrial area, even though these CETPs were not originally designed for the removal of heavy metals as per discharge standards. Various methods for the removal of heavy metals exist in practice and their removal by chemical precipitation at varying pH has been found suitable and economical. The amount of alum and polyelectrolyte was also determined using the Jar Test. The pH was adjusted from 7.5 to 11, by NaOH initially followed by lime. The effluent in each case was analyzed for heavy metals at varying pH. It was found that at a pH value of 8, the removal percentages of most of the heavy metals was high, depending on individual solubility. The percentage of removal of various heavy metals varied from 50 to 100% in the case of precipitation by NaOH and 21–77% in the case of precipitation by lime. Analysis was conducted on 15 elements, the concentration of 14 elements, which includes Zn, Fe, Cu, Cr, Mn, Ni, As, V, Pb, Se, Cd, Hg, Co, and Al, which were within the Indian CETP effluent discharge standards MoEFCC, 2016), except for Boron (B), which was higher in 55 MLD IMT Manesar. The percentage of removal of heavy metals varied from 65 to 95%.
Evaluation of the IE of the Common Effluent Treatment Plants
From the above results indicate that these CETPs exhibit different physical and chemical efficiencies depending upon influent characteristics (domestic and industrial sewage), the percentage of capacity utilization, and operating parameters, etc. There is thus a need to define one common parameter that could determine the overall efficiency of CETPs in terms of physical and chemical removal efficiencies As determined by Colmenarejo et al. (2006), overall efficiency takes into account the average TSS, COD, BOD, and Nitrogen removal efficiencies. The actual and standard IE (Integrated Efficiencies) for CETPs were determined by taking into consideration COD, BOD, TSS, Ammonia, Chlorides, Sulfate (as SO4), and Phosphorus removal. Calculations of actual and standard integrated efficiencies (IEa and IEs) for each CETP were based on effluent sewage characteristics.
Where IEa is the actual integrated efficiency in (%), and all others are the average % removal efficiency of the individual parameter suffixed. To evaluate IE (Integrated efficiency), the average individual removal efficiencies of the CETPs were determined (Figure 8).
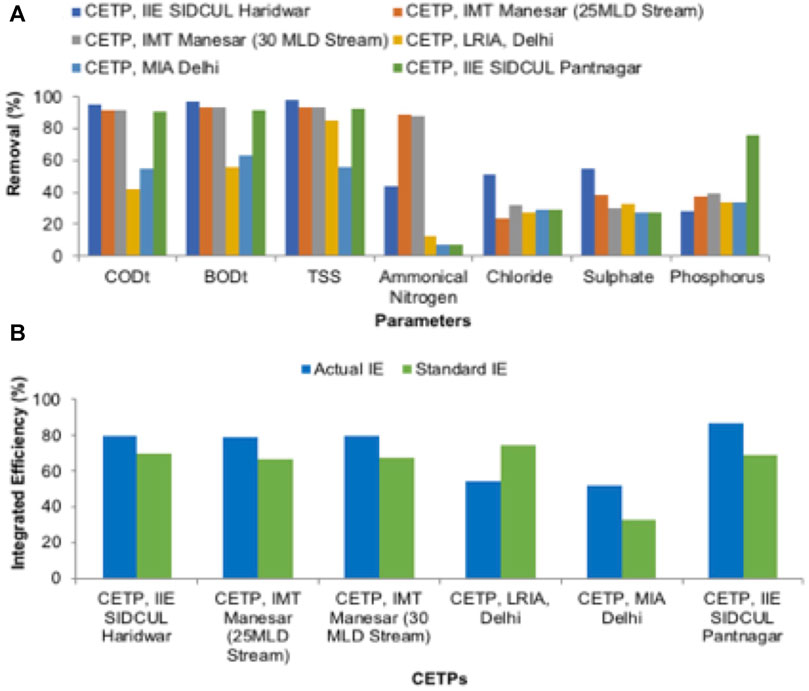
FIGURE 8. (A) Percentage removal of physicochemical parameters. (B) Comparison of actual and Standard integrated efficiencies.
The actual integrated efficiency (IEa) based on actual effluent quality, and standard integrated efficiency, based on standard effluent discharge standards of the respective plants were evaluated and compared, as shown in Figure 8. The IEa was found to be higher than IEs (in the range of 52–80% except for the case of the 12 MLD LRIA plant, where the IEa was 20% lower than IEs, which was because the CETP was not equipped with a biological unit process for the removal of organic matter. The 4.5 MLD SIDCUL CETP Haridwar, attained 80% IEa, the highest in all five CETPS, whereas the IEa of the 55 MLD Manesar (both first and second streams) was 79 and 79.5% respectively. The IEa of the 12 MLD MIA was above IEs, but its actual Integrated Efficiency was the same as the 12 MLD LRIA Delhi, which was also due to the absence of a biological unit process for the removal of organic matter.
Combined Coagulation Followed by Ultrafiltration and Ozonation Treating Secondary Effluent From CETP for Non-potable Water Reuse
It was observed that the BOD reduced by 77%, COD reduced by 76%, turbidity reduced by 96%, and TSS reduced by 100% after combined treatment. Significantly all the parameters mentioned above met the effluent standards for reuse (Figure 9). Color removal was achieved by up to 52%. The color of the effluent was 42 on the Pt-Co scale, which was not commensurate with reuse standards. Therefore, advanced oxidation processes, namely Ozonation, were employed for color removal to achieve the desired standard for reuse. It was observed that exposure of up to 2 min at an Ozone dose of 5.5 mg/L removed the color, which brought the effluent up to recommended reuse standards (CPHEEO, 2013); however, with an extended exposure time of 4 min with an Ozone dose of 8.3 mg/L, a color removal of up to 88% can be achieved, with a color concentration of less than 5 Pt-Co unit, which is acceptable for water reuse.
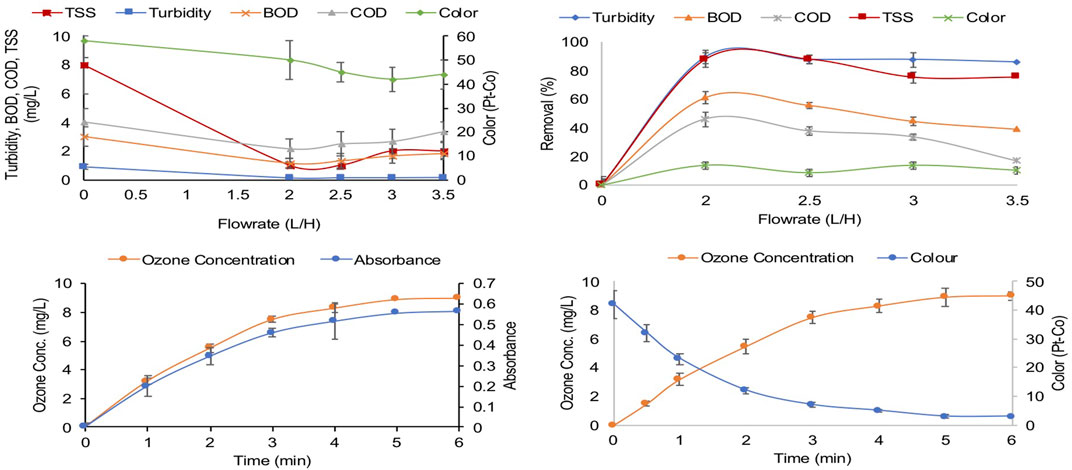
FIGURE 9. Effect of Coagulation + UF and Ozone concentration on COD, BOD, TSS, Turbidity and Color.
The coagulation combined with the ultra-filtration (UF) process is very efficient as a tertiary treatment process in reducing suspended particles, which ultimately results in reducing various physical parameters like TSS, turbidity, BOD, COD, and color to desired levels.
Conclusion
The present study evaluated CETPs (designed and installed for non-potable reuse) in Northern India and examined the treatment of secondary effluent with combined coagulation followed by UF and Ozonation. The CETPs did not reclaim effluent for non-potable reuse, and a major fraction of treated effluent from all these CETPs was being discharged into surface water bodies followed by rivers. Half of the existing CETPs upgraded or changed their treatment scheme due to the enormous variation of industrial effluent, increasing organic load, and modifications to the manufacturing process of industries. The integrated efficiency of CETP at SIDCUL Haridwar was found to be the highest (80%), whereas the CETP at MIA Delhi had the lowest integrated efficiency of 51.8%. Multimedia and activated carbon filtration are not sufficient to treat secondary effluent for effluent reuse. A combination of coagulation and ultrafiltration followed by Ozonation as tertiary treatment is efficient for the treatment of secondary effluent. This process enables the effluent to meet reuse standards, reducing remaining impurities such as turbidity, suspended particles, COD, BOD, and color significantly.
Data Availability Statement
The original contributions presented in the study are included in the article/Supplementary Material, further inquiries can be directed to the corresponding author.
Author Contributions
All authors listed have made a substantial, direct, and intellectual contribution to the work and approved it for publication.
Conflict of Interest
The authors declare that the research was conducted in the absence of any commercial or financial relationships that could be construed as a potential conflict of interest.
Publisher’s Note
All claims expressed in this article are solely those of the authors and do not necessarily represent those of their affiliated organizations, or those of the publisher, the editors, and the reviewers. Any product that may be evaluated in this article, or claim that may be made by its manufacturer, is not guaranteed or endorsed by the publisher.
Acknowledgments
We also thank the CETP operators and plants for helping us undertake sampling and share CETP information.
References
Aziz, H. A., Adlan, M. N., and Ariffin, K. S. (2008). Heavy Metals (Cd, Pb, Zn, Ni, Cu and Cr(III)) Removal from Water in Malaysia: Post Treatment by High Quality limestone. Bioresour. Tech. 99, 1578–1583. doi:10.1016/j.biortech.2007.04.007
Central Pollution Control Board (CPCB) (2018). Assessment of Common Effluent Treatment Plants (CETPs) in the Industrial Clusters Comprising of Medium and Small Scale Industries. Available at: https://cpcb.nic.in/status-of-cetps/(Accessed 29 August 2018)
Colmenarejo, M. F., Rubio, A., Sánchez, E., Vicente, J., García, M. G., and Borja, R. (2006). Evaluation of Municipal Wastewater Treatment Plants with Different Technologies at Las Rozas, Madrid (Spain). J. Environ. Manage. 81 (4), 399–404. doi:10.1016/j.jenvman.2005.11.007
CPHEEO (2013). “Manual on Sewerage and Sewage Treatment Systems - Part C: Management,” in Chapter-3 Legal Framework and Policies, 2–15. Available at http://cpheeo.gov.in/upload/uploadfiles/files/systems_chapter2.pdf.
Gerrity, D., Pecson, B., Trussell, R. S., and Trussell, R. R. (2013). Potable Reuse Treatment Trains throughout the World. J. Water Supply: Res. Technology-Aqua 62 (6), 321–338. doi:10.2166/aqua.2013.041
Ghumra, D. P., Agarkoti, C., and Gogate, P. R. (2021). Improvements in Effluent Treatment Technologies in Common Effluent Treatment Plants (CETPs): Review and Recent Advances. Process Saf. Environ. Prot. 147, 1018–1051. doi:10.1016/j.psep.2021.01.021
Grüttner, H., Winther-Nielsen, M., Jørgensen, L., Bøgebjerg, P., and Sinkjær, O. (1994). Inhibition of the Nitrification Process in Municipal Wastewater Treatment Plants by Industrial Discharges. Water Sci. Tech. 29 (9), 69–77. doi:10.2166/wst.1994.0446
Harris-Lovett, S. R., Binz, C., Sedlak, D. L., Kiparsky, M., and Truffer, B. (2015). Beyond User Acceptance: A Legitimacy Framework for Potable Water Reuse in California. Environ. Sci. Technol. 49 (13), 7552–7561. doi:10.1021/acs.est.5b00504
Jern, N. W. (2006). Industrial Wastewater Treatment Technologies. second edition. Shelton Street, Covent Garden London WC2H 9HE: Imperial College Press.
Metcalf, W., and Eddy, C. (2003). Inc. Wastewater Engineering: Treatment and Resource Recovery. Boston: McGraw-Hill.
Michael-Kordatou, I., Michael, C., Duan, X., He, X., Dionysiou, D. D., Mills, M. A., et al. (2015). Dissolved Effluent Organic Matter: Characteristics and Potential Implications in Wastewater Treatment and Reuse Applications. Water Res. 77, 213–248. doi:10.1016/j.watres.2015.03.011
Ministry of Environment, Forest and Climate Change (2016). Draft Notification on the Standards of Common Effluent Treatment Plants (CETP). Available at: http://moef.gov.in/en/draft-notification-on-the-standards-of-common-effluent-treatment-plantscetps/(Accessed 1 January 2016)
Padalkar, A. V., Kaur, S., and Kumar, R. (2016). Performance Evaluation of Common Effluent Treatment Plant for Efficiency of Pollutant Removal and Relation to Design Adequacy. J. Environ. Sci. Eng. 58 (1), 17–28.
Padalkar, A., Kaur, S., and Kumar, R. (2019). Reliability Analysis and Removal Efficiency Relationship of Common Effluent Treatment Plants of Industrial Clusters. Int. J. Environ. Sci. Technol. 16, 1379–1394. doi:10.1007/s13762-018-1740-9
Pathe, P. P., Suresh Kumar, M., Kharwade, K. S. N., and Kaul, S. N. (2004). Common Effluent Treatment Plant (CEPT) for Wastewater Management from a Cluster of Small Scale Tanneries. Environ. Tech. 25 (5), 555–563. doi:10.1080/09593332608618562c
Ranade, V. V., and Bhandari, V. M. (2014). Industrial Wastewater Treatment, Recycling and Reuse. The BoulevardOxford, OX5 1GB, UK: Butterworth heinemannLangford Lane, Kidlington.
Rice, E. W., Baird, R. D., and Eaton, A. D. (2012). Standard Methods for Examination of Water and wastewater. Wasinton DC. Publisher American Public Health Association (APHA), American Water Works Association (AWWA), Water Environment Federetion WEF. doi:10.5209/rev_ANHM.2012.v5.n2.40440
Visvanathan, C., and Asano, T. (2014). “The Potential For Industrial Wastewater Reuse,” in Encyclopaedia of Life Support Systems (EOLSS) 1, 1–19. Available at: http://www.eolss.net/Eolss-sampleAllChapter.aspx.
Vyas, M., Modhera, K. B., Vyas, V., and Sharma, A. (2011). Performance Forecasting of Common Effluent Treatment Plant Parameters by Artificial Neural Network. ARPN J. Eng. Appl. Sci. 6, 1.
Keywords: common effluent treatment plant, performance evaluation, coagulation, ultrafiltration, ozonation, non-potable reuse
Citation: Ali M, Almohana AI, Alali AF, Kamal MA, Khursheed A, Khursheed A and Kazmi AA (2021) Common Effluent Treatment Plants Monitoring and Process Augmentation Options to Conform Non-potable Reuse. Front. Environ. Sci. 9:741343. doi: 10.3389/fenvs.2021.741343
Received: 14 July 2021; Accepted: 17 November 2021;
Published: 10 December 2021.
Edited by:
Sheena Kumari, Durban University of Technology, South AfricaReviewed by:
Rakesh Bhutiani, Gurukul Kangri Vishwavidyalaya, IndiaNataraj Sanna Kotrappanavar, Jain University, India
Copyright © 2021 Ali, Almohana, Alali, Kamal, Khursheed, Khursheed and Kazmi. This is an open-access article distributed under the terms of the Creative Commons Attribution License (CC BY). The use, distribution or reproduction in other forums is permitted, provided the original author(s) and the copyright owner(s) are credited and that the original publication in this journal is cited, in accordance with accepted academic practice. No use, distribution or reproduction is permitted which does not comply with these terms.
*Correspondence: Muntjeer Ali, bXVudGF6aXIuY2VAc3JpYy5paXRyLmFjLmlu