 Antonio Serrano
 Jesús Abril-Gago
 Carlos J. García-Orellana
- 1Departamento de Física, Instituto Universitario de Investigación del Agua, Cambio Climático y Sostenibilidad (IACYS), Facultad de Ciencias, Universidad de Extremadura, Badajoz, Spain
- 2Departamento de Física Aplicada, Instituto Interuniversitario de Investigación del Sistema Tierra en Andalucía (IISTA-CEAMA), Universidad de Granada, Granada, Spain
- 3Departamento de Ingeniería Eléctrica, Electrónica y Automática, Instituto de Computación Científica Avanzada (ICCAEx), Universidad de Extremadura, Badajoz, Spain
Accurate measurements of solar ultraviolet radiation are needed for air quality monitoring, especially to understand the formation and photolysis of tropospheric ozone near the ground. It is interesting to investigate whether this demand could be met using recently developed low-cost UV sensors and new communication technologies. Despite the promising possibilities, their use is still scarce and their potential applications have not yet been thoroughly explored. This study aims to use low-cost sensors to develop devices that accurately measure solar ultraviolet radiation. The de vices should be low-cost, small, portable, and have low power consumption and IoT connectivity. For this purpose, three popular low-cost commercial sensors ML8511, UVM30A and VEML6075 are selected and implemented in several prototypes. The sensors are analyzed in terms of their spectral response, leveling, angular response and comparison with reference data. For that aim, experimental measurements are performed at the radiometric station of the Physics Department of the University of Extremadura in Badajoz, Spain. Results indicate that sensors of the same model might have different calibrations. The leveling and the angular response measurements indicate a strong azimuth dependence for the ML8511 and, especially, VEML6075 sensors, while the UVM30A sensor shows a much weaker dependence, probably due to the use of a circular diffuser. The angular response is identified as the main issue of the sensors, notably limiting their accuracy and preventing a widespread use. With the knowledge gained, a final version with LoRa communication and optimized power consumption is developed. The strength of the LoRa connection is measured at different locations on the University Campus using Receiver Signal Strength Indication. It ranges from -27 dB near the gateway to -122 dB at the farthest location on the Campus. The optimization of the power consumption allows 14 days of autonomy if operating only during daylight hours. The study illustrates the suitability of low-cost sensors for UV applications, provided that a good angular response of the sensors is ensured. It contributes to a wider use of these sensors for the measurement of air quality variables by identifying those characteristics that need to be improved by manufacturers to meet the standards.
1 Introduction
Air quality is a major concern in today’s society, especially in industrial areas and large cities, where it is frequently degraded due to the anthropogenic release of chemical compounds into the atmosphere. Some of these compounds become toxic after exposure to solar radiation, especially with the shorter wavelengths corresponding to the ultraviolet (UV) range. Thus, the part of the solar ultraviolet (UV) radiation that passes through the atmosphere and reaches the Earth’s surface plays an important role in the photochemical processes taking place near the ground, and become an essential driver for the formation of photochemical smog. In particular, it controls the generation and photolysis of tropospheric ozone and the formation of some sulfate, nitrate, and organic aerosols (Madronich et al., 2015). These pollutants may have harmful consequences for human health and the environment.
The formation of tropospheric ozone occurs through complex chemical reactions when volatile organic compounds and nitrogen oxides are exposed to UV radiation. On the other hand, the UV radiation also intervenes in the photolysis of tropospheric ozone, producing hydroxyl radicals. These radicals are very important for the oxidation of sulfur and nitrogen oxides resulting in sulfuric and nitric acids which, in turn, form sulfate and nitrate aerosols. The hydroxyl radicals play an important role in the air chemistry since they limit the lifetime of some important gases such as methane, hydrogen-containing halocarbons, and sulfur and nitrogen oxides.
Thus, the variation of UV radiation at ground level due to changes in stratospheric ozone, aerosols and clouds contributes to air quality trends and their resulting health effects. Therefore, monitoring the air quality requires measuring not only the concentration of some chemical species but also some meteorological factors, particularly UV radiation. These measurements contribute to understand the processes of formation and destruction of the chemical species, and to predict the evolution of air quality under different future scenarios. This knowledge is also essential to take timely effective control measures and to design successful long-term policies. The interest for measuring UV radiation at ground level is additionally emphasized by its harmful direct effects to humans (Lucas et al., 2015), terrestrial (Bornman et al., 2015) and aquatic ecosystems (Häder et al., 2011; Zepp et al., 2011; Häder et al., 2015), and materials (Andrady et al., 2015).
This monitoring is usually accomplished by meteorological stations equipped with heavy and expensive standard instrumentation that follows strict protocols of calibration and measurement. These measurements must be performed with open horizon, free from obstacles. The most widely used devices to measure the UV radiation at ground level are probably the broadband-UV radiometers built according to the Robertson-Berger design. They include a diode as the sensor for UV radiation. A variety of models are offered by several manufacturers, such as EKO, Scintec/Kipp & Zonen, Solar Light, Yankee, etc. (Seckmeyer et al., 2005). These standard instruments are heavy (somewhat above 0.5 Kg), non portable (connected by wire to a data logger) and designed to be horizontal. Besides broadband radiometers, there are also other more sophisticated instruments such as Brewer spectroradiometers that provide, not a broadband value, but spectral values throughout the UV range. These spectroradiometers have a diffraction grating and a moving mirror which, working in combination, allow all wavelengths within the UV range to be scanned. These instruments are very heavy (84 Kg with the tripod included), non portable and extremely expensive. Thus, the cost varies from thousands of euros for a broadband radiometer to hundreds of thousands for a Brewer spectroradiometer. In addition to ground-based measurements, the spatial distribution of UV radiation reaching ground level can also be estimated by spaceborne radiometers aboard satellites. These satellites measure the UV radiation backscattered by the atmosphere and, together with other meteorological information, estimate the UV radiation that reaches the Earth’s surface. These estimates are not direct measurement of radiation, and include modeling. Therefore, they must be calibrated and validated against ground-based measurements.
However, the spatial resolution provided by meteorological stations, satellites and models is insufficient to describe the large spatial variability occurring at complex locations, such as urban areas. The typical city structures, with tall buildings, abrupt changes in height, complex shading, reflections on walls, different materials (and therefore, a highly variable albedo), etc., results in a extremely complex radiation field, that is not adequately described by standard conventional radiation measurements. In this framework, the development of small and portable devices is a critical need to achieve a more representative monitoring of solar radiation, especially in such complex areas. In this sense, the recently arisen small low-cost UV sensors offer interesting possibilities to develop low-cost portable devices, favoring the dynamic monitoring of UV radiation with mobile stations, and the deployment of new measurement networks at a moderate cost. In addition, new communication technologies, such as Internet of Things (IoT), facilitate data recording and management, contributing also to the development of new solutions. The “Internet of Things” (IoT) term started to be used at the end of the 20th century (Ashton, 2009), although some studies place its birth around 2008 (Evans, 2011), when the number of devices connected to the Internet exceeded the world’s population. Basically, the idea behind IoT is the massive existence of devices connected to the Internet that monitor and take action on processes. The idea is so general that applications have emerged in numerous fields such as consumer-oriented environments (smart homes), industrial, commercial, agricultural, environmental, etc. (Talavera et al., 2017; Al Mamun and Yuce, 2019; Hajjaji et al., 2021). IoT devices need a means of connection to the Internet, being this necessarily wireless when portable devices are involved. In this case, power consumption also plays a fundamental role. LoRaWAN is an IoT infrastructure specially designed to optimize energy consumption (de Carvalho Silva et al., 2017), mainly by using LoRa as the hardware communication layer (Sinha et al., 2017). Although there are other network infrastructures that can support IoT (WiFi, SigFox, GSM, 5G), LoRaWAN offers increasing territory coverage and low price.
Despite these promising new possibilities, the use of low-cost UV sensors is still scarce and their potential use for these applications has not been thoroughly investigated yet. Their use to date has been limited to experimental studies within the academic context (Zhang et al., 2013; Haryanto and Pratomo, 2017; Paredes Ccama, 2017; Quintero Cardenas, 2018; Wijatna et al., 2019; Pramono et al., 2020), since these sensors offer interesting and affordable research possibilities. Thus, the present study contributes to investigate the potential use of low-cost sensors to accurately measure the UV radiation reaching a surface, paying special attention to their limitations and to the main aspects to be improved in order to achieve a wider use. For that aim, six prototypes integrating three very popular UV sensors are built and their performance for measuring UV solar radiation is compared.
2 Materials and Methods
This study investigates the possibility and limitations of implementing a low-cost artisan device suitable to measure UV solar radiation. In addition to accurately monitoring UV radiation, the device is required to be small, portable and low-cost, and have low power consumption and IoT connectivity. If size, weight and portability requirements are fulfilled, the device can be even integrated in clothes or attached to a light wristband or similar, broadening the number of potential applications.
The implementation of a prototype requires the construction of the device, its calibration and testing its power-consumption and communication skills. The methodologies used to address all these aspects are presented in this section.
2.1 The Device
The measurement of UV radiation is usually based on the inner photoelectric effect occurring in photodiodes. These sensors are built by p-n junctions sensible to the light. The p-n junction is operated in reverse bias preventing any significant current flow unless electron-hole pairs are created by the incidence of photons (Cox, 1998). Thus, the radiation produces an electric current which is, to first order, linearly proportional to the incident irradiance. The material used to construct the photodiode determines the wavelength range to which the sensor is sensitive. For the ultraviolet range (wavelength below 400 nm) silicon is commonly used since it is sensitive between 190 and 1,100 nm (Werner et al., 2000). This sensitivity is not equal for all wavelengths within the interval and, therefore, a specific spectral response function for each sensor must be considered.
The main distribution channels of electronic devices offer a large number of sensors that could be implemented in the design. However, these distribution channels are specialized in high-end sensors and, therefore, not affordable for every user. Since the main idea is to promote the widespread use of low-cost UV sensors, the search focused on more general vendors, looking for sensors designed for mobile recreational electronics, with low-power consumption and being affordable for an average user. Among the variety of sensors available on the market, three different commercial UV-sensitive detectors were chosen because of their high popularity and low cost (less than 5 euros): the ML8511, the UVM30A and the VEML6075 (Figure 1). The great success of these sensors is due in part to their easy control via an Arduino or similar board. For each sensor model, two prototypes were built, labeled 1 and 2.
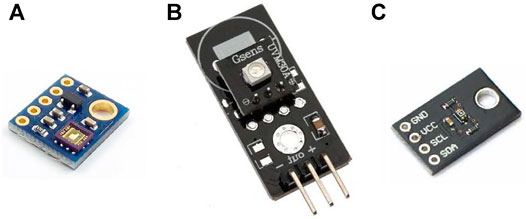
FIGURE 1. ML8511 (A), UVM30A (B) and VEML6075 (C) modules used in the study.
The ML8511 sensor is manufactured by LAPIS Semiconductor Co. (LAPIS Semiconductor Co., Ltd., 2013). It features a photodiode and an inner amplifier, providing a voltage analog output. This sensor has become notably popular, being mainly used for UV Index calculation (Zhang et al., 2013; Haryanto and Pratomo, 2017), learning electronics (Pramono et al., 2020) and studying the effect of UV radiation over materials (Wijatna et al., 2019).
Figure 2A shows the spectral response function of the different sensors as provided by the manufacturers. The figure also depicts a typical solar spectrum for day March 19, 2019 at 12:00 UTC weighted by the spectral response function of each sensor, in order to show the actual contribution of each wavelength to the final signal given by the sensors (Figure 2B).
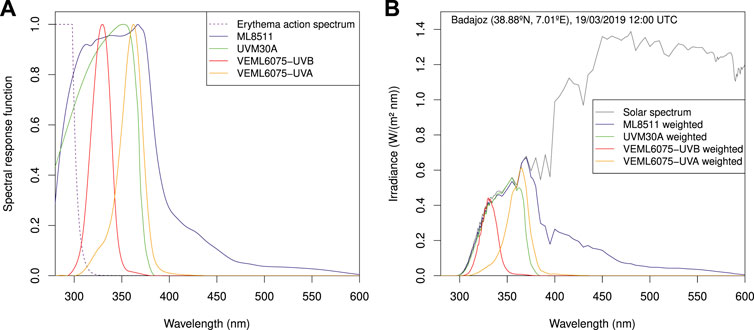
FIGURE 2. Spectral response function of sensors ML8511, UVM30A, VEML6075-B and VEML6075-A (A), and a typical solar spectrum weighted by their spectral response (B).
The ML8511 shows significant response mainly in the 280–400 nm wavelength range, and some sensitivity above 400 nm (Figure 2A). This sensitivity to the visible wavelengths results in a substantial contribution of the 33% of the total signal output due to the solar visible radiation. The peak sensitivity of the ML8511 is found within the interval 308–376 nm (values above 0.9) (Figure 2A).
The second type of UV module analyzed is the UVM30A, featuring a GUVA-S12SD sensor. This sensor has a simple photodiode GUVA-S12SD and provides analog output. It has been used for vitamin-D analysis (Gao et al., 2014) and to monitor the UV Index (Paredes Ccama, 2017; Quintero Cardenas, 2018; Htwe, 2020). However, most of these studies are limited to academic projects. The GUVA-S12SD sensor is sensitive in the whole UV range (Figure 2A) expanding from 280 to 380 nm, including both UVB and UVA intervals. Its peak sensitivity (values above 0.9) lies between 326 and 361 nm. Only UV wavelengths contributes to its output signal (Figure 2B), better representing the UV radiation than the previously analyzed ML8511.
The third sensor analyzed was the VEML6075. This is an advanced UV sensor manufactured by Vishay Semiconductors (Vishay Intertechnology Inc., 2016). It includes several channels and digital I2C output. It embodies various photodiodes with spectral responses sensitive to different parts of the ultraviolet wavelength range. The so-called channels UVA and UVB are sensitive to 350–370 nm and 320–340 nm, respectively. It also includes two compensation channels designed to counteract the contribution to the output signal of the visible and infrared wavelengths, respectively.
These sensors were used to build a device to measure UV radiation. Several prototypes were manufactured depending on the characteristics to be analyzed and the development stage of the device.
The two sensors with analog output (ML8511 and UVM30A) were connected to a PCF8591 analog-to-digital converter, manufactured by NXP Semiconductors (NXP Semiconductors, 2013). This A/D converter facilitates a 0–255 value and admits up to four analog sensors to be connected, which are managed by a multiplexer. It is a 8-bit widely used converter especially designed for low-consumption systems. It communicates through an I2C bus.
The VEML6075 sensor has already a 16-bit digital output since it integrates an A/D converter. It is also designed for low-consumption systems and communicates through an I2C bus. This sensor includes a Teflon diffuser to improve the angular response and prevent the existence of privileged directions that could result in higher response by the sensor. The software library developed by Adafruit Industries (Fried, 2019) was used for reading the measurements registered by the VEML6075 sensor.
In this work, different microcontrollers programmed with Arduino were used. They were chosen according to the needs of each step. The first prototype used a low-cost ESP8266EX microcontroller manufactured by Espressif Systems (Espressif Systems, 2020). It is easy to manage and has WiFi connectivity. Later on, an Arduino Mini Pro microcontroller was used. Finally, the final prototype included an ATmega328P microcontroller manufactured by Atmel Corporation (Atmel Corporation, 2015), with the same functionalities as the Arduino Mini Pro, but smaller size. Its cost is barely 2 euros. Different I2C buses were used to avoid address conflict when connecting the sensors to the microcontroller.
LoRaWAN was used as communication infrastructure for transmitting the measurements to Internet of Things (IoT). LoRaWAN is the protocol composed by gateways and nodes which is based on the wireless technology LoRa. Its deployment is notably increasing, especially on university campuses. This network standard addresses requirements characteristic of IoT. Since LoRaWAN does not allow the storage of information, the web ThingSpeak was used for that purpose. The first prototype also has WiFi connection, which was the communication used for the first tests and the calibration of the sensors.
The microcontrollers that have been used can not connect directly to the LoRa network and, therefore, a LoRa transceiver governed by the microcontroller is needed to communicate according to the LoRa protocol. For that aim, the low-cost transceiver RFM95W (about 5 euros), manufactured by Hope Microelectronics (Hope Microelectronics Co., 2006), was used. This transceiver is suitable as it operates in the 868.1 MHz band, which is the band specifically reserved for LoRaWAN in Europe.
In the final prototype, the sensor, the LoRa transceiver and the microcontroller were implemented on a small printed-circuit-board (PCB). For this purpose, the open source software KiCad (KiCad, 1992–2019) for electronic design automation was used. This suite allows schematic capture and PCB layout.
Adding the price of the electronic parts, the total cost of the device is barely 15 euros. This low cost makes it suitable for a large number of potential applications.
2.2 Calibration
To test the performance of the low-cost sensors in measuring solar ultraviolet radiation and calibrate them, they were installed outdoors at the BJZ radiometric station of the University of Extremadura (UEx) in the Campus of Badajoz, Spain. Its geographical coordinates are 38.88°N, 7.01°E, 199 m a.s.l. Badajoz is located in Southwestern Spain, near the Portuguese border. It corresponds to a Köppen-Thornwaite Csa climate, with mild winters, and very dry and hot summers. It features one of the highest solar radiation records in Europe, with UVI (ultraviolet index) of 9–10 in summer, and occasional extreme values of 11. The ultraviolet index is an international standard measure of the solar irradiance that produces sunburn and reaches a given location at a given time. It is calculated by integrating the spectral solar irradiance weighted by the erythemal action spectrum and multiplying the resulting value by the scale factor 40 m2/W to obtain a dimensionless number. The erythemal action spectrum was determined by McKinlay (McKinlay, 1987) and measures the effectiveness of each ultraviolet wavelength in producing sunburn on human skin. Thus, UVI measures the risk of sunburn, providing very important information for preventing harmful effects due to overexposure to solar radiation. Many weather stations provide measurements not of the bare ultraviolet irradiance, but of the erythemally weighted irradiance, i.e., the UVI.
The BJZ station is located on the roof of the Physics building, guaranteeing suitable conditions for radiometric measurements, with an open horizon free from obstacles and daily maintenance of the instrumentation. It is the main site of a radiometric network that covers Extremadura and Western Andalusia with 11 stations equipped with UV broadband radiometers measuring erythemally weighted irradiance (Schmalwieser et al., 2017). This network is operated in cooperation with the National Institute for Aerospace Technology (INTA), and daily reports measured and simulated UVI values. The BJZ station is maintained by the Department of Physics of UEx since it started up in 2002. It is fully instrumented with several Kipp & Zonen CMP11, UVS-E-T and CGR1 radiometers to measure solar and terrestrial radiation and its different components (global, direct, diffuse) in different wavelength ranges. Its is also well equipped with a Jenoptik 15 k-Nimbus ceilometer and a SONA 202U all-sky for cloud monitoring. As part of the AERONET network for aerosol measurement (Holben et al., 1998), the station is also instrumented with a CIMEL-318 and follows AERONET’s measurement and calibration protocols.
Regarding UV radiation, the station is equipped with three Kipp & Zonen UVS-E-T broadband radiometers to measure global erythemal solar radiation and its diffuse component independently. For diffuse measurements, the radiometers are shaded by different devices, such as a shadow band and a sun tracker with shading balls.
The UVS-E-T radiometers were calibrated during the 14th Intercomparison Campaign of the Regional Brewer Calibration Center-Europe held in “El Arenosillo” Atmospheric Sounding Station in Mazagon (Spain) from 17 to June 28, 2019. Their spectral and angular responses were characterized in laboratory following procedures that have been contrasted with those used at the PMOD/WRC (Gröbner et al., 2006). The European standard for spectral UV measurements, the QASUME unit (Bais et al., 2003), was used as reference for the comparison outdoors. The calibration followed the procedure recommended by the COST Action 726 for broadband UV radiometers (Webb et al., 2006; Vilaplana et al., 2007).
2.2.1 Leveling
Prior to the measurements, the first step was to achieve accurate horizontal leveling of the sensors. Since the irradiance measured outdoors by the sensor is highly dependent on the angle of incidence of the radiation according to Lambert’s cosine law, accurate leveling is essential to obtain reliable measurements. In general, standard radiometers integrate a spirit level for this purpose. However, in the case of low-cost sensors, a spirit level is not available and the use of an external spirit level is inappropriate for two main reasons. On the one hand, the small size of the sensor module does not provide a flat surface large enough to securely support the bubble level without clearance. On the other hand, there is no guarantee that the photodiode is soldered perfectly horizontal to the surface of the sensor module.
Therefore, a different methodology was devised. Each sensor was installed on a small printed circuit board (PCB) and three leveling screws were fixed to the PCB forming an isosceles triangle. By adjusting the height of the screws in two perpendicular directions, each sensor could be leveled independently of the rest. This entire leveling system is mounted on a wooden platform that serves as a base, so that the screws are screwed into nuts fixed to the wooden platform. This platform, in turn, is placed on a graduated turntable that allows for different azimuth orientations of the sensors with respect to the sun. Using an angled bubble level, the leveling of both the wooden board and the turntable was tested and guaranteed. With this setup, an independent leveling was performed for each sensor.
The leveling of each sensor was performed in turn for two perpendicular azimuth directions: 0°–180° and 90°–270°, with this value being the azimuth angle between the large side of the PCB and the azimuth direction of the sun. Thus, a measurement at 90° was registered and, then, the turntable was rotated 180° and a second measurement corresponding to an angle of 270° was registered. If the two measurements differ, the leveling screws in the direction 0°–180° were adjusted to compensate the difference and new measurements were performed at 90° and 270°. The procedure was repeated until the same value was obtained for both azimuth angles. Once this direction was leveled, the procedure was repeated for the other direction (0°–180°), where the leveling is now performed by adjusting only the third screw, so as not to affect the 90°–270° leveling previously achieved.
2.2.2 Absolute Calibration
Once leveled, the sensors were oriented facing south and registered solar radiation continuously along an entire day. Measuring at different solar angles is interesting in order to test the performance of the different sensors to accurately measure the daily evolution of solar ultraviolet radiation. The day March 19, 2019 was selected due to its permanently cloud-free sky, and stable aerosol and ozone conditions along all the day. Cloud-free conditions were preferred since they allow to better test the angular response of the sensors. Under these conditions the relative contribution of the direct UV radiation to the global is very high (up to 60%) and, therefore, the angular response of the sensors acquires more relevance. Additionally, while cloud-free conditions can be reliably modeled by radiation transfer codes, the simulation of cloudy conditions requires information about the clouds that is usually unavailable and, therefore, the model estimations can not be used for calibration purposes.
Since the spectral responses of the sensors notably differ from the erythema action spectrum followed by our Kipp & Zonen UVS-E-T radiometer, it can not be used as reference. Instead of that, a model must be used to calibrate the sensors. For that aim, the Santa Barbara discrete ordinates radiative transfer (DISORT) Atmospheric Radiative Transfer (SBDART) code (Ricchiazzi et al., 1998) in its 2.4 version was used. This model is widely used for radiation transfer simulations in different applications (Tzanis and Varotsos, 2008; Zhang et al., 2014; Fu et al., 2017), and specifically for UV radiation (Panicker et al., 2009; Piedehierro et al., 2017; Sanchez et al., 2017). It has been properly validated by comparison with experimental measurements under different conditions (Barnard and Powell, 2002; Utrillas et al., 2007; Obregón et al., 2015), and successfully contrasted against other radiation transfer codes (Halthore et al., 2005).
The SBDART model was run with sixteen streams, a total ozone amount of 269.8 DU as measured by the National Institute for Aerospace Technology, and aerosol parameters provided by the Aerosol Robotic Network (AERONET) network for the BJZ station. Total ozone amount was measured by a Brewer spectrophotometer at “El Arenosillo” Atmospheric Sounding Station of INTA in Mazagon (Spain), being the nearest station with total ozone column measurements. Aerosol optical thickness, single scattering albedo, and asymmetry parameters at the wavelengths 440, 675, 870, and 1,020 nm were obtained from the CIMEL-318 of our AERONET station, which is just next to the UV sensors.
First, in order to check the performance of the model for our local conditions, erythemally weighted UV irradiance for March 19, 2019 was simulated on a 1 min basis, and these modeled values were compared with the experimental measurements provided by our well-calibrated Kipp & Zonen UVS-E-T. Simulated and measured values compare well (Figure 3), with the model slightly underestimating the experimental values in 2.7%. A linear regression of modeled versus measured values gives a coefficient of determination of 0.999 and a relative root mean square error of only 0.6%. These figures confirm that the model, fed with the selected inputs, provides reliable estimations of the UV solar irradiance on March 19, 2019.
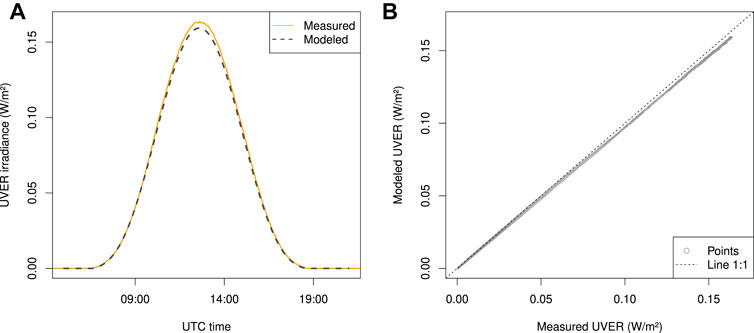
FIGURE 3. Comparison of modeled and measured erythemally weighted irradiance during March 19, 2019: diurnal evolution (A) and regression (B).
Once validated, the model was applied by weighing the output spectrum with the spectral response function specific to each sensor (Figure 2). In this way, reference values for calibrating each sensor were obtained. These reference values include the particular spectral sensitivity of each sensor. Subsequently, the calibration factor of each sensor was calculated by a linear regression between the simulated UV irradiance weighted by its spectral response function and the voltage measured by the sensor.
2.2.3 Angular Response
In order to characterize the angular response of the sensors, a specific experiment was conducted outdoors on April 24, 2019. This cloud-free day was selected because of its stable meteorological conditions and clear sky. The sensors were installed on a turntable and leveled. Then, they measured the solar UV radiation while the turntable was rotated to span azimuth angles from 0° to 360° in 15° steps. Five measurements were taken at each azimuth angle, the first one of the five was rejected since it could be affected by the motion of the turntable. The average of the other four values was taken as the measurement for that azimuth. A clockwise rotation of the turntable was followed by a counterclockwise rotation in order to compensate the sun motion along the 30 min that the measuring procedure lasts. In this way, the average of the two measurements taken for the same azimuth angle can be assigned to the central time of the measuring period. This experiment was conducted at different times of the day in order to also analyze the effect of the solar zenith angle.
In order to better study the angular response of the sensors, the direct solar irradiance needs to be obtained. For this aim, in addition to measuring the global solar UV irradiance, the sensors were occasionally shadowed in order to measure the solar UV diffuse component. Thus, the direct irradiance was calculated as the difference between the global and the diffuse irradiance. In order to measure the diffuse component of the radiation, the sensors were manually shadowed in turn, using a small disc that completely shaded the diffuser of the sensor.
2.3 Portability
Once the sensors have been leveled and their absolute calibration and angular response have been studied, the next step is to investigate whether a portable device can be built. The main requirements for this aim are: to be compact, small, wireless, and with long distance connection and low power consumption. With these requirements, a second version of the device with an ATMega328P microcontroller was built (Figure 4 (left)). In this step, the VEML6075 sensor was used because it is more demanding than the other sensors. Thus, the fulfillment of the requirements by this sensor guarantees the compliance of the other sensors.
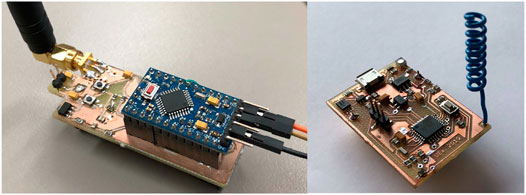
FIGURE 4. Second and third versions of the device.
The WiFi connection had to be replaced by LoRa communication to make it suitable for distance and energy requirements. Thus, LoRa communication was preferred in this study since, due to its shorter bandwidth, it requires lower energy consumption than other technologies such as WiFi or GSM. Additionally, LoRa modulation provides more link budget and, therefore, longer reach. Thus, the LoRa 868.1 MHz propagates better than the 2.4 GHz used by WiFi. The existing LoRaWAN gateway on the University Campus was used to upload the measurements to the Internet. This gateway operates in the 868.1 MHz band. A LoRa RFM95W module connected to the Arduino Mini Pro was used to communicate over the LoRaWAN network. This module serves as the interface between the microcontroller and the LoRaWAN gateway. The module was registered with credentials on the TTN (The Things Network) website and programmed according to the instructions given by (Telkamp and Kooijman, 2019). The payload transmitted through LoRa included 2-bytes data of UVA, UVB, compensation channel 1, compensation channel 2 and battery voltage, totaling 10 bytes. The LoRa setup recommended by LoRaWAN was used, consisting of a spreading factor of 7 and 125 KHz bandwidth. The resulting transmission rate is 5.5 Kbits/s, low but enough for this type of applications, and the time on air 61 ms. Since data were sent every minute, the duty cycle was 0.1%, being much lower than the limit of 1% allowed for the 868.1 MHz, as established by ETSI EN300.220.
To be portable and autonomous, the device must be powered by batteries instead of being plugged into the electrical grid. Therefore, its energy consumption and autonomy must be assessed. To achieve low power consumption and consequently long autonomy, all components were selected to be energy efficient. The second prototype was powered by a 750 mA⋅h Li-Ion battery. The microcontroller is put into a sleeping mode to reduce power consumption when it is neither receiving nor sending data. A first study of each individual component identified the VEML6075 sensor as a major source of power consumption. Then, it was forced to shut down when not measuring, resulting in a reduction in consumption from 500 to 6.8 μA during the sleeping mode. Following this individual study, a comprehensive study of the consumption of the complete device was conducted for a full cycle (including active and sleeping stages). Three active modes were identified: measurement, communication check and data sending. The frequency of measurements determines the number of cycles and, subsequently, the consumption, which limits the autonomy time. For this second version device, it was decided to measure every 30 s. However, the third and final version included a 120 mA⋅h battery. Also it used a lower frequency of one measurement per minute in order to enlarge its autonomy.
With all the knowledge acquired, a third and final device was developed. It was designed from scratch for better optimization. Its main requirements concerned battery supply, minimum power and physical resources, compact and small size. A minimum set of electronic components was selected and they were individually required to demand low power consumption.
KiCad software was used to design the two (front and rear) faces of the PCB, including the microcontroller, sensor, LoRa module and charge module for the battery. Besides the ATMega328P, the microcontroller included also a resonator, in charge of generating the periodic clock signals used by the microcontroller. In addition, a button was included to reset the device when necessary. The charge module integrates several components: an USB OTG port, TP4056 charge regulator, DW01-P protector, FS8205A double transistor, HT7333 linear regulator of voltage that guarantees 3.3 V supply, and LIR2450 Ion-Li battery with a maximum charge of 120 mA-h. The PCB board was designed to be as small as possible. It was manufactured using a LPKF ProtoMat H100 milling machine. The front face contains a larger number of components and was soldered using an INSA M962A reflow oven. Subsequently, the rear face was soldered by hand. This final device is shown in Figure 4 (right).
3 Results
This section presents the main results obtained in the analysis of the different prototypes and devices built for the study.
3.1 Leveling
The leveling results provided the first insight into the angular response issues shown by the low-cost UV sensors. Figure 5 depicts the output signal obtained when the two ML8511 sensors and the two UVM30A sensors were horizontally leveled.
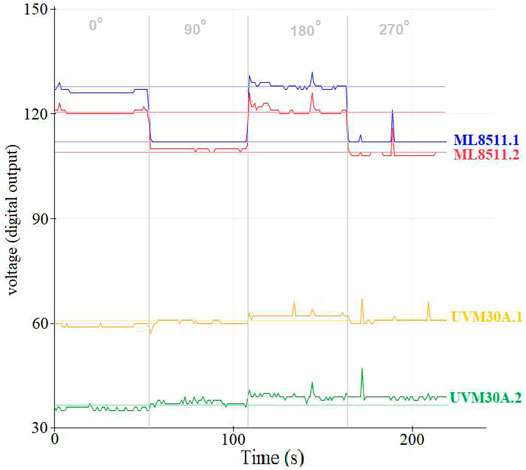
FIGURE 5. Signal output of the two ML8511 and the two UVM30A sensors, once leveled.
It should be noted that, although the leveling was performed in two perpendicular directions that are supposed to be independent, adjusting the leveling along the azimuth direction 0°–180° slightly affected the already leveled 90°–270° values. Therefore, the best leveling could only be achieved by successive adjustments, and the final output signals are shown in Figure 5. It can be seen that no perfect leveling was possible, with small differences remaining between specific opposite directions. In addition to the impossibility of leveling each pair of directions independently, once leveled, a notable difference was observed between the output signal measured at the 90°–270° and 0°–180° directions. This difference is approximately 12% for the ML8511.1, 8% for the ML8511.2, 8% for the UVM30A.1, and 13% for the UVM30A.2. These facts are the first signal of an irregular angular response.
As mentioned before, the VEML6075 module contains a sensor for UVB (labeled channel B) and another one for UVA (labeled channel A). Figure 6 show the output signal for the two VEML6075 sensors once leveled. The leveling procedure showed that no simultaneous leveling of the channels A and B could be achieved. Thus, leveling the output signal of channel A caused unleveling the output signal of channel B, and viceversa. This is due to the fact that each channel uses its own photodiode. Similar behavior was found for the compensation channels, which could not be leveled simultaneously to channels A or B. Therefore, a compromise solution had to be taken. Since two VEML6075 modules were available, it was decided to level the channel A of one sensor, and the channel B of the other. An additional problem was found for the already leveled channels; its output signal in directions 90°–270° and 0°–180° differed. Thus, once leveled, channel A showed a difference of 5.1% between 90°-270° and 0°–180°, and channel B showed a difference of 11.1% between 90°-270° and 0°–180°.
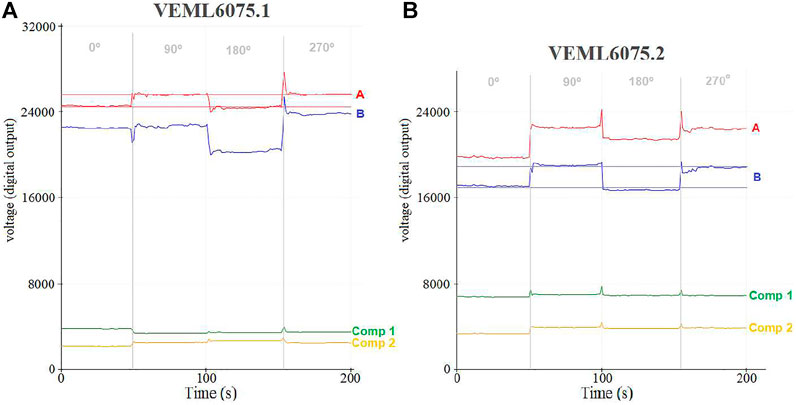
FIGURE 6. Signal output of the sensors VEML6075.1 (A) and VEML6075.2 (B) once leveled.
3.2 Absolute Calibration
Figure 7A shows the output signal from the ML8511.1 and ML8511.2 sensors when measuring solar radiation outdoors during the cloud-free day March 19, 2019, along with the irradiance estimates provided by the model as weighted by the spectral response of the ML8511. The stepped aspect of the figure is due to the number of bits in the converter which, in the case of the PCF8591, is 8, resulting in values between 0 and 255. It is worth remembering that the sensors show similar behavior but different amplitude, indicating a different value of the calibration factor. In addition, a slight asymmetry is observed suggesting an azimuth-dependent angular response.
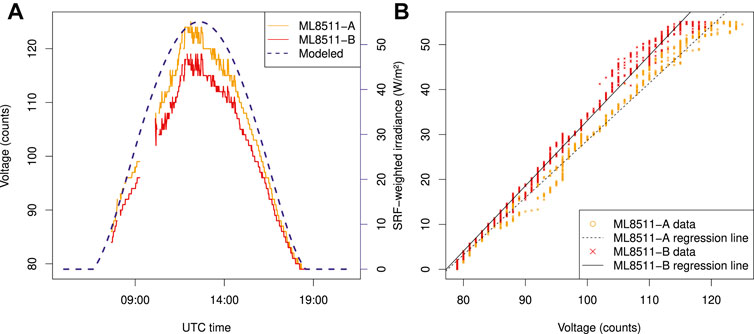
FIGURE 7. Comparison of model estimations and ML8511 measurements: diurnal evolution (A) and regression (B).
The output signal of both ML8511 sensors increase approximately linearly with the solar irradiance (Figure 7B), but with different slopes, indicating the need for the manufacturer to provide an individual calibration for each sensor. The relative difference in the calibration slope between the two ML8511 sensors is 13%. Table 1 shows the main statistics of the linear regressions of the different sensors used in this study. The ML8511 sensors present the best values of the coefficient of determination (R2) and a root-mean-square error (RMSE) around 2 (W/m2).
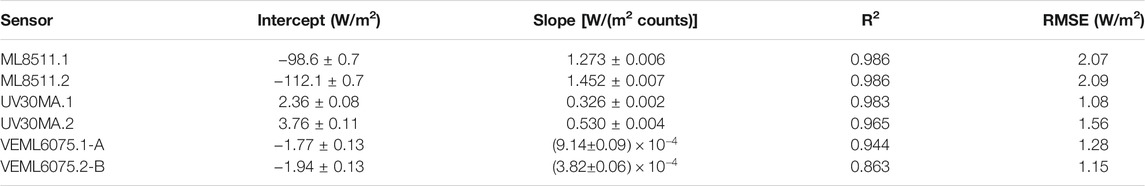
TABLE 1. Statistics of the linear regressions between the modeled irradiance and the output voltage of the sensors of the study.
Figure 8A shows the diurnal evolution of the solar UV radiation as measured by the two sensors UVM30A along the March 19, 2019. The modeled irradiance weighted by the UVM30A spectral response has been also plotted, showing the expected behavior. Although the output signal does not follow exactly that expected evolution, a generally symmetric pattern is found. This symmetry is clearer in UVM30A.1, while the UVM30A.2 pattern is slightly skewed to the left. A symmetric pattern with respect to the noon indicates no azimuth dependence, as it is required for a reliable monitoring.
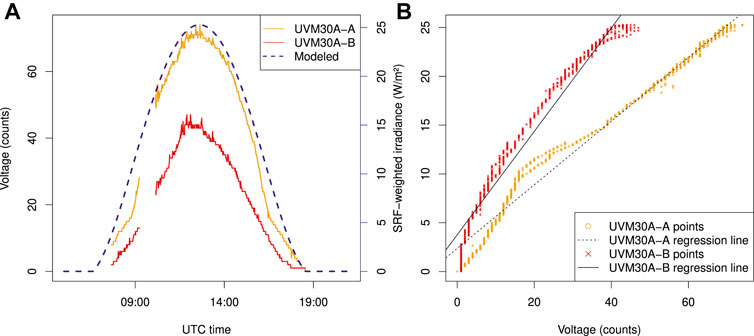
FIGURE 8. Comparison of model estimations and UVM30A measurements: diurnal evolution (A) and regression (B).
The UVM30A sensors present the best RMSE values, being only 1.08 W/m2 for UVM30A.1 (Table 1). Although both sensors show a similar daily pattern, their amplitudes differ substantially (Figure 8A). This is confirmed by the regressions (Table 1), with a slope for UVM30A.1 being 0.6 times the value of UVM30A.2.
Figures 9A,10A show the diurnal evolution of the solar UV irradiance as measured by sensors VEML6075.1-A and VEML6075.1-B, along with the irradiance estimated by the SBDART model and weighed by the specific spectral response function of each sensor. Both sensors roughly follow the diurnal pattern of the radiation. However, their diurnal curves do not show the expected symmetry with respect to the solar noon, indicating some azimuth dependence. Additionally, some fluctuations can be observed that are more evident in sensor VEML6075.1-A than in VEML6075.2-B.
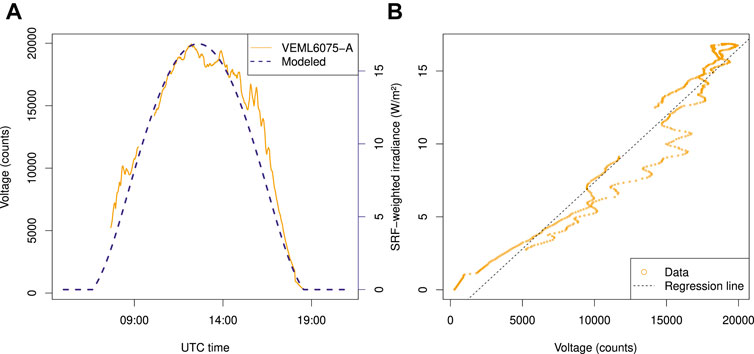
FIGURE 9. Comparison of model estimations and VEML6075.1-A measurements: diurnal evolution (A) and regression (B).
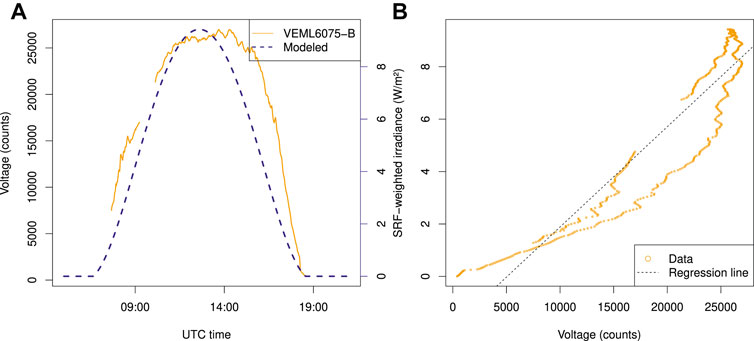
FIGURE 10. Comparison of model estimations and VEML6075.2-B measurements: diurnal evolution (A) and regression (B).
The regression of the output signal of the sensors versus the irradiance is shown in Figures 9B, 10B. Although the sensitivity of the sensors to the UV radiation is confirmed, the agreement is worse than for the other sensors analyzed, with R2 values of only 0.944 and 0.863 for sensors VEML6075.1-A and VEML6075.2-B, respectively. It is worth to remember that channel A is studied for sensor VEML6075.1, and channel B for sensors VEML6075.2 and, therefore, no similar slope values can be expected.
3.3 Angular Response
The diurnal evolution of the output signal of the sensors during a cloud-free day resulted in asymmetric curves for some of the tested sensors. Since the day was rather stable in terms of ozone and aerosols, and no asymmetries were found in the measurements performed by a high-quality secondary standard Kipp & Zonen UV-S-E-T radiometer 3, it can be concluded that these asymmetries correspond to the angular response of the low-cost sensors. To investigate this topic in more detail, a specific experiment was conducted following the procedure described in the Materials and methods section.
Figures 11–13 illustrate the azimuth response of the different sensors as measured outdoors while rotating the turntable in order to test the response to different azimuth angles with respect to the sun. The figure on the left illustrates the output signal measured at different times in the day (13:00, 15:00 and 17:00 UTC). Normalized values of the output signal, instead of absolute values, have been plotted to allow comparison for different times of the day. Thus, the values have been divided by the mean value and the curve has been interpolated by splines in order to better show the angular response. The polar figure on the right shows the time-averaged values for each available azimuth angle.
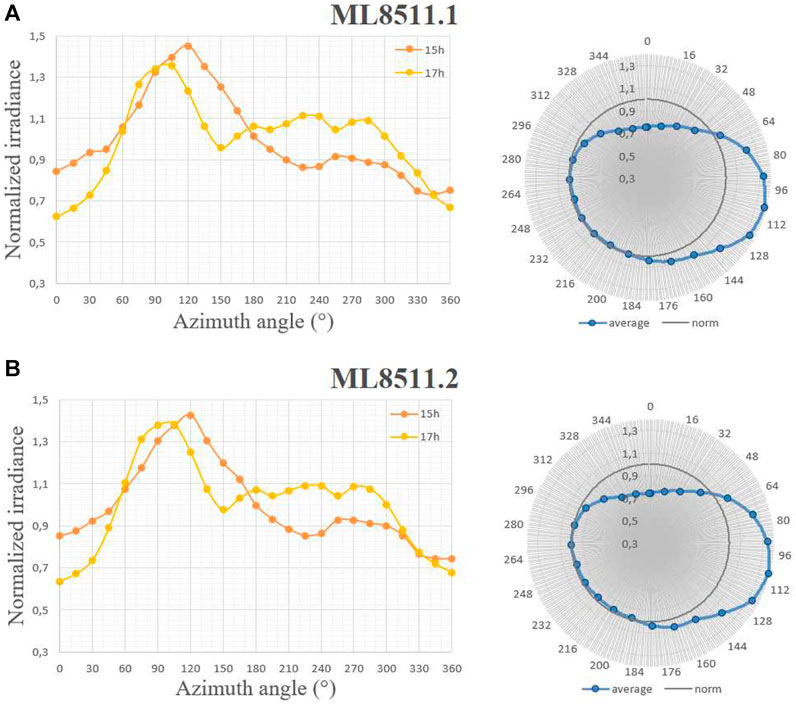
FIGURE 11. Azimuth response of sensors ML8511.1 (A) and ML8511.2 (B): Output signal for different azimuth angles at different hours (left) and mean azimuth response (right).
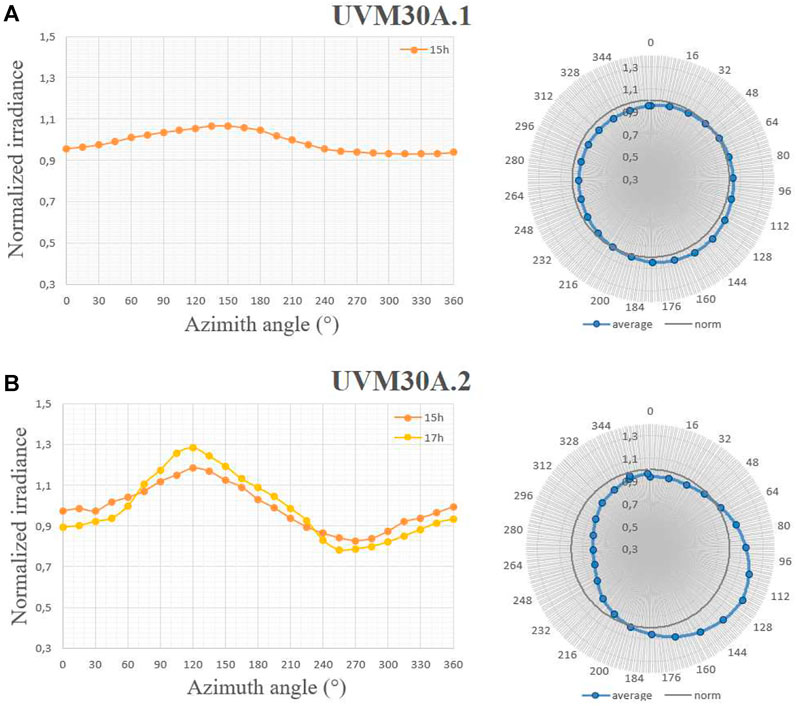
FIGURE 12. Azimuth response of sensors UVM30A.1 (A) and UVM30A.2 (B): Output signal for different azimuth angles at different hours (left) and mean azimuth response (right).
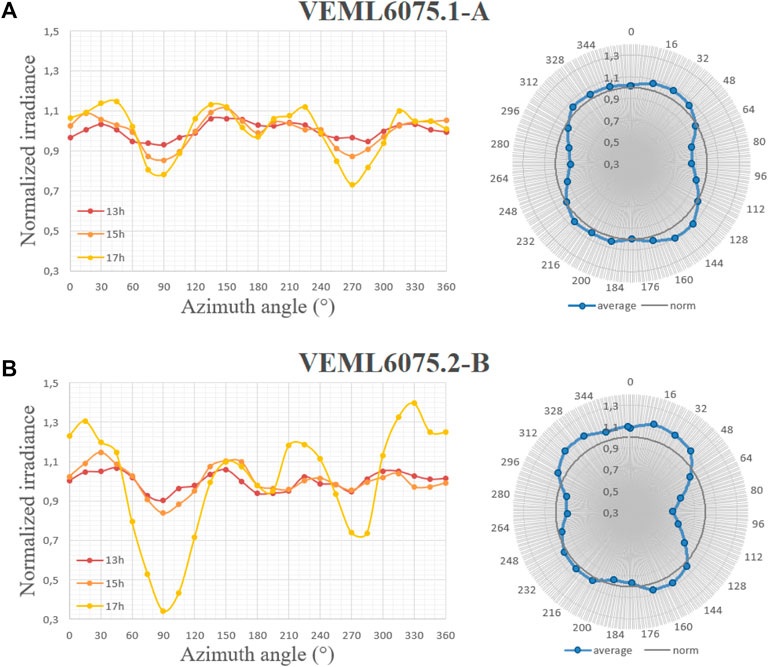
FIGURE 13. Azimuth response of the channel A of the sensor VEML6075.1 (A) and the channel B of the sensor VEML6075.2 (B): Output signal for different azimuth angles at different hours (left) and mean azimuth response (right).
The angular responses of ML8511.1 and 0.2 are shown in Figure 11A,B, respectively. Both sensors show nearly identical response with a marked maximum around 100° and a minimum around 0°, with a variation amplitude of 77%. This high difference between minimum and maximum highlights the importance of paying attention to the angular response in the design and manufacturing processes of a radiation sensor. The dependence on the azimuth angle can be clearly observed in Figure 11D, where the mean azimuth response is shown.
It is to note the displacement in the angle corresponding to the maximum from 90° at 15:00–120° at 17:00. This combined dependence on the zenith and azimuth angles indicates a likely issue related to tilting or misalignment of the photodiodes with respect to the light entrance.
The azimuth responses of the sensors UVM30A.1 and 0.2 are shown in Figure 12. Measurements are only available at one time (15:00) for UVM30A.1 and at two different times (15:00 and 17:00) for UVM30A.2 due to a connection failure.
The UVM30A.1 sensor shows very little dependence with the azimuth angle, while the sensor UVM30A.2 shows a marked azimuth response with an amplitude range about 45%. This amplitude increases with the zenith angle, going from around 40% at 15:00 to around 50% at 17:00. The two sensors agree in the location of maximum response at 120° and minumum at 270°.
Figure 13 shows the normalized signal output of the channels A and B of the VEML6075.1 and 0.2 sensors, respectively, at three different times (13:00, 15:00 and 17:00) of the day. It can be clearly observed that the response highly depends on the azimuth, with four local minima around 0°, 90°, 180° and 270° and four local maxima around 30°, 150°, 220° and 330°. The amplitude of these minima and maxima increases with the zenith angle, indicating the angular response depends simultaneously on both solar angles, zenith and azimuth. The behavior shown by channels A and B is very similar. The mean azimuth response is plotted in Figure 13 (right), clearly indicating the existence of privileged orientations.
3.4 Portability
The third and final version (Figure 4 (right)) features LoRa connectivity for long distance. This LoRa connectivity was tested sending messages from different locations within the University Campus, covering a 1.4 km × 0.37 km area (Figure 14). The LoRaWAN gateway was installed on the roof of the Physics building, with an open horizon free from obstacles. The strength of the connection to the LoRa network is measured by the RSSI (Receiver Signal Strength Indication). This parameter is directly related to the remaining link budget, i.e., with the intensity of the signal received at the receptor. Given the LoRa link budget, if the payload, the power transmitted to the signal, the antenna gain and the distance and obstacles between the transmitter and the receiver are known, the RSSI can be obtained. The RSSI value is a negative number scaled in decibels, whose absolute value increases with decreasing signal, i.e. with increasing distance to the gateway or interfering obstacles.
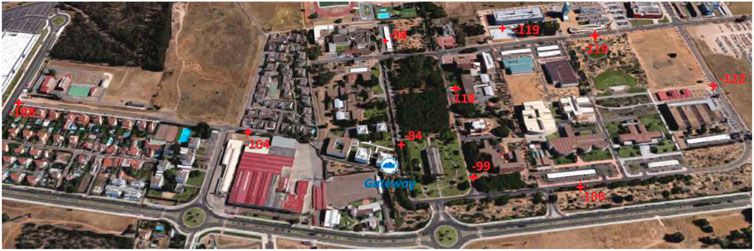
FIGURE 14. Campus of the University of Extremadura in Badajoz, Spain, with the RSSI measured at different locations. Background image taken from Google Maps (2021).
Thus, the LoRa connection of the device was assessed at different locations within the University Campus. First, the device was placed next to the gateway, obtaining an RSSI of −27 dB. Then the device was moved to other locations and RSSI values were recorded (Figure 14). It was observed that RSSI decreases rapidly as moving away from the transmitter. An RSSI value of -84 dB is obtained at tens of meters from the transmitter even without obstacles. Thus, the strength ranged from −27 dB at 1 m from the gateway, to −122 dB at 698 m at the farthest location to the East in the University Campus. This reduction was due to distance and also to the attenuation by physical obstacles such as buildings and tall trees. Thus, while RSSI is −108 dB at 749 m to the West, it decreases to −122 dB at only 698 m to the East, being this difference mainly due to the attenuation by the buildings and tall trees. Therefore, the LoRa communication proved to be suitable for the purpose of the study.
This third and final version device benefited from the knowledge acquired during the development of the previous versions, as described in the Materials and Methods section. Power consumption was another focus area specifically improved during the development process. The consumption per cycle of this final version in the active mode was accurately measured by a Picotech Picoscope 5203 digital oscilloscope and an Aim-TTi I-prober 520 clamp ammeter, obtaining a mean value of (40.8 ± 3.1) mA⋅s. In the sleeping mode, it was reduced to (556 ± 6) μA⋅s, as measured by an AMPROBE 37XR-A microammeter. In total, the consumption over a full cycle is (41.4 ± 3.3) mA⋅s. Thus, if a LIR2450 battery with a charge of 120 mA⋅h is used, the device can perform (10400 ± 800) 1-min cycles. This means an autonomy of seven complete days, or 14 days if working only during daylight hours.
4 Discussion
The study has investigated the possibility to develop a portable device to accurately measure the UV radiation, using the popular low-cost modules ML8511, UVM30A and VEML6075. For that aim, different prototypes have been built and their performance has been compared. Different aspects have been analyzed, such as their spectral response, leveling, angular response, comparison with reference data, connectivity and power consumption. The fact that most studies focused on low-cost UV sensors are limited to the academic context indicates the need for these sensors to improve their performance in order to achieve a wider use. This paper contributes in this way by identifying some important characteristics that should be improved.
The three sensors analyzed are sensitive to the UV wavelengths (Figure 2) with significant response in the expected 280–400 nm wavelength interval. Specifically, ML8511 has its main response between 286 and 386 nm, UVM30A between 286 and 368 nm, VEML6075 channel A between 348 and 374 nm, and VEML6075 channel B between 317 and 341 nm. The module UVM30A is advertised (Rambal, Automatización y Robótica, 2021) as suitable for measuring the UVI (ultraviolet index), and has been used for this purpose in some studies (Paredes Ccama, 2017; Quintero Cardenas, 2018; Htwe, 2020). Also the module ML8511 has been used to monitor the UV Index (Zhang et al., 2013; Haryanto and Pratomo, 2017). However, their spectral response (Figure 2) are very different from the erythemal action spectrum internationally adopted under the umbrella of WHO, WMO and ICNIRP (WHO, 2002) for the definition of the UVI. This action spectrum recreates the spectral sensitivity of human erythema (McKinlay, 1987), with the highest values for wavelengths below 300 nm and an exponential decay from there on (Figure 2A). Therefore, the ML8511 and UVM30A modules, although being sensitive to UV radiation, provides no accurate measure of the UVI. This fact is in clear disagreement with their use in several studies (Zhang et al., 2013; Haryanto and Pratomo, 2017; Paredes Ccama, 2017; Quintero Cardenas, 2018; Htwe, 2020).
On the other hand, the module VEML6075 is advertised as able to provide UVA and UVB measurements (Vishay Intertechnology Inc., 2016). Thus, it offers two UV channels, named as UVA and UVB by the manufacturer. Their spectral responses are shown in Figure 2. These channels UVA and UVB are mainly sensitive in the intervals 348–374 and 317–341, respectively. It is to note that the contribution of wavelengths below or equal to 315 nm (i.e. UVB wavelengths) means only 3.5% of the output signal of the so-called UVB channel. In fact, both UVA and UVB channels fall within the UVA interval. Therefore, for the sake of clarity, in this study the channels will be preferably named as A and B, keeping in mind that they both correspond mainly to UVA measurements. It would be advisable that the manufacturer correct the information given in the characteristic sheet to avoid confusion.
It is also to mention that the ML8511 sensor suffers from a serious shortcoming. It shows significant response not only in the ultraviolet 280–400 nm wavelength range, but also in the visible range (Figure 2A). Although low, this non-zero sensitivity at visible wavelengths (wavelengths above 400 nm) is a serious drawback, since solar radiation in the visible range can be five orders of magnitude greater than in the ultraviolet range, making a substantial contribution to the final signal. This contribution can be clearly seen in Figure 2B, with a large area under the ML8511 line for wavelengths above 400 nm, accounting for 33% of the total area. Since different wavelengths are differently affected by atmospheric components (gases, clouds and aerosols), the measurements provided by this sensor can not be attributed exclusively to UV radiation.
The irregular angular response is the main issue detected in the analyzed modules. The first sign was found during the leveling (Figures 5, 6). Two problems were detected. First, difficulties in simultaneously leveling the sensor in two perpendicular directions. Second, the markedly different output values obtained between the perpendicular directions once the sensors were leveled. These facts indicate a probable tilt and/or misalignment of the photodiode with respect to the light entrance. This shortcoming should be corrected by the manufacturers to achieve more widespread use. In addition, the leveling procedure showed that no simultaneous leveling of the channels A and B of the module VEML6075 could be achieved, indicating a serious limitation of this module. Although two channels are provided, only one can be leveled at a time and, therefore, only one can provide reliable measurements.
These issues were confirmed with the angular study. In this experiment, the azimuth response was determined by exposing the sensor to solar radiation while changing the azimuthal angle by rotating the turntable. The sensors showed different angular responses (Figures 11–13). The best response (almost no azimuth dependence) was found for the module UVM30A, especially for the prototype UVM30A.1 (Figure 12). In contrast, the module VEML6075 shows a very irregular azimuth response, with four angles with maximum response and four angles with minimum response. This behavior is found for both A and B channels (Figure 13). Although there could be several factors causing this behavior, a likely contributor could be their rectangular shape. This geometry could help explain the four privileged angles found. The module ML8511 shows intermediate behavior, with a main maximum and minimum, and some small fluctuations in between (Figure 11). The improved angular response of the module UVM30A could probably be due to the fact that it has a circular diffuser. In fact, high-cost radiometers following strict quality protocols use circular diffusers to avoid azimuth asymmetries. This solution could be interesting for modules with poor angular response.
The radiometric sensitivity of the modules to UV radiation was characterized by comparing their measurements over an entire cloud-free day with estimates provided by a well-calibrated radiative transfer model for the specific spectral response of each module (Figures 7–10). Measuring over the course of a day provides information on the response of the sensors to a wide range of radiation intensity, as well as to the different zenith and azimuth angles covered throughout the diurnal relative motion of the sun. The prototypes ML8511 and VEML6075 show an asymmetric pattern with respect to noon, in line with the azimuth-dependent angular response mentioned above. As expected, the output signal of all sensors increases approximately linearly with solar irradiance (Figures 7B–10B). However, the two sensors of the same type fit different regression lines. This fact is especially important in the case of the UVM30A prototypes, with a 60% difference in slope (Table 1). The different values of the regression intercept and slope indicate the need to calibrate each sensor individually and advise against the usual practice of applying the same calibration coefficients for all sensors belonging to the same model. The overall performance is very good for the modules ML8511 and UVM30A, with R2 above 0.98, except for the UVM30A.2 prototype, which is 0.96. The module VEML6075, mainly its prototype 2, shows poorer values (Table 1), probably due to its more irregular angular response.
An important requirement for the device was the portability. It substantially improved along the development of the different versions. The third and last version of the device implements LoRa connectivity and low power consumption. The LoRa communication proved to be suitable for distances longer than 0.7 km (Figure 14), and the optimized power consumption allows up to 14 days of autonomy if working only during daylight hours. These characteristics confirm the success of the development and promote the use of these low-cost sensors for mobile applications.
Therefore, the devices developed have proven the suitability of these sensors for UV applications, provided a good angular response of the sensors is ensured. The available technology regarding control and communication allows to build UV-sensitive devices with application to air quality. The main limitations correspond to the sensors, which should improve their angular response. This angular response has shown to be the main issue encountered, notably limiting the accuracy of the measurements and, therefore, preventing the low-cost sensors from a more widespread use.
This study includes the procedures and instrumentation necessary to develop a low-cost, ultraviolet photosensitive device capable of connecting to the Internet via LoRa communication. It not only analyzes the possibilities and limitations of low-cost sensors to build such a device, but also proposes methodological procedures to calibrate and test the performance of the sensors. In addition, it contributes to a wider use of these sensors for the measurement of air quality variables, by identifying those characteristics that need to be improved by manufacturers in order to comply with standards.
Data Availability Statement
The datasets presented in this study can be found in online repositories. The names of the repository/repositories and accession number(s) can be found below: https://figshare.com/articles/dataset/Dataset_corresponding_to_the_development_of_a_low-cost_device_for_measuring_solar_ultraviolet_radiation/14923911.
Author Contributions
AS: designed the study; performed meteorological measurements and simulations; analyzed data, specifically calibration; wrote the paper. JAG: built prototypes; performed measurements with low-cost sensors; analyzed data; revised the paper. CJGO: designed the study; selected and acquired the electronics components; design the electronics; built prototypes; performed measurements with low-cost sensors; analyzed data, specifically connectivity and power consumption; revised the paper.
Funding
This work is part of the R + D + i grants RTI 2018-097332-B-C22 funded by MCIN/AEI/10.13039/501100011033/and “ERDF A Way of Doing Europe”, and GR18097 funded by Junta de Extremadura and “ERDF A Way of Doing Europe”.
Conflict of Interest
The authors declare that the research was conducted in the absence of any commercial or financial relationships that could be construed as a potential conflict of interest.
Publisher’s Note
All claims expressed in this article are solely those of the authors and do not necessarily represent those of their affiliated organizations, or those of the publisher, the editors, and the reviewers. Any product that may be evaluated in this article, or claim that may be made by its manufacturer, is not guaranteed or endorsed by the publisher.
Acknowledgments
Thanks are due to the AERONET network and the National Institute of Aerospace Technology for providing meteorological data.
References
Andrady, A. L., Torikai, A., Redhwi, H. H., Pandey, K. K., and Gies, P. (2015). Consequences of Stratospheric Ozone Depletion and Climate Change on the Use of Materials. Photochem. Photobiol. Sci. 14, 170–184. doi:10.1039/c4pp90038c
Atmel Corporation (2015). ATmega328P, 8-bit AVR Microcontroller with 32K Bytes In-System Programmable Flash. San José, California: Atmel Corporation. 7810d-avr-01/15 edn.
Bais, A. F., Blumthaler, M., Gröbner, J., Seckmeyer, G., Webb, A. R., Gorts, P., et al. (2003). Quality Assurance of Spectral Ultraviolet Measurements in Europe through the Development of a Transportable Unit (Qasume). Ultraviolet Ground-and Space-Based Measurements, Models, Effects (International Soc. Opt. Photonics) 4896, 232–238. doi:10.1117/12.468641
Barnard, J. C., and Powell, D. (2002). A Comparison between Modeled and Measured clear-sky Radiative Shortwave Fluxes in Arctic Environments, with Special Emphasis on Diffuse Radiation. J. Geophys. Res. Atmospheres 107, ACL9. doi:10.1029/2001jd001442
Bornman, J. F., Barnes, P. W., Robinson, S. A., Ballaré, C. L., Flint, S. D., and Caldwell, M. M. (2015). Solar Ultraviolet Radiation and Ozone Depletion-Driven Climate Change: Effects on Terrestrial Ecosystems. Photochem. Photobiol. Sci. 14, 88–107. doi:10.1039/c4pp90034k
Cox, J. (1998). Fundamentals of Linear Electronics: Integrated and Discrete Circuitry, Clifton Park, United States. Boston, Massachusetts: Cengage Learning, Inc.
de Carvalho Silva, J., Rodrigues, J. J., Alberti, A. M., Solic, P., and Aquino, A. L. (2017). “Lorawan—a Low Power Wan Protocol for Internet of Things: A Review and Opportunities,” in 2017 2nd International Multidisciplinary Conference on Computer and Energy Science (SpliTech) (IEEE), 1–6.
Evans, D. (2011). The Internet of Things: How the Next Evolution of the Internet Is Changing Everything. CISCO white paper 1, 1–11.
Fried, L. (2019). Adafruit VEML6075. Adafruit Industries. Availabe at: https://github.com/adafruit/Adafruit_VEML6075.
Fu, Y., Zhu, J., Yang, Y., Yuan, R., Liu, G., Xian, T., et al. (2017). Grid-cell Aerosol Direct Shortwave Radiative Forcing Calculated Using the Sbdart Model with Modis and Aeronet Observations: An Application in winter and Summer in Eastern china. Adv. Atmos. Sci. 34, 952–964. doi:10.1007/s00376-017-6226-z
Gao, L., Ruan, J., and Lu, C. (2014). Timing Control and Light Intensity Measurement System of Ultraviolet. Chin. J. Electron Devices 37, 04.
Gröbner, J., Hülsen, G., Vuilleumier, L., Blumthaler, M., Vilaplana, J., Walker, D., et al. (2006). Report of the Pmod/wrc-Cost Calibration and Intercomparison of Erythemal Radiometers. Switzerland: Report PMODWRC, Davos.
Google Maps (2021). Campus of Universidad de Extremadura in Badajoz, Spain. Satellite image. Retrieved from https://www.google.es/maps/@38.8831311,-7.009593,437m/data=!3m1!1e3?hl=es
Häder, D.-P., Williamson, C. E., Wängberg, S. Å, Rautio, M., Rose, K. C., Gao, K., et al. (2015). Effects of Uv Radiation on Aquatic Ecosystems and Interactions with Other Environmental Factors. Photochemical Photobiological Sci. 14, 108–126. doi:10.1039/c4pp90035a
Häder, D. P., Helbling, E. W., Williamson, C. E., and Worrest, R. C. (2011). Effects of Uv Radiation on Aquatic Ecosystems and Interactions with Climate Change. Photochem. Photobiol. Sci. 10, 242–260. doi:10.1039/c0pp90036b
Hajjaji, Y., Boulila, W., Farah, I. R., Romdhani, I., and Hussain, A. (2021). Big Data and Iot-Based Applications in Smart Environments: A Systematic Review. Comp. Sci. Rev. 39, 100318. doi:10.1016/j.cosrev.2020.100318
Halthore, R. N., Crisp, D., Schwartz, S. E., Anderson, G., Berk, A., Bonnel, B., et al. (2005). Intercomparison of Shortwave Radiative Transfer Codes and Measurements. J. Geophys. Res. Atmospheres 110. doi:10.1029/2004jd005293
Haryanto, G., and Pratomo, V. A. (2017). “Radiation Detection System Ultraviolet and Carbonmonoxides in Air Arduino Based”, in Prosiding Seminar Nasional Teknik Elektro (Semarang: FORTEI), 191–193.
Holben, B. N., Eck, T. F., Slutsker, I., Tanré, D., Buis, J. P., Setzer, A., et al. (1998). AERONET-A Federated Instrument Network and Data Archive for Aerosol Characterization. Remote sensing Environ. 66, 1–16. doi:10.1016/s0034-4257(98)00031-5
Hope Microelectronics Co (2006). Low Power Long Range Transceiver Module, V1.0. edn. Shenzhen: Hope Microelectronics Co. rfm95/96/97/98(w).
Htwe, D. T. (2020). Arduino Based UV Care System with GSM Module. Master’s thesis (Taunggyi: University of Computer Studies).
KiCad (1992–2019). About KiCad. Availabe at: http://www.kicad-pcb.org/about/kicad/.
LAPIS Semiconductor Co., Ltd (2013). ML8511 UV Sensor with Voltage Output. edn. Yokohama: LAPIS Semiconductor Co., Ltd. fedl8511-05.
Lucas, R. M., Norval, M., Neale, R. E., Young, A. R., De Gruijl, F. R., Takizawa, Y., et al. (2015). The Consequences for Human Health of Stratospheric Ozone Depletion in Association with Other Environmental Factors. Photochem. Photobiol. Sci. 14, 53–87. doi:10.1039/c4pp90033b
Madronich, S., Shao, M., Wilson, S. R., Solomon, K. R., Longstreth, J. D., and Tang, X. Y. (2015). Changes in Air Quality and Tropospheric Composition Due to Depletion of Stratospheric Ozone and Interactions with Changing Climate: Implications for Human and Environmental Health. Photochem. Photobiol. Sci. 14, 149–169. doi:10.1039/c4pp90037e
Mamun, M. A. A., and Yuce, M. R. (2019). Sensors and Systems for Wearable Environmental Monitoring toward Iot-Enabled Applications: A Review. IEEE Sensors J. 19, 7771–7788. doi:10.1109/jsen.2019.2919352
McKinlay, A. (1987). A Reference Action Spectrum for Ultraviolet Erythema in Human Skin. CIE J. 6, 17–22.
NXP Semiconductors (2013). PCF8591, 8-bit A/D and D/A converter. NXP Semiconductors. rev. 7th edn. Eindhoven.
Obregón, M., Serrano, A., Costa, M. J., and Silva, A. M. (2015). “Validation of Libradtran and Sbdart Models under Different Aerosol Conditions,” in IOP Conference Series: Earth and Environmental Science (IOP Publishing), 012010.28
Panicker, A., Pandithurai, G., Takamura, T., and Pinker, R. (2009). Aerosol Effects in the Uv-B Spectral Region over Pune, an Urban Site in india. Geophys. Res. Lett. 36. doi:10.1029/2009gl037632
Paredes Ccama, P. I. (2017). Diseño de un sistema de señalización utilizando sensores fotovoltaicos para la prevencion de los efectos de la radiacion solar para los estudiantes de la EPIE. Perú: Master’s thesis, Universidad Nacional del Altiplano.
Piedehierro, A. A., Cancillo, M. L., Serrano, A., Antón, M., and Vilaplana, J. M. (2017). Selection of Suitable Wavelengths for Estimating Total Ozone Column with Multifilter Uv Radiometers. Atmos. Environ. 160, 124–131. doi:10.1016/j.atmosenv.2017.04.022
Pramono, N. A., Ghaisyani, O., Purwandani, B. A., and Sofyan, F. I. (2020). Application of Arduino Programming Using ML8511 UV Sensor Hookup Guide to Learning the Effect of Ultraviolet's Level. J. Disruptive. Learning. Innovation. 2, 37–44. doi:10.17977/um072v2i12020p37-44
Quintero Cardenas, N. E. (2018). Medidor Índice Uv Portátil. Bogotá, Colombia: Universidad Distrital Francisco José de Caldas.
Rambal, Automatización y Robótica (2021). Sensor de Radiacion Ultravioleta (UV) - UVM30A. Rambal, Automatización y Robótica. Available at: https://rambal.com/color-luz-forma/192-sensor-ultravioleta-uv-uvm30a.html.
Ricchiazzi, P., Yang, S., Gautier, C., and Sowle, D. (1998). SBDART: A Research and Teaching Software Tool for Plane-Parallel Radiative Transfer in the Earth's Atmosphere. Bull. Amer. Meteorol. Soc. 79, 2101–2114. doi:10.1175/1520-0477(1998)079<2101:sarats>2.0.co;2
Sanchez, G., Serrano, A., and Cancillo, M. L. (2017). Modeling the Erythemal Surface Diffuse Irradiance Fraction for Badajoz, spain. Atmos. Chem. Phys. 17, 12697–12708. doi:10.5194/acp-17-12697-2017
Schmalwieser, A. W., Gröbner, J., Blumthaler, M., Klotz, B., De Backer, H., Bolsée, D., et al. (2017). Uv index Monitoring in Europe. Photochem. Photobiol. Sci. 16, 1349–1370. doi:10.1039/c7pp00178a
Seckmeyer, G., Bais, A., Bernhard, G., Blumthaler, M., Booth, C., Lantz, K., et al. (2005). Instruments to Measure Solar Ultraviolet Irradiance. Part 2: Broadband Instruments Measuring Erythemally Weighted Solar Irradiance. WMO TD 1289, 51.
Sinha, R. S., Wei, Y., and Hwang, S.-H. (2017). A Survey on Lpwa Technology: Lora and Nb-Iot. Ict Express 3, 14–21. doi:10.1016/j.icte.2017.03.004
Talavera, J. M., Tobón, L. E., Gómez, J. A., Culman, M. A., Aranda, J. M., Parra, D. T., et al. (2017). Review of Iot Applications in Agro-Industrial and Environmental fields. Comput. Elect. Agric. 142, 283–297. doi:10.1016/j.compag.2017.09.015
Telkamp, T., and Kooijman, M. (2019). LoraWAN-in-C Library, Adapted to Run under the Arduino Environment. Available at: https://github.com/mcci-catena/arduino-lmic.
Tzanis, C., and Varotsos, C. A. (2008). Tropospheric Aerosol Forcing of Climate: a Case Study for the Greater Area of greece. Int. J. Remote Sensing 29, 2507–2517. doi:10.1080/01431160701767575
Utrillas, M., Marín, M., Esteve, A., Tena, F., Cañada, J., Estellés, V., et al. (2007). Diffuse Uv Erythemal Radiation Experimental Values. J. Geophys. Res. Atmospheres 112. doi:10.1029/2007jd008846
Vilaplana, J., Serrano, A., Antón, M., Cancillo, M., Parias, M., Gröbner, J., et al. (2007). Report of the El Arenosillo/inta-Cost Calibration an Intercomparison Campaign of Uver Broadband Radiometers. Huelva, Spain: El Arenosillo”, 64.
Vishay Intertechnology Inc (2016). UVA and UVB Light Sensor with I2C Interface. 2 edn, 1. Malvern: Vishay Intertechnology Inc.
Webb, A., Gröbner, J., and Blumthaler, M. (2006). A Practical Guide to Operating Broadband Instruments Measuring Erythemally Weighted Irradiance. Luxembourg: Office for Official Publication of the European Communities.
Werner, L., Fischer, J., Johannsen, U., and Hartmann, J. (2000). Accurate Determination of the Spectral Responsivity of Silicon Trap Detectors between 238 Nm and 1015 Nm Using a Laser-Based Cryogenic Radiometer. Metrologia 37, 279–284. doi:10.1088/0026-1394/37/4/3
Wijatna, A. B., Sunarno, Y. F., Luckyarno, Y. F., Waruwu, M. M., and Wijaya, R. (2019). The Study of the Effects of the Ultraviolet Radiation on Tofu as a Skin Tissue Mimicking Material. J. Eng. Sci. Tech. 14, 138–148.
World Health Organization (2002). Global Solar UV Index. A Practical Guide. A joint recommendation of the World Health Organ., World Meteorological Organ., United Nations Environ. Prog. and the Int. Comm. on Non-Ionizing Radiat. Prot.. Geneva.
Zepp, R. G., Erickson III, D. J., Paul, N. D., and Sulzberger, B. (2011). Effects of Solar Uv Radiation and Climate Change on Biogeochemical Cycling: Interactions and Feedbacks. Photochem. Photobiol. Sci. 10, 261–279. doi:10.1039/c0pp90037k
Zhang, W., Ma, H., Zou, Z., He, Z., and Zhao, G. (2014). Automatic Detection of Night Time Radiation Fog Based on Sbdart Radiative Transfer Model and the Analysis of Time Series. Remote Sensing Land Resour. 26, 14.
Keywords: low-cost sensors, ultraviolet, solar radiation, spectral response, angular response, LORA, Internet of the Things (IoT)
Citation: Serrano A, Abril-Gago J and García-Orellana CJ (2022) Development of a Low-Cost Device for Measuring Ultraviolet Solar Radiation. Front. Environ. Sci. 9:737875. doi: 10.3389/fenvs.2021.737875
Received: 07 July 2021; Accepted: 30 November 2021;
Published: 25 January 2022.
Edited by:
Jenny Lindén, Swedish Environmental Research Institute (IVL), SwedenReviewed by:
Tom D Pering, The University of Sheffield, United KingdomSadouanouan Malo, Nazi Boni University, Burkina Faso
Copyright © 2022 Serrano, Abril-Gago and García-Orellana. This is an open-access article distributed under the terms of the Creative Commons Attribution License (CC BY). The use, distribution or reproduction in other forums is permitted, provided the original author(s) and the copyright owner(s) are credited and that the original publication in this journal is cited, in accordance with accepted academic practice. No use, distribution or reproduction is permitted which does not comply with these terms.
*Correspondence: Antonio Serrano, YXNwQHVuZXguZXM=