 Wen Zhang
 Xiao Dong
 Zhenxin Liu2
- 1Key Laboratory for Meteorological Disaster Monitoring and Early Warning and Risk Management of Characteristic Agriculture in Arid Regions, China Meteorological Administration, Yinchuan, China
- 2Collaborative Innovation Center of Atmospheric Environment and Equipment Technology, Jiangsu Key Laboratory of Atmospheric Environment Monitoring and Pollution Control, School of Environmental Science and Engineering, Nanjing University of Information Science & Technology, Nanjing, China
- 3Ningxia Hui Autonomous Region Climate Center, Yinchuan, China
- 4International Center for Climate and Environment Sciences, Institute of Atmospheric Physics, Chinese Academy of Sciences, Beijing, China
- 5School of Atmospheric Sciences, Sun Yat-sen University, and Southern Marine Science and Engineering Guangdong Laboratory (Zhuhai), Zhuhai, China
The possible influence of the Atlantic multidecadal oscillation (AMO) and the Pacific decadal oscillation (PDO) on the meteorological conditions associated with haze over central eastern China at decadal time scale was investigated using reanalysis and observational dataset for 1979–2018. Four indices, including Siberian high (SH) strength and position indices (SHI/SHPI), a normalized near-surface wind-speed index (WSI) and a potential air temperature gradient index (ATGI), are adopted to denote the meteorological conditions associated with haze. Results shown that the AMO and PDO are both highly correlated with the fluctuation of meteorological factors associated with haze on decadal scale. Although AMO and PDO were in opposite phases during the whole period, since 1997, they both changed phases (AMO shifted to a positive phase and PDO changed to negative) and became favorable for an anomalous dipole-type SLP pattern in the middle-high latitudes of East Asia. The AMO has played a leading role in decadal variation of the large-scale circulation system, while the PDO has had a closer relationship with the lower ventilation condition in eastern China. On the decadal time scale, the AMO stimulates a zonal teleconnection wave train (the AMO northern Hemisphere pattern, ANH) that originates from the North Atlantic Ocean and passes through central Europe, the northern Ural Mountains, Lake Balkhash-Baikal, and central eastern China. During the positive phase of AMO, the ANH induces a stronger and westward shifted SH, with the central eastern China controlled by the anomalous high pressure. In addition, affected by the cyclone (anticyclone) anomaly over Hetao region and North China (the Sea of Japan), southerly wind anomalies dominate over central eastern China. Compared with the AMO, the wave train generated by the negative (positive) PDO phase mainly propagates in the Pacific region, and there is a strong anticyclonic (cyclonic) anomaly over the Northeast Pacific, guiding the air flow southward (northward) along the East Asian coast and thus suppressing (encouraging) the dispersion of pollutants and resulting in above (below)-normal haze episodes.
Introduction
In past few decades, the occurrence of air pollution in winter has increased significantly with the explosive growth of China’s economy. The air pollution represented by haze has become one of the most important environmental problems, seriously threatening human health, traffic safety, and the regional and global climate. Therefore, air pollution has received an increasing attention by the scientific community (Zhang et al., 2012; Huang et al., 2014; Mu and Zhang, 2014).
This increasing trend in winter haze outbreaks (Gao, 2008; Ding and Liu, 2014) is largely due to the increasing pollutant emissions and pollution sources associated with enhanced industrialization and urbanization, but meteorological conditions also play an important role in the variability of pollution events (Zhang et al., 2014; Zheng et al., 2015). Previous studies have identified that meteorological conditions such as large-scale circulation and other meteorological factors can contribute to transportation, deposition, and diffusion, and these conditions are partly responsible for the occurrence of extreme pollution events (Niu et al., 2010; Chen and Wang, 2015; Yang et al., 2021). The East Asian winter monsoon (EAWM), as the most prominent feature of the large-scale circulation system in winter, is created by the sea level pressure (SLP) difference between the Siberian High (SH) and the Aleutian Low, which leads to strong northwesterly winds along the East Asian coast (Chang and Lu, 2012). The stronger the EAWM is, the fewer winter haze days occur (Li et al., 2016). Therefore, the intensity of the SH directly affects the strength of the EAWM on an interannual scale (Wu and Wang, 2002). The Siberian High index (SHI) is widely used in literature to represent the SH strength (Jeong et al., 2011; Hasanean et al., 2013); however, Jia et al. (2015) found that the intensity-based conventional SHI had essentially no ability to predict aerosol optical depth variability over North China. Further analysis of a persistent and severe haze outbreak in eastern China in January 2013 demonstrated that the SHI could not fully describe the impact of SH variation in winter; the aforementioned haze episode was associated with an anomalous eastward extension of the SH. On this basis, they proposed a new indicator, the SH position index (SHPI), depicting the mean longitudinal position of the SH and reflecting the large-scale wind fields that control pollutant transportation and transformation in China.
In the lower atmosphere, meteorological factors lead to either the maintenance or dispersion of haze particles. The ambient relative humidity affects the formation of secondary aerosols and their hygroscopic growth, and it is abnormally high during the haze periods (Sun et al., 2013; Huang et al., 2014). The average height of the planetary boundary layer over the North China Plain is about 50% lower during haze episodes than that on non-haze-episode days (Huang et al., 2014). In addition, temperature stratification and wind speed are important ventilation conditions that affect air pollutants. When there is an inversion layer near the ground, the capacity of vertical exchange is weakened, and the static atmospheric stratification weakens the exchange and diffusion of pollutants (Ji et al., 2012). The surface winter northerlies and northwesterlies in the mid-troposphere are much reduced or even reversed during severe haze episodes (Wang et al., 2014), and the increasing trend of haze days over eastern China is highly correlated with the weakening of surface wind speed (Song et al., 2014; Zhang et al., 2014).
In addition to synoptic-scale analysis of haze cases (Wang et al., 2021), previous studies have focused on the reasons for haze occurrence from climatological perspectives. Circulation changes induced by global greenhouse gas emissions result in increasingly stable weather, wherein the frequency and persistence of meteorological factors are consequently conducive to severe haze events in North China (Cai et al., 2017). In the meantime, Arctic sea ice loss under global warming affects the circulation mode and even the ventilation conditions over eastern China, thus leading to more frequent haze episodes (Wang et al., 2015; Wang and Chen, 2016; Zou et al., 2017; Zou et al., 2020). Considering the climate system is characterized by significant decadal variations, the East Asian summer monsoon (EASM) has shown decadal weakening since the late 1970s, associated with the transition to the summer precipitation pattern (Wang, 2001; Zhou et al., 2009). This decadal variation has been shown to impact regulation of the interannual variation of air pollution over China (Lu et al., 2010; Zhu et al., 2012). Moreover, both decadal and interannual variations in winter haze exhibit a significant in-phase relationship with the sea surface temperature (SST) anomalies over the North Atlantic from summer to the following winter (Xiao et al., 2015). The Mongolia High tied to the PDO tends to modulate the haze days in winter over central eastern China (Zhao et al., 2016).
A number of studies about haze pollution in China have focused mainly on the long-term trends and interannual variations (Ding and Liu, 2014; Song et al., 2014; Li et al., 2016), but the decadal-scale fluctuations in meteorological conditions and their connections with ocean signals have not been documented extensively. The decadal variation of climate systems (especially in SST) is highly predictable; much of the Pacific region has a decadal predictability of about 20 years (Meehl et al., 2010), and there is relatively more predictive capacity for the North Atlantic, western Pacific, and Indian Oceans, among which the North Atlantic is associated with the highest predictive capacity (Meehl et al., 2014).
Therefore, we aimed to elucidate the characteristics of the meteorological conditions linked to haze at a decadal time scale and their possible relationships to ocean forecast signals such as the AMO and PDO. In conjunction with multidecadal international predictions of SST, these results will be beneficial to haze pollution prediction and relevant to government policy making in the coming decades.
Dataset and Methods
Data
Several monthly reanalysis datasets used for the study period of 1979–2019. SST data were from the Met Office Hadley Centre (HadISST) with a horizontal resolution of 1.0 × 1.0° (Rayner et al., 2003). The atmospheric variables, including wind, temperature, geopotential height, and sea level pressure (SLP), were from the National Centers of Environmental Prediction–National Center for Atmospheric Research (NCEP–NCAR) reanalysis 2 dataset with a resolution of 2.5 × 2.5° (Kanamitsu et al., 2002). In considering wintertime cover from December to January, the winter study period from 1979 to 2018 was employed. The same period was considered for climatology.
Indices
Referring to (Trenperth and Shea, 2006), the AMO index is defined as the winter SST anomalies averaged over the North Atlantic north of the equator (0°–60°N, 0°–80°W), where the SST northern limit is set at 60°N to avoid problems with sea ice changes but with the global mean SST (60°S–60°N) removed. To concentrate on the influence of the winter AMO at a decadal time scale, the annual winter AMO index was given by smoothing a 5-year running mean relative to 1979 to 2018 (Figure1A). The monthly PDO index is defined as the time series of the leading EOF of mean SST anomalies for the Pacific Ocean to the north of 20°N (Bond et al., 2003). As with the AMO index, the raw index was first annually averaged over winter periods and then smoothed as a 5-year running mean (Figure1B).
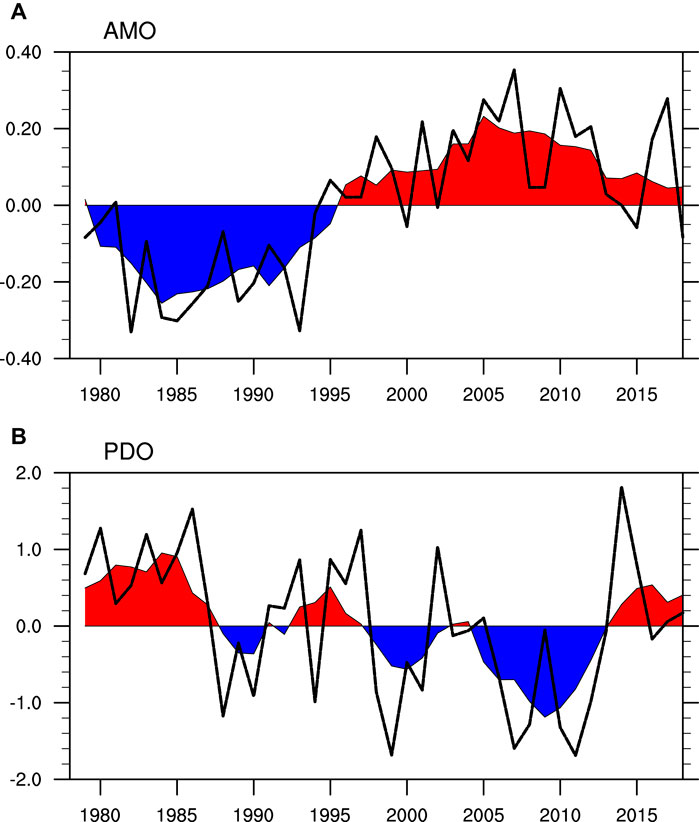
FIGURE 1. The winter (A) AMO index and (B) PDO index (black dash line) from 1979 to 2018. The filling curve is the 5-year running averaged values (red and blue shading).
Previous studies demonstrated that the SH, surface wind speed and inversion layer are correlated with historical haze observations. As expected, we adopted four indices to further investigate the association of meteorological conditions to ocean signals.
The SH has a significant influence on winter climate in Northern Eurasia, East Asia, and even the whole Northern Hemisphere. It can be described comprehensively by the SHI and SHPI (Jia et al., 2015). The conventional SHI is defined as the mean SLP over northern Mongolia between 40°–65°N and 80°–120°E, and is used to characterize the variation of SH intensity. The SHPI is the weighted mean of the longitudes of all the grids within the 1,023 hPa isobar over the broad region of 30°–65°N and 60°–145°E, as shown in the following Eq. 1:
Where
Besides the large-scale circulation condition, the ventilation of air pollutants can be either horizontal or vertical. To quantify the pollutant diffusion condition, a normalized near-surface wind-speed index (WSI) for horizontal and a potential air temperature gradient index (ATGI) for vertical ventilation over the eastern of East Asia (20°–65°N, 100°–130°E) were computed (Zou et al., 2017). The WSI is defined as the winter wind-speed anomalies at 1,000 hPa derived from the wind-speed standard deviation via the following Eq. 2:
where
Gridded atmospheric temperature gradient anomalies were normalized in the same manner based on the winter potential air temperature gradient between the fields at 925 hPa and 1,000 hPa using the following Eq. 3.
The WSI and ATGI limited the spatial domain over the outlined area (20°–65°N, 100°–130°E) shown in Figure 2, because we focused on East Asia and China particularly.
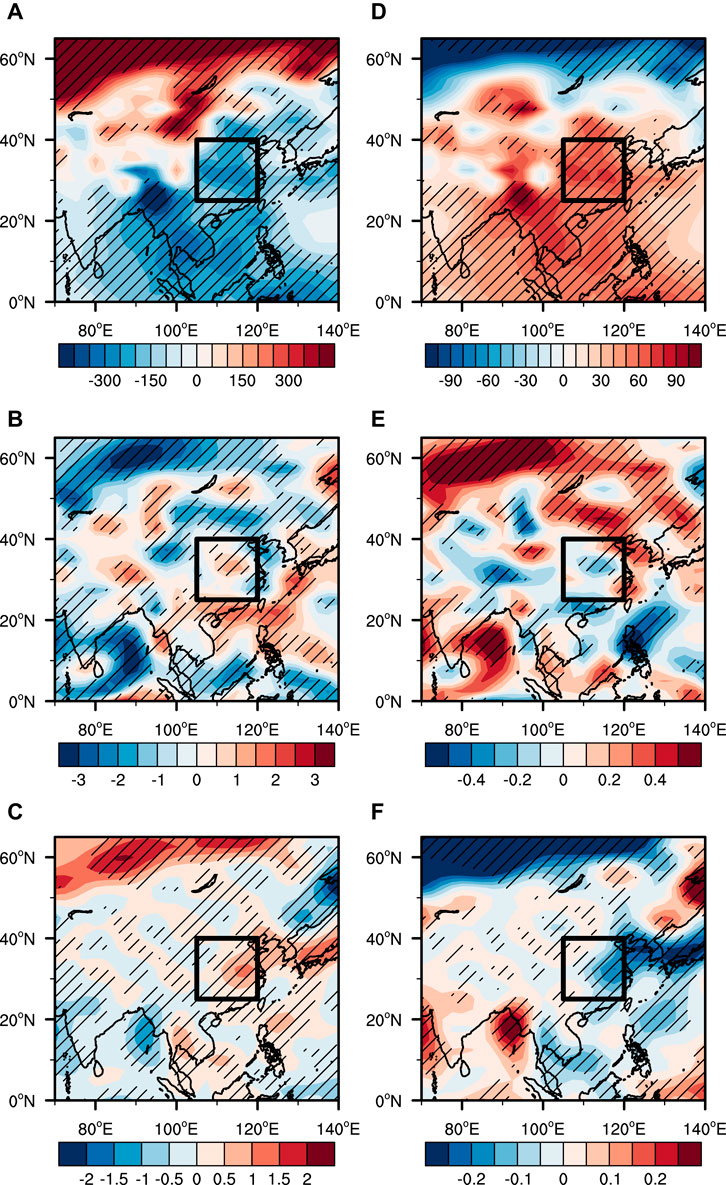
FIGURE 2. Regression of (A,D) SLP (units: Pa·K−1), (B,E) wind speed at 1000 hPa (units: m·s−1·K−1), (C,F) potential temperature between 925 hPa and 1000 hPa on the AMO index [left, (A–C)] and the PDO index [right, (D–F)] in winter from 1979 to 2018. The crosses indicate values exceeding the 95% confidence level. The outlined area is central and East China.
Methods
The relationship between the AMO/PDO and haze-related meteorological conditions are firstly examined in The Relationship Between AMO/PDO and Meteorological Factors. Then possible mechanisms how the AMO/PDO influences the haze-related meteorological conditions are explored using linear regression method. The wave activity flux for stationary Rossby waves embedded in a zonally asymmetric climatological-mean flow was diagnosed, which represents the directions of propagation of the wave energy (Takaya and Nakamura, 1997).
The Relationship Between AMO/PDO and Meteorological Factors
Quantitative analysis had illustrated that the low-frequency modes in the Pacific and Atlantic SST, known as the PDO and AMO, are notable ocean interdecadal signals. The phase changes in these two signals are accompanied not only by interdecadal variations in climatic states over the world, but also by modulated interannual ocean signals such as El Niño and the Southern Oscillation (ENSO) (Dong and Xue, 2016; Zeng et al., 2021). However, to our knowledge, it is still unclear whether these oceanic modes impact meteorological conditions at the decadal time scale, and which one plays a predetermined role.
As shown in Figure 1A, the winter AMO index displayed a remarkable decadal variation from 1979 to 2018. It was in a negative phase before 1997, but turned to a positive phase from 1997 to 2018. The Atlantic SST in winter was generally warm during one recent period (1998–2018). Compared with the AMO index, the PDO shows relatively weak decadal variation (Figure 1B). A phase transition also occurred around 1997. It was in a positive phase during the 1979–1997 period with a transitional negative period from 1987 to 1993, and in mainly a negative phase after 1997 but with positive phase fluctuation. Overall, the PDO index fluctuated out of phase with the AMO over the whole study period, but there have been different phase coordination modes between the AMO and PDO in different periods at the decadal time scale, so it was necessary to further analyze the function and the dominant status of each ocean signal.
To explore the relationship between the ocean decadal signals (the AMO and PDO) and meteorological factors on a decadal scale, Figure 2 shows the regression patterns of winter-mean SLP, wind speed, and potential air temperature gradient with respect to the AMO and PDO. Following a warm phase of the AMO, SLP was characterized by a significant positive value over Midwest Siberia north of Lake Balkhash-Baikal and a negative value over most of East Asia, especially central eastern China, suggesting an in-phase relationship between SLP and the AMO in the northern area of East Asia but an out-of-phase relationship in the southern area (Figure 2A). The wind speed featured distinct negative values over the Lake Baikal north of 50°N, but positive values in central China, flanked by negative values over the eastern areas (Figure 2B). Moreover, the potential air temperature gradient is a good proxy to represent near-surface (around 900 hPa) thermal stability, a positive value indicates a more stable atmosphere with weakened vertical convection, which hinders the vertical dispersion of pollutants. The potential air temperature gradient showed two positive value pattern regions related to AMO; one was consistent with the wind-speed field (north of 50°N), and the other was located from central eastern China to Japan, indicating that the positive phase of AMO favors a relatively stable atmosphere and weak convection (Figure 2C).
Figures 2D–F shows the properties of the above factors along with their effects on the PDO. Corresponding to the positive phase of PDO, SLP featured negative values over the north of Lake Balkhash-Baikal, accompanied by positive values south of 50°N, indicating that the positive phase of the PDO favors a weakened SH in winter. However, the areas in Siberia that passed the significance level were smaller than those related to the AMO (Figure 2A). Central eastern China is still a crucial region with positive SLP anomalies (Figure 2D). The wind speed was strengthened over the area north of 50°N, especially north of Lake Balkhash-Baikal; the wind-speed anomalies were weakened over central China, but strengthened over the eastern coast of China (Figure 2E). In addition, it was observed that the PDO was out of phase with the potential air temperature gradient over the north of Lake Balkhash-Baikal and central eastern China to Japan, indicating that a positive PDO favors unsteady atmospheric stratification and strong convective activity (Figure 2F), and vice versa.
Compared with the correlation patterns between the AMO and meteorological factors (Figures 2A–C), the spatial pattern affected by PDO was generally opposite to that of the AMO (Figures 2D–F), but it seems that SLP over Siberia was more closely aligned with the AMO than PDO. Furthermore, due to the opposite phases of the AMO and PDO on the decadal scale during the 1979–2018 period, they have had the same effect on these factors in recent years: since 1997, the AMO (positive phase) and the PDO (negative phase) have been both favorable for abnormally enhanced high pressure over Siberia and low pressure south of 40°N. The north of Lake Balkhash-Baikal has been a crucial area with weakened wind speeds at 1,000 hPa, which seems to support a strong SH and enhance the prevailing northwesterly winds. However the wind-speed anomalies over the central and the eastern coastal parts of China have been prone to opposing patterns over the same period; the stratification has been relatively stable and the convective activity has been weakened, which is not conducive to the diffusion of pollutants.
To further investigate the impacts of the AMO and PDO on the decadal variability of meteorological conditions in the East Asian region, the aforementioned factors reflecting pollutant diffusion conditions were extracted as crucial indices. Figure 3 shows the interannual and decadal variations of each index, namely, the winter SHI, SHPI, WSI, and ATGI, from 1979 to 2018. The SHI was in a negative phase with weak intensity during the 1986–2003 period, and then shifted to a positive phase with strong intensity after 2003 (Figure 3A). Consistent with the phase transition time of the SHI, SHPI showed a change from a positive to a negative phase around 2003, suggesting that the SH was eastward in the early period but westward in the recent period (Figure 3B). The main characteristic of the WSI was a negative phase, but with a transitional positive phase before 1987, suggesting that the wind-speed anomalies in eastern East Asia have been weakened since the end of 1980s (Figure 3C). The phase transition time in ATGI was around 1997; correspondingly, the lower atmospheric state changed from unstable to stable (Figure 3D). In general, the WSI showed a phase transition earlier than other indices; SHI, SHPI, and ATGI shifted around 2000; and the conversion in ATGI was more in line with the AMO and PDO than the other indices (Figure 1), indicating that with warm anomalies in the Atlantic and La-Niña-like spatial patterns in the Pacific, this meteorological factor is more related to the AMO and PDO on the decadal scale. It should be noted that the number of winter haze days observed over central eastern China has shown an increasing trend since the late 1990s (Xiao et al., 2015; Zhao et al., 2016), which corresponds to our results in this study.
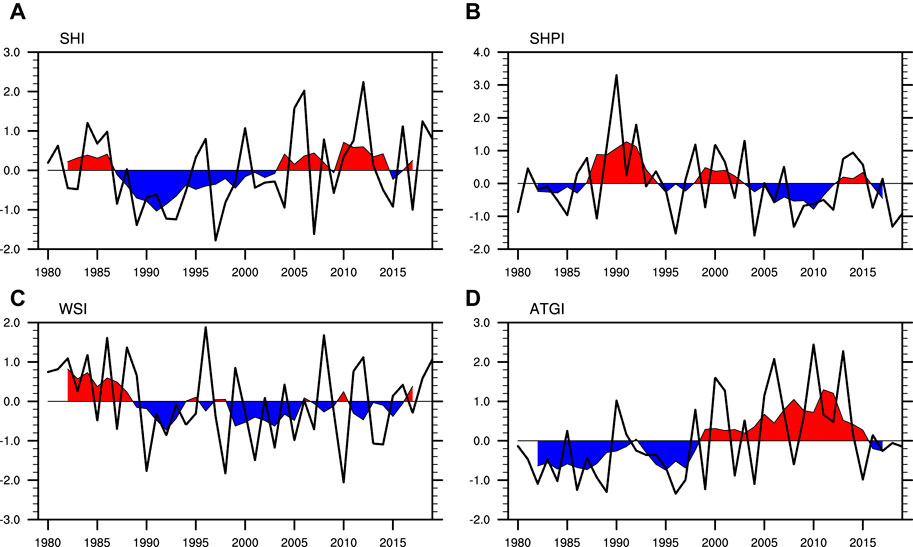
FIGURE 3. The winter normalized (A) SHI, (B) SHPI, (C) WSI, (D) ATGI index (black dash line) from 1979 to 2018. The filling curve is the 5-year running averaged values (red and blue shading).
On the interannual time scale, the correlation coefficients between the winter AMO and SHI, SHPI, WSI, and ATGI were 0.24, −0.32, 0.11, and 0.24, respectively; all of them failed to pass significance level, suggesting that the AMO has no obvious effect on the SH, low-level wind speed, and thermal stability (reflected by potential air temperature gradient) on an interannual scale (Table 1). However, the impact of the AMO was stronger on a decadal scale; the AMO showed an in-phase trend consistent with SHI and an out-of-phase trend with SHPI, with high correlation coefficients of 0.48 and −0.5, respectively, indicating that the positive AMO phase is not only conducive to strengthening of the SH, but also beneficial to its westward position, which is consistent with the conclusion displayed in Figure 2A, and vice versa. In addition, the correlation coefficient between the AMO and ATGI was as high as 0.8, and the positive phase of AMO tends to stabilize atmospheric stratification in the eastern part of East Asia, reflected by an in-phase pattern in Figure 2C.

TABLE 1. Correlation coefficients between AMO and each meteorological index.
Similarly to the relationships between the AMO and the studied meteorological condition indices (Table 1), the PDO also had no effect on these indices at the interannual scale (Table 2). However, the correlation coefficient of the PDO with WSI increased from −0.02 to 0.56, and that of the PDO with ATGI rose to −0.62 at the decadal time scale (both passed the 95% significance level). In other words, the positive phase of PDO is conducive to positive wind-speed anomalies at 1,000 hPa and enhanced instability of the low-level atmosphere in eastern China, and vice versa. This conclusion is also displayed in Figures 2E,F. Moreover, it should be noted that the PDO had almost no connection with SH; there was no significant relationship between them at either the interannual or the decadal time scale.
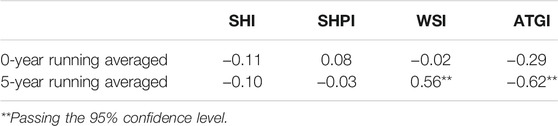
TABLE 2. Correlation coefficients between PDO and each meteorological index.
Possible Mechanisms
The Potential Influence of the AMO and PDO
In order to gain better insight into the potential influence of the AMO on winter meteorological conditions at the decadal time scale, the response of large-scale circulation in the boreal winter to the AMO was analyzed. As shown in Figure 4A, the 500 hPa geopotential height pattern in the Eurasia related to the AMO features in positive and negative intervals from west to east, suggesting that a distinct zonal wave train propagating from the North Atlantic can be stimulated by the AMO, which could be referred to as the AMO Northern Hemisphere (ANH) teleconnection pattern (Si and Ding, 2016; Si et al., 2020). A series of action centers with wavenumbers of approximately five were formed by the ANH teleconnection pattern over the North Atlantic, Central Europe, Northern Ural Mountains, Lake Balkhash-Baikal, and central eastern China, respectively (Figure 4A). Anomalies in the stream-function field according to the ANH teleconnection pattern were also observed. A positive stream-function is consistent with a positive center of action, and vice versa (Figure 4B). Furthermore, to explore the wave energy propagation associated with the ANH, the wave activity flux was also calculated. There were two distinct wave flux divergence regions located over the middle and high latitudes and the tropical regions of North Atlantic, indicating that those areas are wave sources (Figure 4B). Therefore, the wave energy induced by the AMO propagated in two branches in the North Atlantic: one branch originated in the tropics, but without obvious eastward propagation outside the tropics; the other propagated eastward from the northwestern North Atlantic to Asia, matching the pathway of the ANH teleconnection shown in Figure 4A. It should be noted that this ANH teleconnection is not a global-scale wave train; this wave energy mainly propagates eastward through the Eurasian continent to the area of Lake Balkhash-Baikal and then dissipates. Part of the energy could continue to spread to central eastern China. Corresponding to the positive phase of the AMO, a meridional dipole-type pattern was located over East Asia, with an anomalous low-pressure system over Lake Balkhash-Baikal but an anomalous high-pressure system over the mid-latitude area of East Asia. This pattern of geopotential height anomalies indicates that the AMO can modulate meridional dipole-type patterns via the ANH teleconnection on a decadal scale. Therefore, this pattern is not conducive to the southward movement of cold air and inhibits the development of convection, providing favorable conditions for the accumulation of pollutants in central eastern China. This observation is consistent with the conclusion of Zhang et al. (2014).
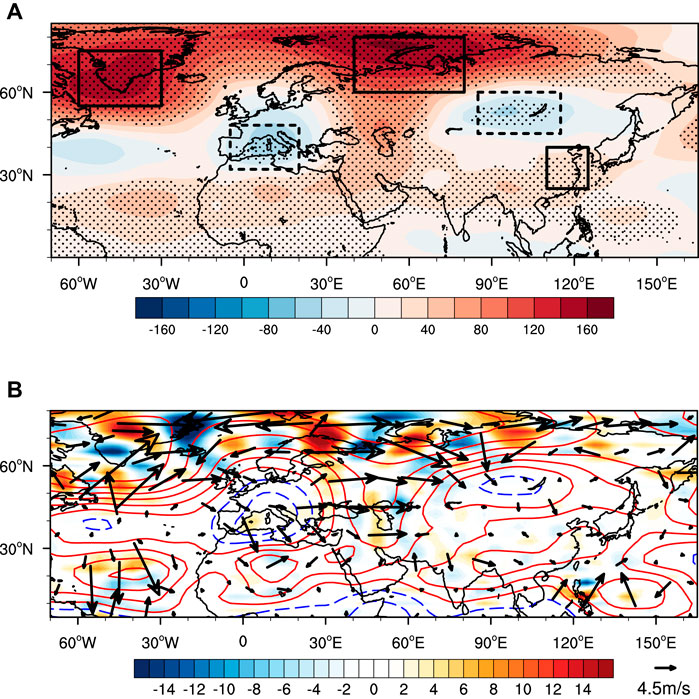
FIGURE 4. (A) Regression of the winter 500 hPa geopotential height (shading, units: gpm·K−1) on the AMO index from 1979 to 2018. The stippled indicate values exceeding the 95% confidence level. (B) As in (A), but for 500 hPa streamfunction (contour, units: 106 m2·s−1·K−1, intervals are 2, from −11 to 11) and the streamfunction’s wave flux (vector; units: m2·s−2) and the divergence of wave flux (shading; units: 10−5 m·s−2).
Figure 5A shows the winter 500 hPa geopotential height anomaly patterns for the PDO at the decadal time scale. The most significant circulation anomalies corresponding to the positive phase of the PDO were located over the Pacific Ocean, characterized by meridional tripole-type patterns, with negative anomalies in the middle latitudes over the Pacific and positive anomalies in the high and low latitudes. For example, the positive phase of the PDO favors the occurrence of anomalous low-pressure areas in the middle latitudes of the central Pacific. However, there was no obvious wave train formed in Eurasia and North America related to the PDO. The geopotential height anomalies from west to east presented an inverse-phase distribution pattern with the positive AMO (Figure 4A); the negative geopotential height anomalies covered the North Atlantic, northern Ural Mountains, and central eastern China, while positive anomalies existed in Central Europe and Lake Balkhash-Baikal. In accordance with the anomalous geopotential height field in the middle latitudes over the Pacific, the wave activity flux linked to the PDO mainly originated from the subtropical Pacific, propagating northeastward from low latitudes to middle and high latitudes but limited to the Pacific region (Figure 5B), in contrast to the AMO with its semiglobal scale wave train (Figures 4A,B). Consequently, the effect related to the PDO was also concentrated in the Pacific region, different with the AMO; the influence caused by the latter has a wider and more prominent effect.
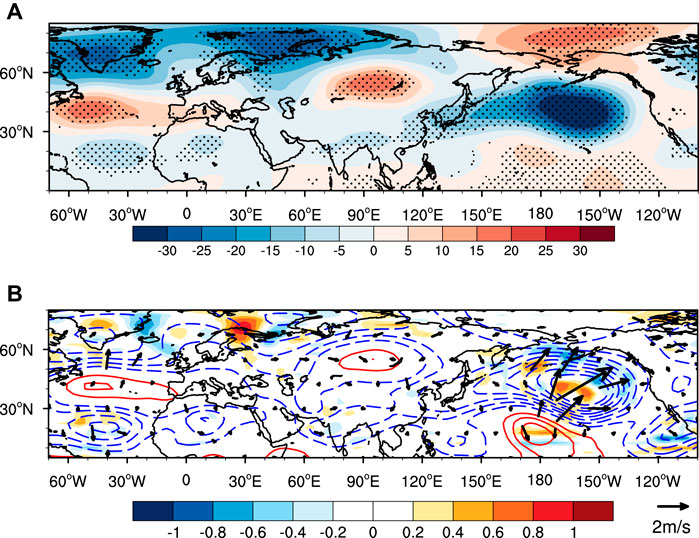
FIGURE 5. (A) Regression of the winter 500 hPa geopotential height (shading, units: gpm·K−1) on the PDO index from 1979 to 2018. The stippled indicate values exceeding the 95% confidence level. (B) As in (A), but for 500 hPa streamfunction (contour, units: 106 m2·s−1·K−1, intervals are 0.5, from −4 to 4) and the streamfunction’s wave flux (vector; units: m2·s−2) and the divergence of wave flux (shading; units: 10−5 m·s−2).
As seen in Figure 6, the positive phase of the AMO favored the occurrence of three cyclonic anomalies and an anticyclonic anomaly in Asia. The cyclonic anomalies were located in the west of Lake Baikal, the north of Japan, and the Hetao region and North China, respectively, while the anticyclonic anomaly was located in the Sea of Japan. The easterly wind anomaly north of 60°N as a result of the two cyclonic anomalies over the mid–high latitudes invaded the cold air down to East Asia. Central eastern China was affected by both the Hetao region and North China cyclonic anomaly and the Sea of Japan anticyclonic anomaly, and the region was controlled by southerly wind. This anticyclonic anomaly is similar to the results of other study (Chen et al., 2018). The insufficient northward intrusion of cold air created adverse conditions for the diffusion of pollutants in central eastern China.
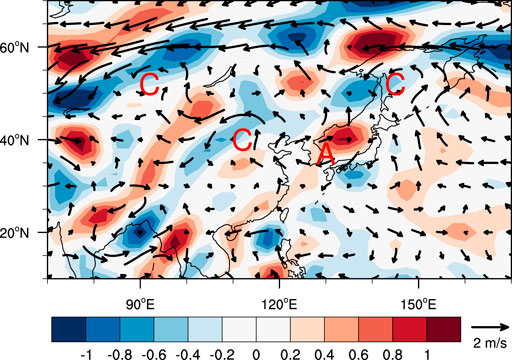
FIGURE 6. Regression of the winter wind at 850 hPa (vector; units: m·s−1·K−1) and divergence (shading, units: 10−5 s−1·K−1) on the AMO. The letters A or C sign centre of anomalous anticyclone or cyclone, respectively.
Compared with the AMO effect on wind at 850 hPa, the effect of the PDO was relatively clear. In the positive phase of the PDO, an anticyclonic anomaly was observed over Lake Balkhash-Baikal. With the influence of this anticyclone, the cold air in the middle and high latitudes moved southward along the peripheral northwest airflow and turned into a north wind anomaly along the coast of East Asia. Guided by the strong cyclonic anomaly over the northeast Pacific, the southward downdraft flowed eastward into the subtropical region over the northeast Pacific. At this time, the whole central eastern China area was controlled by northerlies (Figure 7), supporting the diffusion of pollutants. At present, the PDO is in a negative phase on the decadal scale; thus, there is strong anticyclonic anomaly over the northeast Pacific and the influence of southerlies is the main factor over central eastern China. Additionally, the positive AMO phase hinders the eastward position of the SH, which weakens the southward movement of cold air from high latitudes to central eastern China. The ability to remove pollutants is consequently greatly impaired.

FIGURE 7. Regression of the winter wind at 850 hPa (vector; units: m·s−1·K−1) and divergence (shading, units: 10−5 s−1·K−1) on the PDO. The letters A or C sign centre of anomalous anticyclone or cyclone, respectively.
The Relationship Between the ANH and Meteorological Conditions
On the decadal time scale, the AMO excites a zonal wave train originating in the North Atlantic and propagating eastward to Siberia and even central eastern China; this is called ANH (Figure 4A). This teleconnection wave train produces five main circulation anomaly centers. To better depict the ANH teleconnection, defining an index by standardized anomalous geopotential height differences linked to the AMO between the three positive centers (solid rectangle shown in Figure 4A) and two negative centers (dashed rectangle shown in Figure 4A), the details are as follows Eq. 4:
where
As shown in Figure 8, the ANH index exhibited remarkable decadal variability from 1979 to 2018, with two phases generally. Before 2000, the ANHI experienced a negative phase characterized by weak intensity, but it shifted to positive phase after around 2000. Over the whole period, the ANH pattern fluctuated in phase with the AMO index (Figure 1A). Notably, the ANHI entered a relatively longer transition period during the 1997–2003 period, while the ocean signal was faster in transition (Figure 1); thus, the ANHI lagged slightly behind the AMO for about two years.
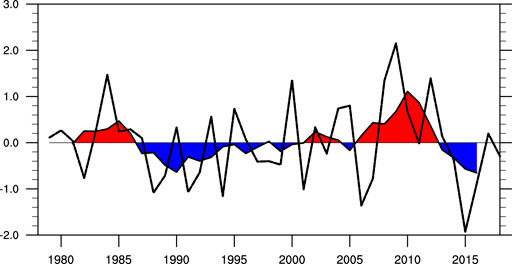
FIGURE 8. The winter ANH index (black dash line) from 1979 to 2018. The filling curve is the 5-year running averaged values (red and blue shading).
To quantify the relationships between the ANHI, SHI, SHPI, WSI, and ATGI, the correlations of these five indices were calculated. On the interannual time scale, the correlation coefficients of the ANHI with the SHI, SHPI, WSI and ATGI were 0.28, −0.18, −0.20, and 0.44, respectively. With the exception of ATGI, the indices did not pass the significance level, indicating that the ANH has no relationship with these factors in central eastern China, but is in phase with thermal stability (Table 3). On the decadal time scale, the effect of the ANH was strengthened, similarly to the AMO and PDO (Table 1 and Table 2). The correlation coefficients of the ANHI with SHI and SHPI increased from 0.28 to 0.68 and from −0.18 to −0.53, respectively, suggesting that the ANH teleconnection wave train formed by the AMO affected the intensity and the position of SH at the same time. When the ANHI was in positive phase, the SH intensity was strong, but the location was to the west. Although it had the advantage of an abnormally strong cold air source, the cold air southward route was shifted westward, and its impact in cleaning pollutants was consequently weaker in central eastern China than in Northwest China consequently. Moreover, due to the westward SH and the anomalous high-pressure system over central eastern China, the low-level atmosphere tended to be more stable and hinder the spread of pollutants. This may further explain the significant positive correlation (0.50) between the ANHI and ATGI. During the negative phase of the ANH, although the intensity of the SH was weaker, its position was eastward, and the cold air going south was rapid and direct. These circulation conditions provide more favorable requirements for the diffusion of pollutants in central eastern China.

TABLE 3. Correlation coefficients between ANHI and each meteorological index.
Conclusions and Discussion
Conclusions
The aim of this study was to explore the relationship between two main decadal ocean signals (PDO and AMO) and the meteorological conditions associated with China’s winter pollution occurrence at the decadal time scale. Using observation and reanalysis datasets, we first analyzed the relationships of the SLP, wind speed, and low-level potential air temperature gradient in eastern East Asia with the AMO and PDO during the winters in the 1979–2018 period. By selecting the intensity and position index of SH as the main objects of a large-scale circulation system and investigating the horizontal and vertical pollution diffusion conditions from the aspects of low-level wind speed and atmospheric stability, the decadal-scale relationships between the above meteorological factors and the AMO and PDO in East Asia were clarified. On this basis, by analyzing the teleconnection wave train and wave energy propagation excited by the AMO and PDO respectively, we further explored the possible impact of ocean signals on these meteorological factors in winter and their differences.
It was found that the winter AMO and PDO are closely related to the SLP, wind speed near surface, and potential air temperature gradient on the decadal scale. Due to the simultaneous phase transitions of the AMO and PDO around 1997 (the AMO turned from a negative phase to positive phase; the PDO was the opposite), the ocean signals were both favorable for a dipole SLP pattern in the middle and high latitudes of East Asia as a whole. In addition, the central eastern China is the crucial area with opposite wind-speed anomalies, and the low-level atmosphere is characterized by static atmospheric stability and weak convective activity.
Further analysis showed that the AMO has played a leading role in decadal variation of the large-scale circulation system in winter compared with the PDO, affecting not only the intensity of SH, but also its position. The positive phase of AMO was conducive to the stronger but westward shifted SH, indicating that, although the cold air source is sufficient, the movement of cold air southward to central eastern China is weakened, and vice versa. The PDO had a significant relationship with the low-level meteorological diffusion factors in central eastern China, being positively correlated with WSI and negatively related to ATGI. That is, the negative phase of PDO tended to appear in conjunction with weak wind-speed anomalies and static atmospheric stability in central eastern China. The former condition means a weakened advection effect and the latter supports inactive vertical convection, both of which contribute to the maintenance of haze weather.
On the decadal time scale, it was found that the influence of the AMO was via excitation of a zonal teleconnection wave train (ANH) extending from the North Atlantic Ocean at 500 hPa and passing through central Europe, the northern Ural Mountains, and Lake Balkhash-Baikal, and finally reaching central eastern China. After arriving in Siberia, the energy of the wave train was obviously dissipating. Corresponding to the positive phase of the AMO, a meridional dipole-type pattern located over East Asian, with an anomalous low of the 500 hPa geopotential height over the Siberia suggesting that the SH tended to be stronger but shifted west in association with the ANH teleconnection pattern, while the central eastern China area was controlled by high-pressure anomalies, indicating that this area is not easily invaded by cold air moving southward from the high latitudes. In addition, this dipole-type pattern dynamically corresponded to a cyclone–anticyclone-like wave train in the lower troposphere extending from Lake Balkhash-Baikal to central eastern China. The characteristics of wind-speed anomalies at 850 hPa in East Asia are relatively complex (which may be one reason for the weak relationship between the AMO and WSI). The positive AMO phase was prone to the occurrence of cyclonic anomalies over Lake Balkhash-Baikal, northern Japan, and Hetao region and North China, preventing the cold air moving southward to some extent. Meanwhile, affected by both the cyclonic anomaly over Hetao region and North China, and the anticyclonic anomaly over the Sea of Japan, the southerlies over central eastern China were also unfavorable for the diffusion of pollutants. However, it is worth noting that the wave train generated by the PDO mainly propagated in the Pacific region, so it had little influence on continental circulation systems such as SH. During the period of positive (negative) phase in the PDO, a strong cyclonic (anticyclonic) anomaly appeared in the low level over the northeast Pacific, guiding the air flow northward (southward) along the East Asian coast, and thus affecting the pollution diffusion conditions in central eastern China.
Altogether, our results suggest that the increasing haze episodes linked to the joint effect of the AMO and PDO, the AMO mainly changes the characteristics of the large-scale circulation systems, especially SH, by activating an ANH teleconnection wave train in winter at the decadal time scale, while the PDO is important for ventilation conditions in the lower troposphere, affecting the wind anomalies along the East Asian coast through an anomalous anticyclone (cyclone) located over the northeast Pacific. In recent years, although the AMO and PDO have been in opposite phases, both of them have suppressed the diffusion of pollutants in eastern East Asia, and especially in central eastern China.
Discussion
In this study, rather than directly analyzing the haze days, we focused on the haze-related meteorological conditions using four indices. Considering the haze days are closely correlated to meteorological conditions, the variability of the haze-related meteorological conditions can to some extent indicate the variability of the haze days. In addition, the decadal ocean signals including the AMO and PDO are focused, although there are other important signals that can influence the haze days in East China, such as ENSO. However ENSO is mainly in interannual timescale. In our future work, ENSO may be combined with the AMO and PDO to be used to explore the multi-scale variability and predictability of the haze episodes from interannual to decadal time scales.
Diagnostic analysis with reanalysis datasets are the main methods adopted in this study. With respect to model simulations, there are several previous studies investigated the haze-related issues using model experiments. For instance, Han et al. (2017) explored the historical simulation in the 20th century along with projection in the 21st century of haze pollution potential based on the dynamic downscaling by the regional climate model RegCM4. Zhang et al. (2020) examined the trend reversal of winter haze pollution in North China before and after 2010 and using numerical experiments to confirm the physical roles of climate drivers. Zou et al. (2020) investigated the role of the Arctic sea ice decline on the winter air stagnation and haze extremes in China using the Whole Atmosphere Community Climate Model (WACCM) along with multiple state-of-the-art climate models. With respect to the topic in this study, it deserves further research to explore the simulation of the observational evidence revealed in this study in multiple climate models. Based on reasonable reproduction of the haze-related meteorological conditions and their relationship with decadal ocean signals (PDO/AMO), it can be used to predict the meteorological conditions for haze in the near future using numerical experiments output from the Decadal Climate Prediction Project (DCPP) in the Coupled Model Intercomparison Project Phase 6 (CMIP6, Eying et al., 2016).
Data Availability Statement
The raw data supporting the conclusions of this article will be made available by the authors, without undue reservation.
Author Contributions
XD conceived the idea. WZ conducted the data analysis, and prepared the figures. WZ, XD, ZL, RL, and HL discussed the results, wrote and revised the manuscript. All authors contributed to the article and approved the submitted version.
Funding
This research is supported by the Beijing Natural Science Foundation (8204064), the Special Program for Forecasters of China Meteorological Administration (CMAYBY2020-004) and the National Natural Science Foundation of China (Grant Nos. 41706028 and 41606027).
Conflict of Interest
The authors declare that the research was conducted in the absence of any commercial or financial relationships that could be construed as a potential conflict of interest.
The reviewer (ZX) declared a shared affiliation, with no collaboration, with one of the authors (RL) to the handling editor at the time of the review.
Publisher’s Note
All claims expressed in this article are solely those of the authors and do not necessarily represent those of their affiliated organizations, or those of the publisher, the editors and the reviewers. Any product that may be evaluated in this article, or claim that may be made by its manufacturer, is not guaranteed or endorsed by the publisher.
Acknowledgments
Thanks the three reviewers and Editor for the constructive suggestions and comments that help to improve the quality of this paper. We acknowledged the open fund by Jiangsu key laboratory of atmospheric environment monitoring and pollution control (KHK001), a project funded by the priority academic program development of Jiangsu higher education institutions (PAPD).
References
Bond, N. A., Overland, J. E., Spillane, M., and Stabeno, P. (2003). Recent Shifts in the State of the North Pacific. Geophys. Res. Lett. 30, a–n. doi:10.1029/2003GL018597
Cai, W., Li, K., Liao, H., Wang, H., and Wu, L. (2017). Weather Conditions Conducive to Beijing Severe Haze More Frequent under Climate Change. Nat. Clim Change 7, 257–262. doi:10.1038/nclimate3249
Chang, C.-P., and Lu, M.-M. (2012). Intraseasonal Predictability of Siberian High and East Asian winter Monsoon and its Interdecadal Variability. J. Clim. 25, 1773–1778. doi:10.1175/JCLI-D-11-00500.1
Chen, H., and Wang, H. (2015). Haze Days in North China and the Associated Atmospheric Circulations Based on Daily Visibility Data from 1960 to 2012. J. Geophys. Res. Atmos. 120, 5895–5909. doi:10.1002/2015jd023225
Chen, S., Guo, J., Song, L., Li, J., Liu, L., and Cohen, J. B. (2018). Inter-annual Variation of the spring Haze Pollution over the North China Plain: Roles of Atmospheric Circulation and Sea Surface Temperature. Int. J. Climatol. 39, 783–798. doi:10.1002/joc.5842
Ding, Y., and Liu, Y. (2014). Analysis of Long-Term Variations of Fog and Haze in China in Recent 50 Years and Their Relations with Atmospheric Humidity. Sci. China Earth Sci. 57, 36–46. doi:10.1007/s11430-013-4792-1
Dong, X., and Xue, F. (2016). Phase Transition of the Pacific Decadal Oscillation and Decadal Variation of the East Asian Summer Monsoon in the 20th century. Adv. Atmos. Sci. 33, 330–338. doi:10.1007/s00376-015-5130-7
Eyring, V., Bony, S., Meehl, G. A., Senior, C. A., Stevens, B., Stouffer, R. J., et al. (2016). Overview of the Coupled Model Intercomparison Project Phase 6 (CMIP6) Experimental Design and Organization. Geosci. Model. Dev. 9, 1937–1958. doi:10.5194/gmd-9-1937-2016
Gao, G. (2008). The Climatic Characteristics and Change of Haze Days over China during 1961- 2005. Acta Geographica Sinica 63, 761–768. doi:10.11821/xb200807010
Han, Z., Zhou, B., Xu, Y., Wu, J., and Shi, Y. (2017). Projected Changes in Haze Pollution Potential in China: an Ensemble of Regional Climate Model Simulations. Atmos. Chem. Phys. 17, 10109–10123. doi:10.5194/acp-2016-101410.5194/acp-17-10109-2017
Hasanean, H. M., Almazroui, M., Jones, P. D., and Alamoudi, A. A. (2013). Siberian High Variability and its Teleconnections with Tropical Circulations and Surface Air Temperature over Saudi Arabia. Clim. Dyn. 41, 2003–2018. doi:10.1007/s00382-012-1657-9
Huang, K., Zhuang, G., Wang, Q., Fu, J. S., Lin, Y., Liu, T., et al. (2014). Extreme Haze Pollution in Beijing during January 2013: Chemical Characteristics, Formation Mechanism and Role of Fog Processing. Atmos. Chem. Phy. Discuss. 14, 7517–7556. doi:10.5194/acpd-14-7517-2014
Jeong, J.-H., Ou, T., Linderholm, H. W., Kim, B.-M., Kim, S.-J., Kug, J.-S., et al. (2011). Recent Recovery of the Siberian High Intensity. J. Geophys. Res. 116, a–n. doi:10.1029/2011JD015904
Ji, D., Wang, Y., Wang, L., Chen, L., Hu, B., Tang, G., et al. (2012). Analysis of Heavy Pollution Episodes in Selected Cities of Northern China. Atmos. Environ. 50, 338–348. doi:10.1016/j.atmosenv.2011.11.053
Jia, B., Wang, Y., Yao, Y., and Xie, Y. (2015). A New Indicator on the Impact of Large-Scale Circulation on Wintertime Particulate Matter Pollution over China. Atmos. Chem. Phys. 15, 11919–11929. doi:10.5194/acpd-15-19275-201510.5194/acp-15-11919-2015
Kanamitsu, M., Ebisuzaki, W., Woollen, J., Yang, S.-K., Hnilo, J. J., Fiorino, M., et al. (2002). NCEP-DOE AMIP-II Reanalysis (R-2). Bull. Amer. Meteorol. Soc. 83, 1631–1644. doi:10.1175/Bams-83-11-1631
Li, Q., Zhang, R., and Wang, Y. (2016). Interannual Variation of the Wintertime Fog-Haze Days across central and Eastern China and its Relation with East Asian winter Monsoon. Int. J. Climatol. 36, 346–354. doi:10.1002/joc.4350
Lu, Z., Streets, D. G., Zhang, Q., Wang, S., Carmichael, G. R., Cheng, Y. F., et al. (2010). Sulfur Dioxide Emissions in China and Sulfur Trends in East Asia since 2000. Atmos. Chem. Phys. 10, 6311–6331. doi:10.5194/acp-10-6311-2010
Meehl, G. A., Goddard, L., Boer, G., Burgman, R., Branstator, G., Cassou, C., et al. (2014). Decadal Climate Prediction: An Update from the Trenches. Bull. Amer. Meteo. Soc. 95, 243–267. doi:10.1175/BAMS-D-12-00241.1
Meehl, G. A., Hu, A., and Tebaldi, C. (2010). Decadal Prediction in the Pacific Region. J. Clim. 23, 2959–2973. doi:10.1175/2010JCLI3296.1
Mu, M., and Zhang, R. (2014). Addressing the Issue of Fog and Haze: A Promising Perspective from Meteorological Science and Technology. Sci. China Earth Sci. 57, 1–2. doi:10.1007/s11430-013-4791-2
Niu, F., Li, Z., Li, C., Lee, K.-H., and Wang, M. (2010). Increase of Wintertime Fog in China: Potential Impacts of Weakening of the Eastern Asian Monsoon Circulation and Increasing Aerosol Loading. J. Geophys. Res. 115, D00K20. doi:10.1029/2009JD013484
Rayner, N. A., Parker, D. E., and Horton, E. B. (2003). Global Analyses of Sea Surface Temperature, Sea Ice, and Night marine Air Temperature since the Late Nineteenth century. J. Geophys. Res. 108, 4407. doi:10.1029/2002JD002670
Si, D., and Ding, Y. (2016). Oceanic Forcings of the Interdecadal Variability in East Asian Summer Rainfall. J. Clim. 29, 7633–7649. doi:10.1175/JCLI-D-15-0792.1
Si, D., Jiang, D., Hu, A., and Lang, X. (2020). Variations in Northeast Asian Summer Precipitation Driven by the Atlantic Multidecadal Oscillation. Int. J. Climatol 41, 1682–1695. doi:10.1002/joc.6912
Song, L.-C., Rong, G., Ying, L., and Guo-Fu, W. (2014). Analysis of China's Haze Days in the Winter Half-Year and the Climatic Background during 1961-2012. Adv. Clim. Change Res. 5, 1–6. doi:10.3724/SP.J.1248.2014.001
Sun, Y., Wang, Z., Fu, P., Jiang, Q., Yang, T., Li, J., et al. (2013). The Impact of Relative Humidity on Aerosol Composition and Evolution Processes during Wintertime in Beijing, China. Atmos. Environ. 77, 927–934. doi:10.1016/j.atmosenv.2013.06.019
Takaya, K., and Nakamura, H. (1997). A Formulation of a Wave-Activity Flux for Stationary Rossby Waves on a Zonally Varying Basic Flow. Geophys. Res. Lett. 24 (23), 2985–2988. doi:10.1029/97GL03094
Trenberth, K. E., and Shea, D. J. (2006). Atlantic Hurricanes and Natural Variability in 2005. Geophys. Res. Lett. 33, L12704. doi:10.1029/2006GL026894
Wang, H. (2001). The Weakening of the Asian Monsoon Circulation after the End of 1970's. Adv. Atmos. Sci. 18, 376–386. doi:10.1007/BF02919316
Wang, H.-J., and Chen, H.-P. (2016). Understanding the Recent Trend of Haze Pollution in Eastern China: Roles of Climate Change. Atmos. Chem. Phys. 16, 4205–4211. doi:10.5194/acp-16-4205-2016
Wang, H. J., Chen, H. P., and Liu, J. P. (2015). Arctic Sea Ice Decline Intensified Haze Pollution in Eastern China. Atmos. Oceanic Sci. Lett. 8, 1–9. doi:10.3878/AOSL20140081
Wang, X., Zhang, R., Tan, Y., and Yu, W. (2021). Dominant Synoptic Patterns Associated with the Decay Process of PM2.5 Pollution Episodes Around Beijing. Atmos. Chem. Phys. 21, 2491–2508. doi:10.5194/acp-21-2491-2021
Wang, Y., Yao, L., Wang, L., Liu, Z., Ji, D., Tang, G., et al. (2014). Mechanism for the Formation of the January 2013 Heavy Haze Pollution Episode over central and Eastern China. Sci. China Earth Sci. 57, 14–25. doi:10.1007/s11430-013-4773-4
Wu, B., and Wang, J. (2002). Winter Arctic Oscillation, Siberian High and East Asian winter Monsoon. Geophys. Res. Lett. 29, 3–1. doi:10.1029/2002GL015373
Xiao, D., Li, Y., Fan, S., Zhang, R., Sun, J., and Wang, Y. (2015). Plausible Influence of Atlantic Ocean SST Anomalies on winter Haze in China. Theor. Appl. Climatol. 122, 249–257. doi:10.1007/s00704-014-1297-6
Yang, L., Shi, Z., Sun, H., Xie, X., Liu, X., and An, Z. (2021). Distinct Effects of winter Monsoon and westerly Circulation on Dust Aerosol Transport over East Asia. Theor. Appl. Climatol. 144, 1031–1042. doi:10.1007/s00704-021-03579-z
Zeng, Y., Huang, C., Tang, Y., and Peng, J. (2021). Precipitation Variations in the Flood Seasons of 1910-2019 in Hunan and its Association with the PDO, AMO, and ENSO. Front. Earth Sci. 9, 656594. doi:10.3389/feart.2021.656594
Zhang, Q., He, K., and Huo, H. (2012). Cleaning China's Air. Nature 484, 161–162. doi:10.1038/484161a
Zhang, Y., Yin, Z., and Wang, H. (2020). Roles of Climate Variability on the Rapid Increase of winter Haze Pollution in North China after 2010. Atmos. Chem. Phy. Discuss.. doi:10.5194/acp-2020-505 Available at: https://www.researchgate.net/publication/342395136_Roles_of_Climate_Variability_on_the_Rapid_Increase_of_Winter_Haze_Pollution_in_North_China_after_2010)
Zhang, R., Li, Q., and Zhang, R. (2014). Meteorological Conditions for the Persistent Severe Fog and Haze Event over Eastern China in January 2013. Sci. China Earth Sci. 57, 26–35. doi:10.1007/s11430-013-4774-3
Zhao, S., Li, J., and Sun, C. (2016). Decadal Variability in the Occurrence of Wintertime Haze in central Eastern China Tied to the Pacific Decadal Oscillation. Sci. Rep. 6, 27424. doi:10.1038/srep27424
Zheng, X. Y., Fu, Y. F., Yang, Y. J., and Liu, G. S. (2015). Impact of Atmospheric Circulations on Aerosol Distributions in Autumn over Eastern China: Observational Evidence. Atmos. Chem. Phys. 15, 12115–12138. doi:10.5194/acp-15-12115-2015
Zhou, T., Gong, D., Li, J., and Li, B. (2009). Detecting and Understanding the Multi-Decadal Variability of the East Asian Summer Monsoon Recent Progress and State of Affairs. Meteorologische Zeitschrift, 18, 455–467. doi:10.1127/0941-2948/2009/0396
Zhu, J., Liao, H., and Li, J. (2012). Increases in Aerosol Concentrations over Eastern China Due to the Decadal-Scale Weakening of the East Asian Summer Monsoon. Geophys. Res. Lett. 39, a–n. doi:10.1029/2012GL051428
Zou, Y., Wang, Y., Xie, Z., Wang, H., and Rasch, P. J. (2020). Atmospheric Teleconnection Processes Linking winter Air Stagnation and Haze Extremes in China with Regional Arctic Sea Ice Decline. Atmos. Chem. Phys. 20, 4999–5017. doi:10.5194/acp-2019-102310.5194/acp-20-4999-2020
Keywords: decadal variation, AMO, PDO, meteorological conditions, haze episodes
Citation: Zhang W, Dong X, Liu Z, Lin R and Luo H (2021) Influence of Decadal Ocean Signals on Meteorological Conditions Associated With the Winter Haze Over Eastern China. Front. Environ. Sci. 9:727180. doi: 10.3389/fenvs.2021.727180
Received: 18 June 2021; Accepted: 04 October 2021;
Published: 15 October 2021.
Edited by:
Bin Zhao, Tsinghua University, ChinaReviewed by:
Zuowei Xie, Institute of Atmospheric Physics (CAS), ChinaTP Sabin, Indian Institute of Tropical Meteorology (IITM), India
Yufei Zou, Independent Researcher, San Francisco, CA, United States
Copyright © 2021 Zhang, Dong, Liu, Lin and Luo. This is an open-access article distributed under the terms of the Creative Commons Attribution License (CC BY). The use, distribution or reproduction in other forums is permitted, provided the original author(s) and the copyright owner(s) are credited and that the original publication in this journal is cited, in accordance with accepted academic practice. No use, distribution or reproduction is permitted which does not comply with these terms.
*Correspondence: Xiao Dong, ZG9uZ3hpYW9AbWFpbC5pYXAuYWMuY24=