 Jing Victor Li1
 Tsun Se Cheong
 Xunpeng Shi
95% of researchers rate our articles as excellent or good
Learn more about the work of our research integrity team to safeguard the quality of each article we publish.
Find out more
ORIGINAL RESEARCH article
Front. Environ. Sci. , 21 October 2021
Sec. Environmental Economics and Management
Volume 9 - 2021 | https://doi.org/10.3389/fenvs.2021.724095
This article is part of the Research Topic Application of Big Data, Deep Learning, Machine Learning, and Other Advanced Analytical Techniques in Environmental Economics and Policy View all 37 articles
The impact of the Belt and Road Initiative (BRI) on the environment is an important but controversial topic. But assessing it faces a significant challenge for separating its policy impact from the overall effect of economic development that will also have environmental impacts. This paper attempts to provide an evolutionary and counterfactual baseline to evaluate the environmental impact of BRI, based on the distribution dynamics approach and the mobility probability plots (MPPs). Our estimation results suggest that while the majority of BRI economies will lower their emission levels compared with the world average, there are significant differences between BRI and non-BRI countrie’s emission patterns and dynamics. The majority of non-BRI economies will have lower emission levels than their BRI counterparts in the absence of BRI policy, indicating that the difference in future emissions between BRI and non-BRI countries should not be completely attributed to the environmental impact of BRI. Instead, BRI should take measures to prevent certain countries from moving upwards energy intensity paths through policy intervention, international cooperation, and an inclusive project assessment process.
The impact of BRI on the environment has been a controversial topic. The international community is concerned that the BRI may worsen the environmental performance of participating countries due to the relocation of China’s “outdated industries” to these countries (Han et al., 2018), the ecological impact of infrastructure building, emissions from productive activities, and lock into fossil-fuel dependency (Ascensão et al., 2018; Magazzino and Mele, 2020). China’s experience in environmental degradation seems to justify concerns (Yang et al., 2021). Such controversy may discourage the engagement of certain BRI countries which may otherwise benefit from the initiative. Nevertheless, the negative outlook of BRI could be turned into opportunities (Ascensão et al., 2018), if its environmental impact is adequately and fairly assessed.
One challenge to evaluate the environmental impact of the BRI is to separate its impact from the overall impact of development. Economic development will naturally lead to economic growth, energy consumption, foreign direct investment (FDI), financial development and urbanization, which will pollute the environment (Baloch et al., 2019; Udemba et al., 2020). BRI should not be blamed for the negative impact, which is a natural consequence of economic development. However, the estimation of the environmental effect of BRI is challenged by two factors. For one thing, the BRI is a new initiative and thus empirical data are not available. For another, even if BRI has empirical data, it is difficult to establish a counterfactual baseline without BRI against which to estimate the impact of BRI.
The prevailing criticism of BRI based on industry relocation highlights the importance of a counterfactual baseline in the debates on BRI’s environmental consequences. The international community often worry that China’s relocation of its “excess capacity,” considered “outdated” in China and usually energy-intensive, would pollute the environment in the receiving countries (Han et al., 2018; Dong, 2017). The relocation of “outdated” industries, however, is neither new nor unique to China’s BRI. One perspective suggests that the East Asian Miracle was created due to the relocation of Japan’s “outdated” to Korea, Taiwan, Hong Kong and Singapore, and later, further to China (Lloyd, 1996). The relocation creates win-win outcomes for both the outsourcing countries and the receiving countries as an “outdated” industry in Japan was still very advanced in China by that time (Han et al., 2018). However, such views lack an evolutionary dynamics perception: what was advanced for China in the 1980s and into the 1990s was not so by the 2000s. And what underpins the East Asian Miracle is more profound at the institutional levels (Haggard, 1999). Without access to the relocated industries and associated technologies, China will have to rely on less advanced technologies to engine its economic development.
The different perceptions of industry relocation depend on the baseline case. If the baseline is the pre-development stage, the relocation will generate more pollution. However, if compared with realistic alternatives during the development stage, the relocation can be desirable. Since the alternatives in the development stage are seldom projected, it is very difficult to validate the argument. Validation of the controversies related to the environmental impact of BRI will help both China and the BRI participating countries to understand the potential adverse impacts to a wider scale and prepare measures to prevent or mitigate the adverse impacts. For instance, debates are arising about whether BRI indicates China’s ambition to reassess the nature of power and influence the contemporary international system (Beeson, 2018), such as discourses stemming from the global debt incurred through BRI (Hurley et al., 2019) and the heterogeneous and contrasting effects of BRI on participating countries in the global value chains (Wu et al., 2020).
The existing literature on the environmental impact of BRI mainly focuses on the hypothetical problems that have not been demonstrated by empirical studies due to the nascent status of BRI. The impact of ecological systems is justified based on factors such as infrastructure construction, fossil fuel development, energy consumption, and material use (Ascensão et al., 2018), as well as water consumption and embedded water trade (Zhang et al., 2018). The quantitative studies of the potential environmental impact of BRI are based on reasonable assumptions and hypotheses (Han et al., 2018; Qiu et al., 2018; Dong et al., 2015). Although efforts have been made to prepare a baseline for evaluating the impact of BRI in the future (Liu et al., 2018), it is essential to establish a dynamic baseline to assess BRI’s environmental impact, given the importance of understanding the environmental impact of BRI.
This paper attempts to provide a counterfactual baseline to evaluate the environmental impact of BRI. We use CO2 emissions as the proxy of environmental performance. We then adopt the distribution dynamics approach to examine the trend of carbon emission globally using their contour maps of transition probability kernels, and their ergodic distributions and mobility probability plots (MPP). By separating the sample countries into BRI and non-BRI countries, we provide detailed information on their carbon emission’s current pattern and future development.
Our contributions to the debates on BRI literature are two folds. First, this paper is the first quantitative study that can address the future impact of BRI on the environment. The observed systematic difference between BRI and non-BRI countries provides useful information for future policy decisions and a baseline for evaluating the future impact of BRI. Second, the findings of this paper will help developing countries involved in BRI call for development power and space while setting more objective and realistic goals of emission reduction so that they can achieve adequate growth opportunities at lower environmental costs.
The remainder of this paper is structured as follows. Literature Review reviews the literature on the environmental impact of BRI. Data and Methodology describes the data source and research methodology. Results and Discussion reports and discusses the results with various alternative GDP measurements. Conclusion concludes the paper with policy implications.
The Belt and Road Initiative aims to “reconfigure China’s external sector in order to continue its strong growth” (Huang, 2016). While there is a close and multi-facet relationship between the SDGs and the five priority areas of the Belt and Road Initiative (Hong, 2016; Yin, 2019), questions about the potential impacts of BRI on accelerating energy consumption and increasing the global carbon emissions are arising (Zhang et al., 2017; Huang, 2019). For instance, the carbon emissions of BRI countries significantly increased together with their GDP growth (Fan et al., 2019; Han et al., 2020). Li et al. (2018) maintain that BRI countries lack an effective driving mechanism to promote green energy and low-carbon development in relation to this grand initiative. Huang and Li (2020) demonstrate that while BRI has spatial spillover effects on the green development of participating countries, it cannot break the spatial club imbalance.
However, some others argue that BRI can contribute to carbon emission abatement through green technology (Chen et al., 2020). Moreover, Liu et al. (2020) conclude that Chinese OFDIs tend to invest in green projects where “the host countries had better political environments, natural resource endowments and higher energy efficiencies.” These OFDIs contributed to increased green total factor productivity of BRI countries (Wu et al., 2020). Coenen et al. (2021) further find that China is actively and rapidly developing an institutional architecture of green BRI. However, it remains unclear if the claim of green BRI will eventually lead to green development or greenwashing (Harlan, 2021). Zhao et al. (2021) find that the productivity growth effect does not contribute significantly to green growth in BRI countries, but the potential output change effect does. Rauf et al. (2018a) demonstrate the existence of EKC approximately in every region.
Some other studies focus on the environmental impact of infrastructure building and argue that BRI could adversely affect the environment through habitat loss, the overexploitation of resources and the degradation of the surrounding landscape (Ascensão et al., 2018; Li and Shvarts, 2017) and the destruction of the traditional way of life, and the fragility and vulnerability of many ecosystems (Dong et al., 2017). A few studies suggest that increasing productive activities due to BRI could cause environmental degradation. For example, the production of cement that is used for road construction is expected to add emission to China’s one-third of the GHG emissions (Ascensão et al., 2018). Intensive human activities due to BRI is also considered to aggravate the water crisis in Central Asia, deteriorate the vulnerable environment, and accelerate energy consumption in this area (Li et al., 2015). Rauf et al. (2018b; 2020) find that trade, investment and economic growth have different impacts on BRI countrie’s environmental performance. In contrast, one study finds that after the BRI was implemented, China’s net export growth concentrated in the pollution-intensive and resource-intensive industries, indicating that China has not shifted environmental polluting industries to the BRI countries (Tian et al., 2019).
The environmental impact of infrastructure building due to BRI is a hot topic. Hughes (2019) predicted biodiversity hotspots in BRI’s proposed road and rail routes on key biodiversity areas and suggested that BRI may pose a significant risk due to construction and development along the route and mining. Teo et al. (2019) shows how the infrastructure’s environmental impacts interact and aggregate across multiple spatiotemporal scales and describes how those environmental impacts are influenced by economic and socio-political drivers. Yao et al. (2019) discuss how BRI can bring investment and technology to assist electricity market integration in the Southeast Asian region. Shi and Yao (2019) investigates the problems of China’s investment into the ASEAN energy sector and suggests that building a sense of ownership within host countries is essential for the success of China’s outward energy infrastructure investment. Selmier (2018) provides interesting ties into infrastructure, energy and BRI which could be used to develop environmental themes and are generally supportive of BRI.
The limited empirical studies cannot test the BRI impact due to its nascent status. Empirical studies which use the year 2013 and the starting point of BRI, i.e., (Tian et al., 2019), are not convincing as the BRI action plan was only unveiled in 2015. While BRI-like development projects may be traced back to the early 1990s (Selmier, 2018), such project cooperation would not impact the government-to-government cooperation in BRI. It is difficult to argue that China’s unilateral policy declaration in 2015 could have a significant impact on other countries in a few years. Therefore, most quantitative studies of the BRI’s environmental impacts are based on reasonable assumptions and other hypothetical scenarios. Han et al. (2018) suggest that BRI can promote energy efficiency convergence by inferring from the positive roles of regional cooperation and trade integration promoted by BRI. While tourism is not energy-intensive, a study of the environmental impact of tourism in China’s BRI provinces shows that tourism could also lead to environmental degradation (Ahmad et al., 2018). Assuming effective liner shipping vessel sharing is critical to building efficient maritime transport networks under BRI (2018), BRI can boost liner shipping companie’s profits and reduce CO2 emissions dramatically. Dong et al. (2015) propose main modes and paths to achieve sustainable economic development of BRI.
Various studies have shown positive views on avoiding the negative environmental impact of BRI. The BRI Ecological and Environmental Cooperation Plans aspire to achieve sustainable development. Dong et al. (2018) argue that the BRI is consistent with other major sustainable development initiatives and strengthening the linkage between BRI and 2030 sustainable development goals (SDGs) could enhance international cooperation and make up other global environmental governance deficits.
More recent studies find that the environmental impact of BRI is heterogeneous across various indicators. Using the panel dataset covering 178 countries for the period of 2002–2018, Y. Wu et al. (2021) find that the impacts of BRI on energy efficiency depend on energy efficiency quantiles, resource endowments, and income levels. Wu et al. (2021) find that more imports from China will reduce the per capita CO2 emissions of the BRI countries, but more exports to China will have the opposite impact.
Some scholars suggest using environment safeguard measures, such as Strategic Environmental and Social Assessments (SESAs); or other instruments, such as green finance and stakeholder consultation, to prevent damage to the natural environment (Ascensão et al., 2018). International and grassroots environmental pressures are also found to be effective in informing broader policy approaches to BRI implementation (Klinger, 2019). Others generally call for advancing scientific research, reinforcing international collaboration and enhancing education to build a sustainable Silk Road economic belt (Li et al., 2015). In particular, data collection for monitoring and evaluation is usually advocated. Although China has experienced environmental degradation during its development stage, she has successfully initiated many measures to tackle the environmental problems, such as improving environmental regulations and adopting new green technologies and higher environmental standards (Ascensão et al., 2018).
In the case of methodologies, recently, there have been increasing trends of revisiting traditional issues with big data methods, such as LASSO, machine learning and Artificial Neural Networks (ANNs). Issues examined include economic growth and emissions (Magazzino et al., 2021b; Mele and Magazzino, 2020), economic convergence (Magazzino et al., 2021c), information technology and pollution (Magazzino et al., 2021a) and drivers of emissions (Hsu, 2015; Shi et al., 2020). The use of newspaper coverage frequency also generates new variables, such as China’s provincial economic policy uncertainty index (Yu et al., 2021b).
There is a lack of a useful baseline to evaluate the environmental impact of BRI. The limited effort to prepare a baseline for future comparison is not useful at this moment. For example, Liu et al. (2018) monitored and analyzed the ecological environment status of the BRI in 2015 using remote Sensing technology as the basis for future policy decisions in eco-environmental evaluation and protection.
To better reveal the difference between BRI and non-BRI countries in the future environmental dynamics, we will adopt the distribution dynamics approach and Ergodic distributions and mobility probability plots. The distribution dynamics analysis was first proposed by (Quah, 1993a; 1993b) and updated continuously (Quah, 1996, 2006). The convergence analysis, mainly used in the economic growth and household consumption literature (Yu et al., 2021a), was recently extended to the energy and environmental literature. Examples include energy intensity convergence (Ezcurra, 2007; Le Pen and Sévi, 2010), carbon emission convergence (Apergis and Payne, 2017; Wu et al., 2016), and energy (electricity) consumption convergence (Fallahi and Voia, 2015; Payne et al., 2017; Cheong et al., 2019; Shi et al., 2021). There are also interactions between economics and energy issues, such as a recent study on the living standards and energy consumption convergence (Shi et al., 2021).
Distribution dynamics is a useful tool to analyze the evolutionary pattern of different sectors through building counterfactual baselines, such as examining the housing price of China (Li et al., 2017; Cheong et al., 2021) and the housing affordability of United States, Canada and Australia (Cheong and Li, 2018). As far as we know, there is not yet a particular study on building counterfactual baselines for carbon emissions in non-BRI countries. This gap makes our research more worthwhile.
We will further use the mobility probability plots (MPPs), a methodology developed by Cheong and Wu (2013) to improve the display tools of the stochastic kernel approach. (Cheong and Wu (2018) improved MPP for analyzing the mobility probability of the entities within the distribution. The MPP has been employed to analyze transitional dynamics in various research areas, such as industrial output (Cheong and Wu, 2018), energy markets (Wu et al., 2018; Cheong et al., 2019), carbon dioxide emissions (Cheong et al., 2016; Wu et al., 2016), and foreign direct investment (Cheong et al., 2019).
The data of this study are compiled from the World Bank’s World Development Indicators (WDI) database which provides global data on carbon dioxide emissions. In this research, three different measurements of carbon dioxide emissions are used so as to provide a comprehensive analysis on the underlying trend and future development of carbon emissions in the world, namely, kg per 2010 US$ of GDP, metric tons per capita, and kg per 2011 purchasing power parity (PPP)$ of GDP. The data cover the period from 1987 to 2013 for a total of 27 years, and all the countries in the WDI database have been included (except a few countries whose data are not available from the World Bank). Given that the dataset covers a very long period and a large number of countries, thereby making the distribution dynamics analysis fairly robust in this study.
Our data cover 178 countries and regions, including 71 BRI countries. The scope of BRI countries was defined as those that have signed BRI cooperation by September 2018. A full list is presented in the Appendix.
For each year, the world average of the three measurements is also obtained from the WDI database. Carbon emissions for each country are then divided by this year’s world average to calculate the relative emissions. Therefore, all the values are transformed into a ratio, of which a value greater than one means that the emission is greater than the world average, while a value smaller than one suggests that the emission of this country is lower than the world average. However, it is worth noting that the average world data on kg per 2011 PPP$ of GDP are only available from 1990, so that this data series is a bit shorter than the other series.
The data of relative emission are then used for the distribution dynamics analysis. Distribution dynamics analysis is an important tool for studying the changes in distributions across time. Distribution dynamics analysis may prove better than traditional time series econometrics as the advantage of the former lies in providing information on the whole shape of the distribution instead of discrete forecasted values. By employing this technique, not only can we fill a gap in the literature but also complement existing findings derived from econometrics only.
Distribution dynamics analysis can be broadly divided into two different categories. One is the traditional Markov transition matrix analysis and the other is the stochastic kernel approach. Given that there is an issue of demarcation of the state which is associated with the selection of grid values for the former approach; and thus the analytical results are dependent on the selection of grid lines. As a result, it has received criticism. On the contrary, the latter is deemed better as it can circumvent the issue of demarcation. Hence the stochastic kernel approach is used in this study.
The bivariate kernel estimator used in this study is defined as:
where K is the normal density function, n is the number of observations, x is a variable representing the relative emission value of one of the three measurements of a country at time t, y is a variable representing the relative emission value of one of the three measurements of that country at time t+1, Xi,t is an observed value of relative emission value at time t, Xi,t+1 is the observed value of relative emission at time t+1, and h1 and h2 are the bandwidths which are calculated based on the procedure proposed by Silverman (2018).
An adaptive kernel with flexible bandwidth is employed (Silverman, 2018) to consider the sparseness of the data. Assuming that the process is first-order and time-invariant, and the distribution at time t +τ depends on t only and not on any previous distributions, then the relationship between the distributions at time t and time t +τ is shown as:
where
The ergodic density function can then be calculated by:
where
The shape of the ergodic distribution is dependent on the distribution dynamics computed from the dataset, therefore, one can gain comprehensive knowledge on the underlying trend and evolution by examining the ergodic distribution. Moreover, the ergodic distribution also provides a forecast into the future and one can know what would happen to the shape of the distribution if the effects are persistent in nature.
The mobility probability plot (MPP) is further used to improve the traditional display tools of the stochastic kernel approach which are mainly based on the three-dimensional plots and the contour maps. The MPP can be constructed by computing
The MPP shows the net upward mobility probability against the relative emission of the three measurements. It is worth noting that a positive value implies that the country will have a net probability of moving upwards in the future; whereas a negative value of net upward mobility probability implies that the country has a net probability of moving downwards within the distribution. Interested readers can refer to Cheong and Wu (2018), Shi et al. (2021) for more technical details.
The MPP shows the probability of future carbon emissions of each country within the distribution, therefore, one can know more about the future trajectory and development path of each country in carbon emissions. Moreover, a list of priority can be set up so that attention can be paid to those countries with a high probability of increasing emissions in the future.
We adopt the distribution dynamics approach to examine the trend of carbon emission globally. An overview of the carbon emission patterns is presented first, using their transitional probability kernels. It is followed by a comparison between BRI and non-BRI economies, by means of their contour maps of transition probability kernels. Ergodic distributions and mobility probability plots are then constructed for BRI and non-BRI economies to provide detailed information on the current pattern and future development of their carbon emissions. Three measures of carbon emissions are used, namely per GDP, per capita, and per purchasing power parity (PPP). Emission per GDP is used as the baseline model to capture the evolution trend of BRI and non-BRI economies; emissions per capita and per purchase power parity (PPP) are used as alternative models to check the robustness of our findings. For the cross-country comparison, emissions per capita is a preferred metric as it indicates equality across countries. The other two metrics, however, provide possible alternatives as a robustness check.
Stochastic kernel analyses are first performed to calculate the transitional dynamics of carbon emission per GDP for each economy. Figure 1A shows the three-dimensional plots of transitional probability kernels for carbon emission per GDP in economies which joined the BRI. Figure1B shows the three-dimensional plots of transitional probability kernels for carbon emission per GDP in economies that have not joined the BRI. In the 3D plot, X-axis presents the carbon emission per GDP at period t. Y-axis presents the carbon emission per GDP at period t+1. The width of the transition probability kernel for BRI and non-BRI economies are dispersed with the density mass concentrated along the 45-degree diagonal line, indicating that future carbon emission can vary significantly. In other words, there is inconsiderable persistence in the changes in the distribution for future carbon emission. There is one peak for BRI economies located near 0.8, indicating that their carbon emissions per GDP tend to cluster. BRI economies used to have high carbon emissions per GDP before joining BRI. In comparison, there are two peaks for non-BRI economies: one is located around 0.3; the other is located around 0.6. The implication is that non-BRI economies used to have lower carbon emission per GDP even before the introduction of BRI.
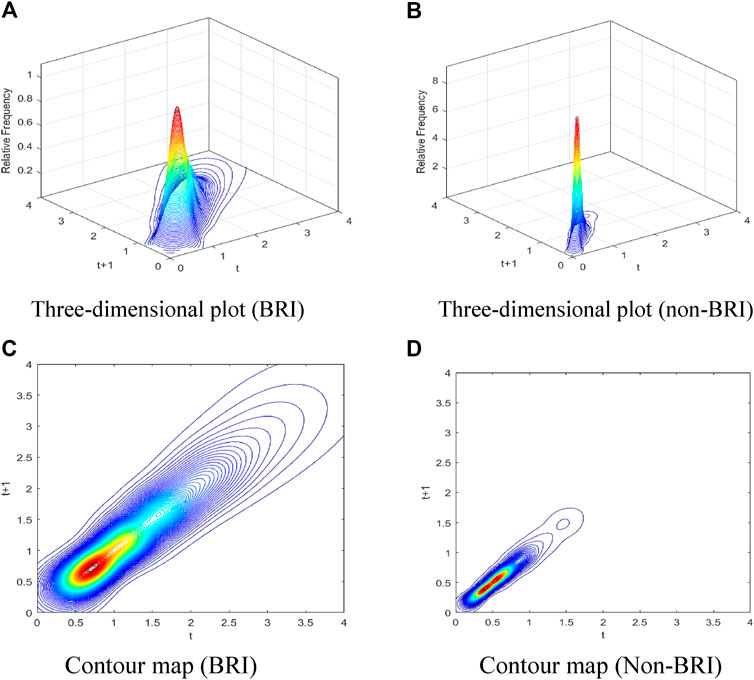
FIGURE 1. Three-dimensional plot and Contour map of transitional probability kernel for carbon emission per GDP with yearly transitions, from 1987 to 2014. (A) Three-dimensional plot (BRI). (B) Three-dimensional plot (non-BRI). (C) Contour map (BRI). (D) Contour map (Non-BRI).
To capture more features of the transitional dynamics, Figures 1C,D displays the associated overhead view of their contour maps in Figures 1A,B. Figure 1C shows the clustering effect of BRI economie’s emission at one heat point, while Figure 1D shows the clustering effect of BRI economie’s emission at two heat points. Whether the heat points of BRI and non-BRI economies also represent their convergence clubs of carbon emission trends, in the long run, will require further investigation into their ergodic distribution.
As such, Figure 2A shows the ergodic distribution of the carbon emission per GDP of BRI economies, which is its long-run steady-state. The convergence club of 0.8 for BRI economies is more clearly observed in the ergodic distribution. While the ergodic distribution in Figure 2A has clarified the existence of one convergence club for BRI economies, the mobility of their future carbon emission cannot be identified. The new framework of MPP can effectively tackle the problem and offer a direct interpretation of the probability mass. In Figure 2B, the MPP on distributions of the probability mass is above zero when the carbon emission per GDP is no more than 0.8. However, this result alone does not suffice to say that BRI economie’s carbon emission per GDP will always decline, as at round 1.0 and 1.5 the probability masses are still above zero, indicating that a few BRI economies may have higher carbon emission probabilities in the future.
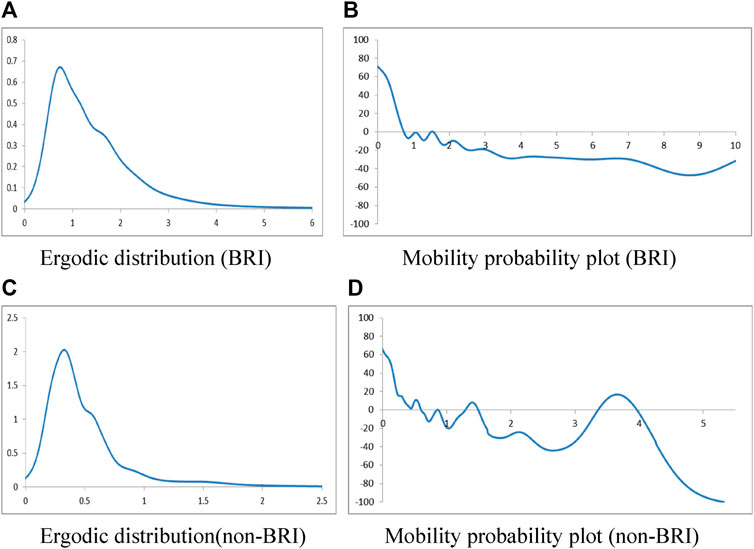
FIGURE 2. Ergodic distribution and Mobility probability plot of carbon emission per GDP. (A) Ergodic distribution (BRI). (B) Mobility probability plot (BRI). (C) Ergodic distribution (non-BRI). (D) Mobility probability plot (non-BRI).
In comparison, Figure 2C displays the ergodic distribution of the carbon emission per GDP of non-BRI economies. Unlike BRI economies, the ergodic distribution shows that the convergence clubs of non-BRI economies are primarily around 0.3 and 0.6. Figure 2D further reveals that the MPP on distributions of the probability mass is complicated in non-BRI economies: MPP of non-BRI economies is above zero for those with carbon emission levels lower than 0.59. Yet for carbon emission levels from 0.60 to 0.84, the MPP lies below zero which shows a net probability of moving downward. It displays a net tendency to move downward again in the coming periods for carbon emission levels ranged from 0.87 to 1.29. The MPP turns positive for carbon emission levels from 1.30 to 1.48. Afterwards, the MPP stays below the horizontal axis, except for carbon emission levels from 3.35 to 3.97. The results suggest that in general non-BRI emissions are lower and tend to decrease in the future despite that a few economies may have higher emission levels (those not clustered in the convergence clubs of 0.3 or 0.6).
To summarize, the baseline model of carbon emission per GDP has shown distinctive patterns among BRI and non-BRI economies before BRI was introduced: The average carbon emission level was higher in BRI economies (convergence club of 0.8) than in non-BRI economies (convergence clubs of 0.3 and 0.6). Such gap may be narrowed over time as the MPP of BRI economies almost always stays below zero when the carbon emission level is larger than 0.8, while the MPP of non-BRI economies has several intersects with the horizontal axis when the carbon emission level is larger than 1.0.
Our finding complimentary the empirical literature that studies the environmental impacts of BRI. Our counterfactual baseline framework can avoid the endogeneity issues as identified by Liu et al. (2020), and Wu et al. (2020) who find that the BRI may preferred curtained countries. This counterfactual baseline may lead to slight different conclusions of the emission impact of BRI, such as Zhang et al. (2017), Li et al. (2018), Huang (2019; and Huang and Li (2020), who find that BRI may have negative environmental impacts. Our aggregated findings provide additional support to the findings of Rauf et al. (2018a), Chen et al. (2020) and Coenen et al. (2021) who find that various factors have heterogeneous impacts. However, whether such finding is significant requires further robustness tests as follows.
We first perform stochastic kernel analyses to compute the transitional dynamics for carbon emission per capita for all economies. Figure 3A shows the three-dimensional plots of carbon emission per capita for BRI economies. Unlike emission per GDP, the peak for emission per capita of BRI economies is located around 0.15. The peak for emission per capita of non-BRI economies is located around 0.10 only (see Figure 3B). While both BRI and non-BRI economies have clustered at lower peaks when measured by the emission per capita, the peak for BRI economies remains higher than the peak for non-BRI economies. Similar to Figure 1, the width of the transition probability kernel for BRI and non-BRI economies are dispersed with the density mass concentrated along the 45-degree diagonal line.
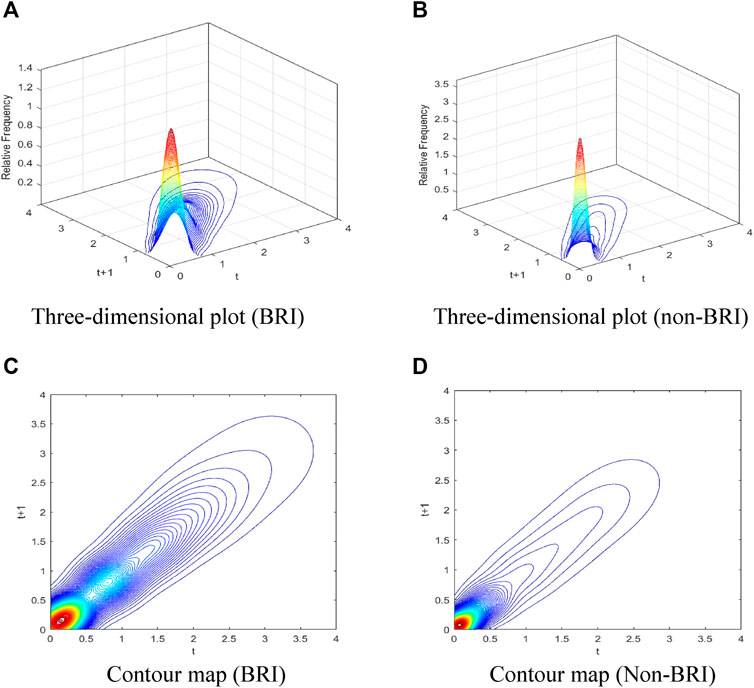
FIGURE 3. Three-dimensional plot and Contour map of transitional probability kernel for carbon emission per capita with yearly transitions, from 1987 to 2014. (A) Three-dimensional plot (BRI). (B) Three-dimensional plot (non-BRI). (C) Contour map (BRI). (D) Contour map (Non-BRI).
Figures 3C,D displays the associated overhead view of their contour maps in Figures 3A,B, with the stochastic transition probability kernel of emission per capita across the range 0.10–0.15. The implication is that carbon emissions per capita of most economies are below the world average (among the clustered group), while some economies (both BRI and non-BRI) have extremely high levels of carbon emission per capita. It is also interesting to note that in the contour map of Figure 3A there is another concentrated point around 0.9 for BRI economies. That is to say, both peaks of BRI economies are higher than the peak of non-BRI economies, consistent with the findings for emission per GDP that BRI economies had higher average carbon emission levels.
Figures 4A,B further explores the evolution trend of carbon emission per capita for BRI economies. Figure 4A shows two convergence clubs, one at 0.14 and another at 0.85. BRI economies have both lower and higher convergence levels of carbon emission per capita in the long run. In particular, when looking into the MPP in Figure 4B, it is obvious that MPP is below zero for economies with emission per capita ranged from 0.14 to 0.55. Yet for emission per capita from 0.56 to 0.85, the MPP lies above zero which shows a net probability of moving upward. Afterwards, it displays a net tendency to move downward in the coming periods again for emission per capita greater than 0.86. The distribution suggests that economies with emission per capita will have a net probability of downward emission trends if current emission levels are between 0.14 and 0.55, or above 0.86. Thus the two convergence clubs of 0.14 and 0.85 are well-identified for BRI economies.
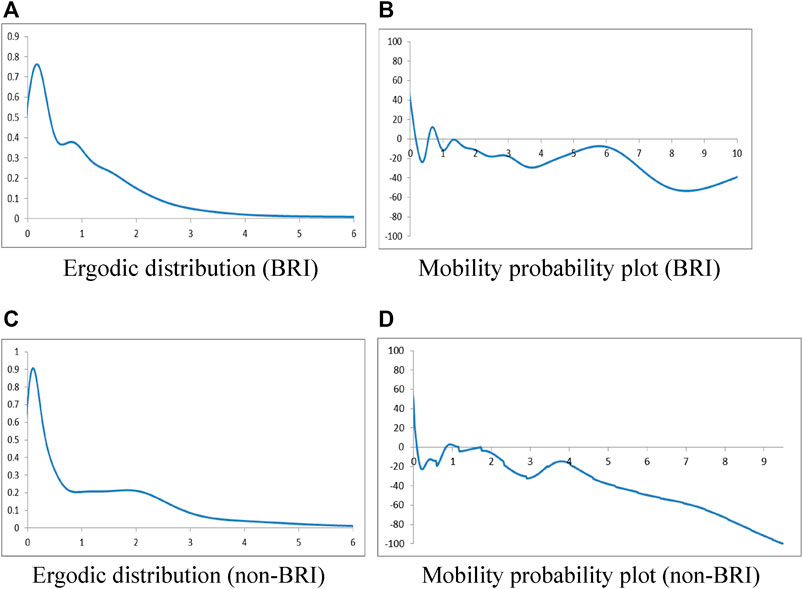
FIGURE 4. Ergodic distribution and Mobility probability plot of carbon emission per capita. (A) Ergodic distribution (BRI). (B) Mobility probability plot (BRI). (C) Ergodic distribution (non-BRI). (D) Mobility probability plot (non-BRI).
In contrast, Figure 4C displays one convergence club (0.11) for non-BRI economie’s emission per capita only, indicating that the average emission levels will remain low in the future. The MPP for non-BRI economies in Figure 4D has a straightforward pattern as well: The probability mass is above zero only when the carbon emission level is no more than 0.09, or between 0.83 and 1.13. In other ranges, the MPP has a net tendency of moving downwards.
In brief, while changing the measurement of emission from per GDP to per capita will have an impact on the number of convergence clubs for BRI and non-BRI economies, it does not affect the result that the average emission level is and will be higher in BRI economies based on the baseline model and alternative model 1.
Our baseline model (per GDP) and alternative model 1 (per capita) have indicated a contrast of carbon emission patterns and trends between BRI economies and non-BRI economies. However, purchasing power parity can be more suitable than GDP or capita to calculate the emission levels of the individual economy because PPP is closely related with the international exchange rate parities (Taylor and Taylor, 2004). Therefore, it is essential to explore whether the measurement of carbon emission per PPP has similar or different evolution pathways with the measurements of emission per GDP or per capita.
Figures 5A,B provides the three-dimensional plot of transitional probability kernels by BRI and non-BRI economies, measured by emission per PPP. It is worth noting that the distribution of carbon emission is bimodal in both Figure 5A and Figure 5B, justifying the importance of conducting distributional analysis to avoid deceiving results (Quah, 1997). Figures 5C,D displays their relevant contour maps. The width of the transition probability kernel for all economies are dispersed with the density mass concentrated along the 45° diagonal line, implying scattered future distribution of carbon emission per PPP. Specifically, the two peaks for BRI economies are located at around 0.6 and 0.9 respectively, while the two peaks for non-BRI economies are located at around 0.3 and 1.1 accordingly. Unlike emission per GDP or emission per capita, the peaks of BRI economies’ emission per PPP are in-between the higher and lower bands of peaks for non-BRI economies.
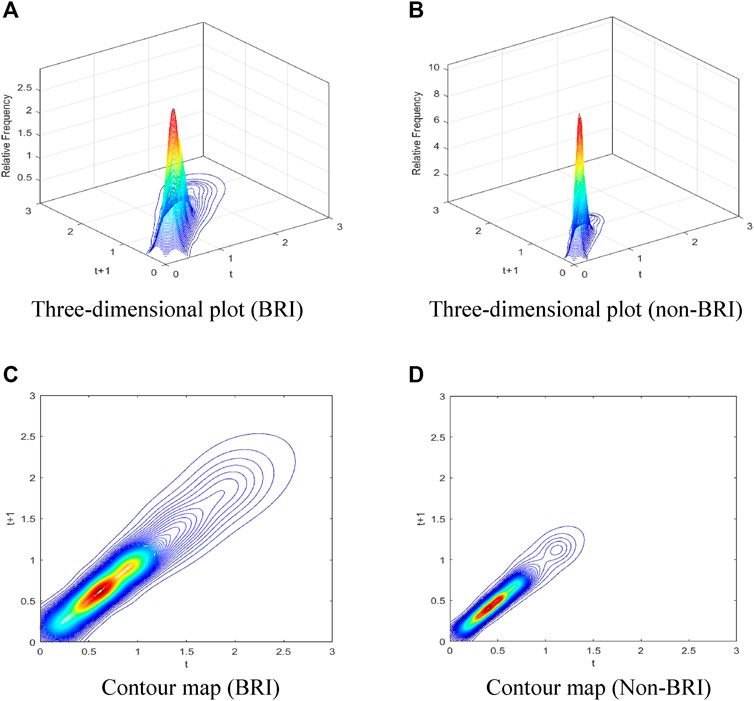
FIGURE 5. Three-dimensional plot and Contour map of transitional probability kernel for carbon emission per PPP with yearly transitions from 1990 to 2014. (A) Three-dimensional plot (BRI). (B) Three-dimensional plot (non-BRI). (A) Three-dimensional plot (BRI) (B) Three-dimensional plot (non-BRI). (C) Contour map (BRI) (D) Contour map (Non-BRI).
Figure 6A shows the long run ergodic distribution of carbon emission per PPP in BRI economies. Convergence clubs can be observed at 0.59 and 0.86. Combined with the MPP in Figure 6B, it is evident that for BRI economies emitting up to 63%; or 80–89% of the world average, they tend to further increase their carbon emission per PPP in the future. For BRI economies emitting 64–79% of the world average, they tend to reduce their future emission per PPP. Similarly, if their current emission per PPP is higher than 90% of the world average, BRI economies tend to reduce their carbon emission per PPP in the future. Hence, in the long run, the emission per PPP of BRI economies will tend to converge to lower than the world average levels.
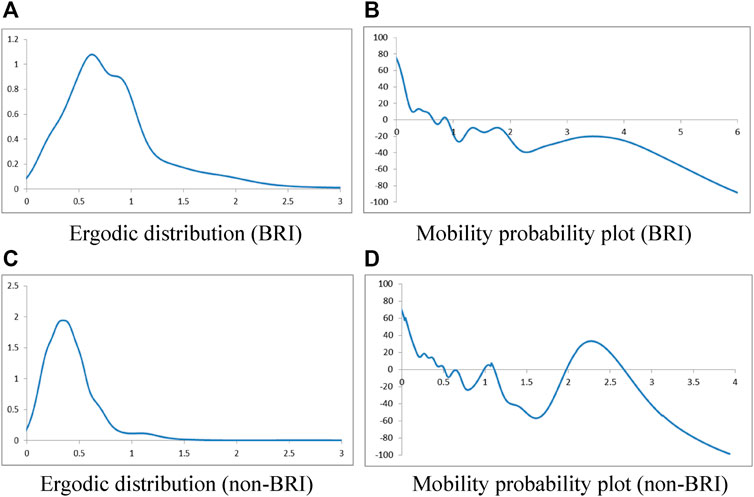
FIGURE 6. Ergodic distribution and Mobility probability plot of carbon emission per PPP. (A) Ergodic distribution (BRI) (B) Mobility probability plot (BRI). (C) Ergodic distribution (non-BRI) (D) Mobility probability plot (non-BRI).
Figures 6C,D provides a different picture for non-BRI economie’s carbon emission per PPP. Convergence clubs can be observed at 0.34 and 1.12 respectively in Figure 6C. The future evolution trend is more complicated: MPP in Figure 6D shows that for non-BRI economies emitting 52–98% of the world average, they tend to reduce their carbon emission per PPP to the level of 34% of the world average. For non-BRI economies emitting 99% to 1.11 times of the world average, they tend to increase their future emission to 1.12 times of the world average. If their current emission level is 1.12–1.97 times the world average, non-BRI economies tend to reduce their levels of emission to 1.12 times the world average. Yet if non-BRI economies emit 1.98 times to 2.68 times the world average, they tend to increase their future carbon emission despite there is no convergence club. To conclude, although a majority of economies will reduce their carbon emissions, several economies will increase their emission and some of them will even reach an alarming level of two times or above (those outside the cluster, which is not fully shown in Figure 5). The overall results of alternative model two concur with the baseline model in that BRI economies are more likely to lower their emission levels in the future than non-BRI economies.
It is not surprising that the number of convergence clubs is different across the three different metrics because the three variables are different. However, the key hypothesis of this paper—the emissions dynamics are different between the BRI and non-BRI countries—is consistent across all three cases. This suggests that our finding is robust.
The impact of the Belt and Road Initiative (BRI) on the environment is controversial. A major challenge to evaluate the environmental impact of the BRI is to separate its impact from the overall impact of development. Validation of the controversy about the environmental impact of BRI will help both China and the BRI participating countries to better understand the potential adverse impacts and prepare measures to prevent or mitigate the potential adverse effects. Despite many studies on the BRI’s environmental impacts, there is an urgent need to create further baseline information to facilitate comparison and benchmark future evolution of emission patterns.
This paper attempts to provide an evolutionary and counterfactual baseline to evaluate the environmental impact of BRI, based on the distribution dynamics approach and the mobility probability plots (MPPs). Our estimation results suggest that the majority of BRI economies will lower their emission levels compared with the world average, despite that a substantial proportion of them are developing or emerging economies. This suggests that most BRI countries will not follow carbon-intensive development paths as other newly industries economies have done.
Furthermore, our estimations find that there is a systematic difference between BRI countries and non-BRI countries. Most non-BRI economies will have lower emission levels measured by per GDP or per capita than BRI countries, despite that a few developed economies will have higher emission levels in the future. Specifically, in terms of emission per GDP the convergence clubs show that the majority of BRI economies tend to have emission levels at 80%, while non-BRI economies tend to have emission levels at 30% or 60%, of the global average emission level, in the long run. In terms of emission per capita, BRI economies tend to have emission levels at 14% or 85%, while non-BRI economies tend to have an emission level at 10% of the global average as their long-term steady states. In terms of emission per capita of PPP price, the convergence clubs of emission levels for BRI economies are 59% or 86% of the global average. In contrast, the convergence clubs of emission levels for non-BRI economies become 34% or 112% of the global average. Both BRI and non-BRI economies have outliers above the global average emission level, though.
Our findings have rich implications for understanding and managing the environmental impact of the Belt and Road Initiative: First, a counterfactual baseline for BRI countries is needed to assess the environmental impact of BRI. This study finds that non-BRI countries will have worsened environmental performances than their BRI counterparts in the absence of BRI. Therefore, the BRI’s environmental impact should not be assessed against the current situation of BRI countries or the performance of non-BRI countries. Second, further policy intentions, such as environmental regulations and public pressure, are needed to promote green growth in BRI countries to low their future emission intensity. Third, international cooperation in regulations, data collection and technologies is necessary to mitigate the negative environmental impact across countries. Effective operation and management of the initiative require collaboration among a broad range of disciplines comprising civil engineering, material science, government operations, economics and finance, social and political science, and environmental science. Last but not least, an inclusive project assessment process that involves all stakeholders and the scientific community is useful to help relevant stakeholders address large-scale and complex challenges in the lifecycle management of these projects.
Publicly available datasets were analyzed in this study. This data can be found here: https://databank.worldbank.org/source/world-development-indicators.
JL: Formal analysis; Investigation; Validation; Writing - original draft; Writing - review and editing. XS: Conceptualization; Formal analysis; Investigation; Validation; Writing - original draft; Writing - review and editing. TC: Conceptualization; Data curation; Formal analysis; Investigation; Methodology; Software; Visualization; Writing - review and editing.
This study is supported by the National Science Foundation of China (No. 72174056, 71828401) and the CUHK Direct Grant for Research (Ref. 4052249).
The authors declare that the research was conducted in the absence of any commercial or financial relationships that could be construed as a potential conflict of interest.
All claims expressed in this article are solely those of the authors and do not necessarily represent those of their affiliated organizations, or those of the publisher, the editors and the reviewers. Any product that may be evaluated in this article, or claim that may be made by its manufacturer, is not guaranteed or endorsed by the publisher.
Ahmad, F., Draz, M., Su, L., Ozturk, I., and Rauf, A. (2018). Tourism and Environmental Pollution: Evidence from the One Belt One Road Provinces of Western China. Sustainability 10, 3520. doi:10.3390/su10103520
Apergis, N., and Payne, J. E. (2017). Per Capita carbon Dioxide Emissions across U.S. States by Sector and Fossil Fuel Source: Evidence from Club Convergence Tests. Energ. Econ. 63, 365–372. doi:10.1016/j.eneco.2016.11.027
Ascensão, F., Fahrig, L., Clevenger, A. P., Corlett, R. T., Jaeger, J. A. G., Laurance, W. F., et al. (2018). Environmental Challenges for the Belt and Road Initiative. Nat. Sustain. 1, 206–209. doi:10.1038/s41893-018-0059-3
Baloch, M. A., Zhang, J., Iqbal, K., and Iqbal, Z. (2019). The Effect of Financial Development on Ecological Footprint in BRI Countries: Evidence from Panel Data Estimation. Environ. Sci. Pollut. Res. 26, 6199–6208. doi:10.1007/s11356-018-3992-9
Chen, Y., Liu, S., Wu, H., Zhang, X., and Zhou, Q. (2020). How can Belt and Road Countries Contribute to Glocal Low-Carbon Development?. J. Clean. Prod. 256, 120717.
Cheong, T. S., Li, V. J., and Shi, X. (2019). Regional Disparity and Convergence of Electricity Consumption in China: A Distribution Dynamics Approach. China Econ. Rev. 58, 101154. doi:10.1016/j.chieco.2018.02.003
Cheong, T. S., and Wu, Y. (2018). Convergence and Transitional Dynamics of China's Industrial Output: A County-Level Study Using a New Framework of Distribution Dynamics Analysis. China Econ. Rev. 48, 125–138. doi:10.1016/j.chieco.2015.11.012
Cheong, T. S., and Wu, Y. (2013). Regional Disparity, Transitional Dynamics and Convergence in China. J. Asian Econ. 29, 1–14. doi:10.1016/j.asieco.2013.08.007
Cheong, T. S., Wu, Y., and Wu, J. (2016). Evolution of Carbon Dioxide Emissions in Chinese Cities: Trends and Transitional Dynamics. J. Asia Pac. Economy 21, 357–377. doi:10.1080/13547860.2016.1176642
Dong, L., Yang, X., and Li, H. (2018). The Belt and Road Initiative and the 2030 Agenda for Sustainable Development: Seeking Linkages for Global Environmental Governance. Chin. J. Popul. Resour. Environ. 16, 203–210. doi:10.1080/10042857.2018.1487745
Ezcurra, R. (2007). Distribution Dynamics of Energy Intensities: A Cross-Country Analysis. Energy Policy 35, 5254–5259. doi:10.1016/j.enpol.2007.05.006
Fallahi, F., and Voia, M.-C. (2015). Convergence and Persistence in Per Capita Energy Use Among OECD Countries: Revisited Using Confidence Intervals. Energ. Econ. 52, 246–253. doi:10.1016/j.eneco.2015.10.004
Fan, J. L., Da, Y. B., Wan, S. L., Zhang, M., Cao, Z., and Wang, Y. (2019). Determinants of Carbon Emissions in ‘Belt and Road initiative’ countries: A production technology perspective. Applied Energy 239, 268–279.
Han, L., Han, B., Shi, X., Su, B., Lv, X., and Lei, X. (2018). Energy Efficiency Convergence across Countries in the Context of China's Belt and Road Initiative. Appl. Energ. 213, 112–122. doi:10.1016/j.apenergy.2018.01.030
Han, M., Lao, J., Yao, Q., Zhang, B., and Meng, J. (2020). Carbon inequality and economic development across the Belt and Road regions. J. Environ. Manage. 262, 110250.
Harlan, T. (2021). Green Development or Greenwashing? A Political Ecology Perspective on China’s Green Belt and Road. Eurasian Geography and Economics 62 (2), 202–226.
Hong, P. (2016). Jointly Building the ‘Belt and Road’ Towards the Sustainable Development Goals. Inclusive and Sustainable City Exhibition and Dialogue (United Nations Industrial Development Organization.
Hsu, D. (2015). Identifying Key Variables and Interactions in Statistical Models of Building Energy Consumption Using Regularization. Energy 83, 144–155. doi:10.1016/j.energy.2015.02.008
Huang, Y. (2016). Understanding China's Belt & Road initiative: motivation, framework and assessment. China Econ. Rev. 40, 314–321.
Huang, Y. (2019). Environmental risks and opportunities for countries along the Belt and Road: Location choice of China’s investment. J. Clean. Prod. 211, 14–26.
Huang, M. X., and Li, S. Y. (2020). The analysis of the impact of the Belt and Road initiative on the green development of participating countries. Sci. Total Environ. 722, 137869.
Hughes, A. C. (2019). Understanding and Minimizing Environmental Impacts of the Belt and Road Initiative. Conservation Biol. 33, 883–894. doi:10.1111/cobi.13317
Klinger, J. M. (2019). Environment, Development, and Security Politics in the Production of Belt and Road Spaces. Territory, Polit. Governance 8, 657–675. doi:10.1080/21622671.2019.1582358
Le Pen, Y., and Sévi, B. (2010). On the Non-convergence of Energy Intensities: Evidence from a Pair-wise Econometric Approach. Ecol. Econ. 69, 641–650. doi:10.1016/j.ecolecon.2009.10.001
Li, H., Li, F., and Yu, X. (2018). China’s Contributions to Global Green Energy and Low-Carbon Development: Empirical Evidence Under the Belt and Road Framework. Energies 11 (6), 1527.
Li, N., and Shvarts, E. (2017). The Belt and Road Initiative: WWF Recommendations and Spatial Analysis. China: WWF.
Li, P., Qian, H., Howard, K. W. F., and Wu, J. (2015). Building a New and Sustainable "Silk Road Economic belt". Environ. Earth Sci. 74, 7267–7270. doi:10.1007/s12665-015-4739-2
Liu, Q., Wu, J., Li, L., Yu, L., Li, J., Xin, X., et al. (2018). Ecological Environment Monitoring for Sustainable Development Goals in the Belt and Road Region. Yaogan Xuebao/Journal Remote Sens 22, 686–708. doi:10.11834/jrs.20187264
Lloyd, P. J. (1996). The Role of Foreign Investment in the success of Asian Industrialization. J. Asian Econ. 7, 407–433. doi:10.1016/S1049-0078(96)90019-6
Magazzino, C., Mele, M., Morelli, G., and Schneider, N. (2021a). The Nexus between Information Technology and Environmental Pollution: Application of a New Machine Learning Algorithm to OECD Countries. Utilities Policy 72, 101256. doi:10.1016/j.jup.2021.101256
Magazzino, C., and Mele, M. (2020). On the Relationship between Transportation Infrastructure and Economic Development in China. Res. Transportation Econ., 100947. doi:10.1016/j.retrec.2020.100947
Magazzino, C., Mele, M., and Schneider, N. (2021b). A Machine Learning Approach on the Relationship Among Solar and Wind Energy Production, Coal Consumption, GDP, and CO2 Emissions. Renew. Energ. 167, 99–115. doi:10.1016/j.renene.2020.11.050
Magazzino, C., Mele, M., and Schneider, N. (2021c). Testing the Convergence and the Divergence in Five Asian Countries: from a GMM Model to a New Machine Learning Algorithm. J. Econ. Stud.. doi:10.1108/JES-01-2021-0027
Mele, M., and Magazzino, C. (2020). A Machine Learning Analysis of the Relationship Among Iron and Steel Industries, Air Pollution, and Economic Growth in China. J. Clean. Prod. 277, 123293. doi:10.1016/j.jclepro.2020.123293
Payne, J. E., Vizek, M., and Lee, J. (2017). Stochastic Convergence in Per Capita Fossil Fuel Consumption in U.S. States. Energ. Econ. 62, 382–395. doi:10.1016/j.eneco.2016.03.023
Qiu, X., Wong, E. Y. C., and Lam, J. S. L. (2018). Evaluating Economic and Environmental Value of Liner Vessel Sharing along the Maritime Silk Road. Maritime Pol. Manage. 45, 336–350. doi:10.1080/03088839.2018.1437285
Quah, D. (1993b). Empirical Cross-Section Dynamics in Economic Growth. Eur. Econ. Rev. 37, 426–434. doi:10.1016/0014-2921(93)90031-5
Quah, D. (1993a). Galton's Fallacy and Tests of the Convergence Hypothesis. Scand. J. Econ. 95, 427. doi:10.2307/3440905
Quah, D. (2006). Galton's Fallacy and Tests of the Convergence Hypothesis. Scand. J. Econ. 95, 427. doi:10.2307/3440905
Quah, D. T. (1996). Twin Peaks: Growth and Convergence in Models of Distribution Dynamics. Econ. J. 106, 1045. doi:10.2307/2235377
Rauf, A., Liu, X., and Amin, W. (2018a). Testing EKC Hypothesis with Energy and Sustainable Development Challenges: A Fresh Evidence From Belt and Road Initiative Economies. Environ Sci Pollut. Res. 25, 32066–32080.
Shi, X., Cheong, T. S., Yu, J., and Liu, X. (2021). Quality of Life and Relative Household Energy Consumption in China. China & World Economy 29, 127–147. doi:10.1111/cwe.12390
Shi, X., Wang, K., Cheong, T. S., and Zhang, H. (2020). Prioritizing Driving Factors of Household Carbon Emissions: An Application of the LASSO Model with Survey Data. Energ. Econ. 92, 104942. doi:10.1016/j.eneco.2020.104942
Shi, X., and Yao, L. (2019). Prospect of China's Energy Investment in Southeast Asia under the Belt and Road Initiative: A Sense of Ownership Perspective. Energ. Strategy Rev. 25, 56–64. doi:10.1016/j.esr.2019.100365
Silverman, B. W. (2018). Density Estimation for Statistics and Data Analysis. Boca Raton, Florida: CRC Press. doi:10.1201/9781315140919
Suocheng, D., Kolosov, V., Yu, L., Zehong, L., Fujia, L., Minyan, Z., et al. (2017). Green Development Modes of the belt and Road. Geogr. Environ. Sustain. 10, 53–69. doi:10.24057/2071-9388-2017-10-1-53-69
Suocheng, D., Zehong, L., Yu, L., Guangyi, S., Huilu, Y., Juanle, W., et al. (2015). Resources, Environment and Economic Patterns and Sustainable Development Modes of the Silk Road Economic Belt. J. Resour. Ecol. 6, 65–72. doi:10.5814/j.issn.1674-764x.2015.02.001
Taylor, A. M., and Taylor, M. P. (2004). The Purchasing Power Parity Debate. J. Econ. Perspect. 18, 135–158. doi:10.1257/0895330042632744
Teo, H. C., Lechner, A. M., Walton, G. W., Chan, F. K. S., Cheshmehzangi, A., Tan-Mullins, M., et al. (2019). Environmental Impacts of Infrastructure Development under the belt and Road Initiative. Environments 6, 72. doi:10.3390/environments6060072
Tian, X., Hu, Y., Yin, H., Geng, Y., and Bleischwitz, R. (2019). Trade Impacts of China's Belt and Road Initiative: From Resource and Environmental Perspectives. Resour. Conservation Recycling 150, 104430. doi:10.1016/j.resconrec.2019.104430
Udemba, E. N., Magazzino, C., and Bekun, F. V. (2020). Modeling the Nexus between Pollutant Emission, Energy Consumption, Foreign Direct Investment, and Economic Growth: New Insights from China. Environ. Sci. Pollut. Res. 27, 17831–17842. doi:10.1007/s11356-020-08180-x
Wu, J., Wu, Y., Guo, X., and Cheong, T. S. (2016). Convergence of Carbon Dioxide Emissions in Chinese Cities: A Continuous Dynamic Distribution Approach. Energy Policy 91, 207–219. doi:10.1016/j.enpol.2015.12.028
Wu, J., Wu, Y., Se Cheong, T., and Yu, Y. (2018). Distribution Dynamics of Energy Intensity in Chinese Cities. Appl. Energ. 211, 875–889. doi:10.1016/j.apenergy.2017.10.097
Wu, Y., Hu, C., and Shi, X. (2021). Heterogeneous Effects of the Belt and Road Initiative on Energy Efficiency in Participating Countries. Energies 14, 5594. doi:10.3390/en14185594
Wu, Y., Shi, X., and Hu, C. (2021). Per Capita CO2 Emissions Divergence Influenced by Bilateral Trade with china under the belt and Road Initiative. Sustainable Prod. Consumption 27, 1589–1601. doi:10.1016/j.spc.2021.04.005
Yao, L., Andrews-Speed, P., and Shi, X. (2019). Asean Electricity Market Integration: How Can Belt and Road Initiative Bring New Life to it. Singapore Econ. Rev. 66, 85–103. doi:10.1142/s0217590819500413
Yin, W. (2019). Integrating Sustainable Development Goals into the Belt and Road Initiative: Would It Be a New Model for Green and Sustainable Investment?. Sustainability 11 (24), 6991
Yu, J., Shi, X., and Cheong, T. S. (2021a). Distribution Dynamics of China's Household Consumption Upgrading. Struct. Change Econ. Dyn. 58, 193–203. doi:10.1016/j.strueco.2021.05.012
Yu, J., Shi, X., Guo, D., and Yang, L. (2021b). Economic Policy Uncertainty (EPU) and Firm Carbon Emissions: Evidence Using a China Provincial EPU index. Energ. Econ. 94, 105071. doi:10.1016/j.eneco.2020.105071
Zhang, Y., Zhang, J.-H., Tian, Q., Liu, Z.-H., and Zhang, H.-L. (2018). Virtual Water Trade of Agricultural Products: A New Perspective to Explore the Belt and Road. Sci. Total Environ. 622-623, 988–996. doi:10.1016/j.scitotenv.2017.11.351
Zhang, N., Liu, Z., Zheng, X., and Xue, J. (2017). Carbon footprint of China’s belt and road. Science 357 (6356), 1107.
Zhao, Z., Shi, X., Zhao, L., and Zhang, J. (2021). Extending Production-Theoretical Decomposition Analysis to Environmentally Sensitive Growth: Case Study of Belt and Road Initiative Countries. Technol. Forecast. Soc. Change 161, 120289. doi:10.1016/j.techfore.2020.120289
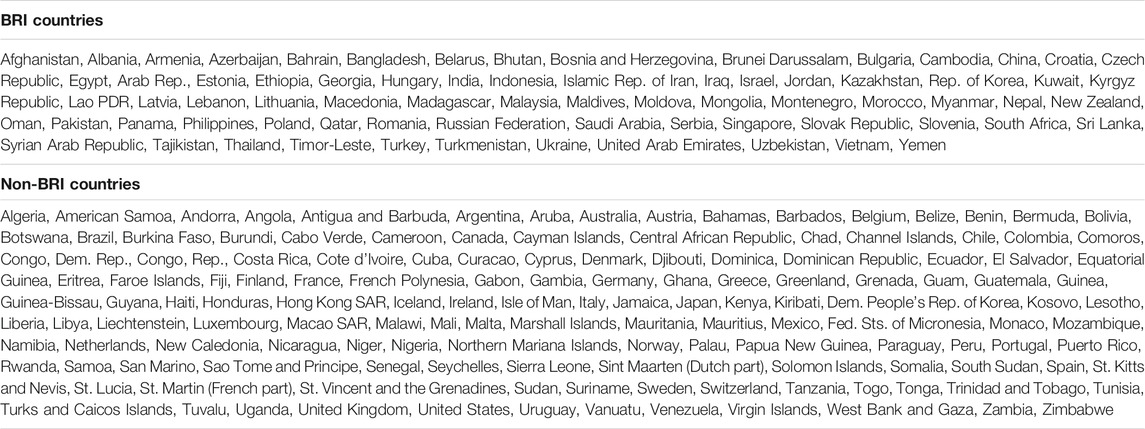
TABLE A1. Scope of BRI and non-BRI countries
Keywords: belt and road initiative, emission convergence, distribution dynamics, mobility probability plots, counterfactual baseline
Citation: Li JV, Cheong TS and Shi X (2021) A Counterfactual Baseline for Assessing Future Environmental Impact: A Case Study of the Belt and Road Initiative. Front. Environ. Sci. 9:724095. doi: 10.3389/fenvs.2021.724095
Received: 11 June 2021; Accepted: 08 October 2021;
Published: 21 October 2021.
Edited by:
Cosimo Magazzino, Roma Tre University, ItalyReviewed by:
Yaoping Wang, The Ohio State University, United StatesCopyright © 2021 Li, Cheong and Shi. This is an open-access article distributed under the terms of the Creative Commons Attribution License (CC BY). The use, distribution or reproduction in other forums is permitted, provided the original author(s) and the copyright owner(s) are credited and that the original publication in this journal is cited, in accordance with accepted academic practice. No use, distribution or reproduction is permitted which does not comply with these terms.
*Correspondence: Xunpeng Shi, eHVucGVuZy5zaGlAZ21haWwuY29t
Disclaimer: All claims expressed in this article are solely those of the authors and do not necessarily represent those of their affiliated organizations, or those of the publisher, the editors and the reviewers. Any product that may be evaluated in this article or claim that may be made by its manufacturer is not guaranteed or endorsed by the publisher.
Research integrity at Frontiers
Learn more about the work of our research integrity team to safeguard the quality of each article we publish.