
95% of researchers rate our articles as excellent or good
Learn more about the work of our research integrity team to safeguard the quality of each article we publish.
Find out more
ORIGINAL RESEARCH article
Front. Environ. Sci. , 13 September 2021
Sec. Environmental Informatics and Remote Sensing
Volume 9 - 2021 | https://doi.org/10.3389/fenvs.2021.720323
This article is part of the Research Topic Urban Climate Informatics View all 12 articles
 Julia Potgieter1
 Negin Nazarian1,2,3*
 Mathew J. Lipson4
 Melissa A. Hart1
 Giulia Ulpiani2,5
 William Morrison6Kit Benjamin6
The spatial variability of land cover in cities results in a heterogeneous urban microclimate, which is often not represented with regulatory meteorological sensor networks. Crowdsourced sensor networks have the potential to address this shortcoming with real-time and fine-grained temperature measurements across cities. We use crowdsourced data from over 500 citizen weather stations during summer in Sydney, Australia, combined with 100-m land use and Local Climate Zone (LCZ) maps to explore intra-urban variabilities in air temperature. Sydney presents unique drivers for spatio-temporal variability, with its climate influenced by the ocean, mountainous topography, and diverse urban land use. Here, we explore the interplay of geography with urban form and fabric on spatial variability in urban temperatures. The crowdsourced data consists of 2.3 million data points that were quality controlled and compared with reference data from five synoptic weather stations. Crowdsourced stations measured higher night-time temperatures, higher maximum temperatures on warm days, and cooler maximum temperatures on cool days compared to the reference stations. These differences are likely due to siting, with crowdsourced weather stations closer to anthropogenic heat emissions, urban materials with high thermal inertia, and in areas of reduced sky view factor. Distance from the coast was found to be the dominant factor impacting the spatial variability in urban temperatures, with diurnal temperature range greater for sensors located inland. Further differences in urban temperature could be explained by spatial variability in urban land-use and land-cover. Temperature varied both within and between LCZs across the city. Crowdsourced nocturnal temperatures were particularly sensitive to surrounding land cover, with lower temperatures in regions with higher vegetation cover, and higher temperatures in regions with more impervious surfaces. Crowdsourced weather stations provide highly relevant data for health monitoring and urban planning, however, there are several challenges to overcome to interpret this data including a lack of metadata and an uneven distribution of stations with a possible socio-economic bias. The sheer number of crowdsourced weather stations available can provide a high-resolution understanding of the variability of urban heat that is not possible to obtain via traditional networks.
With more than half of the world’s population living in urban areas, future development and planning rely on a complete understanding of the relationship between built environment characteristics and local climate. Air temperature, one of the key parameters of urban microclimate, is significantly influenced by the radiative and thermal properties of built materials, as well as anthropogenic heat released due to human activities (Masson et al., 2020). This temperature increase is further exacerbated by global climate change, leading to negative impacts on urban energy loads, local emissions, and citizen health and wellbeing (Masson et al., 2020).
The elevated temperature in cities exhibits a high spatial variability due to differences in urban form and fabric. Similarly, urban microclimate is temporally variable and is affected by meso- and synoptic-scale processes, as well as extreme and high-impact weather events. Such variabilities motivate fine-grained and continuous monitoring of microclimate across a range of urban characteristics, particularly to understand the role of urban design and planning. Furthermore, expansive and real-time monitoring of urban climate is critical during extreme weather events such as heatwaves, which have been increasing in intensity, frequency, and duration (Perkins et al., 2012). Thus, datasets with fine spatial and temporal resolutions are required to understand a city’s local climate, assess the effectiveness of heat mitigation strategies, and most effective plans for future development. However, scientific meteorological stations used for climate monitoring are traditionally installed for the purpose of assessing synoptic-scale weather conditions and as such, the siting aims to minimise the impact of urbanisation. In response, urban monitoring stations have been established to better understand microclimate characteristics in different cities (Rotach et al., 2005; Schroeder et al., 2005; Poutiainen et al., 2006; Basara et al., 2011; Christen et al., 2013; Warren et al., 2016). These weather stations, although pivotal for gaining a fundamental understanding of urban climate, are expensive to set up and maintain by experts, leading to sparse coverage and insufficient detail to fully analyse the intra-urban variability in climate (Muller et al., 2013).
Over the last decade, the emergence of internet-enabled, wireless, and lay person-friendly solutions have enabled a range of environmental sensor networks that can address the need for real-time and fine-grained temperature measurements, covering a wide range of spatial and temporal distributions in cities (Pantelic et al., 2021). The “Internet of things” (IoT) has enabled crowdsourcing and ubiquitous sensing of urban data, where data is gathered from and by the public using citizen-science solutions as opposed to centrally-managed measurement campaigns. Several studies have used crowdsourced data collected through consumer-grade weather monitors, or citizen weather stations, to assess the urban thermal climate of large cities such as London (Chapman et al., 2017; Benjamin 2019), Berlin (Fenner et al., 2017), Oslo (Venter et al., 2020) and Moscow (Varentsov et al., 2020). Crowdsourced data from over 50,000 citizen weather stations across Europe has also been compared to satellite data for measurement of urban heat island (UHI) indicating that satellite data overestimated UHI measurements by six times compared to crowdsourced data, which is more relevant for public health (Venter et al., 2021). These studies indicate that crowdsourced data achieves a higher spatial resolution than otherwise possible with regulatory monitoring networks, while highlighting the importance of data filtering and quality control to overcome accuracy concerns of low-cost sensing. Thorough quality control is required to remove any data that may be unrepresentative of local external conditions or caused by human interferences. Accordingly, several quality control procedures have been proposed, such as Meier et al. (2017) that removes outliers based on a comparison to reference data and Napoly et al. (2018) which removes readings based on the possible errors in data collection.
In addition to spatial microclimate data, clear metadata on urban characteristics is key to identifying the drivers of intra-urban variability. Using crowdsourced data, the location of each citizen weather station is known but, quite often, there is no specific information regarding the characteristics of the local environment (such as urban density, built materials, vegetation cover). One way to address this is to combine crowdsourced data with Local climate zone (LCZ) classifications that provide a landscape classification system for urban surface structure and cover, consistent across global cities (Stewart and Oke 2012). This classification in combination with crowdsourced temperature data can provide a thorough understanding of how local climate is impacted by different urban land-use and land surface characteristics. A study in Berlin assessed the intra- and inter-LCZ variability in urban temperature during the day and overnight (Fenner et al., 2017) and observed that within each LCZ, the temperature variance during the day was generally smaller than at night, and higher in summer than in winter. Inter-LCZ variability showed significant differences between not only urban and rural sites, but also between most common LCZs found within the city. Additionally, crowdsourced data used to assess the urban heat island (UHI) and identify intra-urban temperature variability in London observed cool anomalies near greenspaces (Chapman et al., 2017). This cool anomaly near urban parks was also reported in Moscow, while the areas still exhibited warmer temperatures than rural areas (Varentsov et al., 2020). These findings indicate that in addition to LCZ classifications, there is a need for a higher-resolution dataset on urban form and fabric (such as detailed vegetation cover and street canopy characteristics) that can assist with interpreting the inter- and intra-LCZ variability in urban temperature.
The current study is motivated by these emerging crowdsensing efforts addressing the need for high-resolution data monitoring in cities, while exploring overlaying datasets and urban classifications (such as LCZs and building-level urban data) that can identify key drivers for intra-urban temperature variability. Additionally, we focus on Sydney, Australia, which extends previous analyses to a coastal city with unique mesoscale processes and synoptic scale circulations that dominate urban ventilation throughout the city (Hirsch et al., 2021). When analysing the urban heat island (UHI) in Sydney, Santamouris et al. (2017) found that a strong UHI effect was observed to the west of the central business district, beyond the reach of sea breezes from the east. The reference station used to quantify the UHI at other stations was adjacent to the central business district and Sydney Harbour, and close to the coast. Therein lies one of the difficulties in quantifying an urban heat island for Sydney. The complex nature of the city, with its substantial geographical differences between coastal and inland suburbs, and the lack of non-urbanised sites reflective of these differences, make it difficult to calculate an accurate UHI intensity across the city. Further, a calculated UHI intensity may not always provide data that is of relevance for urban heat mitigation (Martilli et al., 2020). Therefore, in the current study, we leverage the crowdsourced monitoring stations to focus on how urban heat varies in Sydney both geographically-taking into account distance from the coast and topography- and in different local climate zones.
A variety of other studies have assessed Sydney’s climate. A link has been identified between synoptic conditions, in particular those associated with heat waves, and air pollution, leading to increased adverse health impacts at higher temperatures (Dean and Green 2018; Vaneckova et al., 2008; Jiang et al., 2017). The relationship between land surface temperature and green infrastructure has also been investigated and the temperature differences between green infrastructure classes were found to be more evident during summer and daytime, although the effect of impervious surfaces was found to dominate over the cooling effect of vegetation and water (Bartesaghi-Koc et al., 2019). Sydney temperatures are generally increasing over time (Livada et al., 2019), and an analysis of heat waves and urban overheating found that the urban overheating magnitude increased with the distance from the coast despite a reduced population density and increase in nonurban surfaces further inland (Khan et al., 2021).
These studies demonstrate the high spatial variability in urban temperature across the Greater Sydney region that is brought about through a combination of urban design and local climate factors, and in turn, the importance of urban climate monitoring. In this paper, we use crowdsourced data to obtain temperature observations of higher spatial resolution in Sydney. We then investigate the impact of both geography, via distance from coast and elevation, and urban fabric and form, via LCZs and other urban characteristics (such as eave height and surface cover), on temperature. By using high-resolution temperature observations combined with urban datasets, we aim to understand the interplay of geography and land use on urban heat in a complex coastal city, and further assess the validity of crowdsourced measurements as a method for analyses of urban heat.
Details of the collection and quality control of the crowdsourced data, urban data sets used, and analyses undertaken are explained in Data and Methods. Results and Discussion compares the crowdsourced data to the reference data from scientific meteorological stations, analyses the impact of geography, land use and land cover on the data, and explores the benefits and challenges of using such data in urban climate studies. Future directions for the use of crowdsourced urban temperature are discussed in The Applicability of Crowdsourced Data and High-Resolution Land Use Data.
This study focuses on the city of Sydney, Australia, which has a population of approximately 4.8 million. Sydney sits mostly within a basin between mountains and the coast, resulting in a complex interaction between mesoscale land and sea breezes. The metropolitan area is more densely populated in the east near the coast, with Greater Sydney extending almost 100 km west into the Blue Mountains. Beyond the mountains further west of Sydney lies grassland and arid shrubland. According to the modified Köppen classification system developed by the Bureau of Meteorology (BoM) based on a standard 30-years climatology, Sydney’s climate classification is temperate with a warm summer and no dry season. The study area includes most of the Greater Sydney region (Figure 1).
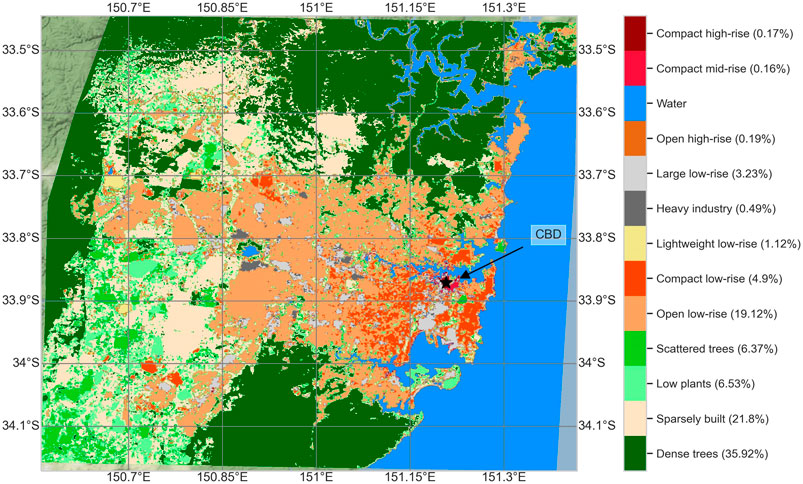
FIGURE 1. Local Climate Zone (LCZ) map of Sydney, Australia. The land fraction of each LCZ is given in the legend as a percentage. The central business district (CBD) is noted.
The sea breeze has a significant impact on cooling the coastal regions of the metropolitan area, while being deficient in reaching the western regions particularly at the base of the mountains, leading to extremely high temperatures. The western regions of Sydney are those most impacted by increasing urban development and therefore it is critical that detailed and high-resolution observations are available to assess the impact of urban heat in order to plan subsequent measures to ensure liveability in the future.
The time period assessed in this study is the 2020–2021 summer, from December to February. During this period, Sydney experienced slightly above average rainfall due to La Niña, and temperatures much cooler than recent summers. The daytime temperatures across Greater Sydney were 1–2°C below the average of recent decades. However, this time period also included several heatwaves with the highest temperature recording of 41.6°C recorded at Sydney Airport on Jan 26, 2021 (Bureau of Meteorology 2021).
To fully represent urban structure and land use across Sydney, we used two datasets. A map of local climate zones (LCZ), at 100 m resolution obtained by World Urban Database and Access Portal Tools [WUDAPT] (Ching et al., 2018; Bechtel et al., 2015) is used to provide a standardised landscape classification system to consistently compare different regions in urban areas across Sydney (Figure 1). There are thirteen LCZs in Sydney with three dominating categories: dense trees, sparsely built, and open low-rise (Figure 3A).
Since LCZ maps are determined through supervised machine learning applied to satellite imagery (Demuzere et al., 2021), there is no direct spatial or building height data informing their creation. Therefore, characteristics for these locally derived LCZ areas can differ from “typical” values presented in Stewart and Oke 2012. To provide additional information on the urban landscape not given by LCZ, an independent dataset of landcover and building characteristics (Geoscape) was used to categorise impervious fraction and vegetation as well as ground elevation and building height at a 100 m resolution (PSMA Australia, 2020). Figure 2 shows the processed Geoscape data at a 500 m resolution for Sydney while Table 1 summarizes the characteristic values for locally derived LCZs. Eave height refers to the height from the ground to where the wall and roof intersect. Sydney eave height is for the most part below 20 m, with small CBD areas having mean eave heights up to 50 m. Sydney elevation varies between 0 and 500 m (Figure 2B). Surface cover fraction data was available as bare earth, roads and paths, grass, trees, other vegetation, built area, buildings, and water. To simplify analysis, here an aggregate vegetation category has been used, defined by the sum of the grass, trees and other vegetation fractions (Figure 2C). Similarly, an impervious category has been defined by the sum of the roads and paths, built areas and buildings fractions (Figure 2D).
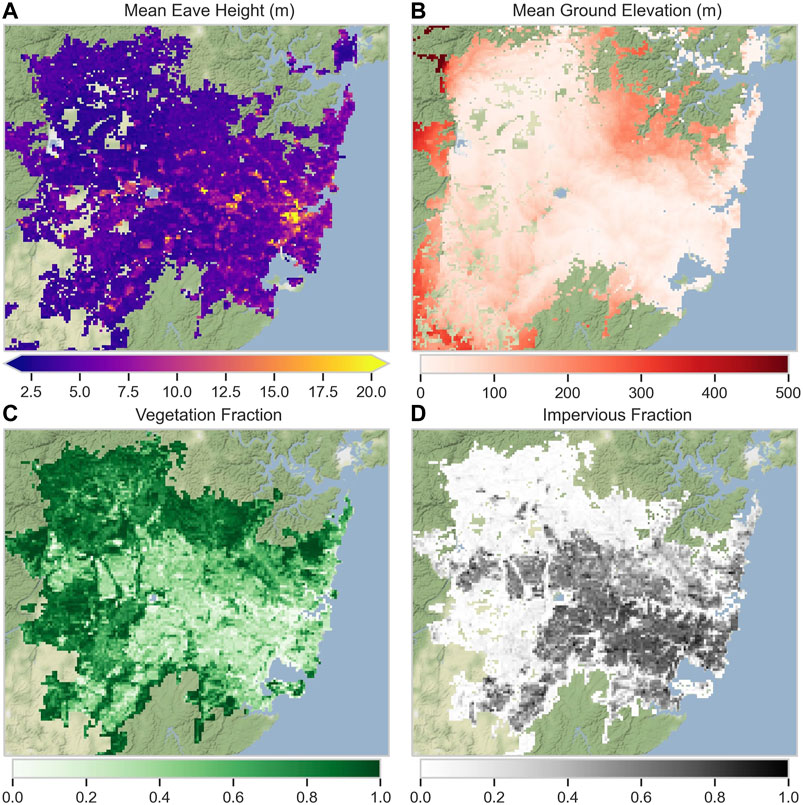
FIGURE 2. (A) Mean eave height (m) and (B) ground elevation (m), and (C) vegetation and (D) impervious fractions across Sydney.
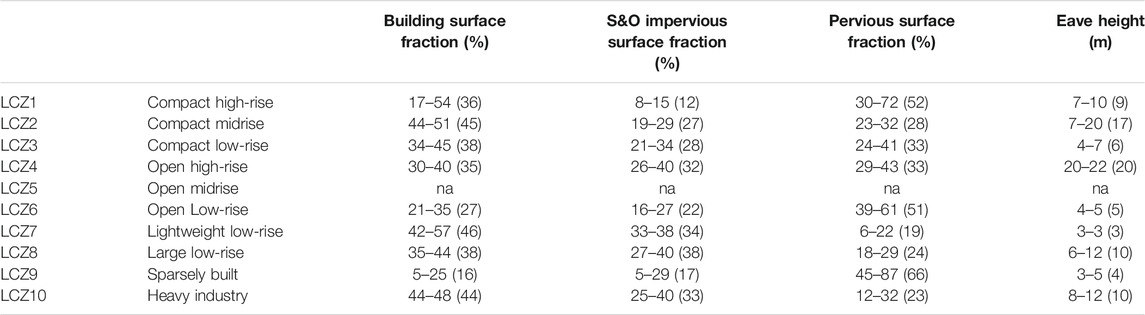
TABLE 1. The characteristic values for locally derived LCZs for grids containing Netatmo stations, formatted for comparison with values presented in Stewart and Oke, 2012 (S&O: where impervious surface fraction does not include building fraction). Here the 25th–75th percentile ranges are shown, with mean values bracketed.
Crowdsourced air temperature and humidity data were collected from 551 Netatmo “Smart Home Weather Stations” across Sydney. The Netatmo stations consist of an indoor and outdoor module. The outdoor module collects real-time weather data including temperature, humidity, and barometric pressure which, should the user agree, is displayed on the Netatmo Weathermap web portal. Historical data is not available; data for this study has been collected via quarter-hourly scraping of the Weathermap over the 2020–2021 summer (Dec 2020–Feb 2021), leading to over two million air temperature readings collected.
The outdoor temperature and humidity sensors have accuracy of ±0.3°C (over a range of −40°C–65°C) and 3%, respectively. The temperature accuracy has been validated and confirmed by Meier et al. (2017) using a climate chamber over the temperature range 0°C–30°C. However, the placement conditions of the outdoor module can have a significant impact on the temperature readings (Quality Control) (Varentsov et al., 2020).
Ideally, sensors would be distributed across built LCZs corresponding to the distribution found in the city. However, more than half of the locations at which data is collected represent the open and compact low-rise zones, with only a small number representing dense trees and sparsely built zones (Figure 3B).
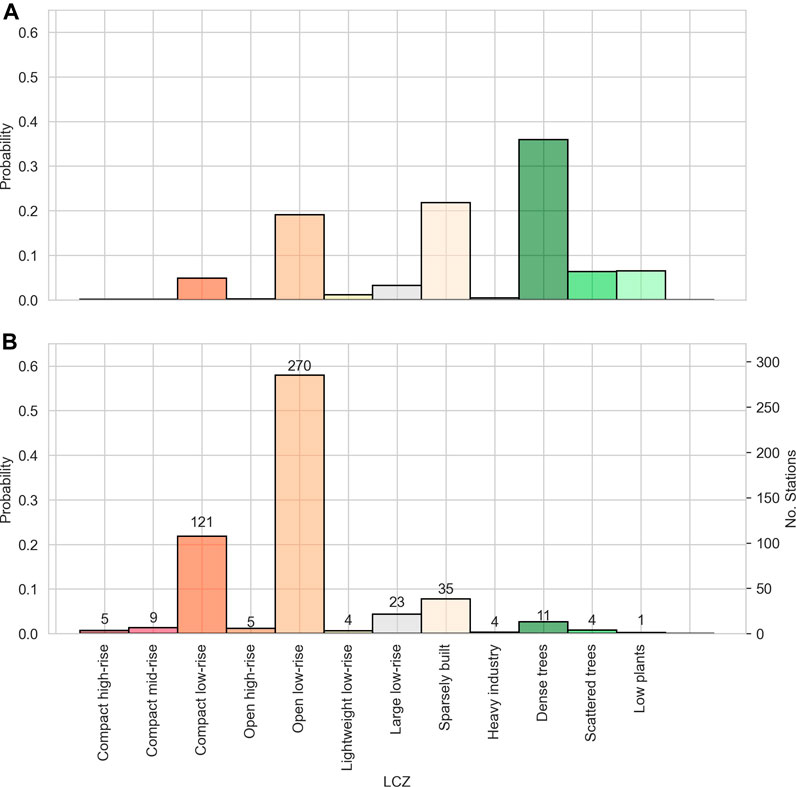
FIGURE 3. (A) Distribution of LCZs across Sydney, Australia, and (B) distribution of Netatmo stations across Sydney LCZs. The number of stations per LCZ is given at the top of each column.
While stations placed correctly in shaded areas have reasonable accuracy, those kept in direct sunlight or even indoors or other inappropriate locations can report a range of inaccurate readings (Varentsov et al., 2020). The quality of each reading has therefore been checked and the data filtered according to the four main steps (M1 to M4) defined in the framework by Napoly et al. (2018).
The first main step, M1, removes stations with identical latitude and longitude as this indicates incorrect set up of the station. Based on unique ID numbers for each station, no stations in Sydney had repeated coordinates. Rather, in some cases a request had been made to the server before the next readings had been recorded and updated on the Weathermap, leading to duplicate recordings. As such, identical readings from each station with the same timestamp have been removed.
Step M2 of this framework finds and removes outliers based on each hourly distribution. The main purpose of this step is to remove significantly high readings likely from stations in direct sunlight. The data was separated into hours, and a “Z-score” for each reading was defined as:
where T is air temperature (°C) and Qn is a robust estimator for variance given by the 0.25 quantile of the distances {|xi – xj|; i < j} (Rousseeuw and Croux 1993). Following Napoly et al. (2018), readings with a Z-score outside the range −2.32 to 1.64 were removed, leaving 92.45% of data remaining.
In step M3, at each station if step M2 removed more than 20% of readings during 1 month, then the entire month is removed. This reduced the data to 85.58%.
The final step M4 targets indoor stations by comparing the Pearson correlation between each station and the median of all stations in each month. If the correlation was less than 0.9, all readings from the station were removed for said month. This left a remaining 81.74% of data for analysis after step M4, similar to values reported in Napoly et al., 2018 (82.21 and 81.45%).
Between steps three and four the data was reorganised into 30-min intervals (using mean values wherever a station had multiple readings in a half-hour period), which simplified finding the Pearson correlation and mean temperatures, and all later processing. This was completed after steps M1 to M3 so that specific outliers could be removed prior to averaging. Quality control reduced the number of stations from 551 to 492.
Warm and cool days were defined based on daily maximum of mean half-hourly temperatures of all stations. The median of daily maximum of 25.7°C then set the threshold, evenly dividing days between warm and cool days. The timeseries of warm and cool days can be seen in Figure 4. Compared with 30-years climate averages for Sydney, 2020–2021 was a slightly cooler summer with above average rainfall. Additionally, data from BoM meteorological stations indicate that cool days mostly occurred under rainy or overcast conditions (Bureau of Meteorology, 2021).
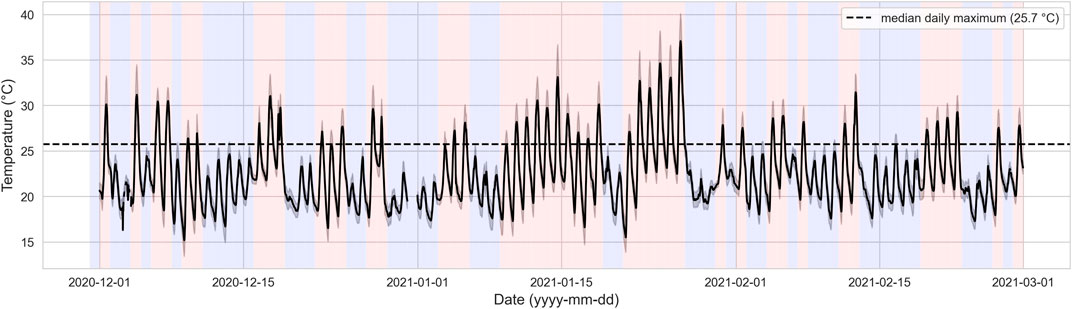
FIGURE 4. . Timeseries of mean half-hourly air temperature (solid black line) and standard deviation error (shaded range around mean) during summer (Dec 2020–Feb 2021). Days with maximum temperature above median daily maximum are highlighted in red, while days with maximum below median daily maximum in blue.
To understand the crowdsourced data in the context of urban climate monitoring and how it may be interpreted, a comparison has been made with weather station data from the BoM. To help explore the impacts of both geography and urbanisation on urban heat the metropolitan area has been divided into three regions (inland, central, and coastal) running approximately parallel to the coast (Figure 7, detailed in Geographical Influences on Urban Temperature). The warm and cool aggregate day representations of these regions are shown in Figure 8.
In this section, we use crowdsourced data to detail the impacts of urban form and fabric (indicated by LCZs as well as surface cover and building height data) as well as local geography on intra-urban temperature variability in Sydney.
Crowdsourced temperature data across Sydney, Australia, is first compared with reference weather stations established by BoM. There are approximately 600 BoM weather stations across Australia, sited according to the World Meteorological Organization guidelines to measure synoptic scale conditions rather than the local or micro scales (Bureau of Meteorology 1997). The key differences in siting are that BoM weather stations are installed within approved shelters at a height of 1.1 m above ground level, within a 30 by 30 m buffer of low natural vegetation (e.g., grass), and taller obstructions outside the buffer being at a distance of up to 10 times their height. These requirements make the placement difficult in highly urbanised areas. Netatmo sensors, however, are placed where people live (e.g., in backyards or on balconies).
The location of BoM sites compared to Netatmo stations is shown in Figure 5. A total of 10 BoM weather observation stations were identified within the study area (Greater Sydney Region) marked as black triangles in Figure 5 and their readings were compared with Netatmo stations identified within the 3 km radius. A threshold of at least three Netatmo stations was implemented for this comparison, which reduced the number of BoM stations to five (named in Figure 5). The comparison is further divided into aggregate warm and cool days detailed in Site Decomposition and Data Aggregation.
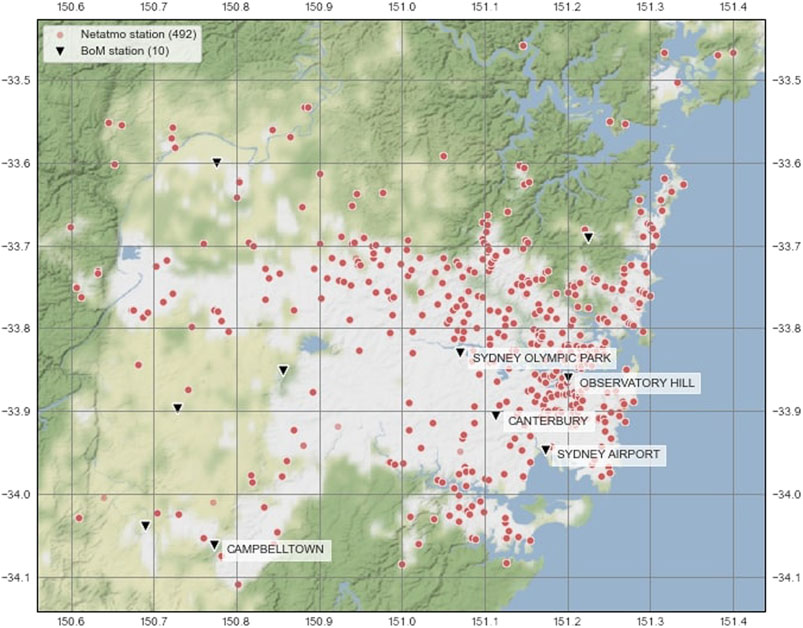
FIGURE 5. Spatial distribution of reference weather stations established by the Bureau of Meteorology: BoM (black triangles, labelled only if used in analysis) compared with Netatmo sensors across the Greater Sydney region. The number of stations in each category is indicated in brackets in the legend.
A comparison of Netatmo measurements with neighbouring reference stations (not shown) showed a high correlation between crowdsourced and reference station observations (Pearson regression correlation ranging between 0.75–0.99), with no clear pattern of change observed between day- and night-time or cool/warm days. Therefore, we focus our analyses on comparing the diurnal evolution of air temperature recorded by both monitoring networks (Figure 6).
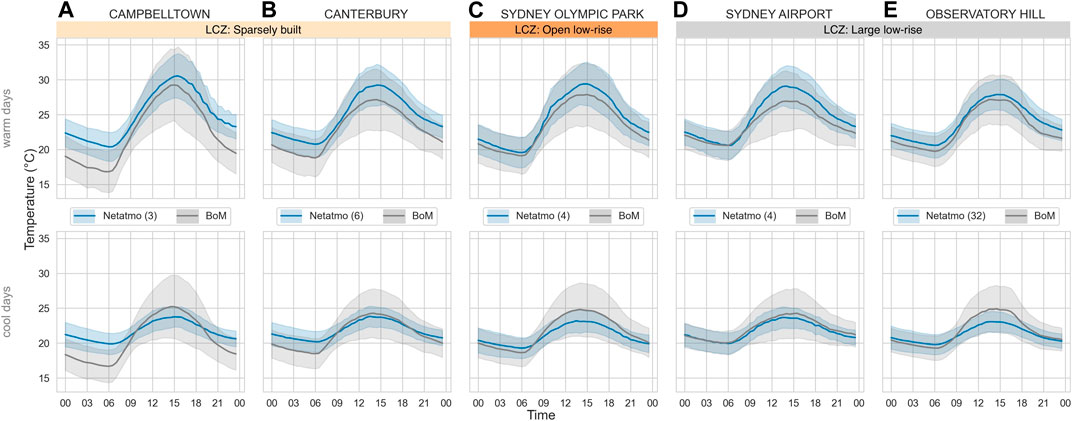
FIGURE 6. Comparison of measurements obtained from reference weather stations (BoM) (grey) and nearby Netatmo recordings (blue) and standard deviation error (shaded range around means) of the temporal distribution for aggregate warm and cool days. The number of Netatmo stations within 3 km of the BoM station is given in brackets in the legend.
When compared with reference measurements during the day, the citizen weather stations consistently observed higher daytime temperatures on warm days and cooler daytime temperatures on cool days. For both warm and cool days and across all stations, Netatmo readings were higher at night. The consistency of results across locations, and persistent elevated temperatures at night (i.e., without direct sunlight confounders) indicate a robust difference in typical microclimate conditions between BoM and Netatmo sites.
Elevated urban temperatures can be caused by a range of factors, including greater absorption and retention of solar and thermal radiation by urban materials and geometries, lower levels of evapotranspiration, and greater release of heat from anthropogenic sources (Stewart and Oke, 2012). Additionally, the high heat capacity and increased surface area of urban structures can reduce the amplitude of diurnal temperature variation (Wang et al., 2018). Netatmo measurements have both elevated temperatures (particularly during warm days) and reduced amplitude diurnal patterns (particularly on cooler days) compared with BoM measurements.
Other studies have observed similar patterns. For example, in London a similar comparison found that the reference stations measured slightly lower mean daily maxima and minima on warm days, and a slightly increased or similar diurnal temperature range as compared to Netatmo stations (Benjamin 2019). In Berlin, reference stations observed increased daytime and decreased overnight temperatures as compared to crowdsourced data (Fenner et al., 2017), indicating a relationship more similar to that seen on cool days in the current study.
The sites located at Campbelltown, a sparsely built suburban location approximately 50 km west of the CBD, showed the largest warm day overnight difference of 3.6°C at 3am, whereas Sydney Olympic Park and Sydney Airport, both located close to water bodies, showed the smallest differences at 3am of ∼0.5°C. A large overnight difference is also observed at Campbelltown on cool days.
At Campbelltown, large consistent differences between BoM and Netatmo stations may be due to the impact of local siting (i.e., direct interaction with nearby built form) and of more regional interactions (i.e., lack of sea breeze in Western Sydney leading to less local mixing, compounding microclimate differences). The other stations are located in open low-rise and large low-rise zones, and closer to the ocean. These areas are more densely built than Campbelltown, which means the BoM stations are likely more affected by larger-scale urban warming effects from more densely built areas, and more vigorous mixing of air by sea breezes, reducing differences with Netatmo stations.
During the day on warm days, Sydney Airport showed the largest difference in maximum temperature, where crowdsourced air temperature at 2pm was approximately 2.5°C higher than reference measurements. The specific attributes of this site are likely the cause of this increased discrepancy. The reference station is located very near the airport grounds and the coast, thus is exposed to increased ventilation and higher sky view factor due to the openness, affecting convective and radiative heat transfer. The Netatmo stations, however, are located within the suburb around the airport, where cooling mechanisms associated with wind and radiation are weaker.
On cool days, a wider diurnal range is recorded by the reference sensors compared to the citizen weather stations. Our investigation of the BoM dataset indicates that cool days during this period occurred on overcast sky conditions or received light-moderate rainfall. With lower shortwave radiation during the day, the convection and conduction from surrounding surfaces dominate heat transfer balance, and consequently air temperature, in the urban canopy. Accordingly, it is likely that the lack of built materials with high thermal inertia near the BoM stations has led to a wider range in temperatures.
Similar to warm days, Campbelltown had the largest overnight discrepancy of 3.2°C between 4:30 to 5:30 am. During the day, Observatory Hill, located in the Sydney central business district and adjacent to Sydney Harbour, had the largest discrepancy of 1.9°C at 2:30pm.
This comparison has identified differences between stations due to their location, including the LCZ and the distance from the coast. It is clear that the local climate near the coast is strongly influenced by the sea breeze and as such, stations near and far from the coast cannot be directly compared. Assessing stations within regions of increasing distance from the coast allows each region to be analysed individually, as well as comparison between regions.
For analysing intra-urban temperature variability in a coastal city, it is critical to account for the intertwined nature of urban topography and the distance from the coast combined with urban design characteristics (such as urban density and sprawl). The distance from the ocean has a strong impact on temperature in Sydney (Hirsch et al., 2021) as also observed in other coastal metropolises like Los Angeles (Vahmani and Ban-Weiss 2016). Accordingly, we divide the crowdsourced datasets based on regions (inland, central, and coastal shown in Figure 7) before assessing the impact of urban design and land cover on temperature variabilities (Land Use and Land Cover Influence on Urban Temperature). The regions are divided using an approximately uniform width, slightly shifted to maintain a sufficiently large number of Netatmo stations per region (particularly inland).
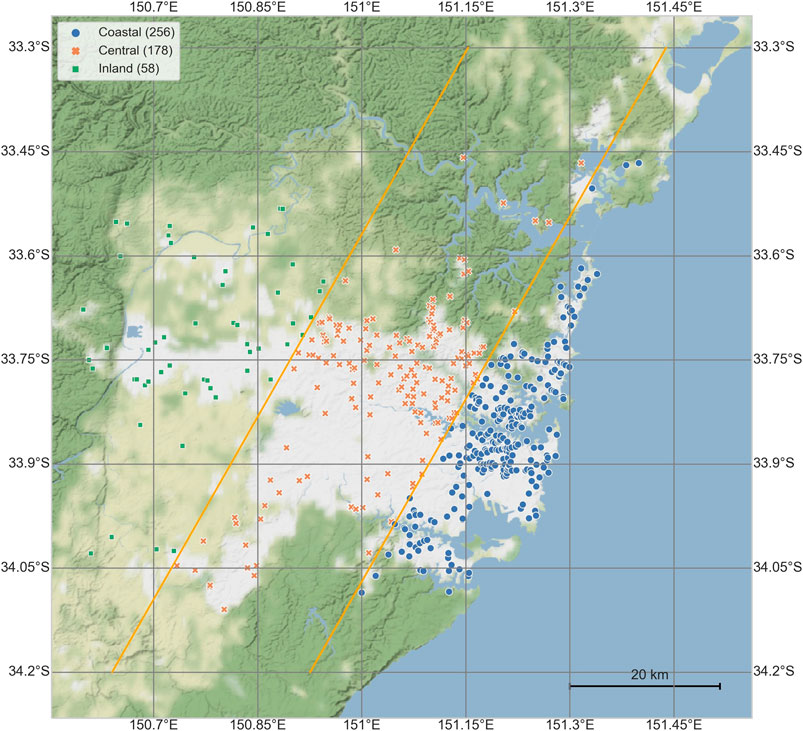
FIGURE 7. Locations of Netatmo stations across Sydney, Australia. The site has been divided into three regions: inland, central, and coastal. The number of stations per region is indicated in brackets in the legend.
As anticipated, temperature distribution (particularly on a warm day), is highly influenced by the geographic region (Figure 8), which is in turn affected by the distance from the coast as well as elevation due to proximity to mountain ranges in the south and west. We observe that the inland region experienced the largest diurnal range with an average of 11.7°C and 4.6°C on warm (Figure 8A) and cool days (Figure 8C), respectively, compared to 7.8°C and 3.3°C in the coastal region.
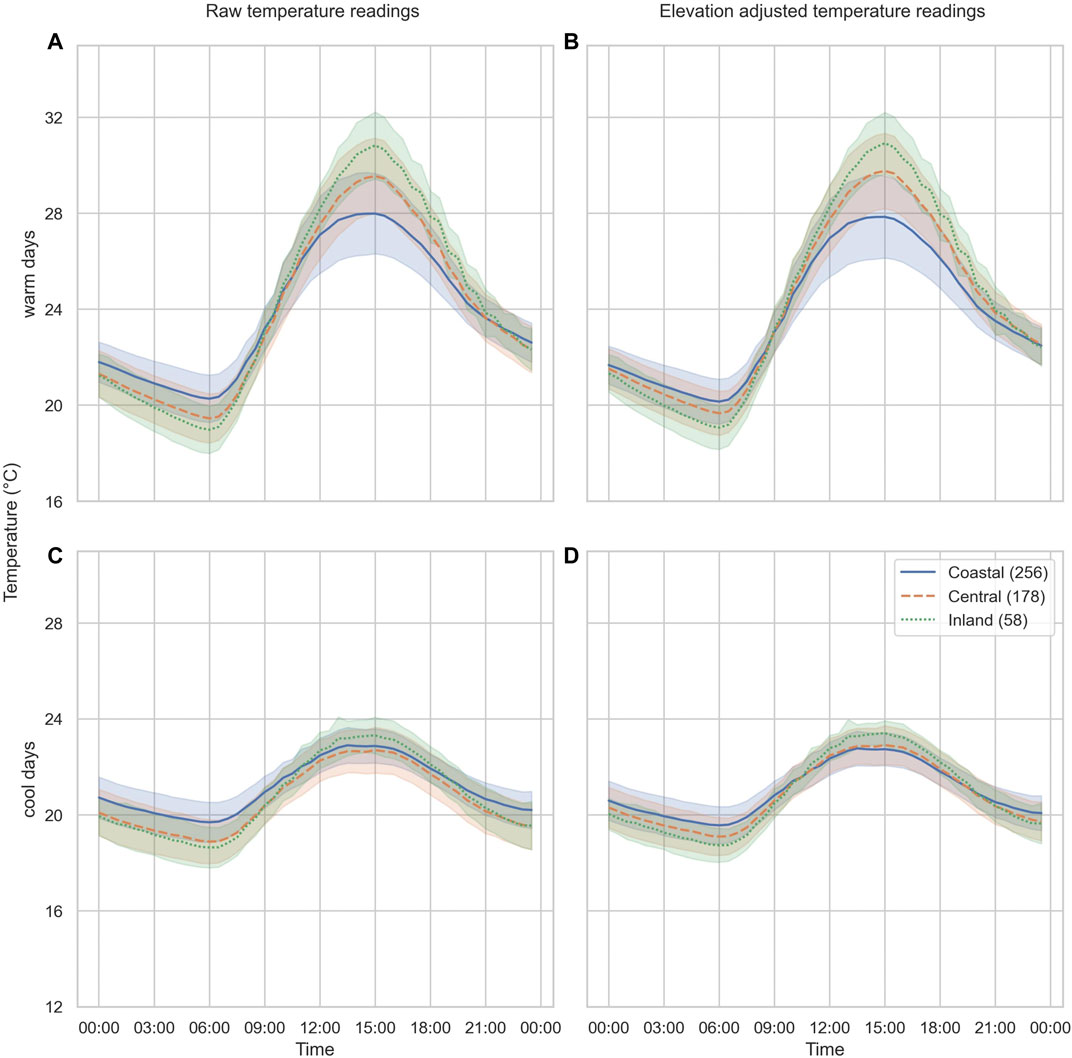
FIGURE 8. Mean aggregate warm and cool day temperature comparison of raw temperatures and temperatures adjusted to a constant elevation of 63.3 m in different regions in Sydney. Raw temperatures are shown for (A) warm days and (C) cool days. Elevation adjusted temperatures are shown for (B) warm days and (D) cool days. Shaded areas (centred around corresponding lines) indicate the spatial standard deviation. The number of stations per region is indicated in brackets in the legend.
Accordingly, in order to focus on intra-urban variabilities brought about by urban design characteristics, the impact of elevation was removed using the lapse rate, defined as
where z is the elevation of each station in metres (Napoly et al., 2018). Temperatures were adjusted to an equivalent temperature at a constant elevation of 63.3 m (the mean elevation of the stations). The impact of this elevation adjustment is more evident on cool days than warm, showing a clearer increase in diurnal range with distance from the coast (Figure 8).
With higher elevations generally found further from the coast, elevation and coastal impacts are correlated. After adjusting for the elevation, the remaining differences between regions are primarily land cover differences and distance from the coast. To ascertain how the impact of land use and cover differs across the city, maximum and minimum temperatures have been compared between classes of the urban design characteristics, and between regions in the following analyses (Figures 9–12). Dividing the area into regions aims to separate out the impact of the coast, however interpretation of data from the coastal region still remains a challenge due to the varying impact of the ocean in this region. The moderating influence of the ocean and the cooling effect of the sea breeze may be more impactful nearer to the coast. Whereas for the central and inland regions the influence of the distance from the coast is fairly consistent which allows for individual comparison of other urban design characteristics.
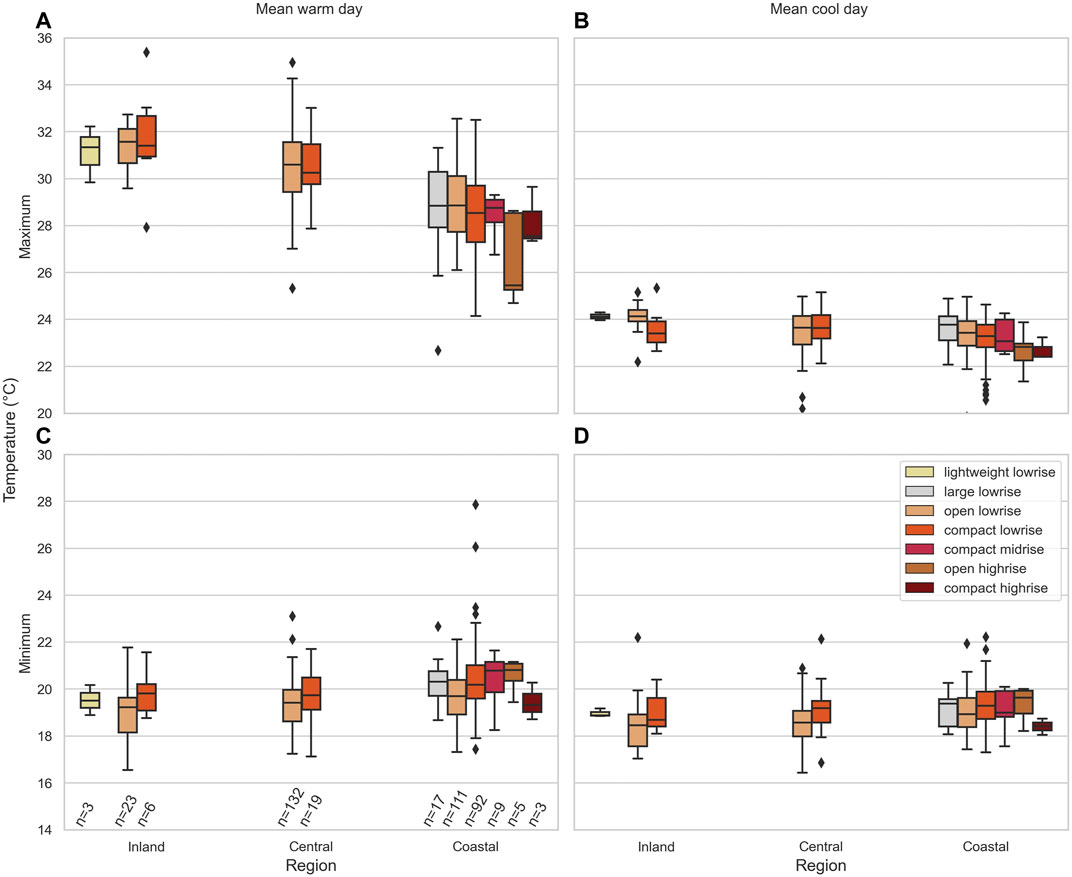
FIGURE 9. Urbanised LCZ comparison of station mean maximum and minimum temperatures on warm and cool days. Mean maximum temperatures are represented for (A) warm days and (B) cool days, and mean minimum temperatures are represented for (C) warm days and (D) cool days. Data has been divided into regions (along the x-axis) and LCZ classifications (via colour coding shown in legend). The number of stations per LCZ classification in each region (n) is given along the x-axis in (C).
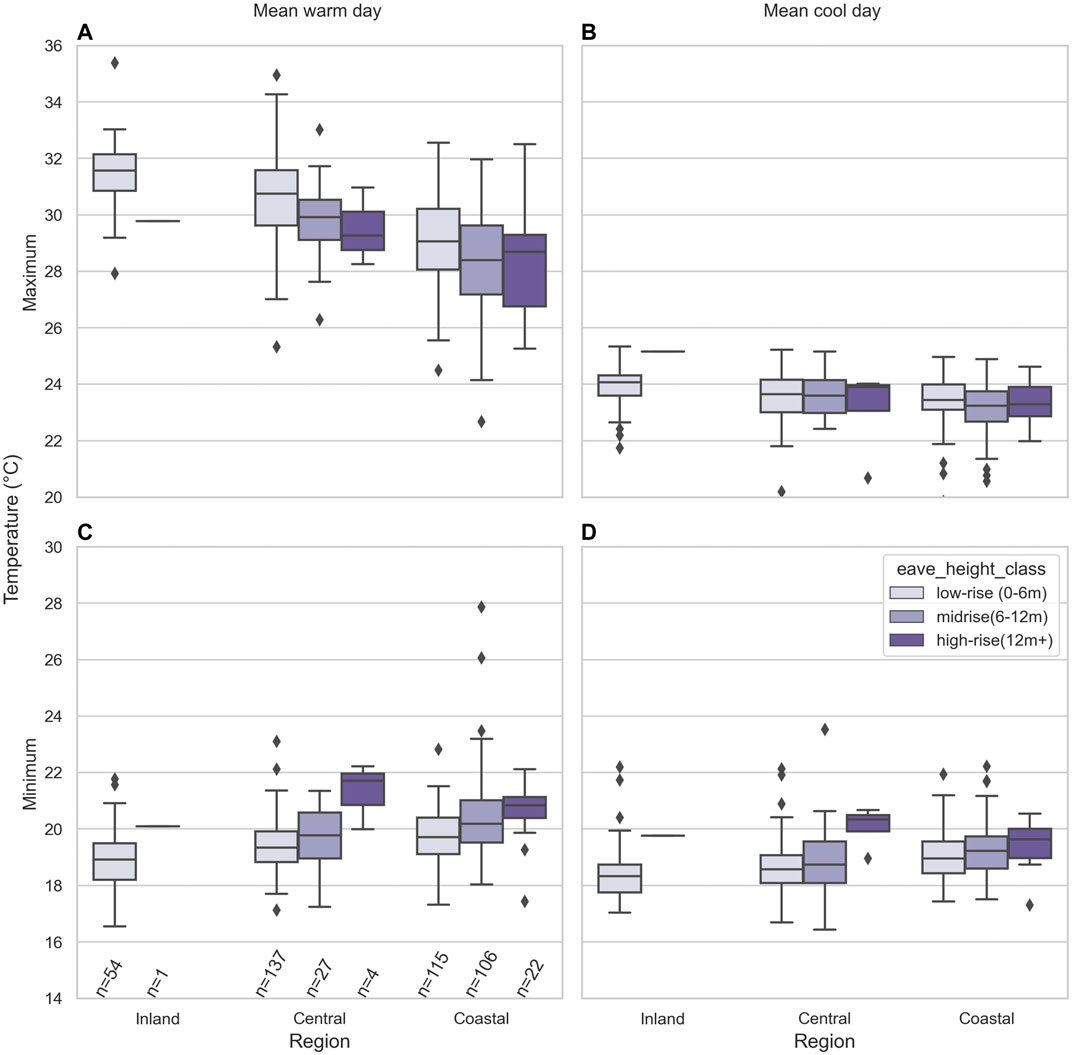
FIGURE 10. Eave height comparison of mean maximum and minimum temperatures on warm and cool days. Mean maximum temperatures are represented for (A) warm days and (B) cool days, and mean minimum temperatures are represented for (C) warm days and (D) cool days. Data has been divided into regions (along the x-axis) and eave height classifications (via colour coding shown in legend). The number of stations per LCZ classification in each region (n) is given along the x-axis in (C).
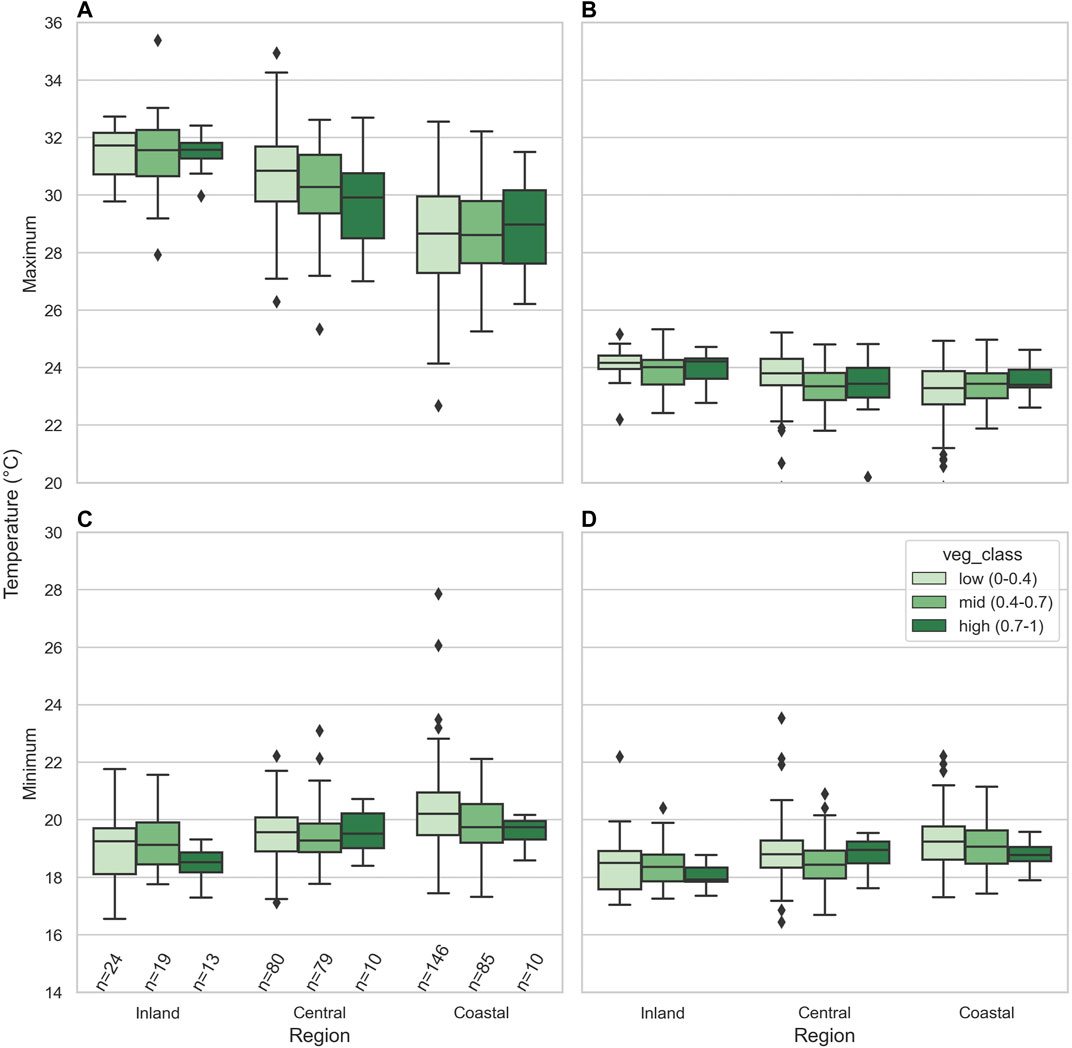
FIGURE 11. Vegetation fraction comparison of mean maximum and minimum temperatures at each station on warm and cool days. Mean maximum temperatures are represented for (A) warm days and (B) cool days, and mean minimum temperatures are represented for (C) warm days and (D) cool days. Data has been divided into regions (along the x-axis) and vegetation classifications (via colour coding shown in legend). The number of stations per LCZ classification in each region (n) is given along the x-axis in (C).
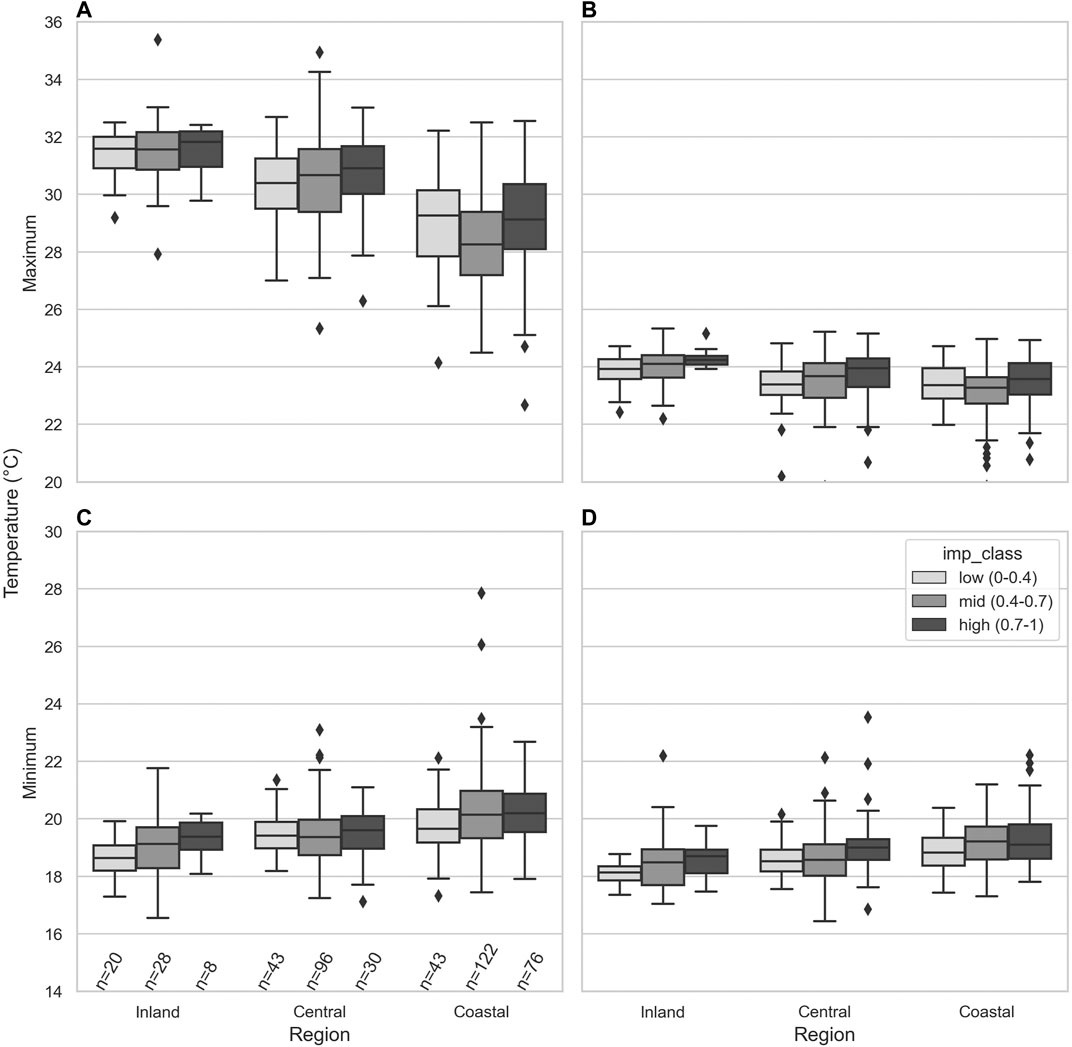
FIGURE 12. Impervious fraction comparison of mean maximum and minimum temperatures on warm and cool days. Mean maximum temperatures are represented for (A) warm days and (B) cool days, and mean minimum temperatures are represented for (C) warm days and (D) cool days. Data has been divided into regions (along the x-axis) and impervious classifications (via colour coding shown in legend). The number of stations per impervious class in each region is given along the x-axis in (C).
To investigate the impact of urban design and land cover on intra-urban variability of air temperature, we compare crowdsourced measurements with LCZ and Geoscape data for Sydney (Study Area and Time Period). For this analysis, the station mean maximum and minimum temperatures in warm and cool days have been assessed. Between regions, these values have the largest differences (Figure 8) and thus will give an indication of the significance of the impact of each urban design characteristic. The maximum temperature of the mean warm day has been calculated by finding the maximum temperature for each warm day for each station, and then taking the mean over days. Similarly, the maximum and minimum of mean cool or warm days were found. Accordingly, the datapoints in Figures 9–12 represent the distribution of maximum/minimum temperature across different stations.
Figure 9 shows the boxplot distribution of air temperature in each region categorised by LCZ. In this analysis, we focus on urbanised LCZs which also include the highest number of Netatmo stations (Figure 3B): open and compact low-rise, lightweight and large low-rise, compact midrise, and open and compact high-rise. Only LCZs with at least three stations in a region were assessed. As shown in Figure 1, fewer urban LCZs are represented in the inland and central regions compared to coastal areas. In general, compact LCZs recorded a smaller diurnal range than open LCZs, with lower maxima and higher minima, except for the compact high-rise LCZ. Increasing minima and decreasing maxima were observed with increasing height, again excluding the compact high-rise LCZ. In general, we expect to see smaller temperature diurnal ranges in more densely built areas because of increased thermal inertia (Wang et al., 2018).
Considering the low-rise LCZs, open low-rise recorded higher maxima and lower minima than compact low-rise. In the open LCZ, a higher sky view factor (SVF) leads to higher solar radiation penetration, increasing the maximum temperature. Overnight, on the other hand, more ventilation and higher SVF in the open LCZ result in a lower minimum (Oke, 1981; Skarbit et al., 2017).
On the contrary, the high-rise LCZs observed a wider diurnal range in the compact zone compared to the open zone. The high-rise LCZs are only present near the coast, and recorded the lowest maxima. However, when comparing the minima, open high-rise recorded the highest minima while compact high-rise recorded the lowest minima across all urbanised LCZs. Since the main difference between these LCZs is the density, the impact on temperature is likely due to the interaction between convective, conductive, and radiative heat fluxes affected by density. In the compact zone, higher density results in increased shading due to the deeper canyons (Johansson, 2006; Masson et al., 2020), whereas in the open zone, a higher SVF allows more solar radiation to be absorbed during the day. However, it is expected that during the night, radiative cooling and sensible heat flux increase with decreasing density (Nazarian and Klessil, 2015), resulting in lower surface and air temperatures, which is not observed with crowdsourced data. As for maxima, compact subzones recorded the worst overheating episodes rather than open subzones. In this case, the shadowing effect in canyons is countervailed by reduced wind speeds and ventilation as well as by additional heating mechanisms that typify dense clusters of tall buildings, such as multiple solar inter-reflections bouncing between overlooking facades (Battista et al., 2021). The compound effect may be the cause of the increased maximum temperatures.
Across all land use and land cover comparisons, there was reduced variability in the cool day maxima as compared to the warm day maxima. This indicates that local conditions and micro/mesoscale phenomena have a reduced influence on the maximum temperatures over cool periods, governed by larger-scale dynamics. This is likely due to the increased cloud cover on cool days which reduced both the incoming solar radiation and the transparency in the atmospheric window, which enables radiative cooling. As such, the effect of optical properties (e.g., albedo, emissivity) and thermal inertia of materials is mitigated and moderated across LCZs, thus reducing the range intemperatures otherwise observed.
Another important result of this analysis is the range of temperatures observed within a single LCZ, namely the intra-LCZ range shown by each box. For warm days, a wider range of temperatures within each LCZ is observed for the maximum temperatures than the minimum temperatures, whereas for cool days a similar range is observed between maximum and minimum temperatures. These observations are contrary to those seen in Berlin and Szeged, where intra-LCZ daytime temperatures in general varied less than overnight, and LCZs with a larger number of stations had the widest temperature ranges (Fenner et al., 2017; Skarbit et al., 2017). This variability was attributed to microscale differences in exposure, surface cover, and anthropogenic heat sources near the measurement sites, as well as due to the grouping of LCZ classifications regardless of location, neglecting meso-scale effects. In this study however, some meso-scale effects have been included by the division of regions.
Despite covering a relatively small area with few stations, the open high-rise LCZ had the widest interquartile range for warm day maximum temperatures of approximately 3.3°C. For minimum temperatures however, this LCZ had one of the smallest temperature ranges of 0.7°C. This may be due to variable shading in the canyon during the day causing highly varying recordings, while overnight heat release from materials affects all stations and moderates temperatures.
The open and compact low-rise LCZs have fairly consistent temperature ranges across the regions. The coastal and inland maximum temperatures in the open low-rise zones have the largest difference in temperature ranges with a range of 1.5°C inland and 2.4°C near the coast. This indicates that within these LCZs there is some variability in local climate, however this variability is consistent across the regions and thus is likely not due to the influence of the coast.
The intra-LCZ ranges indicate that there are other urban factors at play which influence the local temperature distribution. Further comparison with more specific urban design characteristics has been made in order to identify their individual impacts.
As noted in Study Area and Time Period, LCZ maps are determined through supervised machine learning applied to satellite imagery (Demuzere et al., 2021) and their characteristics can differ from “typical” values presented in Stewart and Oke 2012 (locally derived values presented in Table 1). We therefore complement the above results using an independent spatial dataset which includes direct spatial and building height information for Sydney (PSMA Australia, 2020).
The LCZ building height classifications are low-rise (2–10 m), midrise (10–25 m) and high-rise (25 m+). Across Sydney, stations are mostly categorised by LCZ low-rise, with very few in midrise and high-rise areas which does not allow for clear comparison between height categories. As such, when using the independent dataset, the classification thresholds of low-, mid- and high-rise have been adjusted to better suit the Sydney urban landscape. Mean eave height has been broken down into the following three categories: low-rise (0–6 m), mid-rise (6–12 m), and high-rise (12 m+). Low-rise defines housing of 1–2 storeys, and high-rise defines buildings of four storeys or higher in which an elevator is required.
Figure 10 shows the boxplot comparison of crowdsourced temperature in different eave height classes per region. The high-rise category (12 m+) was not present inland, and midrise (6–12 m) was only represented by one station in this region. In both the central and coastal regions, the number of stations representing high-rise areas was significantly lower than those representing low- and mid-rise.
The eave height comparison is consistent with the LCZ height comparisons, and shows these trends more clearly. In general, the diurnal range decreased with increasing eave height. The minimum temperatures increased with increasing eave height, with ranges in median temperature of 1.4°C and 1.1°C in the central region, and 1.1°C and 0.6°C in the coastal region, on warm and cool days, respectively. Conversely, the warm day maximum decreased with increasing eave height, with a range in median temperature of 2.0°C in the central region and 1.6°C near the coast.
Here, we extend the analyses to evaluate the impact of surface cover determined by impervious and vegetated surface covers. The fraction of land covered by vegetation and impervious surfaces (Study Area and Time Period) is found using 100 m gridded data to represent neighbourhood scales. Vegetation and impervious classes were compared per region (Figures 11, 12). These classes were defined by the ranges 0–0.4, 0.4–0.7 and 0.7−1 of the aggregate vegetation and impervious fractions. All vegetation and impervious classes were represented in all regions. Note that the impervious fraction is not simply the opposite of the vegetation fraction; there are other surface cover fractions which are not included in either of these categories. These include water bodies and swimming pools.
No clear trend was observed in the maximum temperatures, although in the central region areas with increased impervious fraction and reduced vegetation fraction recorded higher temperatures for both warm and cool day maxima. In general, minimum temperatures are higher in areas of high impervious fraction, on both warm and cool days. This is likely due to increased heat absorption and thermal inertia of impervious materials and increased surface temperatures (Masson et al., 2020). Thermal inertia has been observed to have a stronger influence on UHI than anthropogenic heat and population, causing increased overnight temperatures as observed here on both warm and cool days (Varquez and Kanda 2018).
This is expected to lead to reduced minimum temperatures in areas of high vegetation fraction, consistent with observations by Sharifi and Lehmann (2014) and Varquez and Kanda (2018), however this is not as clearly observed. There is a slight disruption in this trend in the coastal and central regions on warm days, and the central region on cool days. This may be due to the high impervious fraction in this region; the presence of impervious surfaces can significantly reduce the cooling effect of vegetation which may be causing the anomaly (Myint et al., 2010; Bartesaghi-Koc et al., 2019). However, the high variability near the coast and the reduced representation of the highly vegetated areas may have introduced a bias.
Across all urban design characteristic comparisons, a clear trend is observed between regions. Maximum temperatures increase with distance from the coast, and minimum temperatures decrease with distance from the coast, indicating an increased diurnal range inland compared to the coastal region, as observed in Figure 8. This is clear regardless of which urban design characteristic is being assessed, which indicates that the distance from the coast has the largest impact on air temperature across the city. The distance from the coast is the key factor affecting the impact of the sea breeze, however there is also interplay of topography and land use. Los Angeles has a similar geography to Sydney with both coastal and mountainous boundaries and similar effects have been observed in terms of UHI dynamics, including a dominating role played by sea breeze, vegetation having a positive effect on overnight UHI and urban fraction having a negative effect on UHI (Vahmani and Ban-Weiss 2016).
The crowdsourced data used in this study has provided a novel understanding of the complexity of Sydney’s urban climate, presenting a unique opportunity for infilling the measurements gaps across the city. However, crowdsourced data also presents certain shortcomings that require careful attention in data analysis.
Table 2 lists a combination of conditions in crowdsourced data collection that can be considered as a source of error, or indeed a “feature” where thermal environment is assessed in the immediate environment of city dwellers, focusing on exposure where people reside and occupy. The high spatial resolution is the key driver for the use of crowdsourcing, but often comes at the cost of uneven distribution of stations in cities, leading to spatial and socio-economic bias in the data. To avoid this, crowdsourced campaigns may be complemented with centralized efforts to place additional stations in areas of low representation, or a threshold of sensors may be required in each region to remove statistical outliers. Furthermore, collecting data in the proximity of where people live and occupy is key to understanding thermal exposure, which is more helpful for estimating health impacts and planning for future infrastructure. However, this also influences data collection due to the proximity of other heat-emitting materials such as nearby walls or buildings. Each of these difficulties must be addressed when assessing the data quality and interpreting the data as discussed in Quality Control.
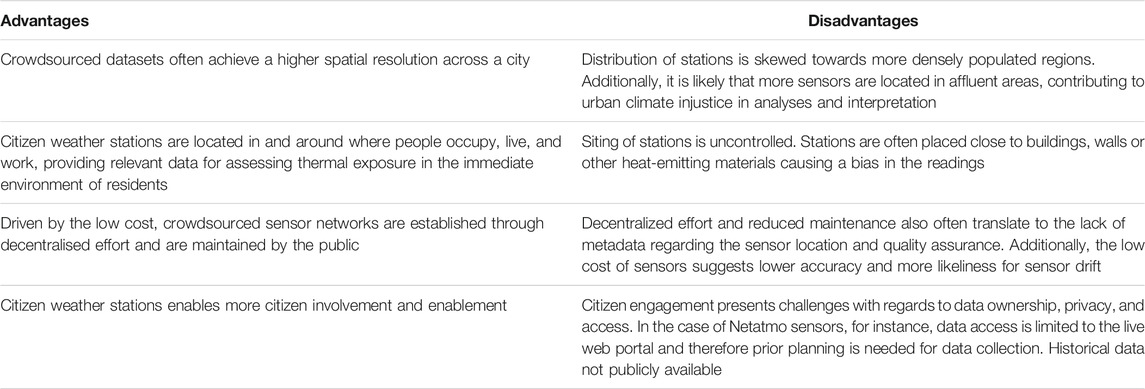
TABLE 2. Advantages and disadvantages of crowdsourced data.
The low cost of the sensors, which leads to higher number of measurement sites as well as citizen engagements, can further result in a lack of quality assurance, calibration, or testing, and since sensors are set up by the public, there is a lack of metadata. An understanding of how these stations may be sited is required to interpret the data. Additionally, more controlled-environment and long-term experiments can be planned, such that we fully quantify the uncertainties associated with low-cost weather stations.
Another key part of interpreting the crowdsourced data is understanding the local environment at each site. Various datasets describing urban characteristics can be overlayed with crowdsourced measurements, including the LCZ classifications that aim to represent urban form and fabric in a universal way. LCZ maps give an indication of the context of city in relation to other built environments worldwide, however, are not sufficient for identifying individual urban design characteristics that modify urban microclimate. Each LCZ represents a range in height, vegetation cover, sky view factor, and so forth, which provide limited comparison with regards to microclimate variabilities when evaluating one city with only a few dominant LCZ types. To address this, emerging high-resolution urban datasets can be used to describe surface cover and urban morphology. Overlaying such datasets with LCZ maps and crowdsourced measures assist in providing a better characterisation of each area more specific to a city and provide further insight into the influences on the urban microclimate.
In this study, we used quality controlled crowdsourced data from over 500 citizen weather stations to explore intra-urban variabilities in air temperature during a Sydney summer, totalling 2.3 million data points. Crowdsourcing has provided a higher spatial resolution climate dataset for Sydney which has allowed a clearer understanding of the local climate at a finer scale. Overlaying datasets and urban classifications (such as LCZs and building-level urban data) have been explored to identify the key drivers of intra-urban variability.
The key findings from this paper are:
• Crowdsourced air temperature data and the combination of land use and land cover data layers have provided novel insight into the air temperature distribution across a complex coastal city, by investigating the contribution of both geographic and urbanised influences on intra-urban variability in air temperature.
• The strongest impact on air temperature was distance from the coast causing an increase in diurnal temperature range at locations further inland.
• Intra-urban variability was observed both within LCZs and between different LCZs.
• Increasing building density and height resulted in a reduced diurnal temperature range, and increasing impervious fraction resulted in increased temperatures.
A comparison of crowdsourced data with reference data indicated that on warm days citizen weather stations continuously observed increased temperatures throughout the day, whereas on cool days the diurnal range of crowdsourced temperatures was smaller than that of reference stations. The crowdsourced overnight temperatures were higher for all stations across both warm and cool days. These differences are likely due to the siting of citizen weather stations closer to materials with high thermal inertia, solar radiation exposure, and in areas with decreased ventilation.
The impact of the sea breeze and moderating influence of the ocean has been identified by the difference in air temperature between the inland, central and coastal regions. This coastal effect dominated over all other impacts on local climate, and as such other possible influences on air temperature were compared considering distance from the coast. There was very little variability in the cool day maxima across all urban characteristics due to the increased cloud cover and precipitation on cool days. The significant impact of distance from the coast has been assessed by splitting the city into regions, however analysis of the coastal region still remains a challenge due to the varying effect of the sea breeze across this region. Further investigation into sea breeze flow is necessary to fully understand the urban climate in this area.
Crowdsourced data typically come with some limitations which require critical evaluation of the information collected. Despite the higher spatial resolution, not all regions are represented equally; the inner-city areas have a significantly higher number of stations than the outer areas due to a combination of cost and population density. To ensure the entire population is equally represented when using data such as this, it may be necessary to supplement with additional sensors in some areas.
Publicly available datasets were analyzed in this study. This data can be found here: Crowdsourced air temperature and humidity data were obtained from Netatmo “Smart Home Weather Stations” across Sydney. The sensors collect and display real-time weather data including temperature, humidity, and barometric pressure which, should the user agree, is displayed on the Netatmo Weathermap web portal (https://weathermap.netatmo.com). Historical data is not available; data for this study has been collected via quarter-hourly scraping of the Weathermap over Dec 2020–Feb 2021, leading to over two million air temperature readings collected.
NN and MH conceived of the presented idea. ML obtained the crowdsourced data through web scraping and provided processed land-use data with help from WM and KB. JP analysed the data and wrote the manuscript with support from NN, MH, ML, and GU.
This project is supported through funding from the Australian research council (arc) Centre of excellence for climate extremes (clex) (CE170100023). JP was funded on a CLEX undergraduate scholarship.
The authors declare that the research was conducted in the absence of any commercial or financial relationships that could be construed as a potential conflict of interest.
All claims expressed in this article are solely those of the authors and do not necessarily represent those of their affiliated organizations, or those of the publisher, the editors and the reviewers. Any product that may be evaluated in this article, or claim that may be made by its manufacturer, is not guaranteed or endorsed by the publisher.
Bartesaghi-Koc, C., Osmond, P., and Peters, A. (2019). Spatio-temporal Patterns in green Infrastructure as Driver of Land Surface Temperature Variability: The Case of Sydney. Int. J. Appl. Earth Observation Geoinformation 83, 101903. doi:10.1016/j.jag.2019.101903
Basara, J. B., Illston, B. G., Fiebrich, C. A., Browder, P. D., Morgan, C. R., McCombs, A., Bostic, J. P., McPherson, R. A., Schroeder, A. J., and Crawford, K. C. (2011). The Oklahoma City Micronet. Meteorol. Appl. 18 (3), 252–261. doi:10.1002/met.189
Battista, G., de Lieto Vollaro, E., Ocłoń, P., and Vallati, A. (2021). Effect of Mutual Radiative Exchange between the Surfaces of a Street canyon on the Building thermal Energy Demand. Energy 226, 120346. doi:10.1016/j.energy.2021.120346
Bechtel, B., Alexander, P., Böhner, J., Ching, J., Conrad, O., Feddema, J., Mills, G., See, L., and Stewart, I. (2015). Mapping Local Climate Zones for a Worldwide Database of the Form and Function of Cities. Ijgi 4 (1), 199–219. doi:10.3390/ijgi4010199
Benjamin, K. (2019). Crowdsourcing Urban Temperature Data for Building Energy and Human Health Estimation. Reading, UK: Masters thesis, University of Reading.
Bureau of Meteorology, (2021). Greater Sydney in Summer 2020-21: Cooler Than Recent Years’ Bureau of Meteorology, viewed 11/05/21, Available at: http://www.bom.gov.au/climate/current/season/nsw/sydney.shtml.
Bureau of Meteorology (1997). Observation Specification No. 2013.1: Guidelines for the Siting and Exposure of Meteorological Instruments and Observing Facilities. Available at: http://www.bom.gov.au/climate/cdo/about/observation_specification_2013.pdfAccessed August 20, 2021.
Chapman, L., Bell, C., and Bell, S. (2017). Can the Crowdsourcing Data Paradigm Take Atmospheric Science to a New Level? A Case Study of the Urban Heat Island of London Quantified Using Netatmo Weather Stations. Int. J. Climatol. 37 (9), 3597–3605. doi:10.1002/joc.4940
Ching, J., Mills, G., Bechtel, B., See, L., Feddema, J., Wang, X., Ren, C., Brousse, O., Martilli, A., Neophytou, M., Mouzourides, P., Stewart, I., Hanna, A., Ng, E., Foley, M., Alexander, P., Aliaga, D., Niyogi, D., Shreevastava, A., Bhalachandran, P., Masson, V., Hidalgo, J., Fung, J., Andrade, M., Baklanov, A., Dai, W., Milcinski, G., Demuzere, M., Brunsell, N., Pesaresi, M., Miao, S., Mu, Q., Chen, F., and Theeuwes, N. (2018). WUDAPT: An Urban Weather, Climate, and Environmental Modeling Infrastructure for the Anthropocene. Bull. Am. Meteorol. Soc. 99 (9), 1907–1924. doi:10.1175/bams-d-16-0236.1
Christen, A., Oke, T., Grimmond, S., Steyn, D., and Roth, M. (2013). 35 Years of Urban Climate Research at the 'Vancouver-Sunset' Flux tower. FluxLetter. doi:10.14288/1.0103588
Dean, A., and Green, D. (2018). Climate Change, Air Pollution and Human Health in Sydney, Australia: A Review of the Literature. Environ. Res. Lett. 13 (5), 053003. doi:10.1088/1748-9326/aac02a
Demuzere, M., Kittner, J., and Bechtel, B. (2021). LCZ Generator: A Web Application to Create Local Climate Zone Maps. Front. Environ. Sci. 9. doi:10.3389/fenvs.2021.637455
Fenner, D., Meier, F., Bechtel, B., Otto, M., and Scherer, D. (2017). Intra and Inter ‘local Climate Zone’variability of Air Temperature as Observed by Crowdsourced Citizen Weather Stations. Berlin, Germany: Technische Universität Berlin. doi:10.14279/depositonce-10378
Hirsch, A. L., Evans, J. P., Thomas, C., Conroy, B., Hart, M. A., Lipson, M., and Ertler, W. (2021). Resolving the Influence of Local Flows on Urban Heat Amplification during Heatwaves. Environ. Res. Lett. 16, 064066. doi:10.1088/1748-9326/ac0377
Jiang, N., Scorgie, Y., Hart, M., Riley, M. L., Crawford, J., Beggs, P. J., Edwards, G. C., Chang, L., Salter, D., and Virgilio, G. D. (2017). Visualising the Relationships between Synoptic Circulation Type and Air Quality in Sydney, a Subtropical Coastal-basin Environment. Int. J. Climatol. 37 (3), 1211–1228. doi:10.1002/joc.4770
Johansson, E. (2006). Influence of Urban Geometry on Outdoor thermal comfort in a Hot Dry Climate: A Study in Fez, Morocco. Building Environ. 41 (10), 1326–1338. doi:10.1016/j.buildenv.2005.05.022
Khan, H. S., Santamouris, M., Paolini, R., Caccetta, P., and Kassomenos, P. (2021). Analyzing the Local and Climatic Conditions Affecting the Urban Overheating Magnitude during the Heatwaves (HWs) in a Coastal City: A Case Study of the Greater Sydney Region. Sci. Total Environ. 755, 142515. doi:10.1016/j.scitotenv.2020.142515
Livada, I., Synnefa, A., Haddad, S., Paolini, R., Garshasbi, S., Ulpiani, G., Fiorito, F., Vassilakopoulou, K., Osmond, P., and Santamouris, M. (2019). Time Series Analysis of Ambient Air-Temperature during the Period 1970-2016 over Sydney, Australia. Sci. Total Environ. 648, 1627–1638. doi:10.1016/j.scitotenv.2018.08.144
Martilli, A., Krayenhoff, E. S., and Nazarian, N. (2020). Is the Urban Heat Island Intensity Relevant for Heat Mitigation Studies? Urban Clim. 31, 100541. doi:10.1016/j.uclim.2019.100541
Masson, V., Lemonsu, A., Hidalgo, J., and Voogt, J. (2020). Urban Climates and Climate Change. Annu. Rev. Environ. Resour. 45, 411–444. doi:10.1146/annurev-environ-012320-083623
Meier, F., Fenner, D., Grassmann, T., Otto, M., and Scherer, D. (2017). Crowdsourcing Air Temperature from Citizen Weather Stations for Urban Climate Research. Urban Clim. 19, 170–191. doi:10.1016/j.uclim.2017.01.006
Muller, C. L., Chapman, L., Grimmond, C. S. B., Young, D. T., and Cai, X. (2013). Sensors and the City: a Review of Urban Meteorological Networks. Int. J. Climatol. 33 (7), 1585–1600. doi:10.1002/joc.3678
Myint, S. W., Brazel, A., Okin, G., and Buyantuyev, A. (2010). Combined Effects of Impervious Surface and Vegetation Cover on Air Temperature Variations in a Rapidly Expanding Desert City. GIScience & Remote Sensing 47 (3), 301–320. doi:10.2747/1548-1603.47.3.301
Napoly, A., Grassmann, T., Meier, F., and Fenner, D. (2018). Development and Application of a Statistically-Based Quality Control for Crowdsourced Air Temperature Data. Front. Earth Sci. 6, 118. doi:10.3389/feart.2018.00118
Nazarian, N., and Kleissl, J. (2015). CFD Simulation of an Idealized Urban Environment: Thermal Effects of Geometrical Characteristics and Surface Materials. Urban Clim. 12 (June), 141–159. doi:10.1016/j.uclim.2015.03.002
Oke, T. R., Mills, G., Christen, A., and Voogt, J. A. (2017). Urban Climates. Cambridge University Press.
Oke, T. R. (1981). Canyon Geometry and the Nocturnal Urban Heat Island: Comparison of Scale Model and Field Observations. Cambridge, UK. J. Climatol. 1 (3), 237–254. doi:10.1002/joc.3370010304
Pantelic, J., Nazarian, N., Meggers, F., Lee, J. K. W., Miller, C., and Licinia, D. (2021). Transformational IoT Technologies for Air Quality and Thermal Comfort at the Urban, Building, and Human Scales. Berkeley, California, USA. Submitted to Sustainable Cities and Society.
Perkins, S. E., Alexander, L. V., and Nairn, J. R. (2012). Increasing Frequency, Intensity and Duration of Observed Global Heatwaves and Warm Spells. Geophys. Res. Lett. 39, 20. doi:10.1029/2012gl053361
Poutiainen, J., Saltikoff, E., Dabberdt, W. F., Koistinen, J., and Turtiainen, H. (2006). “December. Helsinki Testbed: A New Open Facility to Test Instrumentation Technology for Atmospheric Measurements,” in Extended Abstracts, WMO Technical Conf. On Meteorological and Environmental Instruments and Methods of Observation (P. 13 (Geneva, Switzerland: World Meteorological Society, Instruments and Observing Methods RepWMO/TD-1354).
PSMA Australia (2020). Geoscape Surface Cover (v1.6) and Buildings (v2.0) Datasets. Availble at: https://geoscape.com.au.
Rotach, M. W., Vogt, R., Bernhofer, C., Batchvarova, E., Christen, A., Clappier, A., Feddersen, B., Gryning, S. E., Martucci, G., Mayer, H., and Mitev, V. (2005). BUBBLE–an Urban Boundary Layer Meteorology Project. Theor. Appl. Climatology 81 (3), 231–261. doi:10.1007/s00704-004-0117-9
Rousseeuw, P. J., and Croux, C. (1993). Alternatives to the Median Absolute Deviation. J. Am. Stat. Assoc. 88 (424), 1273–1283. doi:10.1080/01621459.1993.10476408
Santamouris, M., Haddad, S., Fiorito, F., Osmond, P., Ding, L., Prasad, D., Zhai, X., and Wang, R. (2017). Urban Heat Island and Overheating Characteristics in Sydney, Australia. An Analysis of Multiyear Measurements. Sustainability 9 (5), 712. doi:10.3390/su9050712
Schroeder, J. L., Burgett, W. S., Haynie, K. B., Sonmez, I., Skwira, G. D., Doggett, A. L., and Lipe, J. W. (2005). The West Texas Mesonet: a Technical Overview. J. Atmos. Oceanic Techn. 22 (2), 211–222. doi:10.1175/jtech-1690.1
Sharifi, E., and Lehmann, S. (2014). Comparative Analysis of Surface Urban Heat Island Effect in central. Sydney: Canadian Center of Science and Education. Journal of Sustainable Development, 2014; 7 (3), 23–34.
Skarbit, N., Stewart, I. D., Unger, J., and Gál, T. (2017). Employing an Urban Meteorological Network to Monitor Air Temperature Conditions in the 'local Climate Zones' of Szeged, Hungary. Int. J. Climatol 37, 582–596. doi:10.1002/joc.5023
Stewart, I. D., and Oke, T. R. (2012). Local Climate Zones for Urban Temperature Studies. Bull. Am. Meteorol. Soc. 93 (12), 1879–1900. doi:10.1175/bams-d-11-00019.1
Vahmani, P., and Ban-Weiss, G. A. (2016). Impact of Remotely Sensed Albedo and Vegetation Fraction on Simulation of Urban Climate in WRF-Urban Canopy Model: A Case Study of the Urban Heat Island in Los Angeles. J. Geophys. Res. Atmos. 121 (4), 1511–1531. doi:10.1002/2015jd023718
Vaneckova, P., Hart, M. A., Beggs, P. J., and De Dear, R. J. (2008). Synoptic Analysis of Heat-Related Mortality in Sydney, Australia, 1993-2001. Int. J. Biometeorol. 52 (6), 439–451. doi:10.1007/s00484-007-0138-z
Varentsov, M. I., Konstantinov, P. I., Shartova, N. V., Samsonov, T. E., Kargashin, P. E., Varentsov, A. I., Fenner, D., and Meier, F. (2020). Urban Heat Island of the Moscow Megacity: the Long-Term Trends and New Approaches for Monitoring and Research Based on Crowdsourcing Data. IOP Conf. Ser. Earth Environ. Sci. 606, 1012063. doi:10.1088/1755-1315/606/1/012063
Varquez, A. C., and Kanda, M. (2018). Global Urban Climatology: a Meta-Analysis of Air Temperature Trends (1960–2009). npj Clim. Atmos. Sci. 1 (1), 1–8. doi:10.1038/s41612-018-0042-8
Venter, Z. S., Chakraborty, T., and Lee, X. (2021). Crowdsourced Air Temperatures Contrast Satellite Measures of the Urban Heat Island and its Mechanisms. Sci. Adv. 7 (22), eabb9569. doi:10.1126/sciadv.abb9569
Venter, Z. S., Brousse, O., Esau, I., and Meier, F. (2020). Hyperlocal Mapping of Urban Air Temperature Using Remote Sensing and Crowdsourced Weather Data. Remote Sensing Environ. 242, 111791. doi:10.1016/j.rse.2020.111791
Wang, K., Li, Y., Luo, Z., Yin, S., and Chan, P. W. (2018). Harmonic Analysis of 130-Year Hourly Air Temperature in Hong Kong: Detecting Urban Warming from the Perspective of Annual and Daily Cycles. Clim. Dyn. 51 (1–2July 1), 613–625. doi:10.1007/s00382-017-3944-y
Keywords: crowdsourcing, air temperature, urban microclimate, coastal cities, land use data, Sydney (Australia), local climate zones
Citation: Potgieter J, Nazarian N, Lipson MJ, Hart MA, Ulpiani G, Morrison W and Benjamin K (2021) Combining High-Resolution Land Use Data With Crowdsourced Air Temperature to Investigate Intra-Urban Microclimate. Front. Environ. Sci. 9:720323. doi: 10.3389/fenvs.2021.720323
Received: 04 June 2021; Accepted: 24 August 2021;
Published: 13 September 2021.
Edited by:
Christos H. Halios, Public Health England, United KingdomReviewed by:
Saumitra Mukherjee, Jawaharlal Nehru University, IndiaCopyright © 2021 Potgieter, Nazarian, Lipson, Hart, Ulpiani, Morrison and Benjamin. This is an open-access article distributed under the terms of the Creative Commons Attribution License (CC BY). The use, distribution or reproduction in other forums is permitted, provided the original author(s) and the copyright owner(s) are credited and that the original publication in this journal is cited, in accordance with accepted academic practice. No use, distribution or reproduction is permitted which does not comply with these terms.
*Correspondence: Negin Nazarian, bi5uYXphcmlhbkB1bnN3LmVkdS5hdQ==
Disclaimer: All claims expressed in this article are solely those of the authors and do not necessarily represent those of their affiliated organizations, or those of the publisher, the editors and the reviewers. Any product that may be evaluated in this article or claim that may be made by its manufacturer is not guaranteed or endorsed by the publisher.
Research integrity at Frontiers
Learn more about the work of our research integrity team to safeguard the quality of each article we publish.