
94% of researchers rate our articles as excellent or good
Learn more about the work of our research integrity team to safeguard the quality of each article we publish.
Find out more
METHODS article
Front. Environ. Sci., 19 July 2021
Sec. Toxicology, Pollution and the Environment
Volume 9 - 2021 | https://doi.org/10.3389/fenvs.2021.716516
This article is part of the Research TopicEarly Career Scientists' Contributions to River Plastic Monitoring Across ScalesView all 9 articles
 Louise Schreyers1*
 Tim van Emmerik1
 Thanh Luan Nguyen2
 Ngoc-Anh Phung3
 Thuy-Chung Kieu-Le3,4
 Evelien Castrop1Thanh-Khiet L. Bui5
 Emilie Strady6
 Sarian Kosten7Lauren Biermann8Sanne J.P. van den Berg9
 Martine van der Ploeg1
River plastic pollution is an environmental challenge of growing concern. However, there are still many unknowns related to the principal drivers of river plastic transport. Floating aquatic vegetation, such as water hyacinths, have been found to aggregate and carry large amounts of plastic debris in tropical river systems. Monitoring the entrapment of plastics in hyacinths is therefore crucial to answer the relevant scientific and societal questions. Long-term monitoring efforts are yet to be designed and implemented at large scale and various field measuring techniques can be applied. Here, we present a field guide on available methods that can be upscaled in space and time, to characterize macroplastic entrapment within floating vegetation. Five measurement techniques commonly used in plastic and vegetation monitoring were applied to the Saigon river, Vietnam. These included physical sampling, Unmanned Aerial Vehicle imagery, bridge imagery, visual counting, and satellite imagery. We compare these techniques based on their suitability to derive metrics of interest, their relevancy at different spatiotemporal scales and their benefits and drawbacks. This field guide can be used by practitioners and researchers to design future monitoring campaigns and to assess the suitability of each method to investigate specific aspects of macroplastic and floating vegetation interactions.
Plastic pollution threatens terrestrial, freshwater and marine life, and causes significant economic losses. Quantifying the amount of plastic entering the marine environment is crucial for implementing and assessing plastic reduction strategies. Rivers are assumed to be a major pathway for land-based plastic pollution transported towards the ocean, and river plastic emissions are estimated between 0.8 and 2.7 million tons of plastic per year (Meijer et al., 2021). Estimating the quantities of plastic emitted into the oceans is a challenging task and so far model-based estimates have large uncertainties (Lebreton et al., 2017). Several studies pointed out the need to improve the parametrization and calibration of large-scale models with in-situ measurements (González-Fernández and Hanke, 2017; van Emmerik et al., 2018; Meijer et al., 2021). Additional field measurement efforts could further improve our understanding of the drivers of riverine plastic transport and accumulation processes.
Research on riverine plastic highlighted that the quantities and composition of transported plastics vary geographically, temporally and along the water column (Liedermann et al., 2018; van Calcar and van Emmerik, 2019). However, the drivers of floating macroplastic transport in rivers remain unknown for most rivers in the world. This prompts for further investigation of the processes governing macroplastic propagation through rivers. In some rivers, hydrometeorological processes, such as river flow dynamics, change between seasons and extreme events are important drivers of plastic transport fluctuations (Hurley et al., 2018; van Emmerik et al., 2019a; van Emmerik et al., 2019b; Kurniawan and Imron, 2019). Yet, hydrometeorological factors are not solely responsible for riverine plastic transport (Roebroek et al., 2021). Studies focused on coastal ecosystems suggest that vegetation may act as a sink for plastic litter, but focus on coastal ecosystems, once the plastic has exited the river mouth (Brennan et al., 2018; Cozzolino et al., 2020; Ivar do Sul et al., 2014; Martin et al., 2019; Olivelli et al., 2020). The role of vegetation–such as floating aquatic weeds and riparian vegetation–along the river is understudied, despite recent evidence these accumulate and transport macroplastic (Schreyers al., 2021; van Emmerik et al., 2019a). Riverine vegetation could act as static accumulation sites and/or carriers of plastics into the ocean. Ultimately determining vegetation’s role requires testing (and possibly adapting) the current measurement techniques used to monitor riverine macroplastic accumulation and transport.
Recent findings indicate that, on average, close to 80% of all observed floating macroplastics in the Saigon river accumulate in water hyacinth beds (Schreyers et al., 2021a). Hyacinths are a floating aquatic weed that tend to form large patches (several meters of width and length) and in which important quantities of debris can get entrained (Figure 1). Water hyacinth is an invasive species present in many tropical freshwater systems (Hailu and Emana Getu, 2018), and it is very likely that floating macroplastic accumulates at large rates within water hyacinth patches in other rivers as well. For instance, the Chao Phraya river in Thailand has a high abundance in both water hyacinth coverage and plastic pollution concentrations (Ta and Babel, 2020; Kleinschroth et al., 2021). In addition, other plant species present in rivers may entrap and/or transport plastic too. This calls for further monitoring efforts on the role of water hyacinths as macroplastic carriers in rivers. Hence, it is necessary to develop practical and consistent methods for monitoring plastic entrapment in vegetation, in order to further study the role of water hyacinths in plastic transport dynamics.
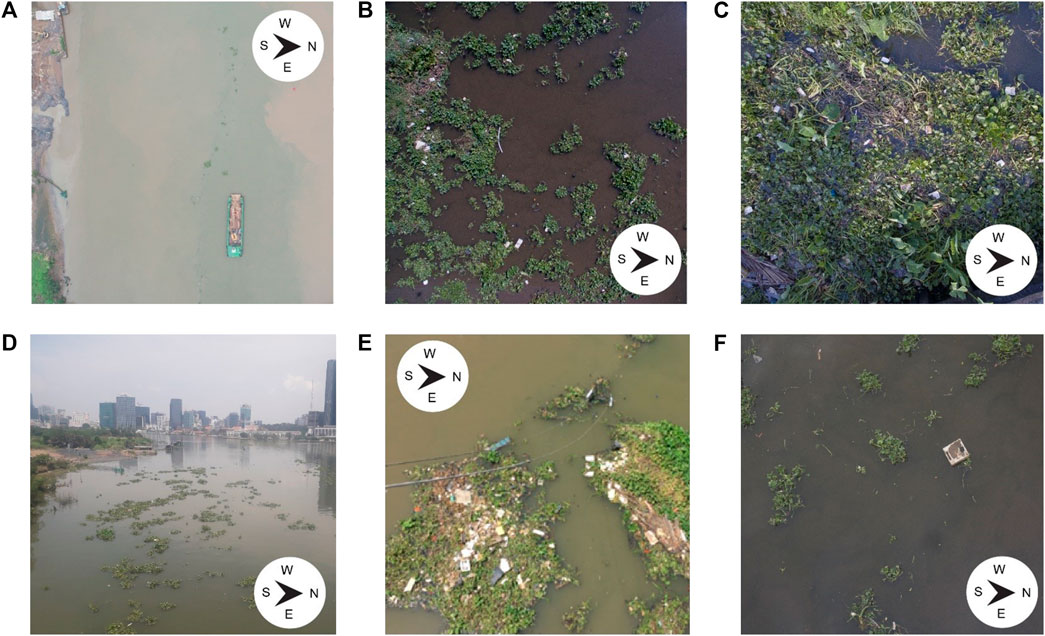
FIGURE 1. Photographs taken at Ho Chi Minh City, Vietnam. The upper figures show the UAV images taken at different altitudes. The lower figures show photographs taken from bridges, facing the river downstream, at approximately 15 m of altitude. (A) UAV image taken at approximately 60 m, showing the southern cross-section of the river. Patches of hyacinths are visible a few meters downstream (West) from the boat (B) Patches of different sizes clearly visible from the UAV image at an altitude of approximately 10 m. (C) A patch of water hyacinths visible from an altitude of less than 10 m. Plastic items are clearly visible. (D) Overview of the Saigon river. Large water hyacinths patches are visible on the forefront. (E) Large water hyacinths patches, many entangled plastic items are visible. (F) Individual water hyacinths, not aggregated in large patches and a free-floating debris.
Riverine macroplastic monitoring is a rapidly evolving field, utilizing a variety of measurement techniques, from low to high-tech and from in-situ to satellite imagery. Some of these methods have also recently been adapted to monitor floating hyacinth patches and the entrapment of plastic debris in hyacinths. For instance, visual counting and Unmanned Aerial Vehicle (UAV) imagery were previously used to characterize water hyacinths entrapment and transport over the Saigon river (Schreyers et al., 2021a). Physical sampling of plastic and hyacinths enabled to estimate the composition of the debris found and the mass of both debris and hyacinths (van Emmerik et al., 2019a). The detection of floating debris patches in coastal waters and the quantification of water hyacinths coverage over entire river systems is made possible by optical satellite imagery (Biermann et al., 2020; Kleinschroth et al., 2021). With growing understanding of the role of vegetation in plastic debris entrapment in rivers, various methods can be mobilized at different spatial and temporal scales, often complementing each other. Despite these initial monitoring efforts on macroplastic entrapment in hyacinths, long-term and large-scale monitoring plans are yet to be designed. These would require a better understanding of the suitability and relevancy of each monitoring technique, as well as their benefits and drawbacks.
Here, we present a field guide with measurement techniques to quantify and characterize macroplastic entrapment in floating water hyacinths. This field guide can be used by practitioners, local authorities or scientists for designing long-term monitoring campaigns on floating macroplastic in rivers. This is needed since water hyacinths were found to be an important sink and carrier for macroplastic in the Saigon river, and most likely play a similar key role in the transport and entrapment of debris in other tropical rivers. We adapted five measuring methods suitable to monitor the entrapment of plastics within hyacinth patches (visual counting, UAV imagery, bridge imagery, physical sampling, and satellite imagery). These methods were tested nearly simultaneously during a campaign conducted at the Saigon river and we show which insights they provide on quantifying macroplastic entrapment in hyacinths. We discuss the benefits, limitations and practical considerations of these various measuring techniques, from low to high-tech and from in-situ to satellite imagery. This is useful for designing a suitable monitoring strategy as the field guide provides an overview of the possible options available. To determine what (combination of) measuring methods to choose, we present 1) the main metrics that can be derived from each method 2) the relevancy of each method at different spatial scales, and 3) the benefits and drawbacks of each technique, through a Strengths, Weaknesses, Opportunities, and Threats (SWOT) analysis. The goal of this practical field guide is to help designing long-term monitoring campaigns on plastic entrapment in floating aquatic vegetation.
In this section, we present the five measuring methods that were adapted to monitor the role of water hyacinths in macroplastic entrapment and transport. We first provide an overview of the measuring techniques used (Figure 2). We summarize the data preparation and processing steps necessary to derive the outputs presented, for each method. This overview can be beneficial for a first understanding of the metrics that can be derived by each measuring technique and get a sense of the time, effort and resources required for the data collection and analysis. Practical considerations on how to use the various measuring methods are further explained in the text, with a dedicated sub-section for each method. There, we first provide a general description of the technique–including different options in the measurement set-up–and then detail how we adapted these methods for the field measurements at the Saigon river.
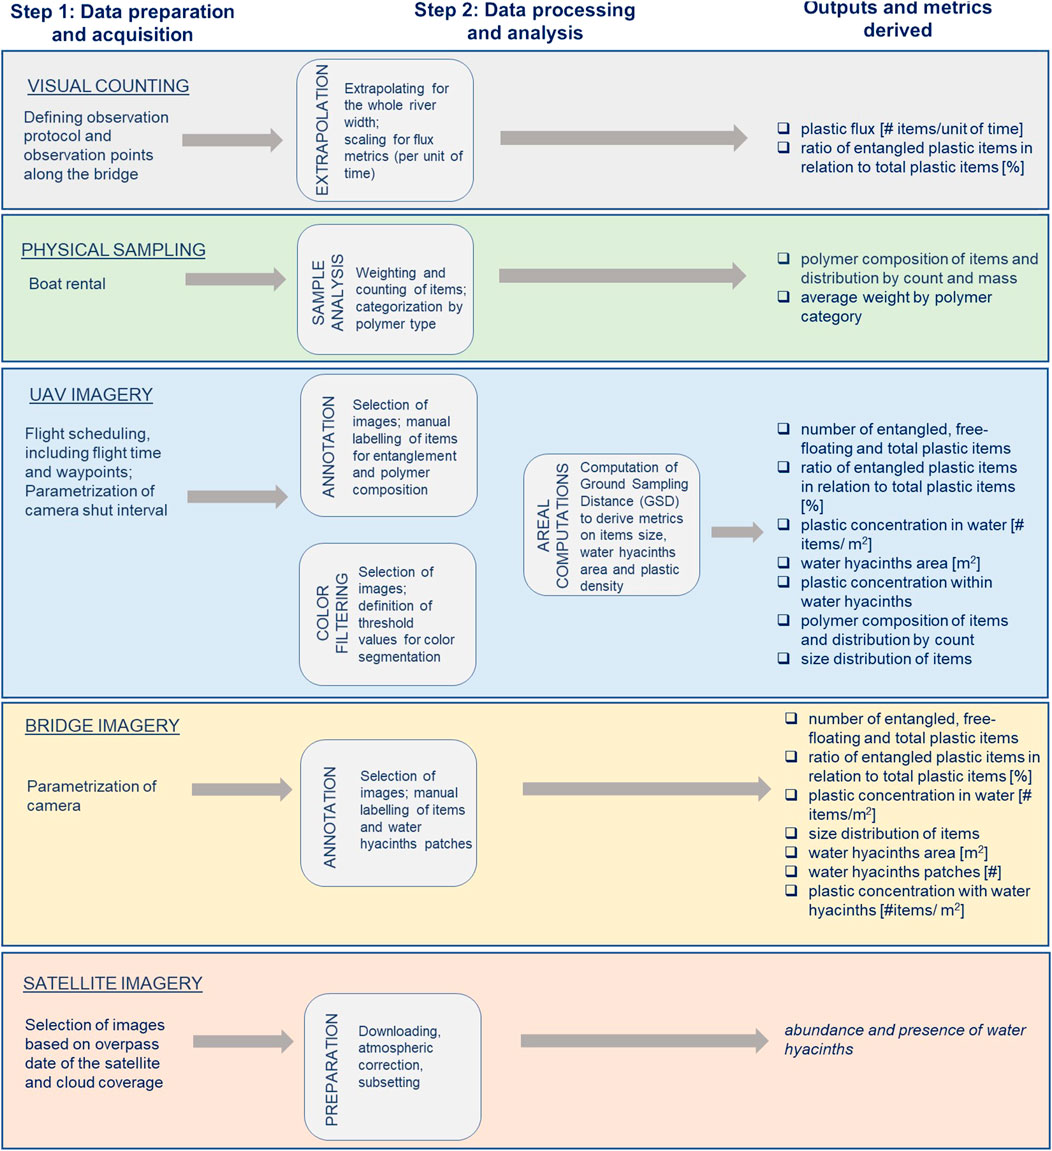
FIGURE 2. Flowchart illustrating and summarizing steps required for deriving metrics on water hyacinths distribution, macroplastic transport, macroplastic entrapment in water hyacinths and plastic items characteristics.
The field campaign was conducted in Ho Chi Minh City (HCMC), Vietnam's most populated city. The Saigon river runs through the city and joins the Dong Nai river a few kilometers downstream from HCMC. All field measurements were done in an area close to the Thu Thiem bridge. Several factors determined the choice of this site, such as the accessibility to the riverbank in that area (required for UAV surveys and for the physical sampling) and the presence of a bridge on which it is safe for surveyors to stand (used for visual observations) and not too height to allow plastic item detection. This site has been used for river plastic monitoring extensively since 2018, including studies focused on the development of new methods to monitor macroplastic transport (van Emmerik et al., 2018; van Emmerik et al., 2019a) and to monitor the role of water hyacinths in macroplastic transport (Schreyers et al., 2021a).
Given that flow velocity and tidal dynamics could also influence macroplastic flux and plastic cross-sectional concentrations (Haberstroh et al., 2021; van Calcar and van Emmerik, 2019), these were also characterized during the field campaign. Ultimately, flow velocity is a key metric to understand transport dynamics in rivers, including plastic debris movements. Each visual counting measure was accompanied by an estimate of the flow velocity using the ‘Pooh Sticks’ method (Bull and Lawler, 1991). The tidal regime was also noted during the visual observations.
Macroplastic flux measurements can be conducted using the visual counting method (van Emmerik et al., 2019a). This method consists of counting the number of macroplastic items visible at the water surface and flowing downstream for a specified duration from a bridge. For large rivers, several observations points are usually defined along a bridge due to the influence of local hydrodynamic conditions across the river (van Emmerik et al., 2019a). In order to monitor the plastic flux of items entrapped in hyacinth mats and free-floating items, this method can follow the protocol elaborated in Schreyers et al. (Schreyers et al., 2021b). For a determined duration, the surveyor can count at one observation point all plastic items visible within floating water hyacinths. Immediately after, plastic litter outside the hyacinths can be counted for same duration. The surveyor then moves to the next observation point and repeats the counting. Alternatively, simultaneous counting of plastic items within and outside hyacinths can be done at one observation point by two surveyors. In this case, one surveyor counts all plastic litter visible inside hyacinth patches, while at the same time a second surveyor counts the number of items found outside the hyacinth patches at the same observation point. This second option in the visual option protocol could help in reducing the variation in results due to a time difference. The measurement duration can be adapted depending on the flow velocity. In low discharge conditions, measurements of 5–20 min might be necessary (Vriend et al., 2020b), whereas for higher plastic fluxes, measurements typically last 2 min. The number of observation points along a bridge can be adapted, depending on the river width. Ideally, the observation points are equally distant from each other and enable to cover most of the river width. It is estimated that at each observation point, the surveyor is able to see 15 m of the river width.
For the Saigon river in-situ survey, the visual counting was done by one surveyor, with two subsequent measures of plastic items for each observation point. The observations were conducted from the Thu Thiem bridge on the May 23, 2020, between 6:45 and 16:15. The bridge was on average 14.6 m above the water level. The measures were made at 11 observation points along the bridge. Covering all the bridge observation points took 50 min to 1 h 30, depending on the time dedicated to taking photographs, as well as breaks. Over the whole day, five sets of observations were made for the 11 observations points. Subsequent data analysis included extrapolation of plastic flux for the entire river width and conversion to obtain flux values (Figure 2). More information can be found on Supplementary Text 1.
The plastic composition and mass of items can be measured via active sampling. Using a boat, surveyors retrieve samples of floating hyacinths at the water surface. Sampling of free-floating items can also be taken, using for instance trawls or mantra nets. The samples are then taken to a laboratory for further analysis. There, the wet mass of each hyacinth and/or plastic sample is measured. For the hyacinth samples, the patches area can be computed by dividing the total hyacinth mass by the average plant biomass per m2.
In the laboratory, anthropogenic debris are taken apart from the vegetation. The debris are then dried either by air or using an oven. Air-drying is preferable when the samples are large. The dried items can be sorted and counted by categories. The categorization method depends on the research objectives and resources available. A simple categorization method would separate plastic items from non-plastic debris (such as glass, textile, metal or rubber). More detailed categorization include the grouping of items per polymer category or their classification by item identification, for instance following the River-OSPAR litter categorization (Vriend et al., 2020a). Following their classification, items are weighted in order to retrieve dry mass statistics. The weighting can be done separately for each item or for an entire category group. Additional measures can include the measurement of the size of plastic items, or a qualitative indication on the level of degradation and fragmentation of each item.
At the Saigon river, a team of two surveyors collected 16 samples of water hyacinths of approximately 1 m2, using a boat close to the Thu Thiem bridge. The samples were taken on the May 23, 2020, between 7:30 and 15:00. No samples of free-floating items were taken during this measurement campaign. The subsequent mass and count measurements were conducted at the Asian Water Research Center (CARE) laboratory in Ho Chi Minh City. For each sample, the wet mass of hyacinths was weighted. Hyacinth patches areas were then calculated based on the wet mass of hyacinths and the plant biomass. Existing literature indicated an average wet water hyacinth biomass of 15–30 kg for 1 m2 (Reddy & Sutton, 1984). The plastic items were air-dried, then sorted and counted by plastic categories (Vriend et al., 2020b). Six plastic categories were retained: polystyrene (PS), expanded polystyrene (EPS), polyethylene terephthalate (PET), soft polyolefins (PO soft), hard polyolefins (PO hard) and other plastics (Rest). The weighting of the plastic items was determined by plastic group. These measures enabled to derive metrics on the plastic concentration within hyacinth patches (Figure 2).
UAVs can be used for riverine monitoring of both plastics and hyacinths distribution. UAV surveys can be conducted along riverbanks or transecting the river. The latter enables to detail the distribution and variability of plastic items and hyacinths at a river cross-section. To minimize human errors, it is preferred to program the flights automatically, using an app such as Litchi (VC Technology Ltd.) or DJI GO 4 (DJI Technology Co., Ltd.), rather than flying the UAV manually. These applications enable to define flight parameters such as the elevation, speed, path, number and location of hovering waypoints along the path, as well as set-up the camera, including its orientation angle and mode of acquisition of images. Recent applications of UAV surveys show that a flying elevation comprised between 4 and 6 m above the water level enables to distinguish macroplastic items (Geraeds et al., 2019). Other considerations such as the presence of trees, buildings or fences along the riverbanks are also important for defining the flying elevation. To avoid orthorectification of the images in post-processing, it is recommended to set-up the gimbal angle of the camera at 90°. Several flights can be conducted at the same river cross-sections, due to the possibility to set-up flights in automatic mode. The flights can be programmed with a “stop and go” modality, in order to take several pictures at each predefined waypoint and to allow time for the device stabilization.
We conducted ten UAV flights upstream and downstream to Thu Thiem bridge, on May 23, 2020. The flights conducted during the ebb tide crossed the river 100 m downstream of the bridge (n = 4), those conducted during the flood tide at 80 m upstream (n = 6). A DJI Phantom four Pro UAV (DJI, Shenzhen, China; http://www.dji.com) and its 20 megapixels standard integrated sensor was used for RGB image acquisition. Each UAV flight crossed the river perpendicularly to the water flow, at an elevation of approximately 5 m above the water level. This flying elevation was chosen because it optimizes the number of pixels in the images and still allows to identify plastic categories. Field measurements that only seek to count the number of items, without categorizing them into plastic types, might prefer a higher elevation of approximately 7–10 m above the water level. A total of 22 waypoints were determined for the entire river width (approximately 320 m), and the UAV hovered for 14 s at each waypoint.
A total of 3,936 images were taken during these ten UAV surveys. Some images were discarded because they were blurry (n = 261). All duplicates were removed (n = 3,547) and we ultimately used only the best images taken at each waypoint (n = 128). An online annotation tool, the Visual Geometry Group Image Annotator (VIA), was used to manually label items by plastic category and to indicate whether items were entangled in hyacinths or not. The plastic categories were the same used for the physical sampling. Rectangular-shaped bounding boxes were drawn around each identified item, which allowed to estimate the size of plastic debris. In addition to plastic identification, the UAV image collection also enabled to inform water hyacinths coverage and distribution across the river cross-section. To estimate the surface covered by the floating hyacinths, we used the Open CV library in Python. Only images with visible water hyacinths were retained for analysis (n = 75). The presence of hyacinth patches was assessed through visual examination of the UAV image collection. The Open CV library was used to discriminate pixels with water hyacinths using color segmentation functions. The color filtering can discriminate pixels with a specific color, using the RGB values of each image. A mask to select green areas of floating vegetation was created and defined by thresholds in the RGB space. The upper and lower threshold values were adjusted by trials and errors for small subsequent group of images, due to differences in background reflectance among the entire UAV image collection. More information can be found on Supplementary Materials (Supplementary text 2; Supplementary Figures 1, 2; Supplementary Table 2).
Photographs taken from bridges can also provide information on the plastic entrapment profile across the river and on water hyacinths distribution. Using camera photographs from bridges to take snapshots of the river surfaces makes it possible to detect floating macroplastic items and water hyacinth patches. The identification of plastic debris and vegetation can then be done either automatically or manually. The automatic detection presents certain challenges, especially considering the presence of water hyacinths which adds complexity for object detection and image processing.
The photographs were taken from the Thu Thiem bridge on the May 23, 2020, at an altitude comprised between 12 and 15.9 m, depending on the varying water level throughout the day. The photographs were taken nearly simultaneously with the visual counting measurements, at the same 11 observation points. A Samsung camera (SM-J330G, samsung.com, South Korea) was used to take the pictures. The camera was held by hand without a stabilization device, which resulted in some blurry images. The photographs were captured just after the visual counting measurements were completed at each observation point. Typically, one to four photographs of the river surface were taken after each measurement. The surveyor faced the river downstream with the camera oriented perpendicular to the water flow during the ebb tide. During the flood tide, the surveyor took photographs facing upstream. In total, 139 photographs were taken.
From the total image collection, 83 photographs were used for the detection of plastic debris and hyacinth patches. Images discarded (n = 57) were either too blurry for identifying items or did not have hyacinths nor plastic items on them. The images were uploaded into the VIA online annotation tool. Plastic items were identified and rectangular shaped bounding boxes drawn around these elements. The annotation tool enabled to specify if plastic items were entangled in patches or freely floating in the open water. The categorization of items by polymer type was not possible due to poor visibility. The estimates of hyacinth patches areas were also done using bounding boxes. This method was preferred over the color segmentation approach used for the UAV imagery, because the lower quality (low contrast, presence of blurry images) of the bridge imagery dataset did not enable easy filtration of vegetation pixels. In addition, the bounding box method has the advantage of providing information about the average hyacinth patch sizes and the number of patches observed.
Field measurement techniques enable to precisely map the water hyacinths area at a river cross-section; but cannot give a synoptic view of the water hyacinths distribution and abundance for a river system. Satellite imagery, on the other hand, can cover part or even an entire river system. Mapping the distribution of water hyacinths is possible due to the distinct spectral signals of the aquatic vegetation compared to the surrounding water (Figure 3). The distinction between water hyacinth and terrestrial riverbank vegetation can prove challenging due to similarities in their spectral information and thus requires an exact delineation of the river edge, for instance by masking the water area on a satellite scene with low water hyacinth presence.
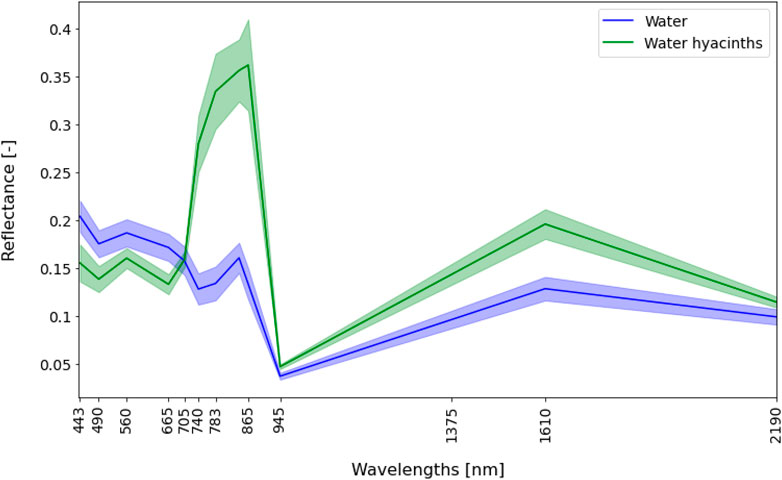
FIGURE 3. Mean spectral signatures of water hyacinths (n = 26) and water (n = 12) from the Sentinel-2 images taken on May 22, 2020. The x-axis shows the Sentinel-2 MSI spectral range from visible blue light at 490 nm, to short-wave infrared light at 2,190 nm. The y-axis shows remote sensing reflectance (unitless) from Sentinel-2 for water hyacinths and water for selected pins.
Water hyacinths, as other types of vegetation, show a high reflectance peak in the NIR wavelengths of light (∼850 nm), and absorption in the red (∼660 nm). Water, on the other hand, reflects highly in the green spectrum of light (∼560) and absorbs in the vegetation-red edge bands (∼705 and 740). Water pixels also show a peak in the NIR, which could be due to high loads of sediment in the water and/or eutrophication. Satellite remote sensing can be an effective technique to collect high quality and standardized optical scenes for the detection of floating aquatic vegetation (Dogliotti et al., 2018; Schreyers et al., 2021b)
We used a Sentinel-2 imagery scene to qualify the spatial distribution of water hyacinths in the Saigon river. A satellite image was captured over the Saigon river on the May 22, 2020 by the Sentinel-2A multispectral sensor at 3:05:51 UTC time, corresponding to 10:05:51 local time. This was the closest available Sentinel-2 scene by date from the field measurements, all conducted the day after, on May 23, 2020. The Sentinel-2A/MSI (S2A) Level 1C files were retrieved from the European Space Agency (ESA) Copernicus Open Access Hub (https://scihub.copernicus.eu). and processed for atmospheric correction on the ESA software Sentinel Application Platform (SNAP), version 8.0. Atmospheric correction was applied to the Level-1C image to generate a Level-2 scene, using the Sen2Cor 280 processor. Further, the image was resampled to 10 m spatial resolution and cropped for a region of interest focusing on the Saigon river area, to reduce the scene size and the processing time. A false color composite was generated to visually examine areas of water hyacinths accumulation. The imagery covers approximately 69 km of the total 225 km of river length of the Saigon river—31% of its total length.
In order to orient the choice of the best (combination) of measuring methods to choose for future monitoring campaign, we conducted a Strengths, Weaknesses, Opportunities, and Threats (SWOT) analysis (Menon et al., 1999). This type of analysis comes from an interdisciplinary approach and is useful to identify challenges and factors that can influence the set-up of a monitoring strategy. The goal of this type of analysis is to identify the main strengths, weaknesses, opportunities, and threats of the system under consideration. Overall, a SWOT analysis helps the identification of strengths and weaknesses of future riverine plastic and vegetation monitoring strategy to achieve its goals, pinpointing to specific benefits and drawbacks of each technique.
The methods described provide unique insights on four key aspects of plastic entrapment in water hyacinths: 1) plastic transport and entrapment within water hyacinths, 2) plastic items characteristics 3) water hyacinths spatial distribution 4) hydrological influences on spatiotemporal plastic entrapment in hyacinths. The results of the field monitoring campaign at the Saigon river on these four aspects and their respective sub-elements are hereby presented and discussed. Our scope is to present the level of information that each measuring technique can bring on the abovementioned four aspects.
Secondly, we provide a broader overview for designing a monitoring strategy, to ultimately determine what (combination of) measuring methods to choose. The combination of metrics of interest and measuring technique is first discussed. Secondly, we examine the relevancy of each technique at different spatiotemporal scales. Lastly, the overall benefits and drawbacks of each technique are detailed with a SWOT analysis.
The UAV imagery, visual counting and bridge imagery techniques register similar proportions of floating macroplastics entrapped in water hyacinths: on average, 39, 45 and 51% of items was found entangled, respectively. These three field measurement techniques indicate a statistically significant (p < 0.05) and very high positive correlation between entangled items and total floating macroplastics (Figure 4). This demonstrates that water hyacinths entrap a significant portion of the total floating macroplastic fluxes in the Saigon river. The good agreement between the three measuring techniques is also an indication of their validity in characterizing the entanglement of floating macroplastic in hyacinths.
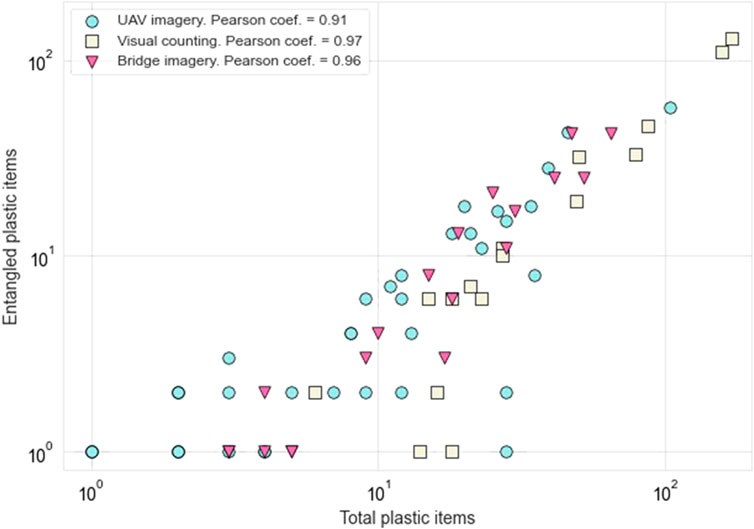
FIGURE 4. Entangled plastic items in relation to total floating macroplastics as observed in the Saigon river near Thu Thiem bridge. Each point corresponds to one observation (i.e., one visual counting measurement, one camera photograph and one UAV image). Note the logarithm scale for both axes.
The plastic concentration in hyacinths derived from the UAV imagery is double than the estimate from the bridge imagery dataset (Table 1). The physical sampling found a plastic concentration comprised between 17 and 34 items per m2 of vegetation, one order of magnitude higher than the imagery based values. The higher concentration value found by the UAV imagery when compared with the bridge imagery is a likely result of UAV higher resolution due to shorter distance between the sensor and the river surface. This higher concentration range found with the samples is the likely result of the specificity of the physical sampling method, where entire hyacinths patches were retrieved and analyzed. As a result, submerged and small plastic particles were also counted and weighted, contrary to the imagery datasets. Considering that the hyacinth roots can be over 1 m long, plastic debris may get entangled in the rhizosphere. Thus, the higher plastic concentration found by the physical sampling technique might be the result of entrapment mechanisms of plastic in the submerged part of hyacinths. Further studies are needed to better understand the role of hyacinth roots in entrapping plastic debris.
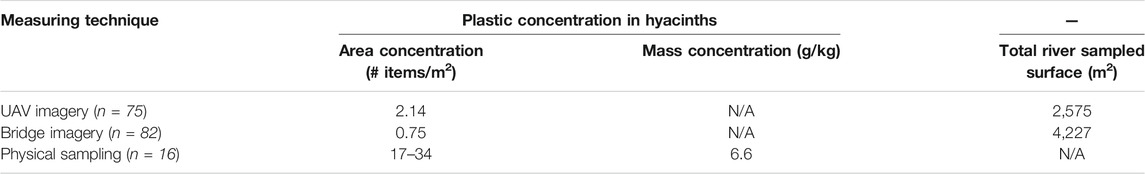
TABLE 1. Plastic concentration in hyacinth patches. The concentrations are all mean values. The physical sampling area concentration is expressed as a range, as it considers the range of 15–30 kg of wet water biomass for 1 m2 of hyacinth area (see Methods section).
In addition, the physical sampling enabled to derive metrics on the mass concentration of plastic items within hyacinths. A total of 380 kg of wet hyacinths biomass were sampled, and 2.1 kg of plastic were found, which indicates a mean mass concentration of 6.6 g of dry plastic per kg of wet hyacinth biomass.
We compared the spatiotemporal variability throughout the measurement day of floating macroplastic concentrations and flux, derived respectively from the UAV imagery and the visual counting techniques (Figure 5). Floating macroplastic concentrations and fluxes vary along the river width, ranging between 0.05 and 23.7 items/m2 and between 0.00 and 42.8 items/min, respectively. Some similarities are noticeable between the two datasets analyzed. The results of visual counting and the UAV imagery indicate that high fractions (above 45%) of entrapped plastics were registered in the first 50 m from the northern riverbank and at 240 m. Both measurement techniques also registered low ratios of entrapment, plastic concentrations and flux in the river sections comprised between 100–150 and 300–350 m. However, many differences are also noticeable, with high macroplastic fluxes not necessarily corresponding to high plastic concentrations, and vice-versa. This was observed for instance at 10 h., at 50 m from the northern riverbank, where a flux of macroplastic as high as 42.8 items/min was measured, but concentrations were only of approximately 1 item/m2 of surface. Several factors may account for this discrepancy between the plastic flux and the plastic concentration in water.
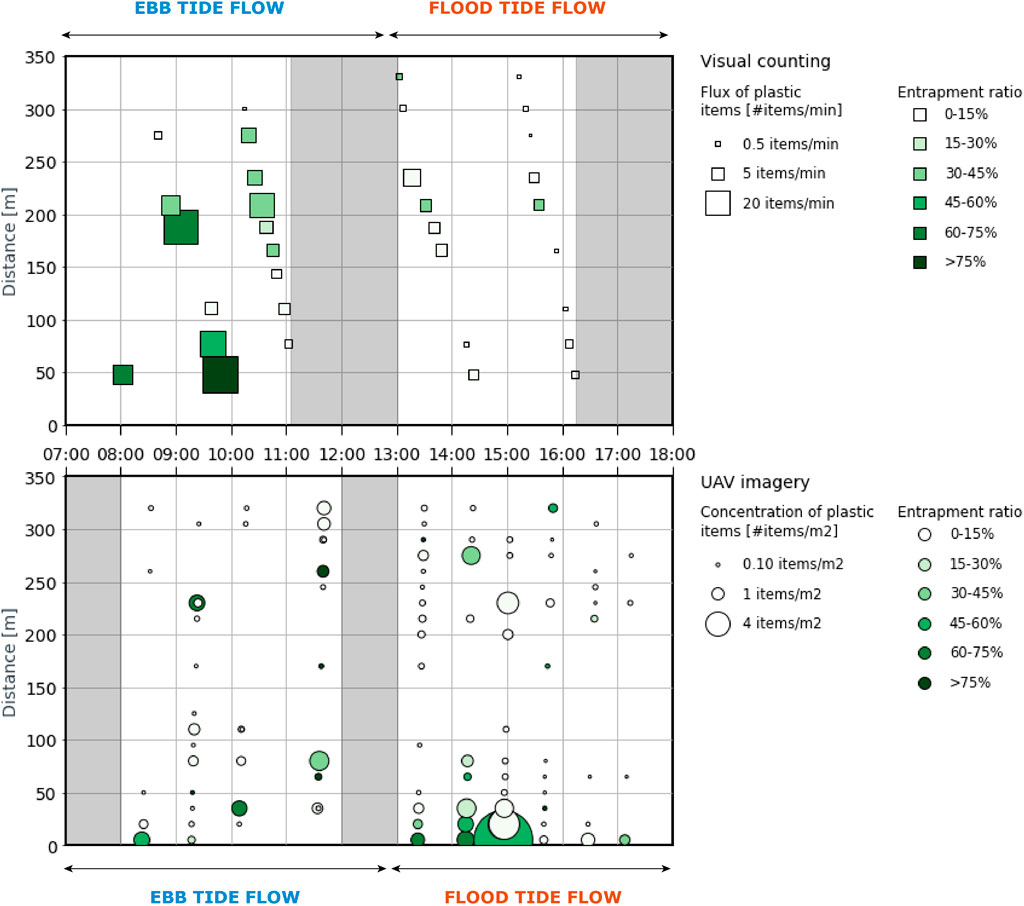
FIGURE 5. Spatiotemporal distribution of macroplastic concentration and entrapment ratios on May 23, 2020 at Thu Thiem. Each point/square corresponds to one observation. The greyed areas represent period where no measurements were conducted due to breaks. The distance is calculated using the northern riverbank as the origin. It should be noted that the flux of plastic items during ebb tide is seaward and landward during flood tide.
Firstly, the observations from the visual counting and the UAV imagery do not strictly coincide in location and time. Hence, the noted discrepancies could indicate rapid changes in plastic transport and entrapment between the observations, even when relatively close in time and space. For instance, the first 50 m of the river were not monitored through visual counting, whereas three waypoints with the UAV track enabled to detect plastic close to the northern riverbank of the Saigon river. Conversely, the UAV imagery could have missed for instance a water hyacinth patch that was captured by the visual counting technique. Secondly, the UAV flights were conducted at 5 m of elevation approximately, three times lower than the elevation of the bridge. This resulted in a much higher visibility of the plastic items, which was also enhanced by the possibility to zoom in on the images when manually labelling the items. The UAV imagery allows to spot debris that might be otherwise missed when counting macroplastic items from the Thu Thiem bridge. Following this explanation, the visual counting technique might thus underestimate the overall macroplastic flux. Thirdly, another possible factor pertains to the nature of the measurements undertaken. The UAV imagery technique takes ‘snapshots’ of the macroplastic concentrations, thus not capturing the propagation of such plastic concentrations depending on their flux, contrary to the visual counting technique. A segment of the river with high macroplastic flux could register low concentration of items per m2 at the water surface, and vice-versa in the case of a slow streamflow. It is likely that this phenomenon is registered close to the riverbanks, where the flow velocity is lower. In the first 50 m of the river, high plastic concentrations were found, and visual examination of the images confirms the presence of accumulation zones of hyacinths and debris very close to the northern riverbank. These considerations are an argument in favor of combining several monitoring methods rather than favoring one. In Exploring hydrological influences on spatiotemporal plastic entrapment variability. we will further discuss the role of stream flow velocity in plastic transport and entrapment across the river section.
Figure 6 presents the composition of plastic items entrapped in hyacinths, based on the physical sampling and the UAV imagery. Expanded polystyrene (EPS) was the most abundant type found overall: 48% based on the UAV imagery, 63% for the physical sampling. Items made of EPS easily fragment, possibly explaining the higher proportion of these items found in the collected sample. PET (polyethylene terephthalate) items were the least found polymer type, in the same proportion for both methods (1.6%). PET items are easy to identify, due to the relative large size of these items (usually above 15 cm) and are often distinct in shape (plastic bottles), even with an aerial view and entrapped in floating vegetation. PO soft (soft polyolefins) debris–bags, foils and PO hard (hard polyolefins)—such as lids and toys–were also found in similar proportions among both methods (PO soft: 9 and 8%, PO hard: 10 and 8% for physical sampling and UAV imagery).
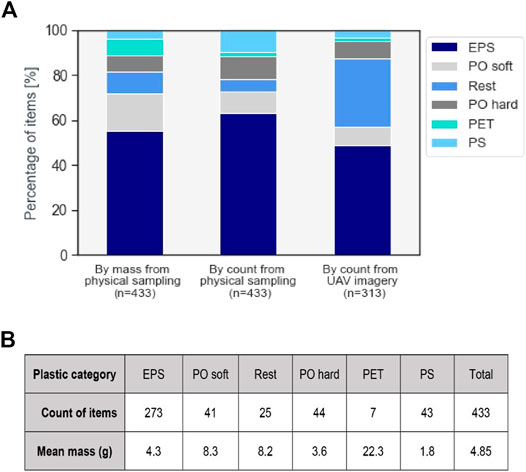
FIGURE 6. (A) Plastic categories of observed items from physical sampling and UAV imagery analysis. Expanded polystyrene (EPS), soft polyolefins (PO soft), other plastics (Rest), hard polyolefins (PO hard), polyethylene terephthalate (PET), and polystyrene (PS). (B) Mean masses of plastic items derived from the physical sampling.
The category 'Rest' is found in considerably higher proportions for the UAV imagery based analysis than the physical sampling (30 and 6%, respectively). The item classification from the physical sampling yields more accurate and reliable results, since it is done through close visualization and physical handling. The high proportion of “Rest” items found by the UAV imagery analysis could be the result of this higher level of inaccuracy for characterizing plastic categories with this method. Items that were unclear (blurry, no shape or dominant material could be identified, partially hidden by vegetation, glare reflection affecting their visibility, etc.) were automatically attributed this label. Also, the physical sampling dataset only reflects the composition of items at the sampling sites, whereas the UAV imagery enables to cover the entire river width. This time and space mismatch in datasets could also explain the discrepancy noted in the proportion of “Rest” items. Lastly, PS (polystyrene) items are found in considerably higher proportion by the physical sampling (10%) than UAV imagery (3%). Several PS items were probably categorized as “Rest” through manual labelling.
The physical sampling method is the only measurement technique that enables to directly derive statistics on the mass of plastic items (Figure 6B). PET items are the heaviest found, at 22.3 g on average per item. This is the result of the larger size of these items and the fact that they were often found unfragmented. EPS and PS items were, on the contrary, more often found fragmented.
The UAV and bridge imagery datasets enabled to estimate the size of each identified plastic item (Figure 7). Almost all items identified on images taken from the bridge are above 5 cm of size, both for the entangled and free-floating items (respectively, 94 and 86% of the total count of items). Very few items were detected below 2.5 cm (n = 2), none of which were smaller than 1 cm of size. For the UAV imagery, only 33% of entangled items are above 5 cm, and 25% of free-floating. Both methods show that hyacinths aggregate larger items than otherwise freely observed in the river. The UAV surveys found that items larger than 2.5 cm were more frequently entrapped than not. The bridge imagery shows a similar pattern for items larger than 5 cm, except for the largest objects (above 50 cm of size). However, very few items above 50 cm of size (n = 3 for the bridge imagery, n = 0 for the UAV imagery) were found.
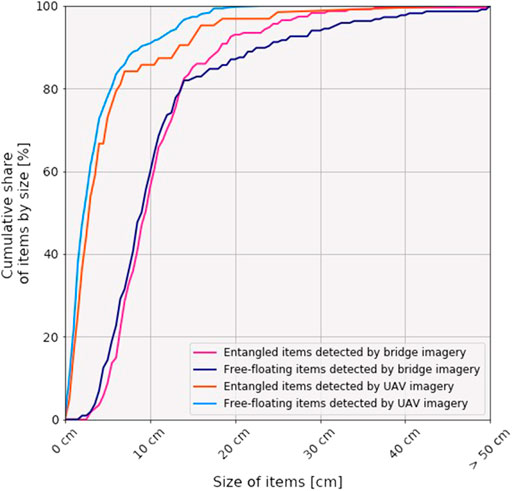
FIGURE 7. Size distribution of plastic items from the bridge (n = 444) and UAV imagery (n = 359).
The UAV images were taken at a lower altitude (approximately 5 m) compared to the images taken from the bridge (between 12 and 15.9 m), allowing to better detect small items. As a result, the spatial resolution for the UAV images is three times higher (0.1 cm/pixel on average) than for the bridge imagery (0.3 cm/pixel on average). The lower quality of the camera used from the bridge and the absence of stabilization devise also explain that items below 5 cm of size were not found abundantly with this method. Plastic items below 2 cm of size were not spotted at all by the bridge imagery dataset, whereas the UAV images detected items as small as 0.23 cm.
The bridge imagery found that hyacinth patches had a median area of 0.29 m2. Almost all (97%) hyacinth patches found were smaller than 5 m2, accounting for 63% of the total hyacinth area found (Figure 8). The visual examination of the bridge photographs shows that the hyacinth patches were often adjacent to each other.
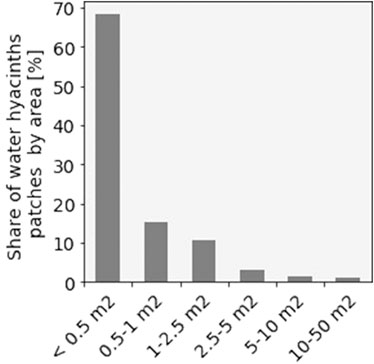
FIGURE 8. Area distribution of water hyacinths patches from the imagery (n = 369) taken at the Thu Thiem bridge.
Analyzing both the UAV and bridge images enabled to estimate the water hyacinths area (Table 2). The total area of water hyacinth patches based on UAV images (111 m2 during entire observing period) was a bit over one-third of that assessed based on the bridge images (305 m2). This discrepancy can be explained by the fact that 2-3 images were taken at the same observation point on the bridge (one after the other), whereas overlapping images with presence of water hyacinths were less frequently found in the UAV imagery dataset. Another factor to account for this difference relates to the method used in quantifying water hyacinths area. The estimate of water hyacinths area was done through a color segmentation process for the UAV images (pixel-based), whereas for the bridge images, rectangularly shaped bounding boxes were manually drawn around the visually identified water hyacinths. This probably results in an overestimation of water hyacinths area for the bridge images.
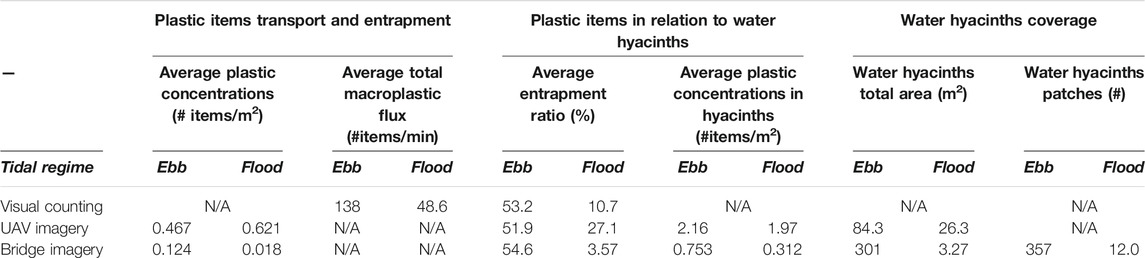
TABLE 2. Plastic concentrations, entrapment ratios and macroplastic flux in ebb and flow tide flows on May 23, 2020. The macroplastic flux averages were integrated for the entire river width.
Figure 9 displays Sentinel-2 imagery taken on May 22, 2020 (sector 4). The two upstream sectors show important accumulations of water hyacinths, sometimes taking up almost entirely the river width. The hyacinth patches in these upstream sectors form long trails, which tend to aggregate mostly on the eastern river bank. In the two downstream sectors, the Saigon river progressively becomes wider and enters the most densely populated areas of Ho Chi Minh City. The satellite image shows that pixels suggesting water hyacinths abundance are more concentrated in the upstream sections. Further downstream (sectors 3 and 4) the hyacinths mats seem less dense, continuous and large than in the upstream sector, but pixels indicating vegetation content are still visible at some locations. In those sections, the cloud coverage does not enable a continuous mapping of the hyacinths presence. The relatively small size of patches that was estimated at Thu Thiem (on average 0.8 m2) is also an indication of a possible change in water hyacinths characteristics along the river. At Thu Thiem, the cloud coverage hampers visibility and thus only a few pixels that could indicate presence of vegetation were visually detected.
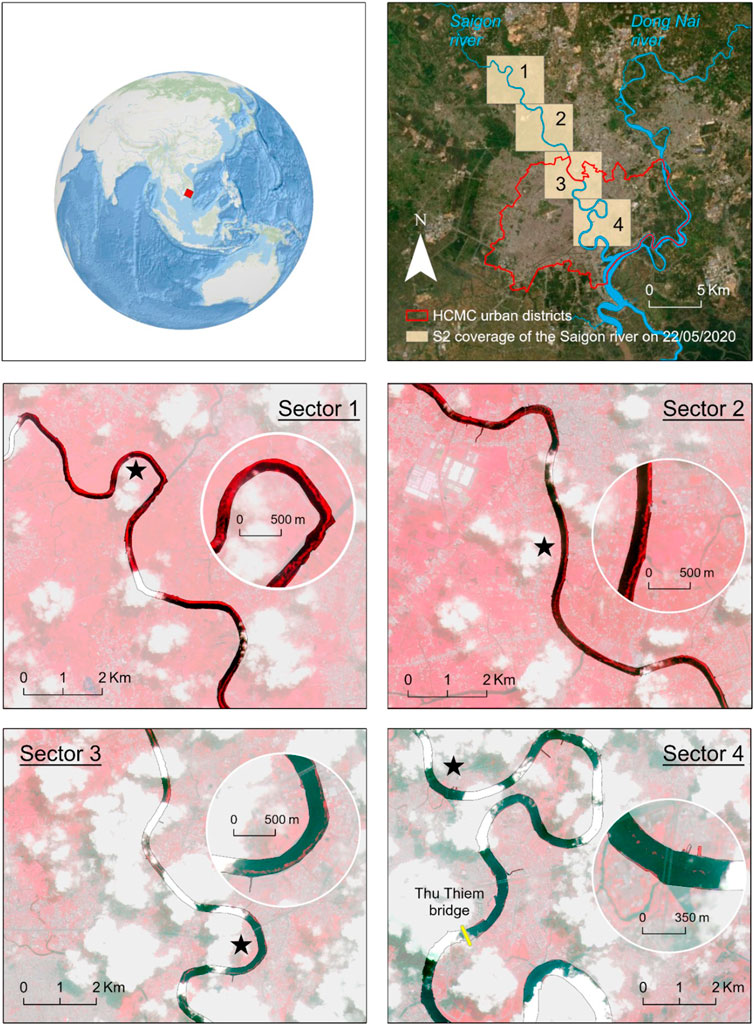
FIGURE 9. Water hyacinths distribution maps over part of the Saigon river. Panel 1 indicates the localization of Ho Chi Minh City. Panel 2 shows the section of the Saigon river covered by Sentinel-2 imagery taken on the May 22, 2020. Panels 3–6 display Sentinel-2 imagery with the False Color band combination (near-infrared, red and green bands). The stars indicate the approximate location of the detailed inset in each sector. Pixels with vegetation appear in red, pixels appearing in dark blue and black indicate water. Thu Thiem bridge is also indicated in Panel 6.
We hypothesize that these large patches detected by satellite imagery in the upstream sections break down due to boat traffic in Ho Chi Minh City which typically occurs in the mid-channel of the Saigon river. Another explanation for the reduced amount and size of the drifting hyacinth patches in the downstream sections might be increased flow velocities. Above a threshold of 0.4 m/s, the hyacinth patches become unstable and break apart more easily (Petrell and Bagnall, 1991). The average flow velocity measured on May 23, 2020 at Thu Thiem bridge exceeded 67% of the time this threshold (on average: 0.54 m/s). Further investigation on how navigation and flow velocity might disrupt and cause the disintegration of water hyacinths and possibly the release of plastics in the open water are needed to better understand water hyacinths distribution in riverine ecosystems and plastic transport dynamics.
The diurnal variability observed in the plastic flux (0.00 and 42.8 items/min) and concentrations (between 0.05 and 23.7 items/m2 can be partly explained by a shift in the tidal regime. At 13h00 on the measurement day, the flow transitioned from ebb (seaward) to flood (inland) current. All measurement techniques register higher plastic concentrations and entrapment ratios in ebb than flood tide regimes (Table 2), with the exception of the average plastic concentration measured by UAV imagery. Such variations are probably driven by the considerable decrease registered in the macroplastic flux (almost four times lower) during the flood tide. Only the plastic concentration in the water estimated by the UAV imagery was found to be higher during the flood tide than during ebb regime. This can be attributed to the large hyacinth/plastic accumulation hotspot observed close to the northern riverbank, which was picked up by UAV flights, but not with the other methods (Figure 4). The curvature of the river and a lower streamflow close to the river shore could explain this observation. Overall, the tidal regime was found to be the driving factor in determining macroplastic flux. Water hyacinths, which carry approximately half of the floating macroplastic items observed, were found to be moving mostly during the ebb tide.
The flow velocity varies between 1.05 and 0.11 m/s for ebb tide and −0.87 and −0.25 m/s for flood tide. The variations are noticeable both across the cross-section and throughout the day (Figure 10). The mean streamflow velocity does not, however, show important variations between the ebb and flood tides (mean velocity for the ebb tide = 0.57 m/s, for the flood tide = −0.53 m/s). Macroplastic fluxes for both entangled and free-floating items were weakly correlated with stream flow velocity (for both entangled and free-floating flux: Pearson’s r = 0.30, p = 0.051). The water hyacinth area estimated from the bridge imagery was also not related to stream flow velocity (Pearson’s r = −0.22, p > 0.05). The distribution of macroplastic flux along the river width does not show any significant relationship with the average stream flow (both ebb and flood tides) at the observation points nor with the presence of water hyacinth patches (all p-values > 0.05). Our observations indicate that flow velocity is of minor importance for the plastic flux and water hyacinths abundance. These findings support those of van Emmerik et al. (2019a), conducted over 10-months, which also did not find a clear relation between flow velocity and macroplastic fluxes.
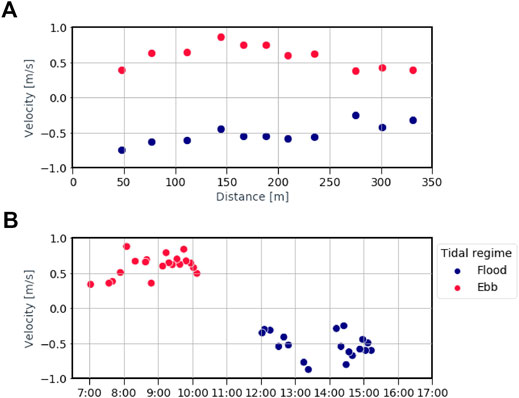
FIGURE 10. Streamflow velocity of the Saigon river close to Thu Thiem bridge. (A) Average flow velocity along the river width (distance from the northern river bank) (B) Flow velocity throughout the day. Negative values indicate stream flow in flood tidal regime, positive in ebb tide.
The results from the field campaign showed that several measuring methods can be mobilized to provide a comprehensive overview on different aspects regarding the role of water hyacinths in macroplastic transport and entrapment. To determine what (combination of) measuring methods to choose to design future monitoring campaign, we provide a comprehensive overview of aspects to consider for such strategies. We emphasize that there is no single best method, and that the choice in measuring methods ultimately depends on the monitoring goals, the local context and the available resources. To guide practitioners in this choice, we compared the measuring techniques based on three set of criteria: 1) the suitability for each technique to derive metrics of interest, 2) their relevancy at different spatiotemporal scales, 3) and their overall strengths, weaknesses, opportunities and threats (SWOT).
Figure 11 presents the metrics (green marks) that can be derived from various monitoring techniques to characterize the contribution of water hyacinths in transporting floating macroplastic. Orange marks indicate method-metric combinations where either it is uncertain if direct measurement is feasible, or when the metric may be retrieved from a combination of direct measurement and secondary sources. For instance, in the case of the use of camera, the plastic categorization depends on the height and distance at which the photographs are taken.
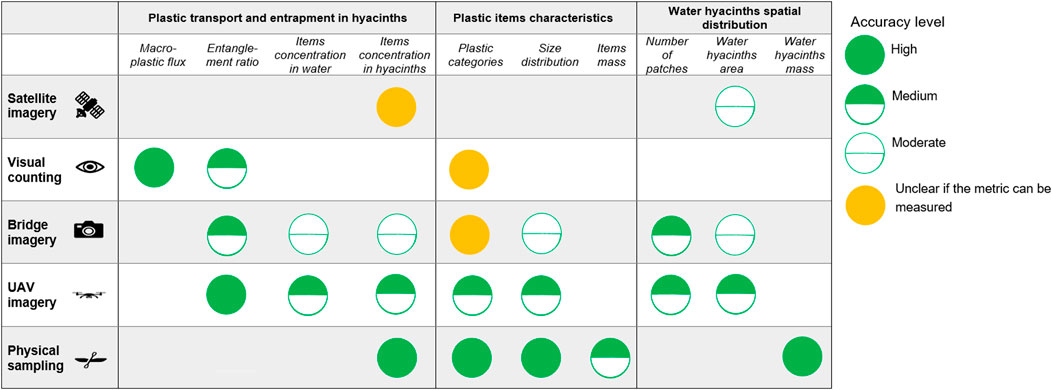
FIGURE 11. Matrix comparing measuring techniques based on key metrics of interest for detecting riverine macroplastic.
For some specific metrics, multiple methods are available, allowing for direct comparison of the results. That is the case for the ratio of entangled items in relation to the total plastic items founds. However, a few metrics can only be retrieved with a specific monitoring technique. The visual counting is to date the only technique that enables to measure plastic transport flux. This metric is crucial to ultimately estimate plastic emissions into the ocean and thus cannot be neglected. Similarly, physical sampling is the only technique that can estimate the mass of items, a metric necessary for deriving plastic mass balance. All metrics have their benefits in providing insights on water hyacinths abundance, plastic transport and/or entrapment within hyacinths or the characteristics of plastics.
The matrix also indicates a tentative level of accuracy, based on the results from the field measurements previously presented. Future uses of these measuring technique might alter this first assessment of accuracy levels. Overall, the physical sampling appears as the most accurate method. However, the retrieval of water hyacinths mass holds some uncertainties depending on whether wet or dry mass is of interest.
In addition, we compare the measuring techniques based on their spatial coverage and resolution, as well as temporal frequency (Figure 12). The assessed techniques are able to characterize the contribution of water hyacinths in floating macroplastic transport and entrapment at three different spatial scales. Firstly, satellite imagery can characterize the spatial distribution and seasonality trends in water hyacinths coverage for a river system. Certain sensors, such as Sentinel-1 and 2, enable to cover large areas simultaneously (the wide swaths of Sentinel-2 is of 290 km, and 250 km for Sentinel-1). Mosaicking several satellite imagery scenes taken the same day might allow to monitor an entire river system. The exact spatial coverage and resolution depend on the sensor characteristics but are typically within the order of 1–10 m/per pixel. Secondly, UAV images, visual counting and bridge imagery can characterize floating macroplastic flux and entrapment at a few river segments. The imagery techniques can be used for finer characterization of the presence of hyacinths, since smaller individual hyacinths can be seen, in complement of the satellite imagery. The spatial resolution in UAV imagery is in the order 0.1 cm/pixel with a flight elevation of approximately 5 m, which enables to detect the plastic category of items and to estimate items size. For imagery taken from a bridge at approximately 12–16 m, the resolution is approximately of 0.3 cm/pixel, allowing to detect the items, but not their category.
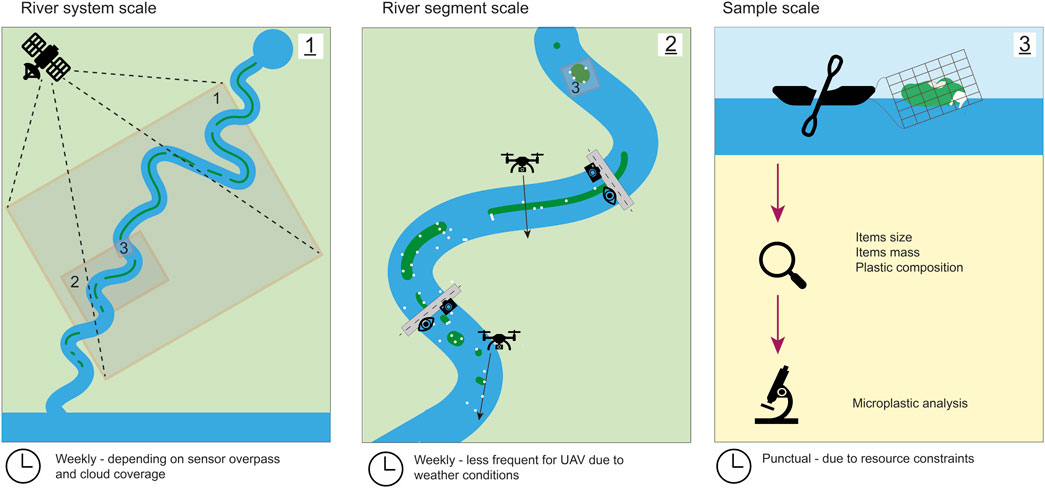
FIGURE 12. Schematic overview of the various spatial scales and temporal frequency at which the measurements can be done.
With these methods, a few river segments can be covered, depending on the presence of infrastructure present (road, bridge) that guarantees access to the sites of interest. Additionally, UAVs could be used to survey areas that are not accessible via these infrastructures. Thirdly, the physical sampling can provide insights on the specific composition of a sample: it provides high accuracy in determining the plastic composition and can be used to derive the mass of items as well as further microplastic analysis.
Due to the complex nature of the plastic-water hyacinth interactions, multiple perspectives are needed to understand the transport and entrapment processes, and variability of plastic and water hyacinths variables at different spatiotemporal scales. A nested monitoring framework is useful for large-scale river monitoring, while maintaining local relevance.
The temporal frequency and coverage can also play a role in evaluating the relevancy of each method. The satellite imagery can combine both high frequency and long temporal coverage. Due to the frequent revisit time (1 or 2 images per week) and global coverage since their launch dates in 2015 and 2017, the Sentinel-2 constellation holds the potential for mapping water hyacinth distribution over several years. Ultimately, these satellites can help characterizing interannual and seasonality trends in hyacinths coverage. For all other monitoring techniques, the frequency in measurements is solely dependent on resources. However, a weekly frequency in measurements for the visual counting and the imagery techniques seems appropriate due to the fact that both macroplastic transport and hyacinths presence are highly dynamics in time. Lastly, physical samples are typically punctual measurements, due to the resource constraints in both the sample retrieval and then the subsequent analysis.
Other factors than the metrics of interest and spatiotemporal dimensions can enter into consideration when defining a monitoring strategy. The shortcomings of each technique, for instance, as well as new opportunities that arise in their use thanks to technological developments. We present a SWOT analysis in Figure 13 that summarizes these elements for each measuring technique. Considerations pertaining to the cost-efficiency, processing requirements, labor and time, technical expertise and environmental conditions were included. For instance, the visual counting technique is relatively low-cost and involves few processing steps in data analysis. The satellite imagery also comes at low cost for the users and can be used without direct access to the river of interest. The physical sampling and UAV imagery are more time-consuming and demanding in terms of resources and equipment, but enable a more detailed and accurate characterization of plastic items.
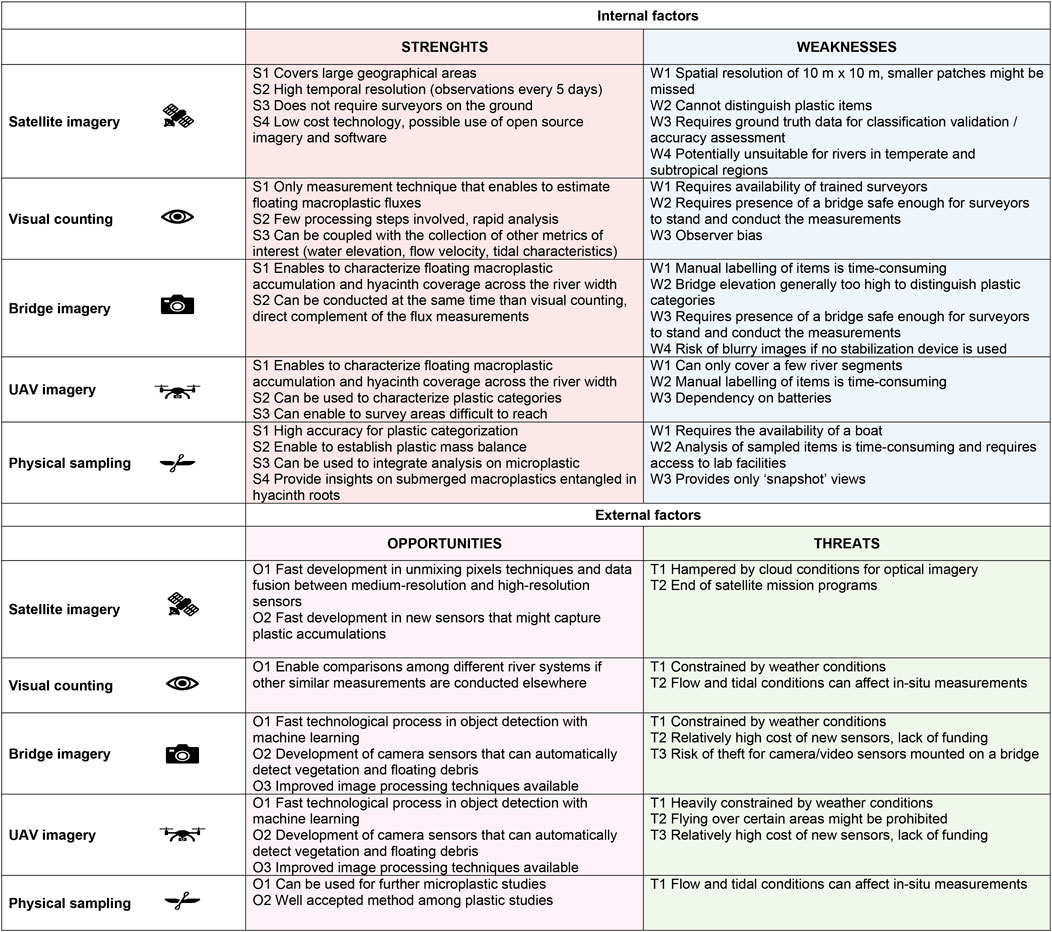
FIGURE 13. SWOT analysis for each measuring technique tested.
In terms of opportunities, two very promising future development in machine learning and multispectral/hyperspectral imagery could have major operational implications for monitoring the contribution of vegetation to floating macroplastic transport. Although current machine learning applications to automatically detect floating plastic objects are on the rise, their overall use remains exploratory, because they typically require large training datasets (Lieshout et al., 2020). In addition, the presence of water hyacinths patches adds complexity for object detection and image processing, because the plastic items are less easily detectable when entrapped. Future improvements in machine learning and object detection algorithms could imply faster processing of imagery datasets, thus greatly facilitating the extensive use of UAV and bridge imagery. Similarly, the development of multispectral or hyperspectral sensors for satellite imagery or UAV technology that detect plastic components would also justify the increased use of these techniques (Tasseron et al., 2021). In particular, if the detection of plastic/hyacinths mixture by satellite imagery would be ascertained, the role of satellite imagery would become even more central, given its large geographical coverage, high temporal resolution and cost-effectiveness. The successful detection of floating debris in coastal waters using satellite imagery is promising for future applications in riverine systems (Biermann et al., 2020). However, lower abundance of both macroplastic and floating vegetation in rivers located in the temperate and subtropical regions might limit the use of this method to tropical river systems.
In this paper, we present five monitoring techniques to assess the role of water hyacinths in transporting and accumulating macroplastic. We provided a field guide on how to use monitoring methods to characterize water hyacinths distribution, plastic transport, the relation between water hyacinths and plastic, as well as plastic items characteristics. The field guide was built around in-situ surveys conducted at the Saigon river, Vietnam as well as satellite imagery analysis. There, we tested five different methods commonly used in plastic and vegetation monitoring in riverine ecosystems. The practical set-up of these monitoring techniques was adapted to our scope of investigating the role of floating vegetation in plastic propagation and provided details facilitate future use. Further, the field guide presented and compared the results derived from each monitoring techniques, which illustrate the various aspects that can be considered when investigating plastic entrapment in vegetation.
Our framework for observing vegetation entangled riverine macroplastic enables to compare the suitability of measuring techniques and can help to inform and optimize future measuring initiatives. All monitoring techniques can characterize different aspects of the role of floating vegetation in plastic transport and entrapment. Although there is also overlap in the aspects that the different techniques cover, certain essential metrics can only be derived by a specific method (flux measurements by visual counting and plastic mass balance by physical sampling). We also present the different spatiotemporal scales and resolutions that each measuring technique can contribute to, an aspect particularly relevant for long-term monitoring efforts at a large scale. We emphasize the importance of combining several techniques which are complementary. Satellite imagery analysis can provide a thorough overview at the river system scale of the vegetation abundance and its spatial and seasonal dynamics, thanks to the large geographical and temporal coverage it offers. UAV and bridge imagery can complement the visual counting observations, by providing additional insights on water hyacinth patches and their characteristics (number, area, accumulation zones), as well as the size, the typology and concentrations of items found. Further, the SWOT analysis summarized the main benefits and drawbacks pertaining to each measuring techniques and practical considerations on the cost, labor and equipment requirements might be useful to practitioners in designing monitoring strategies. The SWOT analysis also highlighted that future technological advancements in sensor characteristics and machine learning could substantially foster the use of satellite imagery and in-situ imagery techniques.
With this field guide we provide a step towards additional monitoring efforts on the role of vegetation in plastic transport at a river system scale. The majority of tropical and subtropical rivers report an increasing presence of water hyacinths that disrupts navigation activities and negatively impact aquatic ecosystems. Large-scale and extended monitoring of this floating aquatic weed, spread and distribution as well as their linkages with plastic retention mechanisms is thus of global interest. Better characterizing the nexus between plastic and vegetation is crucial to improve our understanding of plastic transport processes and dynamics. Hyacinths and other types of floating vegetation are easily detectable by satellite imagery and it can hypothesized that they trap and carry large shares of floating debris for other river systems. If this is ascertained, quantifying the coverage of floating vegetation could be used as a proxy for estimating macroplastic quantities in rivers. Lastly, such monitoring efforts could inform the operational clean-up strategies, for instance by testing the co-removal of plastic and hyacinths.
The original contributions presented in the study are included in the article/Supplementary Materials, further inquiries can be directed to the corresponding author.
TE, LS, and MP: design and conceptualization of the study. TN, N-AP, and T-CK-L: data collection. LS and EC: data analysis. LS: writing. MP, TE, ES, LB, T-CK-L, T-KB, SK, and SB: editing and reviewing.
The work of LS was supported by NWO Open Mind grant 18127. The work of MP and TvE was supported by the 4TU.Federation Plantenna project. TvE is supported by the Veni research program The River Plastic Monitoring Project with project number 18211, which is (partly) funded by the Dutch Research Council (NWO). This study is part of the Plastic Plants project, supported by the Discovery Element of the European Space Agency’s Basic Activities (ESA contract no. 4000132682/20/NL/GLC).
The authors declare that the research was conducted in the absence of any commercial or financial relationships that could be construed as a potential conflict of interest.
The Supplementary Material for this article can be found online at: https://www.frontiersin.org/articles/10.3389/fenvs.2021.716516/full#supplementary-material
Biermann, L., Clewley, D., Martinez-Vicente, V., and Topouzelis, K. (2020). Finding Plastic Patches in Coastal Waters Using Optical Satellite Data. Sci. Rep. 10 (1), 5364. doi:10.1038/s41598-020-62298-z
Brennan, E., Wilcox, C., and Hardesty, B. D. (2018). Connecting Flux, Deposition and Resuspension in Coastal Debris Surveys. Sci. Total Environ. 644, 1019–1026. doi:10.1016/j.scitotenv.2018.06.352
Bull, P., and Lawler, D. (1991). Flow Measurement and Water Tracing in Caving Practice and Equipment, Editor. D. Judson (Cordee-Leicester/British Cave Research Association), 167–178.
Cozzolino, L., Nicastro, K. R., Zardi, G. I., and de los Santos, C. B. (2020). Species-Specific Plastic Accumulation in the Sediment and Canopy of Coastal Vegetated Habitats. Sci. Total Environ. 723, 138018. doi:10.1016/j.scitotenv.2020.138018
Dogliotti, A., Gossn, J., Vanhellemont, Q., and Ruddick, K. (2018). Detecting and Quantifying a Massive Invasion of Floating Aquatic Plants in the Río de la Plata Turbid Waters Using High Spatial Resolution Ocean Color Imagery. Remote Sens. 10, 1140. doi:10.3390/rs10071140
Geraeds, M., van Emmerik, T., de Vries, R., and bin Ab Razak, M. S. (2019). Riverine Plastic Litter Monitoring Using Unmanned Aerial Vehicles (UAVs). Remote Sens. 11 (17), 2045–2048. doi:10.3390/rs11172045
González-Fernández, D., and Hanke, G. (2017). Toward a Harmonized Approach for Monitoring of Riverine Floating Macro Litter Inputs to the marine Environment. Front. Mar. Sci. 4, 86. doi:10.3389/fmars.2017.00086
Haberstroh, C. J., Arias, M. A., Yin, Z., and Wang, M. C. (2021). Effects of Hydrodynamics on the Cross-Sectional Distribution and Transport of Plastic in an Urban Coastal River. Water Environ. Res. 93 (2). doi:10.1002/wer.1386
Hailu, A., and Emana Getu, D. (2018). Water Hyacinth (Eichhornia crassipes) Biology and its Impacts on Ecosystem, Biodiversity, Economy and Human Well-Being. J. Life Sci. Biomed. 8 (6), 94–100. www.jlsb.science-line.com.
Hurley, R., Woodward, J., and Rothwell, J. J. (2018). Microplastic Contamination of River Beds Significantly Reduced by Catchment-wide Flooding. Nat. Geosci. 11 (4), 251–257. doi:10.1038/s41561-018-0080-1
Ivar do Sul, J. A., Costa, M. F., Silva-Cavalcanti, J. S., and Araújo, M. C. B. (2014). Plastic Debris Retention and Exportation by a Mangrove forest Patch. Mar. Pollut. Bull. 78 (1–2), 252–257. doi:10.1016/j.marpolbul.2013.11.011
Kleinschroth, F., Winton, R. S., Calamita, E., Niggemann, F., Botter, M., Wehrli, B., et al. (2021). Living with Floating Vegetation Invasions. Ambio 50 (1), 125–137. doi:10.1007/s13280-020-01360-6
Kurniawan, S. B., and Imron, M. F. (2019). Seasonal Variation of Plastic Debris Accumulation in the Estuary of Wonorejo River, Surabaya, Indonesia. Environ. Technol. Innovation 16, 100490. doi:10.1016/j.eti.2019.100490
Lebreton, L. C. M., Van Der Zwet, J., Damsteeg, J.-W., Slat, B., Andrady, A., and Reisser, J. (2017). River Plastic Emissions to the World's Oceans. Nat. Commun. 8 (1), 1–10. doi:10.1038/ncomms15611
Liedermann, M., Gmeiner, P., Pessenlehner, S., Haimann, M., Hohenblum, P., and Habersack, H. (2018). A Methodology for Measuring Microplastic Transport in Large or Medium Rivers. Water 10 (4), 414. doi:10.3390/w10040414
Lieshout, C., Oeveren, K., Emmerik, T., and Postma, E. (2020). Automated River Plastic Monitoring Using Deep Learning and Cameras. Earth Space Sci. 7. doi:10.1029/2019ea000960
Martin, C., Almahasheer, H., and Duarte, C. M. (2019). Mangrove Forests as Traps for Marine Litter. Environ. Pollut. 247, 499–508. doi:10.1016/j.envpol.2019.01.067
Meijer, L. J. J., van Emmerik, T., van der Ent, R., Schmidt, C., and Lebreton, L. (2021). More Than 1000 Rivers Account for 80% of Global Riverine Plastic Emissions into the Ocean. Sci. Adv. 7 (18). doi:10.1126/sciadv.aaz5803
Menon, A., Bharadwaj, S. G., Adidam, P. T., and Edison, S. W. (1999). Antecedents and Consequences of Marketing Strategy Making: A Model and a Test. J. Marketing 63 (2), 18. doi:10.2307/1251943
Olivelli, A., Hardesty, B. D., and Wilcox, C. (2020). Coastal Margins and Backshores Represent a Major Sink for Marine Debris: Insights from a Continental-Scale Analysis. Environ. Res. Lett. 15, 074037. doi:10.1088/1748-9326/ab7836
Petrell, R. J., and Bagnall, L. O. (1991). Hydromechanical Properties of Water Hyacinth Mats. Aquacultural Eng. 10 (2). doi:10.1016/0144-8609(91)90006-6
Reddy, K., and Sutton, D. (1984). Water Hyacinths for Water Quality Improvement and Biomass Production. J. Environ. Qual. 13, 1.
Roebroek, C. T. J., Hut, R., Vriend, P., de Winter, W., Boonstra, M., and van Emmerik, T. H. M. (2021). Disentangling Variability in Riverbank Macrolitter Observations. Environ. Sci. Technol. 55 (8), 4932–4942. doi:10.1021/acs.est.0c08094
Schreyers, L., van Emmerik, T., Biermann, L., and Le Lay, Y.-F. (2021a). Spotting Green Tides over Brittany from Space: Three Decades of Monitoring with Landsat Imagery. Remote Sensing 13 (8), 1408. doi:10.3390/rs13081408
Schreyers, L., van Emmerik, T., Luan Nguyen, T., Castrop, E., Phung, N.-A., Kieu-Le, T.-C., et al. (2021b). Plastic Plants: Water Hyacinths as Driver of Plastic Transport in Tropical Rivers.
Ta, A. T., and Babel, S. (2020). Microplastics Pollution with Heavy Metals in the Aquaculture Zone of the Chao Phraya River Estuary, Thailand. Mar. Pollut. Bull. 161, 111747. doi:10.1016/j.marpolbul.2020.111747
Tasseron, P., van Emmerik, T., Peller, J., Schreyers, L., and Biermann, L. (2021). Advancing Floating Macroplastic Detection from Space Using Hyperspectral Imagery. Remote Sensing 13 (12), 2335. doi:10.3390/rs13122335
van Calcar, C. J., and van Emmerik, T. H. M. (2019). Abundance of Plastic Debris across European and Asian Rivers. Environ. Res. Lett. 14 (12), 124051. doi:10.1088/1748-9326/ab5468
van Emmerik, T., Kieu-Le, T.-C., Loozen, M., van Oeveren, K., Strady, E., Bui, X.-T., et al. (2018). A Methodology to Characterize Riverine Macroplastic Emission into the Ocean. Front. Mar. Sci. 5, 372. doi:10.3389/fmars.2018.00372
van Emmerik, T., Strady, E., Kieu-Le, T.-C., Nguyen, L., and Gratiot, N. (2019a). Seasonality of Riverine Macroplastic Transport. Sci. Rep. 9 (1), 1–9. doi:10.1038/s41598-019-50096-1
van Emmerik, T., Tramoy, R., van Calcar, C., Alligant, S., Treilles, R., Tassin, B., et al. (2019b). Seine Plastic Debris Transport Tenfolded during Increased River Discharge. Front. Mar. Sci. 6, 1–7. doi:10.3389/fmars.2019.00642
Vriend, P., Roebroek, C., and van Emmerik, T. (2020a). Same but Different: A Framework to Design and Compare riverbank Plastic Monitoring Strategies Front. Water. 2, 31. doi:10.31223/osf.io/jp6a2
Keywords: Plastic, riverine debris, hydrology, macroplastics, floating vegetation, Vietnam
Citation: Schreyers L, van Emmerik T, Nguyen TL, Phung N-A, Kieu-Le T-C, Castrop E, Bui T-KL, Strady E, Kosten S, Biermann L, van den Berg SJ and van der Ploeg M (2021) A Field Guide for Monitoring Riverine Macroplastic Entrapment in Water Hyacinths. Front. Environ. Sci. 9:716516. doi: 10.3389/fenvs.2021.716516
Received: 01 June 2021; Accepted: 01 July 2021;
Published: 19 July 2021.
Edited by:
Zhi Wang, Innovation Academy for Precision Measurement Science and Technology (CAS), ChinaReviewed by:
Elvis Genbo Xu, University of Southern Denmark, DenmarkCopyright © 2021 Schreyers, van Emmerik, Nguyen, Phung, Kieu-Le, Castrop, Bui, Strady, Kosten, Biermann, van den Berg and van der Ploeg. This is an open-access article distributed under the terms of the Creative Commons Attribution License (CC BY). The use, distribution or reproduction in other forums is permitted, provided the original author(s) and the copyright owner(s) are credited and that the original publication in this journal is cited, in accordance with accepted academic practice. No use, distribution or reproduction is permitted which does not comply with these terms.
*Correspondence: Louise Schreyers, bG91aXNlLnNjaHJleWVyc0B3dXIubmw=
Disclaimer: All claims expressed in this article are solely those of the authors and do not necessarily represent those of their affiliated organizations, or those of the publisher, the editors and the reviewers. Any product that may be evaluated in this article or claim that may be made by its manufacturer is not guaranteed or endorsed by the publisher.
Research integrity at Frontiers
Learn more about the work of our research integrity team to safeguard the quality of each article we publish.