 Aryo Adhi Condro
95% of researchers rate our articles as excellent or good
Learn more about the work of our research integrity team to safeguard the quality of each article we publish.
Find out more
BRIEF RESEARCH REPORT article
Front. Environ. Sci. , 30 September 2021
Sec. Conservation and Restoration Ecology
Volume 9 - 2021 | https://doi.org/10.3389/fenvs.2021.713837
This article is part of the Research Topic Conservation and Restoration of the Tropical Landscape: Governance and Multidisciplinary Approaches View all 13 articles
The Leuser Ecosystem is one of the essential landscapes in the world for biodiversity conservation and ecosystem services. However, the Leuser Ecosystem has suffered many threats from anthropogenic activities and changing climate. Climate change is the greatest challenge to global biodiversity conservation. Efforts should be made to elaborate climatic change metrics toward biological conservation practices. Herein, we present several climate change metrics to support conservation management toward mammal species in the Leuser Ecosystem. We used a 30-year climate of mean annual temperature, annual precipitation, and the BIOCLIM data to capture the current climatic conditions. For the future climate (2050), we retrieved three downscaled general circulation models for the business-as-usual scenario of shared socioeconomic pathways (SSP585). We calculated the dissimilarities of the current and 2050 climatic conditions using the standardized Euclidean distance (SED). To capture the probability of climate extremes in each period (i.e., current and future conditions), we calculated the 5th and 95th percentiles of the distributions of monthly temperature and precipitation, respectively, in the current and future conditions. Furthermore, we calculated forward and backward climate velocities based on the mean annual temperature. These metrics can be useful inferences about species conservation. Our results indicate that almost all of the endangered mammals in the Leuser Ecosystem will occur in the area with threats to local populations and sites. Different conservation strategies should be performed in the areas likely to present different threats toward mammal species. Habitat restoration and long-term population monitoring are needed to support conservation in this mega biodiversity region.
The Leuser Ecosystem is one of the essential landscapes in the world for biodiversity conservation and ecosystem services (Le Saout et al., 2013). It harbors various ecoregions such as tropical lowland and montane rainforests, coastal ecosystem, and peatland areas (Olson et al., 2001). This landscape represents the most critical refugia for many endangered mammals in Asia, for example, Sumatran orangutan, elephant, tiger, and rhinoceros, including a massive endemic diversity plant species (Cochard, 2017). Furthermore, the Leuser Ecosystem also contributed to regulating services like carbon sequestration (Warren et al., 2017), water provisioning, and economic benefits toward the local community (Janssen, 2003; Cochard, 2017).
Nevertheless, the Leuser Ecosystem has been subjected to anthropogenic activities that lead to deforestation and climate disturbance. Infrastructure development has been rapidly known as a potential threat to the Leuser Ecosystem (Sloan et al., 2018). Besides, illegal logging and agricultural expansion are also responsible for forest disturbance within the Leuser Ecosystem (Gaveau et al., 2009). Degradation of tropical peatlands within the area caused high carbon emissions to the atmosphere due to biomass loss, wildfires, and peat oxidation that lead to climate change (Page et al., 2011). Previous studies show that the destruction of tropical rainforests due to anthropogenic activities has been linked to population declines in many mammals such as Sumatran rhino, tiger, elephant, and orangutan (Kinnaird et al., 2003; Linkie et al., 2008; Wich et al., 2016; Weiskopf et al., 2019). Climate change can also induce habitat range contraction and distribution shifting for mammal species that lead to species extinction and extirpation (Chen et al., 2011; Dirzo et al., 2014; Ribeiro et al., 2016; Condro et al., 2021). Furthermore, the previous study also showed that the Leuser Ecosystem would experience significant biodiversity extirpations due to climate and habitat changes (Wich et al., 2016; Condro et al., 2021). However, there are still few studies about climate change impacts on biodiversity in the Leuser Ecosystem (Gaveau et al., 2009; Wich et al., 2016). Therefore, measuring the climate change impacts on biodiversity within the Leuser Ecosystem should be carried out to point out future conservation strategies.
Conservation strategies designed to improve biodiversity’s resilience to climate change are inextricably linked to broader conservation activities (Game et al., 2011). Climate change metrics are crucial methods for mapping potential biodiversity risks in the future that helps predict which species are likely to adapt in space to a novel climate, migrate, and stay in a habitat with a newly suitable climate (Carroll et al., 2015). For instance, climate change metrics commonly used are climatic anomalies, change in climate extremes probability, and climatic change velocity (Borges and Loyola, 2020). Climate anomalies and change in climate extremes probability calculate the magnitude of change in the average and extreme conditions, respectively, at a given locality through time (Garcia et al., 2014). The velocity of climate change evaluates the exposure of species in the landscape to climate change (Loarie et al., 2009; Hamann et al., 2015). Those metrics allow us to assess whether the current protected areas will serve as refugia or suffer biodiversity extirpation and consequent changes in ecosystem processes (Araújo et al., 2011; Carroll et al., 2015). This study defines refugia as the areas with high future climatic stability (Watson et al., 2013; Sales et al., 2019).
Protected areas should be recognized as part of a comprehensive ecosystem-based management strategy that considers the complex and cumulative effects of anthropogenic activities. Nevertheless, taking climate change into account while designing and evaluating protected areas is still in its beginning (Brito-Morales et al., 2018). Herein, we present several metrics of the climate change, that is, standardized climatic anomalies, change in the probability of local climate extremes, and climate velocity to support conservation management toward endangered mammal biodiversity in the Leuser Ecosystem.
The study was conducted in the Leuser Ecosystem (Figure 1), located in the north of Sumatera, Indonesia. The Leuser Ecosystem covered two provincial administrative areas, that is, North Sumatra and Aceh provinces. The Leuser Ecosystem covers 2.6 million hectares and consists of either protected areas (i.e., nature conservation areas, nature reserve areas, and hunting parks) or unprotected areas (i.e., production forests, limited production forests, and convertible forests). The Leuser Ecosystem exemplifies how discrepancies in forest management by central and regional governments have undermined conservation planning and infrastructure growth (Sloan et al., 2018). We evaluated protected areas within the Leuser Ecosystem based on climate change metrics and mammal species richness.
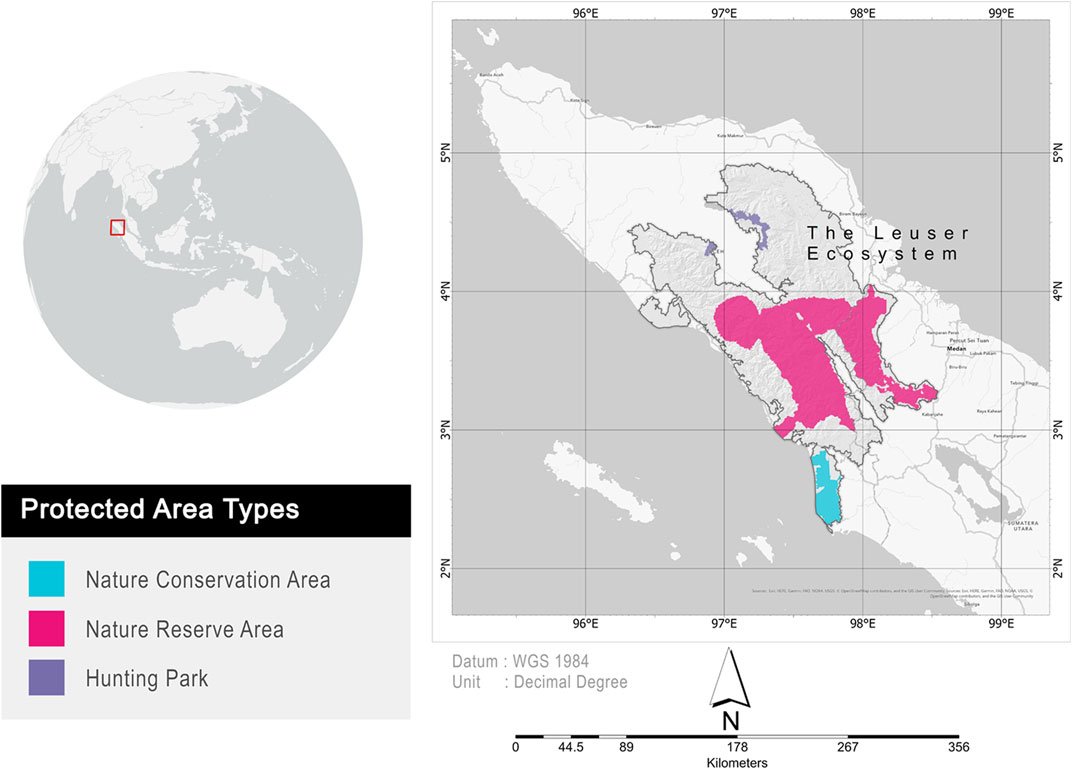
FIGURE 1. Location of the Leuser Ecosystem and its protected areas. The conservation statuses of individual land management units were published by the Ministry of Environment and Forestry, Republic of Indonesia. Nature conservation area consists of national parks, nature recreation parks, and grand forest parks. Besides, the nature reserve area consists of strict nature reserve and wildlife reserve.
We used a 30-year climate of mean annual temperature, annual precipitation, and BIOCLIM variables at 30–arc second spatial resolution (∼1 km) retrieved from WorldClim version 2.1 (Hijmans et al., 2005; Booth et al., 2014; Fick and Hijmans, 2017) for current climatic conditions. For the future climate in 2050, we retrieved three downscaled general circulation models (GCMs) for the business-as-usual scenario of shared socioeconomic pathways (SSP585) from the Coupled Model Intercomparison Project phase 6 multi-model dataset projections (Riahi et al., 2017). We followed the delta methods described by Navarro–Racines et al. (2020) to perform statistical downscaling of the GCM dataset and used a simple average to obtain the ensemble model from 3 GCMs (Watson et al., 2013). The three models used in the study were MIROC-ES2L and MIROC6 from the University of Tokyo, National Institute for Environmental Studies, and the Japan Agency for Marine-Earth Science and Technology (Tatebe et al., 2019; Hajima et al., 2020); and MRI-ESM 2.0 from the Meteorological Research Institute, Tsukuba, Japan (Yukimoto et al., 2019).
We calculated the dissimilarities of the current and 2050 climatic conditions by using the standardized Euclidean distance (SED) for temperature and precipitation according to Williams et al. (2007). This study used the mean annual temperature (Bio1) and annual precipitation (Bio12) to evaluate temperature and precipitation, respectively. The temporal differences for the climatic variables were standardized by the interannual standard deviation for both variables from the seasonality of temperature (Bio4) and seasonality of precipitation (Bio15) in the current condition. High SED values correspond to significant changes in temperature and precipitation (Garcia et al., 2014).
To capture the probability of climate extremes in each period (i.e., current and future conditions), we calculated the 5th and 95th percentiles of the distributions of monthly temperature and precipitation, respectively, in the current and future conditions. Since the daily data were unavailable, the monthly data used here can point out to the information enclosed within the gradual trends (Garcia et al., 2014). We used both data to determine the probability of an extreme event of precipitation and temperature by a generalized extreme value distribution (Katz et al., 2005). To avoid double-counting in probabilities, we subtracted the sum of two probabilities (i.e., temperature and precipitation extremes) with the product of two probabilities. The change in the probability of local climate extremes was calculated by subtracting future probability with the current probability of climate extreme events. Negative values represented the decrease in the climate extreme events, whereas positive values indicated the increase in the climate extreme events in the future condition. The calculations captured dry and hot aspects of the climate extreme from the fifth percentile of precipitation and 95th percentile of temperature. On the other hand, wet and cold aspects of the climate extreme were retrieved from the 95th percentile of precipitation and fifth percentile of temperature, respectively. Several recent studies also used the monthly climatic data to capture the climate extremes (Albright et al., 2011; Suggitt et al., 2011; Stewart et al., 2021).
We calculated forward and backward climate velocities based on the mean annual temperature in the current and future conditions (Garcia et al., 2014; Carroll et al., 2015). Basically, climate change velocity is the ratio of the climatic parameter’s temporal and spatial gradients (Loarie et al., 2009). This study performed the climate-analog velocity algorithm developed by Hamann et al. (2015) that calculates the distance of the climatic parameter from present to the future climate match using a rounding operation on the data to create more efficient calculation. The forward velocity represents the minimum distance the species in the current landscape has to migrate to maintain climate conditions in the future. Conversely, backward velocity shows how fast the species would have to migrate to colonize in a particular landscape (Loarie et al., 2009; Carroll et al., 2015).
We investigated the protected area’s susceptibility within the Leuser Ecosystem from the World Database on Protected Areas (WDPA; www.protectedplanet.net; accessed on March 13, 2021) based on standardized Euclidean distance (SED) by quantifying an average of the metrics within the protected area patches (Williams et al., 2007). We calculated the residence times (i.e., the maximum diameter of each protected area patch divided by velocity) to examine the interaction between protected area extents and climatic velocities that is needed to maintain pace with climate change (Loarie et al., 2009).
We created the bivariate plot based on forward and backward velocities to assess the four regions of threat for biodiversity within the study area. We classified the forward velocity and backward velocity values into two categories: values greater than the median and below the median. Low forward and backward velocities represent low threat, low forward and high backward velocities indicate threats to habitats, high forward and low backward velocities represent threats to local populations, and high for both velocities indicate threats to sites and populations (Carroll et al., 2015). Furthermore, we calculated the proportion of 45 endangered mammal species (i.e., near threatened, vulnerable, endangered, and critically endangered based on the IUCN red list categories) of interest and the geographic distribution within the multifaceted threats (Carroll et al., 2015; Borges and Loyola, 2020). We obtained the geographical distribution of species from the IUCN red list spatial data for terrestrial mammals (available from https://www.iucnredlist.org; accessed on March 13, 2021).
We observed a climatic anomaly value across the landscape ranging from 0.25 to 0.57 (x̄ = 0.32, SE = 0.001). The Leuser Ecosystem that was possibly exposed to a higher climate anomaly (combined temperature and precipitation) would have occurred in the northwest, southeast, and several montane areas within the landscape. Future precipitation anomalies (x̄ = 0.27, SE = 0.002) would have likely greater values than the temperature anomaly (x̄ = 0.17, SE = 0.002). Furthermore, a higher temperature anomaly was generated at high altitude areas, where the current climate conditions become locally disappeared as climate shifting becomes more pronounced (Figure 2A).
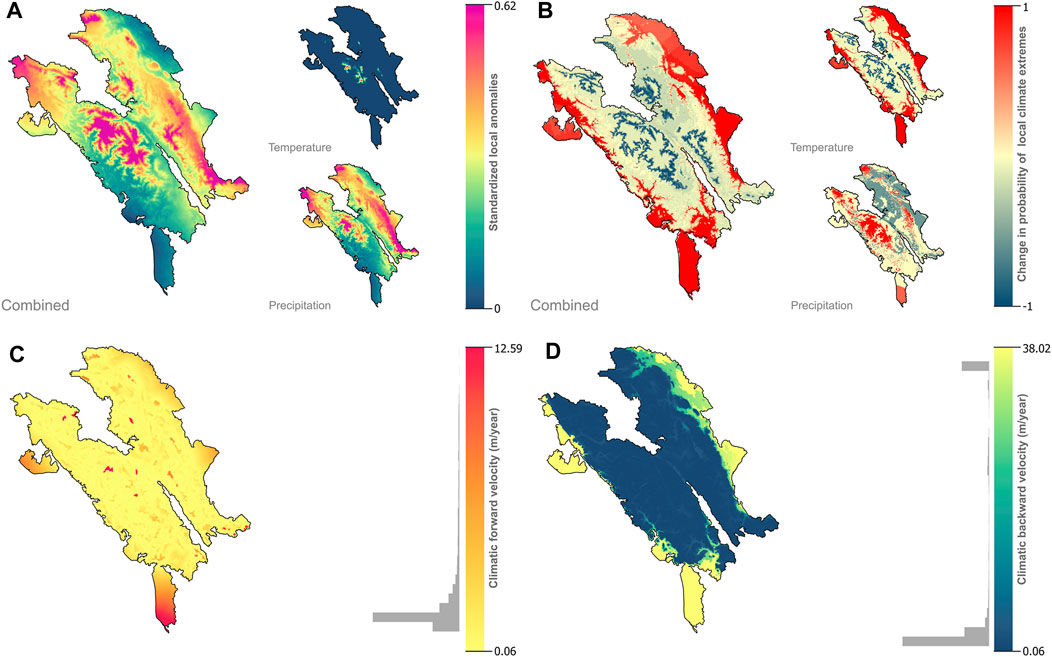
FIGURE 2. Projected climate change in the Leuser Ecosystem based on climate change metrics. The maps show projections of change based on business-as-usual scenario (SSP585) by 2050. The metrics depicted characterize three dimensions of climate change: the magnitude of local changes in standardized climate anomalies (A), change in the probability of extreme climates (B), and climate change velocity, either forward (C) or backward (D) velocities. Gray-filled histograms indicate the statistical distributions of climate velocities.
The fifth percentile of the extreme precipitation distribution was 131 mm/month, and the 95th percentile was 453 mm/month. Besides, the fifth and the 95th percentile of the extreme temperature distributions were 17.7°C/month and 27.1°C/month, respectively. The probability of climate extremes would be increased about +26% by 2050 based on business as usual. We found the future increase in temperature extremes in hot or cold conditions (x̄ = +24%, SE = 0.001%) in the lowland areas. Moreover, drought and extreme precipitation events had considerably become more frequent (x̄ = +0.9%, SE = 5%) by 2050 in the montane areas (Figure 2B).
The results show that forward and backward climatic velocities within the Leuser ecosystem are ranging from 0.08 m/year to 12.59 m/year (x̄ = 1.25 m/year, SE = 0.002 m/year) and 0.08 m/year to 38.02 m/year (x̄ = 8.98 m/year, SE = 0.015 m/year), respectively (Figures 2C,D). We found only 31.2% of the landscape areas that cannot survive climate change to maintain current climatic conditions in the future. The residence times from forward velocity were ranging from 7.9 to 1,548 years (x̄ = 275.3 years, SE = 0.072 years).
We found that the local climate change exposure was ranging from 0.247–0.575 (x̄ = 0.344, SE = 0.002), and from 0.249 to 0.467 (x̄ = 0.334, SE = 0.001) within the protected areas and unprotected areas, respectively (Figure 3A). The results suggest that protected area is more susceptible to climate change than the unprotected areas within the Leuser Ecosystem based on SED values (Kolmogorov–Smirnov test; D = 0.20397, p-value < 0.005). Moreover, we found that the climatic anomaly in the nature reserve area (NRA) was ranging from 0.248 to 0.575 (x̄ = 0.353, SE = 0.005). Dissimilarities between current and future climates within the Hunting Park (HP) was ranging from 0.316 to 0.436 (x̄ = 0.344, SE = 0.003). Furthermore, the climatic anomaly within the Nature Conservation Area (NCA) was ranging from 0.258 to 0.281 (x̄ = 0.269, SE = 0.001) (see Figure 3B).
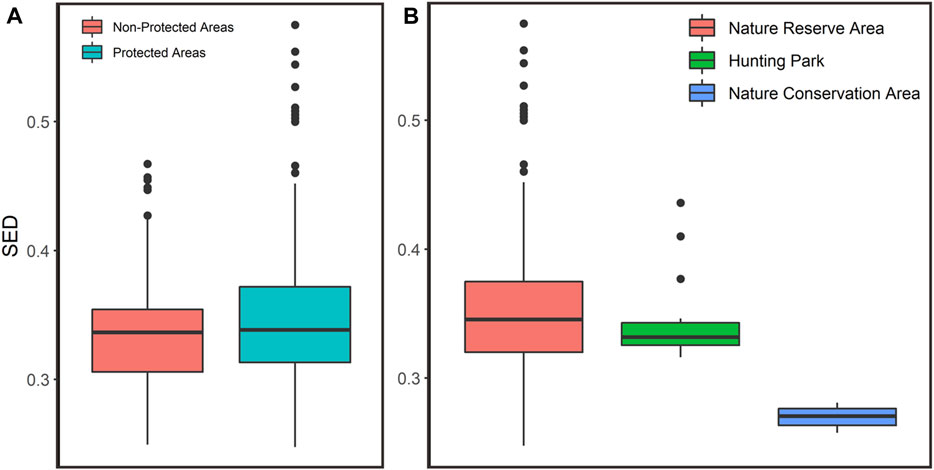
FIGURE 3. Local climate exposure variation within protected and non-protected areas (A) and different protected area types (B) in the Leuser Ecosystem.
The result shows that 32% (∼840,490 km2) of the Leuser Ecosystem would be threatened to sites and local populations for mammal species until 2050 (i.e., high-risk areas). Areas with threats to sites and endangered mammal populations are found in the south, northeast, and small area in the northwest regions (Figure 4B). Potential refugia areas with low threat cover only 28% of the Leuser Ecosystem. We found the potential refugia areas in the center of the landscape. Areas with the threats only to habitat (19%) will be in the center of the Leuser Ecosystem within the relatively low steepness. Besides, areas with the threats only to local populations (21%) will be also in the center of the Leuser Ecosystem but within relatively high steepness (Figure 4B).
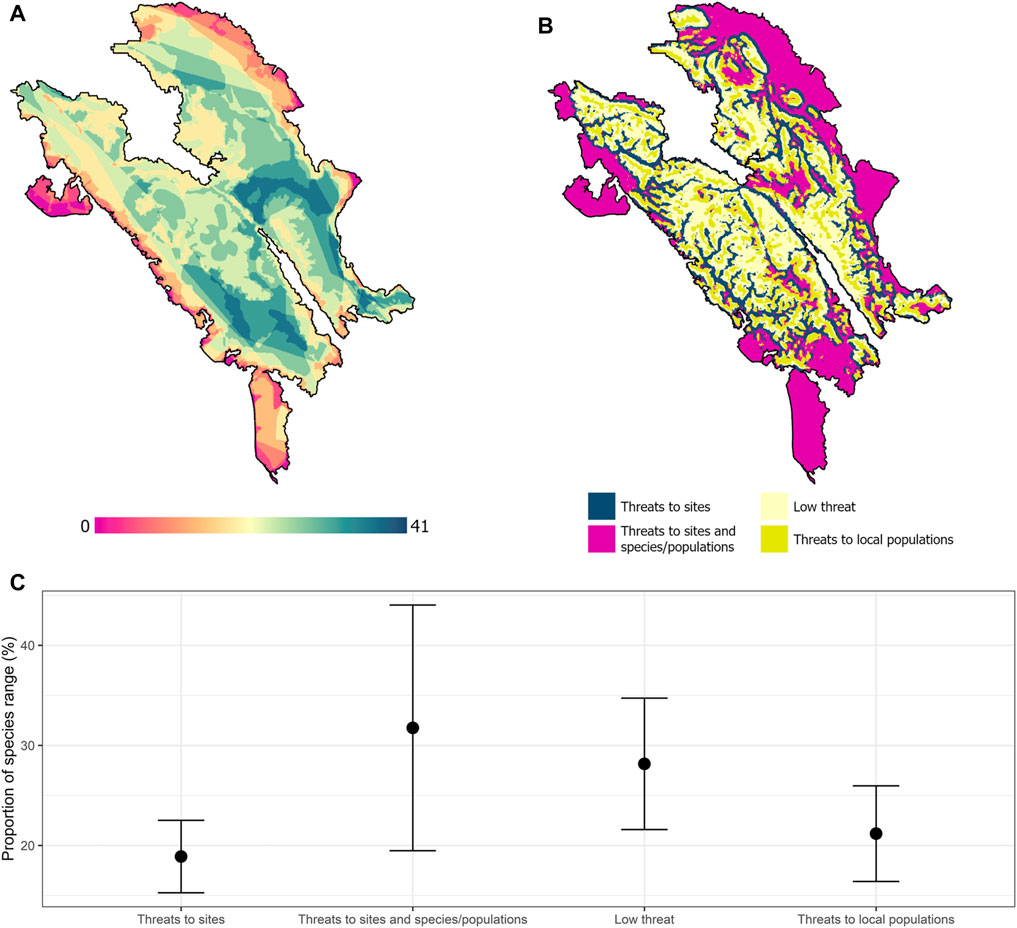
FIGURE 4. Vulnerability assessment based on forward and backward velocities until 2050 (A), current richness of mammal species in the Leuser Ecosystem (B), mean and standard deviation in the proportion of 45 species ranges in each region within the different combinations of climatic velocity (C).
All endangered mammal species within the Leuser Ecosystem will occur inside areas with a massive threat (i.e., habitat and local populations; see Figure 4A for the species richness range distribution) until 2050 from 3 to 100% of their ranges (see Supplementary Material, Supplementary Table 1). Moreover, forty-four species will maintain from 6 to 22% of their ranges in the areas with threats to sites, while a similar number of mammal species also will maintain from 16 to 41% of their ranges in the areas with threats to local populations until 2050. Furthermore, areas with low threat and potentially used as refugia can maintain mammal species from 14 to 50% of their ranges (Figure 4C). We found that agile gibbon (Hylobates agilis) will be totally out of the refugia areas and almost 100% of species range occurred in the high-risk areas. Sumatran elephant (Elephas maximus sumatranus), bare-backed rousette (Rousettus spinalatus), and Sumatran orangutan (Pongo abelii) were also the most vulnerable as they broadly occur in the areas with threats to sites and local populations as well (ranging from 33 to 51% of their ranges).
In this study, we calculated the climate change metrics and elaborated on the same (i.e., forward and backward velocities) with mammal species range information within the protected areas of the Leuser Ecosystem for identifying threats to support conservation management. We found that the protected areas of the Leuser Ecosystem have become more susceptible to climate disturbance than the unprotected areas. The results show that future mammal species will likely migrate to the unprotected areas for niche conservatism as a consequence to the global climate change. Many anthropogenic activities that can lead to habitat destruction occur outside the protected areas (Sloan et al., 2018). A previous study shows that protected areas have to protect biodiversity effectively compared with the unprotected areas (Condro et al., 2021). However, according to another research, Indonesian protected areas do not seem to be an adequate option to prevent habitat disturbance (Brun et al., 2015). Thus, identification of future biodiversity threats based on climate change metrics is an infancy step to determine conservation management planning (Carroll et al., 2015).
In response to changing climate, the distributions of endangered mammals are shifting (Parmesan and Yohe, 2003). Many studies prove that global climate change is encouraging species occurrences poleward and approaching higher altitudes, where the temperature gradient induces upward shifts more likely than poleward shifts (Colwell et al., 2008). Our results indicate that the magnitude of climate change effects will be higher on the montane areas for both temperature and precipitation in the study area. Previous studies also showed that high altitude ecosystems are considered to be more threatened (Colwell et al., 2008; Loarie et al., 2009). However, we found that the local climate extremes will be greater in the lowland regions than montane areas that indicate a novel climate, which mostly appear in the lowland tropical areas such as rainforests (Williams et al., 2007). Moreover, in the lowland areas of the Leuser Ecosystem (e.g., peatlands, mangrove forests, and lowland rainforests), where climate velocities were high, adaptation strategies should be required (Ordonez et al., 2014). Possible conservation actions in this landscape are in situ management of species and site to increase resilience (Millar et al., 2007), ex situ conservation, habitat modification through engineering (Brook et al., 2008), and species translocation (Hughes et al., 2008). In contrast, in the high altitudinal areas (e.g., montane forests), where climate velocities (i.e., both forward and backward velocity) were relatively low, adaptation strategies should be facilitated along with protecting the remaining habitat and maintaining ecosystem functions (Colwell et al., 2008).
Our analyses showed that only 28% of the Leuser Ecosystem will preserve stable climate conditions, and can be performed as climatic refugia for mammal species until 2050. Moreover, most of the mammal species occurred in high-risk areas (i.e., threats to sites, local populations, and both of them). Mammal populations within the study area can be impacted in many ways: habitat disturbance can lead to species extirpation (Kinnaird et al., 2003; Dirzo et al., 2014), local changes in climate can induce species range contractions (Condro et al., 2021), behavior and physiology, as well as decline in the reproductive rate (Bronson, 2009), and dispersal ability (Schloss et al., 2012). We found that four species (H. agilis, E. maximus, R. spinalus, and P. abelii) will be most susceptible to climate change as they occur in the areas with threats to sites and local populations. A previous study showed that P. abelii would completely suffer range contraction by 2050, while H. agilis would likely expand their ranges to maintain climatic niches (Condro et al., 2021). In areas where local populations are threatened, species monitoring is required to determine current species status and assess whether further assisted conservation interventions such as species translocations to habitat refugia are required. In addition, habitat restoration and corridor development are needed to facilitate species dispersal and to increase connectivity of the species in areas with threats to sites (Hodgson et al., 2011; Borges and Loyola, 2020).
Predicting the long-term impacts of changing climate on biodiversity is quite challenging due to the complexity of species responses toward physiological and evolutionary mechanisms and the species interaction with anthropogenic activities that lead to range contractions. In particular, tropical species are susceptible to climate change as the species already exist near their maximum thermal tolerance (Araújo et al., 2013). Future climate projections were derived from an ensemble of three different general circulation models to capture the spatio-temporal representativeness of the study area. The spatial resolution of future climate models was increased by statistical downscaling to a local scale (Wiens et al., 2009). In many cases, statistical techniques make the climate model output more realistic than the other downscaling techniques (Ehret et al., 2012; Hawkins et al., 2013). The uncertainties of the climate models used in this study were provided by Navarro-Racines et al. (2020). Furthermore, the IUCN species range dataset can also be used to create the general conservation actions since there are no adequate species occurrence data for endangered mammal species in the Leuser Ecosystem. If the occurrence data are available, a species distribution or ecological niche modeling approach can be used to assess the impacts of climate change on species.
In conclusion, we highlighted that most of the mammal species in the Leuser Ecosystem would be impacted by changing climate. The use of climate change metrics can provide valuable information on the species exposure under a changing climate and a considerable scope to inform conservation actions. Standardized anomalies and changes in the probability of climate extremes are useful to inform the magnitude of climate change mean and variation within the study area. Moreover, climatic forward velocity can inform conservation of species and locally adapted populations, respectively, and along with backward velocity, can facilitate conservation of biodiversity at multi-levels in the face of climate change. These approaches can provide broad and generic suggestions for identifying areas that are most suitable for species as refugia while considering the multifaceted future threats of climate change to support biodiversity conservation planning. Further study also should incorporate the vegetation intactness dynamics into the model to capture adaptive capacity on biodiversity and resulting detailed conservation actions for specific areas and species (Watson et al., 2013; Alagador et al., 2016).
The raw data supporting the conclusion of this article will be made available by the authors, without undue reservation.
Conceptualization: LP, AC, SR, and IS; methodology: AC, LP, IS, and EI; formal analysis: EI and LP; data curation, LP, IS, SR, and EI; and writing—original draft preparation: AC and LP.
This research was funded by the Ministry of Research and Technology of the Republic of Indonesia through PMDSU Scholarship (Grant Number: 2127/IT3. L1/PN/2021).
The authors declare that the research was conducted in the absence of any commercial or financial relationships that could be construed as a potential conflict of interest.
All claims expressed in this article are solely those of the authors and do not necessarily represent those of their affiliated organizations, or those of the publisher, the editors, and the reviewers. Any product that may be evaluated in this article, or claim that may be made by its manufacturer, is not guaranteed or endorsed by the publisher.
We would like to express our gratitude toward (1) Fábio Júlio Alves Borges, PhD in Ecology and Evolution, the Federal University of Goiás, Brazil, for providing details explanation regarding one of methodological approach of this research; (2) the Laboratory of Environmental Analysis and Geospatial Modelling, Faculty of Forestry, IPB University, for supporting this research through providing computational devices; and (3) Yudi Setiawan for inviting us to be a part of this special issue section.
The Supplementary Material for this article can be found online at: https://www.frontiersin.org/articles/10.3389/fenvs.2021.713837/full#supplementary-material.
Alagador, D., Cerdeira, J. O., and Araújo, M. B. (2016). Climate change, species range shifts and dispersal corridors: an evaluation of spatial conservation models. Methods Ecol. Evol. 7, 853–866. doi:10.1111/2041-210X.12524
Albright, T. P., Pidgeon, A. M., Rittenhouse, C. D., Clayton, M. K., Flather, C. H., Culbert, P. D., et al. (2011). Heat waves measured with MODIS land surface temperature data predict changes in avian community structure. Remote Sensing Environ. 115, 245–254. doi:10.1016/j.rse.2010.08.024
Araújo, M. B., Alagador, D., Cabeza, M., Nogués-Bravo, D., and Thuiller, W. (2011). Climate change threatens European conservation areas. Ecol. Lett. 14, 484–492. doi:10.1111/j.1461-0248.2011.01610.x
Araújo, M. B., Ferri‐Yáñez, F., Bozinovic, F., Marquet, P. A., Valladares, F., and Chown, S. L. (2013). Heat freezes niche evolution. Ecol. Lett. 16, 1206–1219. doi:10.1111/ele.12155
Booth, T. H., Nix, H. A., Busby, J. R., and Hutchinson, M. F. (2014). bioclim: the first species distribution modelling package, its early applications and relevance to most currentMaxEntstudies. Divers. Distrib. 20, 1–9. doi:10.1111/ddi.12144
Borges, F. J. A., and Loyola, R. (2020). Climate and land-use change refugia for Brazilian Cerrado birds. Perspect. Ecol. Conservation 18, 109–115. doi:10.1016/j.pecon.2020.04.002
Brito-Morales, I., García Molinos, J., Schoeman, D. S., Burrows, M. T., Poloczanska, E. S., Brown, C. J., et al. (2018). Climate Velocity Can Inform Conservation in a Warming World. Trends Ecol. Evol. 33, 441–457. doi:10.1016/j.tree.2018.03.009
Bronson, F. H. (2009). Climate change and seasonal reproduction in mammals. Phil. Trans. R. Soc. B 364, 3331–3340. doi:10.1098/rstb.2009.0140
Brook, B., Sodhi, N., and Bradshaw, C. (2008). Synergies among extinction drivers under global change. Trends Ecol. Evol. 23, 453–460. doi:10.1016/j.tree.2008.03.011
Brun, C., Cook, A. R., Lee, J. S. H., Wich, S. A., Koh, L. P., and Carrasco, L. R. (2015). Analysis of deforestation and protected area effectiveness in Indonesia: A comparison of Bayesian spatial models. Glob. Environ. Change 31, 285–295. doi:10.1016/j.gloenvcha.2015.02.004
Carroll, C., Lawler, J. J., Roberts, D. R., and Hamann, A. (2015). Biotic and climatic velocity identify contrasting areas of vulnerability to climate change. PLoS One 10, e0140486. doi:10.1371/journal.pone.0140486
Chen, I.-C., Hill, J. K., Ohlemüller, R., Roy, D. B., and Thomas, C. D. (2011). Rapid range shifts of species associated with high levels of climate warming. Science 333, 1024–1026. doi:10.1126/science.1206432
Cochard, R. (2017). “Scaling the Costs of Natural Ecosystem Degradation and Biodiversity Losses in Aceh Province, Sumatra,” in Redefining Diversity and Dynamics of Natural Resources Management in Asia (Amsterdam, Netherlands: Elsevier), 231–271. doi:10.1016/B978-0-12-805454-3.00013-X
Colwell, R. K., Brehm, G., Cardelús, C. L., Gilman, A. C., Longino, J. T., Cardelus, C. L., et al. (2008). Global Warming, Elevational Range Shifts, and Lowland Biotic Attrition in the Wet Tropics. Science 322, 258–261. Available at:. doi:10.1126/science.1162547
Condro, A. A., Prasetyo, L. B., Rushayati, S. B., Santikayasa, I. P., and Iskandar, E. (2021). Predicting Hotspots and Prioritizing Protected Areas for Endangered Primate Species in Indonesia under Changing Climate. Biology 10, 154–177. doi:10.3390/biology10020154
Dirzo, R., Young, H. S., Galetti, M., Ceballos, G., Isaac, N. J. B., and Collen, B. (2014). Defaunation in the Anthropocene. Science 345, 401–406. doi:10.1126/science.1251817
Ehret, U., Zehe, E., Wulfmeyer, V., Warrach-Sagi, K., and Liebert, J. (2012). HESS Opinions "Should we apply bias correction to global and regional climate model data?". Hydrol. Earth Syst. Sci. 16, 3391–3404. doi:10.5194/hess-16-3391-2012
Fick, S. E., and Hijmans, R. J. (2017). WorldClim 2: new 1‐km spatial resolution climate surfaces for global land areas. Int. J. Climatol 37, 4302–4315. doi:10.1002/joc.5086
Game, E. T., Lipsett-Moore, G., Saxon, E., Peterson, N., and Sheppard, S. (2011). Incorporating climate change adaptation into national conservation assessments. Glob. Chang. Biol. 17, 3150–3160. doi:10.1111/j.1365-2486.2011.02457.x
Garcia, R. A., Cabeza, M., Rahbek, C., and Araújo, M. B. (2014). Multiple dimensions of climate change and their implications for biodiversity. Science 344, 1247579. doi:10.1126/science.1247579
Gaveau, D. L. A., Wich, S., Epting, J., Juhn, D., Kanninen, M., and Leader-williams, N. (2009). The future of forests and orangutans ( Pongo abelii ) in Sumatra: predicting impacts of oil palm plantations, road construction, and mechanisms for reducing carbon emissions from deforestation. Environ. Res. Lett. 4, 034013. doi:10.1088/1748-9326/4/3/034013
Hajima, T., Watanabe, M., Yamamoto, A., Tatebe, H., Noguchi, M. A., Abe, M., et al. (2020). Development of the MIROC-ES2L Earth system model and the evaluation of biogeochemical processes and feedbacks. Geosci. Model. Dev. 13, 2197–2244. doi:10.5194/gmd-13-2197-2020
Hamann, A., Roberts, D. R., Barber, Q. E., Carroll, C., and Nielsen, S. E. (2015). Velocity of climate change algorithms for guiding conservation and management. Glob. Change Biol. 21, 997–1004. doi:10.1111/gcb.12736
Hawkins, E., Osborne, T. M., Ho, C. K., and Challinor, A. J. (2013). Calibration and bias correction of climate projections for crop modelling: An idealised case study over Europe. Agric. For. Meteorology 170, 19–31. doi:10.1016/j.agrformet.2012.04.007
Hijmans, R. J., Cameron, S. E., Parra, J. L., Jones, P. G., and Jarvis, A. (2005). Very high resolution interpolated climate surfaces for global land areas. Int. J. Climatol. 25, 1965–1978. doi:10.1002/joc.1276
Hodgson, J. A., Thomas, C. D., Cinderby, S., Cambridge, H., Evans, P., and Hill, J. K. (2011). Habitat re-creation strategies for promoting adaptation of species to climate change. Conserv. Lett. 4, 289–297. doi:10.1111/j.1755-263X.2011.00177.x
Hughes, L., Mcintyre, S., Lindenmayer, D. B., Parmesan, C., Possingham, H. P., and Thomas, C. D. (2008). U. Oceania (esp. to its colonization). Science 321, 345–346. doi:10.1515/9783110971231.345
Janssen, M. (2003). Economic valuation of the Leuser National Park on Sumatra, Indonesia. Ecol. Econ. 44, 43–62. doi:10.1016/S0921-8009(02)00224-0
Katz, R. W., Brush, G. S., and Parlange, M. B. (2005). Statistics of extremes: Modeling ecological disturbances. Ecology 86, 1124–1134. doi:10.1890/04-0606
Kinnaird, M. F., Sanderson, E. W., O'Brien, T. G., Wibisono, H. T., and Woolmer, G. (2003). Deforestation trends in a tropical landscape and implications for endangered large mammals. Conservation Biol. 17, 245–257. doi:10.1046/j.1523-1739.2003.02040.x
Le Saout, S., Hoffmann, M., Shi, Y., Hughes, A., Bernard, C., Brooks, T. M., et al. (2013). Protected areas and effective biodiversity conservation. Science 342, 803–805. doi:10.1126/science.1239268
Linkie, M., Haidir, I. A., Nugroho, A., and Dinata, Y. (2008). Conserving tigers Panthera tigris in selectively logged Sumatran forests. Biol. Conservation 141, 2410–2415. doi:10.1016/j.biocon.2008.07.002
Loarie, S. R., Duffy, P. B., Hamilton, H., Asner, G. P., Field, C. B., and Ackerly, D. D. (2009). The velocity of climate change. Nature 462, 1052–1055. doi:10.1038/nature08649
Millar, C. I., Stephenson, N. L., and Stephens, S. L. (2007). Climate change and forests of the future: managing in the face of uncertainty. Ecol. Appl. 17, 2145–2151. doi:10.1890/06-1715.1
Navarro-Racines, C., Tarapues, J., Thornton, P., Jarvis, A., and Ramirez-Villegas, J. (2020). High-resolution and bias-corrected CMIP5 projections for climate change impact assessments. Sci. Data 7, 1–14. doi:10.1038/s41597-019-0343-8
Olson, D. M., Dinerstein, E., Wikramanayake, E. D., Burgess, N. D., Powell, G. V. N., Underwood, E. C., et al. (2001). Terrestrial ecoregions of the world: A new map of life on Earth. Bioscience 51, 933–938. doi:10.1641/0006-3568(2001)051[0933:teotwa]2.0.co;2
Ordonez, A., Martinuzzi, S., Radeloff, V. C., and Williams, J. W. (2014). Combined speeds of climate and land-use change of the conterminous US until 2050. Nat. Clim Change 4, 811–816. doi:10.1038/nclimate2337
Page, S. E., Rieley, J. O., and Banks, C. J. (2011). Global and regional importance of the tropical peatland carbon pool. Glob. Chang. Biol. 17, 798–818. doi:10.1111/j.1365-2486.2010.02279.x
Parmesan, C., and Yohe, G. (2003). A globally coherent fingerprint of climate change impacts across natural systems. Nature 421, 37–42. doi:10.1038/nature01286
Riahi, K., van Vuuren, D. P., Kriegler, E., Edmonds, J., O’Neill, B. C., Fujimori, S., et al. (2017). The Shared Socioeconomic Pathways and their energy, land use, and greenhouse gas emissions implications: An overview. Glob. Environ. Change 42, 153–168. doi:10.1016/j.gloenvcha.2016.05.009
Ribeiro, B. R., Sales, L. P., De Marco, P., and Loyola, R. (2016). Assessing mammal exposure to climate change in the Brazilian Amazon. PLoS One 11, e0165073–13. doi:10.1371/journal.pone.0165073
Sales, L. P., Ribeiro, B. R., Pires, M. M., Chapman, C. A., and Loyola, R. (2019). Recalculating route: dispersal constraints will drive the redistribution of Amazon primates in the Anthropocene. Ecography 42, 1789–1801. doi:10.1111/ecog.04499
Schloss, C. A., Nuñez, T. A., and Lawler, J. J. (2012). Dispersal will limit ability of mammals to track climate change in the Western Hemisphere. Proc. Natl. Acad. Sci. 109, 8606–8611. doi:10.1073/pnas.1116791109
Sloan, S., Campbell, M. J., Alamgir, M., Collier-Baker, E., Nowak, M. G., Usher, G., et al. (2018). Infrastructure development and contested forest governance threaten the Leuser Ecosystem, Indonesia. Land use policy 77, 298–309. doi:10.1016/j.landusepol.2018.05.043
Stewart, S. B., Elith, J., Fedrigo, M., Kasel, S., Roxburgh, S. H., Bennett, L. T., et al. (2021). Climate extreme variables generated using monthly time‐series data improve predicted distributions of plant species. Ecography 44, 626–639. doi:10.1111/ecog.05253
Suggitt, A. J., Gillingham, P. K., Hill, J. K., Huntley, B., Kunin, W. E., Roy, D. B., et al. (2011). Habitat microclimates drive fine-scale variation in extreme temperatures. Oikos 120, 1–8. doi:10.1111/j.1600-0706.2010.18270.x
Tatebe, H., Ogura, T., Nitta, T., Komuro, Y., Ogochi, K., Takemura, T., et al. (2019). Description and basic evaluation of simulated mean state, internal variability, and climate sensitivity in MIROC6. Geosci. Model. Dev. 12, 2727–2765. doi:10.5194/gmd-12-2727-2019
Warren, M., Hergoualc’h, K., Kauffman, J. B., Murdiyarso, D., and Kolka, R. (2017). An appraisal of Indonesia's immense peat carbon stock using national peatland maps: uncertainties and potential losses from conversion. Carbon Balance Manage 12, 12. doi:10.1186/s13021-017-0080-2
Watson, J. E. M., Iwamura, T., and Butt, N. (2013). Mapping vulnerability and conservation adaptation strategies under climate change. Nat. Clim Change 3, 989–994. doi:10.1038/nclimate2007
Weiskopf, S. R., McCarthy, J. L., McCarthy, K. P., Shiklomanov, A. N., Wibisono, H. T., and Pusparini, W. (2019). The conservation value of forest fragments in the increasingly agrarian landscape of Sumatra. Envir. Conserv. 46, 340–346. doi:10.1017/S0376892919000195
Wich, S. A., Singleton, I., Nowak, M. G., Utami Atmoko, S. S., Nisam, G., Arif, S. M., et al. (2016). Land-cover changes predict steep declines for the Sumatran orangutan (Pongo abelii). Sci. Adv. 2, e1500789–9. doi:10.1126/sciadv.1500789
Wiens, J. A., Stralberg, D., Jongsomjit, D., Howell, C. A., and Snyder, M. A. (2009). Niches, models, and climate change: Assessing the assumptions and uncertainties. Proc. Natl. Acad. Sci. 106, 19729–19736. doi:10.1073/pnas.0901639106
Williams, J. W., Jackson, S. T., and Kutzbach, J. E. (2007). Projected distributions of novel and disappearing climates by 2100 AD. Proc. Natl. Acad. Sci. 104, 5738–5742. doi:10.1073/pnas.0606292104
Keywords: climate change, biodiversity, tropical landscape, mammal, conservation
Citation: Condro AA, Prasetyo LB, Rushayati SB, Santikayasa IP and Iskandar E (2021) Measuring Metrics of Climate Change and Its Implication on the Endangered Mammal Conservation in the Leuser Ecosystem. Front. Environ. Sci. 9:713837. doi: 10.3389/fenvs.2021.713837
Received: 24 May 2021; Accepted: 26 August 2021;
Published: 30 September 2021.
Edited by:
Mohamed Kefi, Centre de Recherches et des Technologies des Eaux, TunisiaCopyright © 2021 Condro, Prasetyo, Rushayati, Santikayasa and Iskandar. This is an open-access article distributed under the terms of the Creative Commons Attribution License (CC BY). The use, distribution or reproduction in other forums is permitted, provided the original author(s) and the copyright owner(s) are credited and that the original publication in this journal is cited, in accordance with accepted academic practice. No use, distribution or reproduction is permitted which does not comply with these terms.
*Correspondence: Aryo Adhi Condro, condroadhi@apps.ipb.ac.id
Disclaimer: All claims expressed in this article are solely those of the authors and do not necessarily represent those of their affiliated organizations, or those of the publisher, the editors and the reviewers. Any product that may be evaluated in this article or claim that may be made by its manufacturer is not guaranteed or endorsed by the publisher.
Research integrity at Frontiers
Learn more about the work of our research integrity team to safeguard the quality of each article we publish.