 Kai-rong Hong1
 Dong-xiao Yang
 Minxing Jiang
- 1Business School, Central South University, Changsha, China
- 2School of Economics and Trade, Hunan University, Changsha, China
- 3School of Business, Nanjing University of Information Science and Technology, Nanjing, China
- 4Development Institute of Jiangbei New Area, Nanjing University of Information Science and Technology, Nanjing, China
Urban air quality, which is related to the health of local residents of the Pearl River Delta Region, China, (PRD) has been a hot topic among the masses and academic circles. In addition to economic growth, China’s rapidly increasing urbanization rate has also brought great pressure on urban air quality, in the Region, where due to its huge economic size and population, urban air quality has become the focus of local residents. This study first analyzed the spatio-temporal trends and correlation of land use and PM2.5 average annual concentration, which represents air quality in the PRD from 2000 to 2018, and according to Moran index, PM2.5 concentration in this area has spatial correlation in the study time. Secondly, the spatial error model of the PRD was constructed by using spatial effect, spatial modeling theory and spatial model estimation. The spatial-temporal evolution and influencing factors of PM2.5 concentration were discussed in fixed overall effect. The results showed that the area of cultivated land in the PRD decreased and the area of artificial surface increased year by year, while the PM2.5 concentration increased first and then decreased. In addition, the area of cultivated land and forestland were negatively correlated, while the area of grassland and water body were positively correlated with PM2.5 concentration. The conclusion of this study has a certain theoretical reference for urban land use planning and air quality assurance.
Introduction
China’s urbanization rate has risen from 10 percent in 1949 to more than 60 percent by the end of 2020. In addition to economic growth, the rapidly increasing urbanization rate also puts great pressure on the urban environment. The rapid growth of urbanization has brought about great changes in China’s land use pattern. A large amount of land has been used for urban construction and vegetation has been replaced by artificial surface (Zhang et al., 2016), which led to a series of air quality problems. Changes in land cover, responding to both human forcing and natural factors, play a key role in modulating air quality and changing climate (Heald & Spracklen, 2015). Outdoor air pollution ranked ninth in the world and fourth in China among the top 20 major risk factors for death globally in 2010 (Zheng et al., 2017). The problem of air pollution has posed a huge threat to the public health in Chinese cities (Yuan et al., 2018; Chen et al., 2020), which has become the focus of public concern and has also aroused widespread concern in the international community. Air quality can be judged according to the concentration of pollutants in the air. The smaller the diameter of inhalable particles in the air, the deeper they enter the respiratory tract. Therefore, PM2.5 concentration was used in this study to illustrate the air quality. PM2.5 refers to airborne particles with an aerodynamic diameter of less than 2.5 μm,. This has posed serious threats to human health and the atmospheric environment (Hao and Liu, 2016). Compared with other air pollutants, because of its small size, strong adsorption, complex composition, carrying poisonous and harmful substances (such as heavy metals, microbiology, etc.), the characteristics of long duration of stay in the air and long transmission distance, PM2.5 is easy to be absorbed by the body’s respiratory tract and lungs and greatly affect the human health and atmospheric environment quality. PM2.5 pollution is an environmental problem in cities around the world. For China, its extensive development mode has brought various environmental problems. Of the 350 prefectures in China, only 23 met WHO (World Health Organization) guidelines for air quality (AQG; 10 μg/m3), and 165 prefectures had annual PM2.5 concentrations higher than the WHO Interim Target-1 (IT-1; 35 μg/m3) based on annual averaged measurements during 2001–2006 (He et al., 2016). In late 2012, the Chinese government recognized the dangers of environmental pollution, especially PM2.5 pollution, and began to deploy a nationwide automatic air quality monitoring network. As PM2.5 pollution is getting more and more serious in China, at the end of December 2012, the PM2.5 concentration of each city began to be published in real time, and the new ambient air quality standards were released, adding PM2.5 as a routine monitoring index. PM2.5 has become a key object of air pollution research and prevention and control in China in the future. The new standard required a PM2.5 concentration limit of 35 μg/m3 in residential areas, mixed areas with commercial traffic residents, cultural areas, industrial areas and rural areas (Class II areas). However, past studies have shown that rapid urbanization and industrialization are important causes of air pollution in China (Yuan et al., 2018).
City Cluster is an important spatial form of China’s new-type of urbanization (Fang&Yu, 2017), reflecting China’s flourishing but imperfect urbanization process (Yan, et al., 2021). Although China has made significant achievements in rapid urbanization, different levels of urbanization -- that is, urbanization of land, population and economy -- are progressing at different rates (Du et al., 2019), therefore, the degree of air pollution is also very different. So far, China’s State Council has approved a total of 10 state-level city clusters, but each has its own characteristics, with large differences in area, total population, economic size and land use structure. The efficiency of the urbanization process in the Pearl River Delta Region (PRD) is obviously higher than that of other city clusters in the late 21st century (Du et al., 2018). Taking the PRD in China as an example, this paper analyzes the evolution characteristics of land use patterns and the variation characteristics of PM2.5 concentration in this region from 2000 to 2018. Based on spatial effect, spatial modeling theory and spatial model estimation, a spatial error model is constructed. The spatio-temporal evolution of urban air quality and its influencing factors were discussed in three dimensions of fixed time effect, fixed individual effect and fixed total effect.
Literature Review
In recent years, studies on PM2.5 mainly focus on its source and composition (Martuzevicius et al., 2004; Xu et al., 2014), spatio-temporal distribution (Lu et al., 2017; Mi et al., 2020) and concentration prediction (Mao et al., 2012; Yang et al., 2018a; Zhang et al., 2018; Stafoggia et al., 2019; Wong et al., 2021) to seek measures to reduce the negative effects of PM2.5 by clarifying its chemical composition and sources. At the same time, many factors have been proved to have a certain influence on PM2.5 concentration. Researchers have identified factors such as energy consumption, land use, transport emissions, industrial structure, tourism development, population agglomeration, urbanization, and climatic conditions as major drivers of PM2.5 concentration (Du et al., 2019; Lu et al., 2020; Mi et al., 2020; Shao et al., 2020; Zeng et al., 2021). Hao & Liu (2016) used Spatial Lag Model (SLM) and Spatial Error Model (SEM) models to investigate the effects of social and economic development indicators such as per capita GDP, industry and traffic on air quality. The results show that PM2.5 concentration has an inverted U-shaped relationship with per capita GDP, and the number of motor vehicles and the secondary industry have a significant positive impact on it. Wang and Li (2021) found that environmental regulation has a significant negative impact on PM2.5 pollution, and urban consistency factors such as technological innovation, industrial structure adjustment, geographical location, city size, and resource endowment all indirectly affect the pollution control and haze reduction effects of environmental regulation.
There are also many studies on urban land use and urban expansion. For example, Liu et al. (2014) analyzed the basic spatio-temporal characteristics of land use change in China since the early 1990s from the national level, and found that the trend of land use in China showed that the total amount of cultivated land remained basically unchanged, construction land increased year by year, forest land decreased first and then increased, and grassland continued to decrease. Ning et al. (2018) revealed the spatio-temporal characteristic of land-use changes across China during 2010–2015 using dynamic degree model, annual land-use changes ratio etc. The results showed that the construction land increased and the total area of cultivated land, forestland and grassland decreased. According to Cheng et al. (2020), population urbanization, land urbanization and economic urbanization have a significant impact on PM2.5, and PM2.5 in the Yangtze River Delta has a significant positive spatial autocorrelation and spillover effect. The study of Ouyang et al. (2021) confirmed that different development levels of cities have a significant impact on PM2.5 concentration, but for different urban agglomerations, the impact of land form parameters on PM2.5 is different.
A growing number of scholars have also studied the effects of urbanization or land use change on PM2.5 or air pollutants. Yang et al. (2018b) studied the spatial distribution, temporal variation and evolutionary relationship between global urbanization and PM2.5 based on the data of global urban population proportion and PM2.5 concentration from 1998 to 2015. The results showed that PM2.5 showed an increasing trend with urbanization, but there were various evolutionary relationships in different countries and regions. In terms of research on this issue, the situation of Chinese cities is very different from that of European and American cities. Therefore, it is necessary to fully investigate the actual situation of Chinese cities, which requires empirical research based on pollution data and urban spatial data (Yuan et al., 2018). Du et al. (2018) studied the impact of rapid urbanization on local PM2.5 in China’s Beijing-Tianjin-Hebei, Yangtze River Delta and PRD from 2000 to 2010, and their conclusions showed that the direct effect and spillover effect of urbanization on PM2.5 concentration were different among city clusters and changed over time. Zheng et al. (2017) took Hangzhou, China as an example to analyze the relationship between air pollutants, including PM10, PM2.5, O3, SO2, NO2 and CO, and land use/land cover change. Wu et al. (2015) studied the impact of Beijing’s urban landscape patterns on PM2.5 by using correlation analysis and progressive multiple regression, and the results showed that vegetation and water body played an important role in reducing the concentration of PM2.5. Lin et al. (2020) took Jiangsu Province in the Yangtze River Delta of China as the research object, and explored the influence of land use on PM2.5 concentration and removal, and the results showed that forest land and industrial land had a greater influence on PM2.5 concentration than other land use types. Shao et al. (2020) analyzed the relationship between land use structure and PM2.5 concentration in Hebei Province, China, and the results showed that there was a significant spatial positive autocorrelation of PM2.5 concentration in all cities in Hebei Province, while land use intensity, land investment level and land use structure were positively correlated with PM2.5 concentration.
It can be seen from previous studies that, for different regions, land use structure has slightly different influences on local air quality, but it has similar influence trends and characteristics. More and more scholars have studied the relationship between urban land use and PM2.5 concentration, but relatively few have analyzed and explained it by means of spatial metrology. In this paper, the Moran index was used to analyze the spatial autocorrelation of PM2.5 concentration, and an SEM model was built to analyze the relationship between land use structure and PM2.5 concentration in the PRD.
Spatio-Temporal Evolution of PM2.5 and Land Use in the Pearl River Delta
Study Area
The area studied in this paper is the PRD region of China. The PRD is located in the south-central part of Guangdong Province, covering nine cities: Guangzhou, Foshan, Zhaoqing, Shenzhen, Dongguan, Huizhou, Zhuhai, Zhongshan and Jiangmen (as seen Figure 1). The geographic coordinates of the PRD are 21°31′-23°10′N, 112°45′-113°50′E, with a total area of 55,368.7 square kilometers, which gathers 53.35% of the population and 79.67% of the economic aggregate of Guangdong Province. As an important economic center in China, the PRD region is one of the three city clusters with the largest population, the strongest innovation ability and the strongest comprehensive strength in China. According to data from the National Bureau of Statistics of China, the GDP of the PRD in 2020 was 8,937.895-billion-yuan, accounting for about 8.8 percent of the country’s economic aggregate. Nowadays, driven by China’s national strategy, the PRD is working with Hong Kong and Macao to build the Guangdong-Hong Kong-Macao Greater Bay Area, making it one of the world’s four major Bay Areas, alongside the New York Bay Area and the San Francisco Bay Area of the United States and the Tokyo Bay Area of Japan.
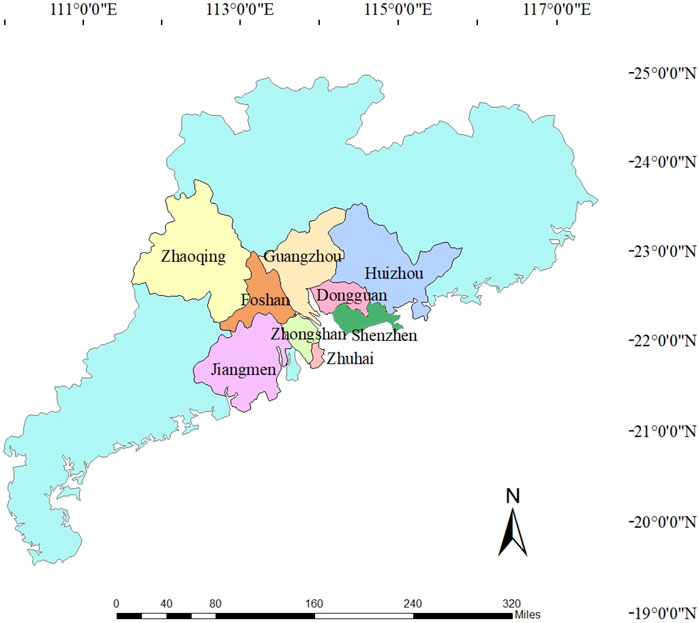
FIGURE 1. Geographical location of Pearl River Delta region.
The air quality in the PRD region is generally good, but with the rapid economic development, the air quality in the PRD region is also under great pressure due to the surge in population and energy consumption. At the same time, as the PRD region accounts for less than one third of the total area of Guangdong Province and has limited land resources, it is of vital importance to improve the air quality by rationally allocating land resources so as to play the role of land use types in reducing PM2.5 concentration.
Data
PM2.5 data used in this study are derived from the estimation of China region by the atmospheric composition analysis group of Dalhousie University (V4.CH.03), and the statistical period is from 2000 to 2018 (http://fizz.phys.dal.ca/∼atmos/martin/?page_id=140#V4.CH.03). Van Donkelaar and his team combined Aerosol Optical Depth (AOD) data from NASA MODIS, MISR, and SeaWIFS instruments with the GEOSchem chemical transport model, and used Geographically-Weighted Regression (GWR) to calibrate the total and component masses for regional ground observations. This data has been confirmed by numerous studies to be consistent with ground monitoring data, and can be used for PM2.5 research in China (DU, 2020). The data was raster processed and matched with the mean concentration data of the prefecture-level cities in the PRD.
The data of land use patterns for the PRD region come from the Resource and Environment Science and Data Center (http://www.resdc.cn/Default.aspx), which is set up by the Institute of Geographic Sciences and Natural Resources Research, Chinese Academy of Sciences. In this study, remote sensing monitoring data of land use in 2000, 2005, 2010, 2015 and 2018 were extracted. The data were based on Landsat 8 remote sensing images and generated through manual visual interpretation. The data is 1 km raster data. Remote sensing monitoring data of China’s land use status is the most accurate data product of land use in China at present, and has played an important role in China’s land resource survey, hydrology and ecological research. It has successively supported major applications such as the national scientific and technological planning for the development of the western region and the post-disaster assessment of Wenchuan earthquake in 2008, and achieved remarkable social and economic benefits. This paper divides land use patterns into six types according to the research needs: Cultivated land, Forestland, Grassland, Water body, Artificial surfaces and Unused land.
Spatio-Temporal Evolution of PM2.5 in the Pearl River Delta
From 2000 to 2018, the PM2.5 concentration in the PRD region showed an overall trend of increasing at first and then decreasing. The concentration of PM2.5 in the PRD region was relatively low between 2000 and 2002, but only a few times and a few cities reached the 35 μg/m3 limit set by the Ministry of Ecology and Environment of China. The concentration of PM2.5 in the PRD increased year by year from 2003 to 2008, reaching the highest level in 2008. Almost all the cities exceeded 35 μg/m3, and Foshan and Zhongshan even exceeded 50 μg/m3. Since 2009, the concentration of PM2.5 in the PRD region has been declining year by year, and by 2015, nine cities in the region had met the PM2.5 concentration limit required by the Ambient Air Quality Standard. Figure 2 shows the inter-annual variation of PM2.5 concentrations in nine cities in the PRD region from 2000 to 2018. It can be seen that the annual minimum and maximum PM2.5 concentrations in different cities differ greatly, which indicates that the generation or emission intensity of PM2.5 varies greatly among different cities.
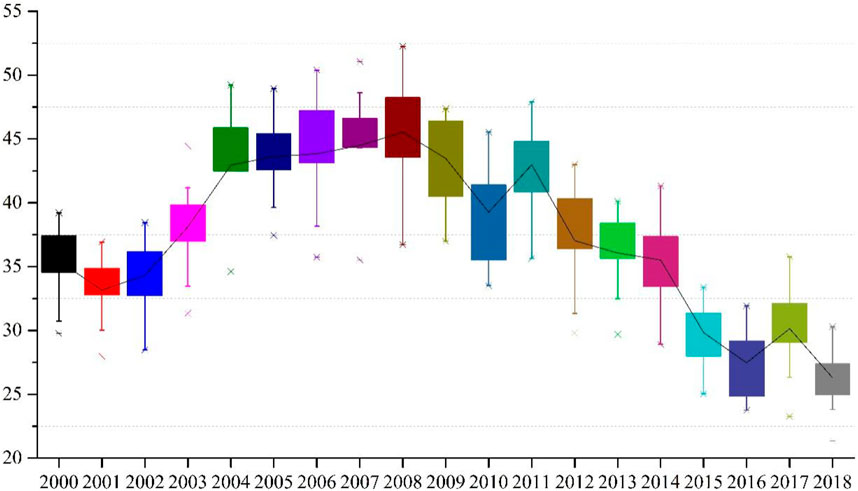
FIGURE 2. Interannual variation of PM2.5 concentration in the Pearl River Delta from 2000 to 2018.
Figure 3 shows that among the nine cities in the PRD region, Huizhou and Shenzhen had the best air quality, especially Huizhou, where PM2.5 levels fell below 35 μg/m3 in nearly 70 percent of the years, meeting the air quality limit. Among the nine cities in the PRD region, Huizhou always has the lowest PM2.5 concentration. The second is Shenzhen. The concentration of PM2.5 in Shenzhen was below 35 μg/m3 nearly 65 percent of the years. The cities with the highest PM2.5 concentrations were Foshan, Zhongshan and Jiangmen. Among them, the PM2.5 concentration in Foshan exceeded 35 μg/m3 from 2000 to 2014, especially in the 3 years from 2006 to 2008, the PM2.5 concentration in Foshan exceeded 50 μg/m3, which affected the health of local residents to a certain extent. In Zhongshan and Jiangmen, PM2.5 concentrations exceeded 35 μg/m3 nearly 75% of the years, indicating that the air quality in these two cities is relatively poor among the nine cities in the PRD region.
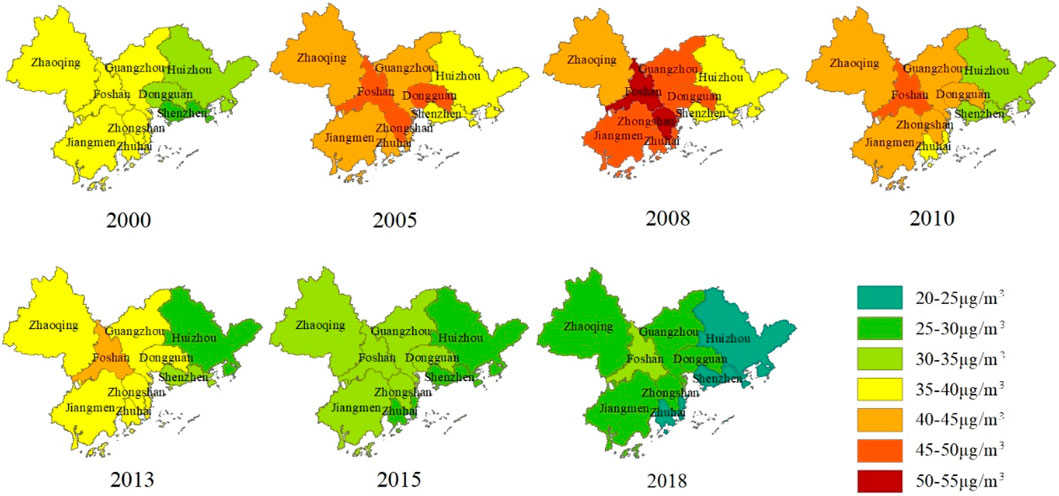
FIGURE 3. PM2.5 concentration distribution in the Pearl River Delta region from 2000 to 2018.
Spatio-Temporal Evolution of Land Use in the Pearl River Delta
ArcGIS10.7 was used to extract the land use status map of PRD in 2000, 2005, 2010, 2015 and 2018 (Figure 4). From the perspective of overall spatial distribution, cultivated land, forestland, water body and artificial surface are the dominant land use types in the study area, while grassland and unused land are relatively small. Among them, cultivated land is mainly distributed in Guangzhou, Foshan, Huizhou and Jiangmen. Forestland is mainly distributed in Zhaoqing, Huizhou and Jiangmen, which have a relatively large total area and are located in the edge of the PRD region. The artificial surface is mainly located in Guangzhou, Dongguan, Foshan, Shenzhen and Huizhou, showing a trend of continuous development.
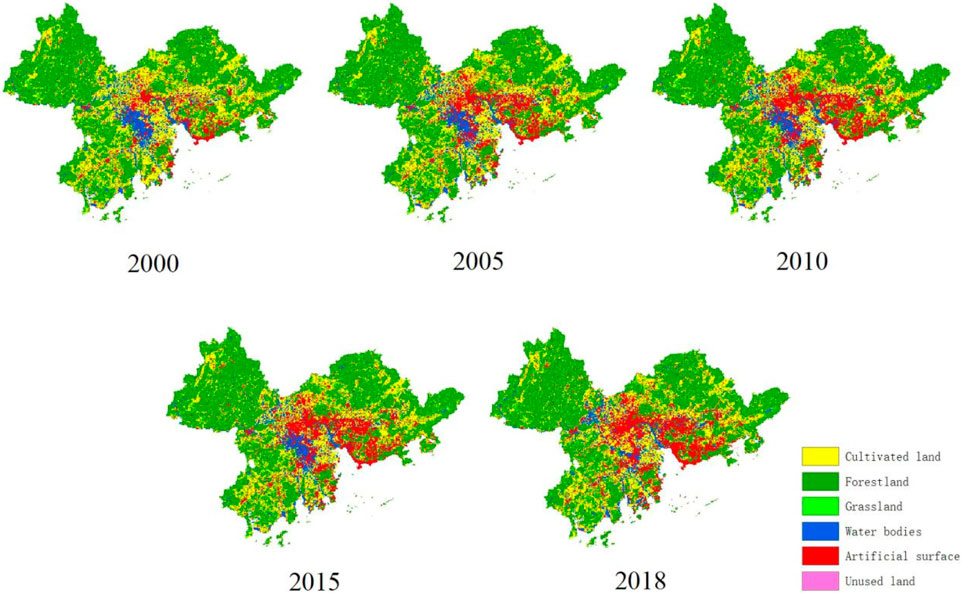
FIGURE 4. Land use change trend in the Pearl River Delta from 2000 to 2018.
Table 1 shows the land area and change trend of various types of land from 2000 to 2018. It can be found that the land use structure in the PRD region has undergone profound changes during this period, which is highlighted by the expansion of artificial surface and the decrease of cultivated land area. The decrease of cultivated land mainly occurred from 2000 to 2005, with a decrease of 2.01 percent. In 2005, the General Office of the State Council of China issued the Measures for the Assessment of the Objectives of the Cultivated Land Protection Responsibility of Provincial Governments, which clearly stipulated that the provincial people’s governments were responsible for the amount of cultivated land and the protected area of basic farmland within their respective administrative areas. Since then, the cultivated land protection work has achieved remarkable results, with the reduction of cultivated land in 2010, 2015 and 2018 decreasing year by year, basically achieving the cultivated land protection target. The changes in forestland, grassland and water body were relatively small, and the area of unused land has nearly doubled from 40 km2 in 2000 to 78 km2 in 2018.
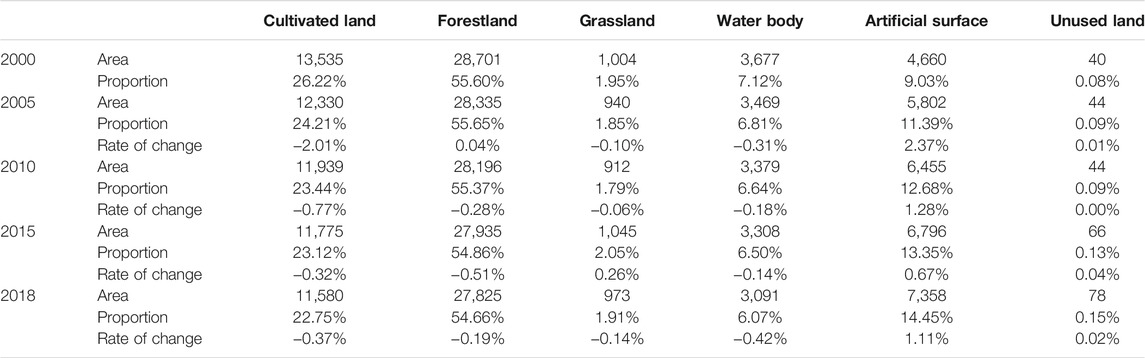
TABLE 1. Statistics on area and change of land in the Pearl River Delta from 2000 to 2018 ( km2).
The area of artificial surface increased year by year from 2000 to 2018, with a total increase of 57.9 percent. As an important place for human activities, artificial surface is a necessary land type for economic development. The area of the PRD region is the smallest among the 10 national city clusters in China. Therefore, due to its limited land resources, the other types of land are need to be transformed into artificial surface for construction and economic activities. Therefore, the area of artificial surface experienced a considerable change from 2000 to 2018. From 2000 to 2005, the artificial surface increased at a rate of 228 km2 per year. However, since 2005, due to the strict national requirements for the protection of cultivated land in various provinces, only a limited amount of new artificial surface has been added, increasing at a rate of 111 km2 per year. However, in general, the artificial surface area increased year by year, with a relatively high growth rate from 2000 to 2005 and a slower growth rate from 2005 to 2018.
Analysis of Influencing Factors of PM2.5 Concentration Based on Spatial Error Model
Under the background of sustainable development concept and ecological civilization construction, urban air quality has a significant impact on people’s life. Accurately mastering the influencing factors of urban air quality is of great significance to how to control air pollution and improve urban air quality. This section will use spatial effect, spatial modeling theory and spatial model estimation to build a spatial error model for the Pearl River Delta region of China, and discuss the spatial and temporal evolution of PM2.5 concentration and influencing factors from fixed overall effect.
Spatial econometrics can be used to investigate data with spatial correlation, and the spatial regression model is a classic model in spatial econometrics, in which the region, location and spatial-related influences are integrated to study various characteristics caused by space (Shao et al., 2020). Spatial lag model (SLM), spatial error model (SEM) and spatial Durbin model (SDM) are widely used spatial econometric models. Obviously, in the process of analysis in this paper, we found that air pollution has significant spatial correlation, so it is suitable to use spatial regression model. In addition, considering the spillover effect of air pollution between neighboring cities, this paper uses the spatial error model (SEM) to analyze the spatio-temporal relationship of PM2.5 concentration in the PRD region affected by land use.
Autocorrelation Analysis of Spatio-Temporal Evolution of Urban PM2.5
Global Spatial Autocorrelation Test
In this paper, Stata 13 was used to calculate Global Moran’s Ⅰ index and conduct spatial autocorrelation test for PM2.5 of nine cities in the PRD region in China. Since the data used in this analysis are from nine cities in the PRD region, and each city has a common boundary between them, this paper uses the adjacency-based method to construct the spatial weight matrix. The specific method is to create a 9 × 9 0–1 matrix based on the map of the PRD by adopting the Rook Contiguity method, in which the diagonal elements are all 0 and the adjacent elements are 1. Thus, Moran’s Ⅰ index of city PM2.5 in the PRD region from 2000 to 2018 can be calculated, as shown in Table 2.
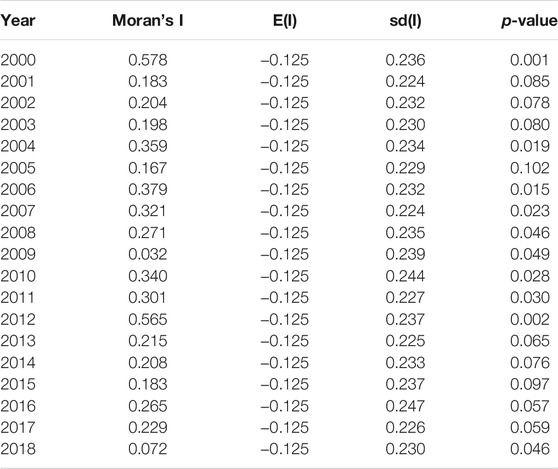
TABLE 2. Moran’s Ⅰ index of PM2.5 in the Pearl River Delta region.
As can be seen from Table 2, besides 2005, Moran’s Ⅰ index of PM2.5 in the PRD region was all positive from 2000 to 2018, and it was significant at the level of 1 percent, which indicated that the urban air pollution in the nine cities in the PRD region showed a significant positive correlation or spatial dependence geographically. In other words, cities with high PM2.5 concentrations may have an impact on the air quality of nearby cities. In a word, urban air quality has certain clustering phenomenon in geographical space.
Local Space Autocorrelation Test
Based on the above research results of the global spatial autocorrelation test, it is proved that there is a spatial concentration phenomenon of PM2.5 in the PRD region, but the analysis results do not provide the spatial agglomeration characteristics of PM2.5. Therefore, this section considers using the Moran Scatter Diagram to analyze the spatial agglomeration characteristics of the PRD region. In order to more effectively compare the concentration characteristics of PM2.5, the Moran scatter plots of the PRD region in 2000, 2005, 2010 and 2015 are presented in Figures 5–8 in this paper.
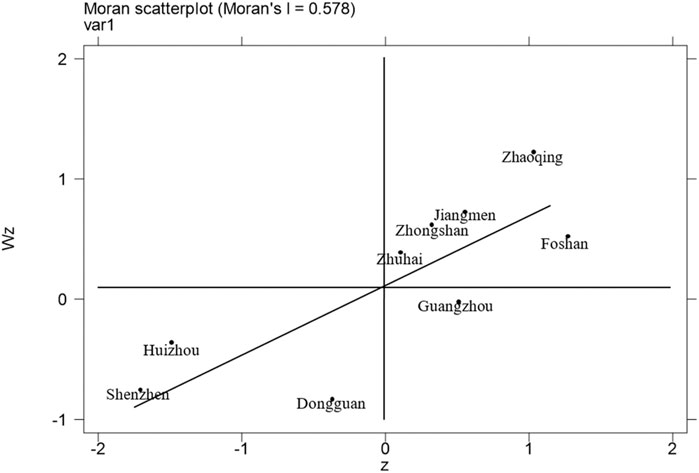
FIGURE 5. Moran scatter plot of PM 2.5 in the Pearl River Delta region in 2000.
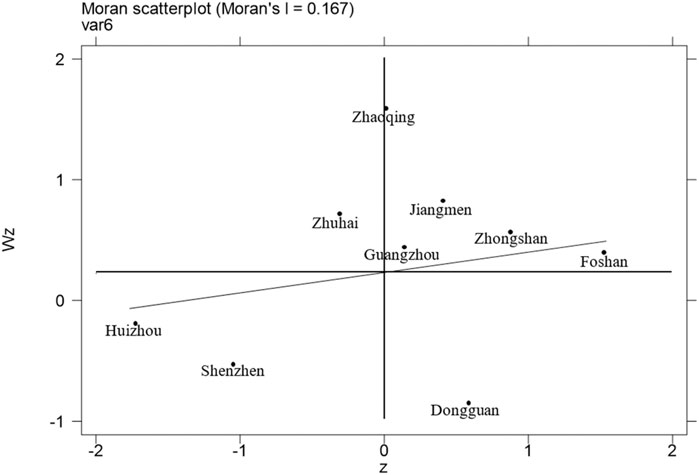
FIGURE 6. Moran scatter plot of PM 2.5 in the Pearl River Delta region in 2005.
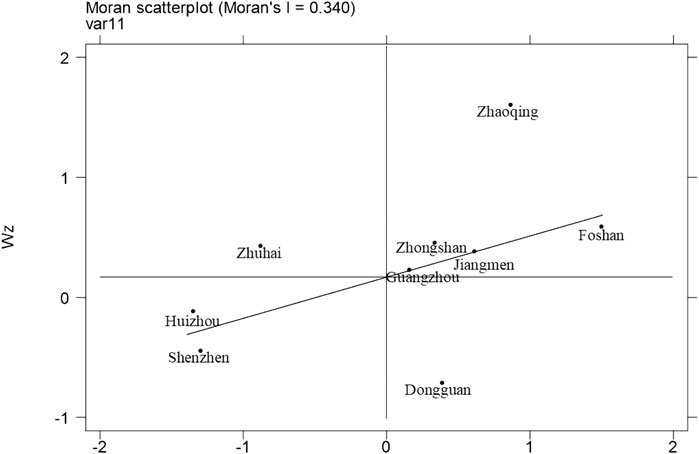
FIGURE 7. Moran scatter plot of PM 2.5 in the Pearl River Delta region in 2010.
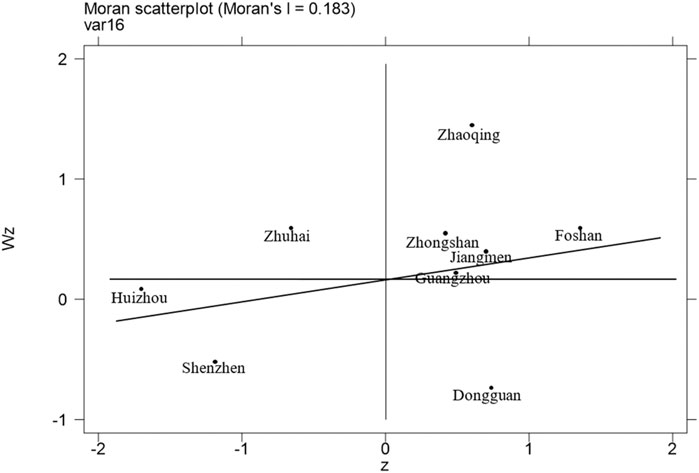
FIGURE 8. Moran scatter plot of PM 2.5 in the Pearl River Delta region in 2015.
As can be seen from Figures 5–8, Zhongshan, Foshan, Jiangmen and Zhaoqing are basically located in the first quadrant of the Moran Scatter Diagram with high-high type of positive autocorrelation (H-H type). The two adjacent coastal cities of Huizhou and Shenzhen are basically located in the third quadrant of Moran Scatter Diagram with low-low type of positive autocorrelation (L-L type). Zhuhai which is a coastal city is located in the second quadrant. Compared with the inland cities, its air quality is better, which leads to a low-high type of negative autocorrelation (L-H type). Dongguan is located in the fourth quadrant, which may be due to its inland location and the concentration of industry in the PRD region, surrounded by three coastal cities of Guangzhou, Shenzhen and Huizhou with good air quality, leading to its high-low type of negative autocorrelation (H-L type). As can be seen from the Moran scatter plot, the local Moran index of most cities is located in the first and third quadrants, which indicates that the air pollution between cities has a significant spatial spilt effect. In other words, it indicates that a city with better air quality will promote the reduction of pollutants in its surrounding areas. And a city with poor air quality will increase air pollutants in its surrounding areas.
Quantitative Analysis of Spatio-Temporal Evolution of Urban Air Quality
Model Setting and Data Source
In this section, the influencing factors of urban air quality are empirically analyzed, and the specific setting model is as follows:
Where
Pm25——the urban PM2.5 concentration (μg/m3) represents the air quality of a city; AREA——urban administrative area (km2); PD——urban population density (people/km2); AP——annual rainfall ( mm); PI——proportion of output value of the primary industry (%), the primary industries mainly refer to agriculture and related industries, including planting, forestry, animal husbandry and fishing; SI——proportion of output value of the secondary industry (%), the secondary industry mainly refers to industry and construction, including extraction, manufacturing, and the production and supply of electricity, gas and water; TI——proportion of output value of the tertiary industry (%), the tertiary industry mainly refers to other industries other than primary and secondary industries, including circulation sector and service sector; CL——area of urban cultivated land (km2); FL——area of urban forestland (km2); GL——area of urban grassland (km2); WB——area of urban water body (km2); AS——area of urban artificial surface (km2); UL——area of urban unused land (km2); SEC——total social annual electricity consumption (100 million/kWh); GDV——total civil vehicles.
Different from most researches on related problems using cross-section data or time series method, panel data is adopted in this study for the main reasons: On the one hand, panel data can significantly increase the sample size, enhance the conviction of empirical results, and make the measurement results more reliable; on the other hand, the use of panel data can control unobservable individual heterogeneity, and the use of larger, three-dimensional information reduces the possibility of commonality between variables.
In this paper, the panel data of nine prefecture-level cities in the PRD region in China from 2000 to 2018 were selected as the analysis samples. All data were compiled and calculated by the Atmospheric Composition Analysis Group of Dalhousie University, Institute of Geographic Sciences and Natural Resources Research, China Environmental Statistical Yearbook, Guangdong Statistical Yearbook, Statistical Yearbook of each cities and government statistical bulletin of various prefectures.
Estimation in Spatial Error Model
PM2.5 concentration to quantify urban air quality, and by the analysis of the previous section, there is spatial autocorrelation in PM2.5 concentration, so here we think that the disturbance in one space will affect other spaces with the spatial effect. Therefore, this paper selects spatial error model for the regression analysis of the research topic. Table 3 presents the spatial effect test results of the spatial error model. Meanwhile, in order to make the results more robust, Model 1 and Model 2 in Table 3 respectively estimate the model under different parameter settings.
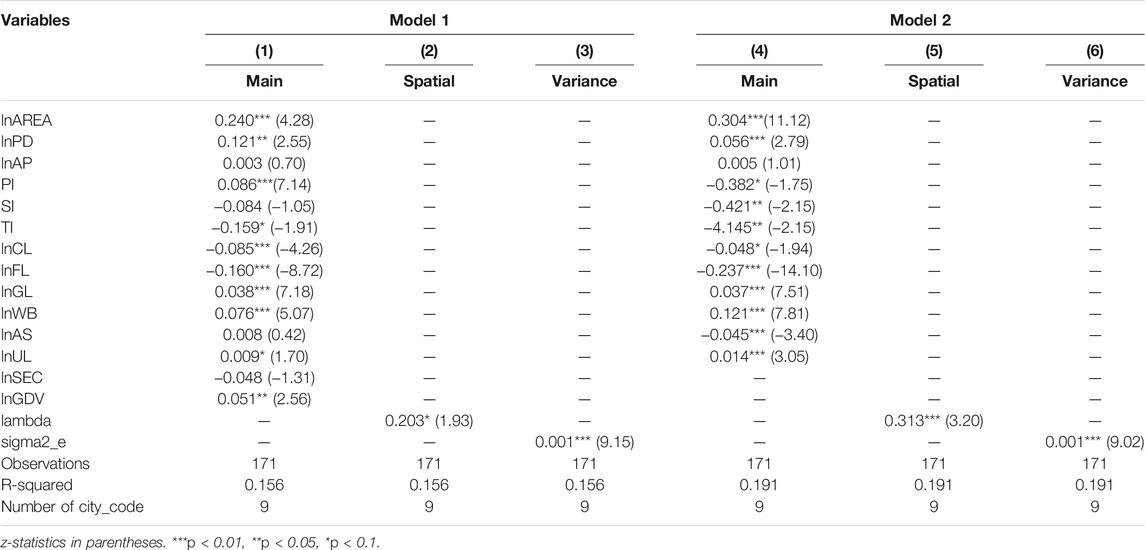
TABLE 3. The estimation results of the spatial error model.
Table 3 reports the results of estimation under spatial error model of urban land use types and the spatial evolution of urban PM2.5 concentration. The estimated results show that PM2.5 concentration is negatively correlated with urban cultivated land area and forest land area, and it is significant at the 1 percent level. This is because both cultivated land and forestland have ecological functions, and their above-ground bearing materials can absorb precursors of PM2.5 and emit dust through their own forms to inhibit PM2.5. In terms of impact effect, each 1 percent increase of cultivated land area will reduce the PM2.5 concentration by 0.085 percent, while each 1percent increase of forestland area will reduce the PM2.5 concentration by 0.16 percent, which fully shows that forest land will play a more important role in improving urban air quality. The conclusion that there is a negative correlation between urban forest land and PM2.5 is consistent with the research conclusion of Lin et al. (2020) on the spatial relationship between urban forest and PM2.5 in 255 cities in China.
However, at the same time, our study found that the proportion of primary industry has a positive effect on urban PM2.5. We think this may be because the PRD region is one of the most economically developed regions in China. Its pillars are industry and service industries, and various environmental protection works are among the top in the country. Cities with a high proportion of primary industry in this region mean that their economic development is relatively backward compared with other cities in the PRD region, which leads to a certain lag in environmental protection work. At the same time, the areas with developed primary industry are mostly located in the inland. Compared with coastal cities, their geographical features are more unfavorable to the dilution of suspended particulate matter in the air. Therefore, the estimated results show that the ratio of primary industry to urban air quality will have a positive impact.
In addition, the results show that the area of grassland and water body will have a positive impact on PM2.5 concentration, and both of them are significant at the 1 percent level. We believe that the possible reasons are that the PRD region has a high temperature all year round and a dense population. The surface temperature in the grassland and water body is lower than that in other areas. The atmosphere has an inversion layer, which is not conducive to the dissipation of suspended particles in the air. Artificial facilities near the water (ditches, pipes, etc.) may contribute to the increase of PM2.5 concentration as well. Therefore, the estimation results show that the area of grassland and water body may have a positive effect on urban PM2.5 concentration in the PRD region where is the economically developed areas with concentrated population.
Conclusion
The problem of urban air quality is closely related to the health of local residents, which has been widely concerned by the masses and scholars. However, urban land use patterns have been proved to be closely related to urban air quality (Yang et al., 2017). The PRD region in China has a huge economic size and population, and the concern and requirement for air quality in this region is an important issue in the lives of local residents. At the same time, located at the lower reaches of the Pearl River in Guangdong Province in southeastern China, near the South China Sea, the PRD region has a subtropical monsoon climate with high temperature and rainy weather. Due to the geographical advantage of the PRD region, its land use patterns and air quality have different characteristics from other city clusters in China. In this paper, the land use change trend and the interannual variation of PM2.5 concentration in nine prefecture-level cities in the PRD region from 2000 to 2018 were analyzed. Then, a spatial error model was constructed. The spatio-temporal evolution of PM2.5 and its influencing factors were discussed in fixed overall effect. The main conclusions are as follows:
First of all, PM2.5 concentration in the PRD region showed a trend of increasing year by year and then decreasing year by year from 2000 to 2018, and reached the maximum concentration in 2008. Since 2015, the PM2.5 concentration in nine prefecture-level cities in the PRD region has been below the 35 μg/m3 limit set by the Ministry of Ecology and Environment of China for residential areas (secondary areas). At the same time, the PM2.5 concentration in the PRD region shows an obvious spatial agglomeration effect, indicating that the PM2.5 concentration in a city is correlated with its surrounding cities to a certain extent.
A large number of scholars have shown that air quality is closely related to land use types. Changes in land use types affect the diffusion and distribution of PM2.5 through changes in albedo, roughness, soil moisture, atmospheric temperature and humidity, etc. (Schaufler et al., 2010). However, for different regions, the relationship between land use and PM2.5 is different due to their geographical uniqueness. For the PRD region, its land use structure changed from 2000 to 2018, which was reflected in the decrease of the area of cultivated land, the increase of the area of artificial surface and unused land year by year, while the change of the area of woodland, grassland and water area was small. Combined with the variation characteristics of PM2.5 concentration in the PRD region, it can be seen that the area of artificial surface increased significantly before 2010, while the area of cultivated land gradually decreased, and the PM2.5 concentration also showed a trend of increasing year by year in general during this period. Most studies show that complex human activities are an important source of PM2.5 (Han et al., 2015). With the rapid development of urbanization, the area of artificial surface is gradually increasing, industrial activities are more intensive, and huge energy consumption and pollutants produced by production and living directly lead to the increase of PM2.5 concentration. Therefore, the annual increase of artificial surface led to the annual increase of PM2.5 concentration in the PRD region from 2000 to 2008.
But along with the environmental protection consciousness being gradually strengthened, as well as the gradual loss of cultivated land has attracted widespread attention, since 2005, when the State Council of China issued the Measures for Evaluating the Responsibility Targets of Provincial Governments for Cultivated Land Protection, the cultivated land has been well protected. Combined with the slowing growth of artificial surface and the 16th Asian Games in Guangzhou held in 2010, the government of the PRD has paid more attention to air quality, so the PM2.5 concentration in the region has been decreasing year by year since 2008.
As a means of production, cultivated land, like ordinary vegetation, can effectively reduce PM2.5 concentration through the dry and wet deposition of leaves during the growing period due to its low emissions. The regression results of this paper also show that there is a negative correlation between the area of cultivated land and PM2.5 concentration in the PRD. However, many scholars’ studies have confirmed that the impact of cultivated land on PM2.5 mainly depends on the intensity of agricultural activities (Lowicki, 2018; Lu, et al., 2020). Smoke from crop burning after harvest is one of the reasons for the high PM2.5 concentration, but most of the unused cultivated land had no different effect on PM2.5 concentration than bare land. For the PRD region, the total factor productivity in agriculture is less than 1, and the intensity of cultivated land is lower than that of other regions. Therefore, there is a negative correlation between cultivated land area and PM2.5 concentration in the PRD region.
Studies by many scholars have shown that forestland can absorb and reduce PM2.5 (Han et al., 2015; Zou et al., 2016). This is due to the dust-catching effect of forests, which can directly capture PM2.5 through the absorption of the surface or stomata of plant leaves and stems, with less self-pollution and low population density. According to the regression results of this paper, it can also be seen that there is a negative correlation between forestland and PM2.5.
As the water body in the PRD region is long and narrow, while the grassland area is relatively small, and they are close to the area with frequent human activities, the particles will be transferred among the water body, grassland and nearby areas. From the point of view of pollution discharge, water body and grasslands themselves do not emit pollutants, but they may be affected by surrounding areas with heavier pollutants. As can be seen from the regression results of this paper, there is a positive correlation between the area of water body, grassland and PM2.5 concentration in the PRD region. However, more accurate studies on the relationship between them need to be carried out on the basis of higher temporal resolution.
Meanwhile, according to the regression results, the primary industry in the PRD region is positively correlated with PM2.5 concentration. This is due to the gradual decline of extensive subsistence agriculture and the gradual increase of intensive commodity agriculture in the PRD region. The change in the structure of the agricultural sector has led to a larger scale of intensive land use, which in turn has increased the concentration of PM2.5.
Land provides various space-bearing, material, and spiritual security functions for human survival and development, and produces various products, services and life functions directly as a working object or as a carrier for social production (Lu, et al., 2020). Cultivated land and artificial surface provide places for human production and living and are the main space for human survival. Forestland, grassland, water body and unused land have ecological functions and are the natural conditions for human survival. The PRD region has a developed economy and a high population density, so maintaining good air quality is the ardent hope of all the people in the region. In order to keep the PM2.5 concentration in the PRD at a low level, the area of cultivated land and forestland should be increased as far as possible in terms of land use structure, and the urban landscape should be designed reasonably to reduce the loss of ecosystem services (such as air purification) (Du et al., 2018). This practice is not only helpful to reduce the PM2.5 concentration, but also accords with China’s requirements and policies on the protection of cultivated land. At the same time, we should allocate the spatial distribution of the three major industries rationally, encourage urban built-up areas to expand the area of afforestation, speed up the restoration and reconstruction of damaged forests, rationally coordinate the land distribution of production and living ecological spaces, and carry out land management. And we will take comprehensive measures to improve unused and inefficient land, and promoting the formation of a reasonable pattern of safe work and life in urbanization. We should also encourage residents to adopt green and low-carbon lifestyles and consumption patterns, encourage them to support air pollution control, which will lay a solid social foundation for PM2.5 control.
Data Availability Statement
The datasets presented in this study can be found in online repositories. The names of the repository/repositories and accession number(s) can be found below: http://fizz.phys.dal.ca/∼atmos/martin/?page_id=140#V4.CH.03 http://www.resdc.cn/Default.aspx.
Author Contributions
KH Conceptualization, Supervision; LQ Data curation, Methodology, Writing-Original draft preparation; DY Translation, Modification; MJ Software, Writing-Reviewing and Editing.
Funding
This work was partially supported by National Natural Science Foundation of China (71903099), the General Foundation of Philosophy and Social Science Research in Colleges and Universities in Jiangsu Province (2019SJA0165) and the Natural Science Foundation of the Jiangsu Higher Education Institutions of China (19KJB610019), Natural Science Foundation of Hunan Province (2020JJ5111), Project of Hunan Social Science Achievement Appraisal Committee (XSP20YBZ081), Young Teacher Innovation Drive Project of Hunan University Technology and Business (19QD04). National Natural Science Foundation of China (71903099), the General Foundation of Philosophy and Social Science Research in Colleges and Universities in Jiangsu Province (2019SJA0165) and the Natural Science Foundation of the Jiangsu Higher Education Institutions of China (19KJB610019). China postdoctoral science Foundation project (2021M690971).
Conflict of Interest
The authors declare that the research was conducted in the absence of any commercial or financial relationships that could be construed as a potential conflict of interest.
Publisher’s Note
All claims expressed in this article are solely those of the authors and do not necessarily represent those of their affiliated organizations, or those of the publisher, the editors and the reviewers. Any product that may be evaluated in this article, or claim that may be made by its manufacturer, is not guaranteed or endorsed by the publisher.
References
Chen, Y.-h., Chen, M.-x., and Mishra, A. K. (2020). Subsidies under Uncertainty: Modeling of Input- and Output-Oriented Policies. Econ. Model. 85, 39–56. doi:10.1016/j.econmod.2019.05.005
Cheng, L., Zhang, T., Chen, L., Li, L., Wang, S., Hu, S., et al. (2020). Investigating the Impacts of Urbanization on PM2.5 Pollution in the Yangtze River Delta of China: A Spatial Panel Data Approach. Atmosphere 11, 1058. doi:10.3390/atmos11101058
Du, Y., Sun, T., Peng, J., Fang, K., Liu, Y., and Yang, Y. (2018). Direct and Spillover Effects of Urbanization on PM 2.5 Concentrations in China’s Top Three Urban Agglomerations. J. Clean. Prod. 190 (2018), 72–83.
Du, Y., Wan, Q., Liu, H., Liu, H., Kapsar, K., and Peng, J. (2019). How Does Urbanization Influence pm2.5 Concentrations? Perspective of Spillover Effect of Multi-Dimensional Urbanization Impact. J. Clean. Prod. 220, 974–983. doi:10.1016/j.jclepro.2019.02.222
Fang, C., and Yu, D. (2017). Urban Agglomeration: an Evolving Concept of an Emerging Phenomenon. Landscape Urban Plann. 162, 126–136. doi:10.1016/j.landurbplan.2017.02.014
Han, L., Zhou, W., and Li, W. (2015). City as a Major Source Area of fine Particulate (PM2.5) in China. Environ. Pollut. 206, 183–187. doi:10.1016/j.envpol.2015.06.038
Hao, Y., and Liu, Y.-M. (2016). The Influential Factors of Urban pm2.5 Concentrations in china: a Spatial Econometric Analysis. J. Clean. Prod. 112 (P2), 1443–1453. doi:10.1016/j.jclepro.2015.05.005
He, C., Han, L., and Zhang, R. Q. (2016). More Than 500 Million Chinese Urban Residents (14% of the Global Urban Population) Are Imperiled by fine Particulate hazard. Environ. Pollut. 218, 558–562. doi:10.1016/j.envpol.2016.07.038
Heald, C. L., and Spracklen, D. V. (2015). Land Use Change Impacts on Air Quality and Climate. Chem. Rev. 115 (10), 4476–4496. doi:10.1021/cr500446g
Lin, Y., Yang, X., Li, Y., and Yao, S. (2020). The Effect of forest on pm2.5 Concentrations: a Spatial Panel Approach. For. Pol. Econ. 118, 102261. doi:10.1016/j.forpol.2020.102261
Liu, J., Kuang, W., Zhang, Z., Xu, X., Qin, Y., Ning, J., et al. (2014). Spatiotemporal Characteristics, Patterns, and Causes of Land-Use Changes in China since the Late 1980s. J. Geogr. Sci. 24 (2), 195–210. doi:10.1007/s11442-014-1082-6
Lowicki, D. (2018). Landscape Pattern as an Indicator of Urban Air Pollution of Particulate Matter in poland. Ecol. Indicators 97 (38), 17–24. doi:10.1016/j.ecolind.2018.09.050
Lu, D., Xu, J., Yang, D., and Zhao, J. (2017). Spatio-temporal Variation and Influence Factors of Pm 2.5 Concentrations in china from 1998 to 2014. Atmos. Pollut. Res. 8, 1151–1159. doi:10.1016/j.apr.2017.05.005
Lu, D., Xu, J., Yue, W., Mao, W., Yang, D., and Wang, J. (2020). Response of PM2.5 Pollution to Land Use in China. J. Clean. Prod. 244, 118741. doi:10.1016/j.jclepro.2019.118741
Mao, L., Qiu, Y., Kusano, C., and Xu, X. (2012). Predicting Regional Space-Time Variation of PM2.5 with Land-Use Regression Model and MODIS Data. Environ. Sci. Pollut. Res. 19 (1), 128–138. doi:10.1007/s11356-011-0546-9
Martuzevicius, D., Grinshpun, S. A., Reponen, T., Górny, R. L., Shukla, R., Lockey, J., et al. (2004). Spatial and Temporal Variations of PM2.5 Concentration and Composition throughout an Urban Area with High Freeway Density-The Greater Cincinnati Study. Atmos. Environ. 38 (8), 1091–1105. doi:10.1016/j.atmosenv.2003.11.015
Mi, Y., Sun, K., Li, L., Lei, Y., Wu, S., Tang, W., et al. (2020). Spatiotemporal Pattern Analysis of pm2.5 and the Driving Factors in the Middle Yellow River Urban Agglomerations. J. Clean. Prod. 299, 126904. doi:10.1016/j.jclepro.2021.126904
Ning, J., Liu, J., Kuang, W., Xu, X., Zhang, S., Yan, C., et al. (2018). Spatiotemporal Patterns and Characteristics of Land-Use Change in China during 2010-2015. J. Geogr. Sci. 28 (5), 547–562. doi:10.1007/s11442-018-1490-0
Ouyang, X., Wei, X., Li, Y., Wang, X.-C., and Klemeš, J. J. (2021). Impacts of Urban Land Morphology on pm2.5 Concentration in the Urban Agglomerations of china. J. Environ. Manage. 283 (5), 112000. doi:10.1016/j.jenvman.2021.112000
Schaufler, G., Kitzler, B., Schindlbacher, A., Skiba, U., Sutton, M. A., and Zechmeister-Boltenstern, S. (2010). Greenhouse Gas Emissions from European Soils under Different Land Use: Effects of Soil Moisture and Temperature. Eur. J. Soil Sci. 61 (5), 683–696. doi:10.1111/j.1365-2389.2010.01277.x
Shao, J., Ge, J., Feng, X., and Zhao, C. (2020). Study on the Relationship between pm2.5 Concentration and Intensive Land Use in Hebei Province Based on a Spatial Regression Model. PLOS ONE 15, e0238547. doi:10.1371/journal.pone.0238547
Stafoggia, M., Bellander, T., Bucci, S., Davoli, M., De Hoogh, K., De' Donato, F., et al. (2019). Estimation of Daily PM10 and PM2.5 Concentrations in Italy, 2013-2015, Using a Spatiotemporal Land-Use Random-forest Model. Environ. Int. 124, 170–179. doi:10.1016/j.envint.2019.01.016
Wang, H., and Li, J. (2021). Dual Effects of Environmental Regulation on Pm 2.5 Pollution: Evidence from 280 Cities in china. Environ. Sci. Pollut. Res. 28 (34), 47213–47226. doi:10.1007/s11356-021-14011-4
Wong, P.-Y., Lee, H.-Y., Chen, Y.-C., Zeng, Y.-T., Chern, Y.-R., Chen, N.-T., et al. (2021). Using a Land Use Regression Model with Machine Learning to Estimate Ground Level PM2.5. Environ. Pollut. 277, 116846. doi:10.1016/j.envpol.2021.116846
Wu, J., Xie, W., Li, W., Li, J., and Zhang, Y. (2015). Effects of Urban Landscape Pattern on PM2.5 Pollution-A Beijing Case Study. PLOS ONE 10 (11), e0142449. doi:10.1371/journal.pone.0142449
Xu, P., Wang, W., Ji, J., and Yao, S. (2014). Analysis of the Contribution of the Road Traffic Industry to the pm2.5 Emission for Different Land-Use Types. Comput. Intell. Neurosci. 2014, 821973. doi:10.1155/2014/821973
Yan, L., Hong, K., Chen, K., Li, H., and Liao, L. (2021). Benefit Distribution of Collectively-Owned Operating Construction Land Entering the Market in Rural China: A Multiple Principal-Agent Theory-Based Analysis. Habitat Int. 109 (2), 102328. doi:10.1016/j.habitatint.2021.102328
Yang, D., Lu, D., Xu, J., Ye, C., Zhao, J., Tian, G., et al. (2018a). Predicting Spatio-Temporal Concentrations of pm2.5 Using Land Use and Meteorological Data in Yangtze River Delta, china. Stoch Environ. Res. Risk Assess. 32, 2445–2456. doi:10.1007/s00477-017-1497-6
Yang, D., Ye, C., Wang, X., Lu, D., Xu, J., and Yang, H. (2018b). Global Distribution and Evolvement of Urbanization and Pm 2.5 (1998–2015). Atmos. Environ. 182, 171–178. doi:10.1016/j.atmosenv.2018.03.053
Yang, H., Chen, W., and Liang, Z. F. (2017). Impact of Land Use on pm2.5 Pollution in a Representative City of Middle china. Int. J. Environ. Res. Public Health 14 (5), 462. doi:10.3390/ijerph14050462
Yuan, M., Huang, Y., Shen, H., and Li, T. (2018). Effects of Urban Form on Haze Pollution in China: Spatial Regression Analysis Based on PM2.5 Remote Sensing Data. Appl. Geogr. 98, 215–223. doi:10.1016/j.apgeog.2018.07.018
Zeng, J., Wen, Y., Bi, C., and Feiock, R. (2021). Effect of Tourism Development on Urban Air Pollution in China: the Moderating Role of Tourism Infrastructure. J. Clean. Prod. 280 (Part 1), 124397. doi:10.1016/j.jclepro.2020.124397
Zhang, S., Han, L., Zhou, W., and Li, W. F. (2016). Impact of Urban Population on Concentrations of Nitrogen Dioxide (NO2) and fine Particles (PM2.5) in China. Acta Ecol. Sinica 36 (16), 5049–5057. doi:10.1016/j.chnaes.2016.01.007
Zhang, Z., Wang, J., Hart, J. E., Laden, F., Zhao, C., Li, T., et al. (2018). National Scale Spatiotemporal Land-Use Regression Model for pm2.5, Pm10 and No2 Concentration in china. Atmos. Environ. 192, 48–54. doi:10.1016/j.atmosenv.2018.08.046
Zheng, S., Zhou, X., Singh, R., Wu, Y., Ye, Y., and Wu, C. (2017). The Spatiotemporal Distribution of Air Pollutants and Their Relationship with Land-Use Patterns in Hangzhou City, China. Atmosphere 8, 110. doi:10.3390/atmos8060110
Keywords: land use, air quality, PM25, pearl river delta, spatio-temporal evolution
Citation: Hong K-r, Qiu L-s, Yang D-x and Jiang M (2021) Spatio-Temporal Evolution and Correlation Analysis of Urban Land Use Patterns and Air Quality in Pearl River Delta, China. Front. Environ. Sci. 9:698383. doi: 10.3389/fenvs.2021.698383
Received: 22 April 2021; Accepted: 04 October 2021;
Published: 22 November 2021.
Edited by:
Xunpeng Shi, University of Technology Sydney, AustraliaReviewed by:
Feng Dong, China University of Mining and Technology, ChinaLina Zhang, Hohai University, China
Copyright © 2021 Hong, Qiu, Yang and Jiang. This is an open-access article distributed under the terms of the Creative Commons Attribution License (CC BY). The use, distribution or reproduction in other forums is permitted, provided the original author(s) and the copyright owner(s) are credited and that the original publication in this journal is cited, in accordance with accepted academic practice. No use, distribution or reproduction is permitted which does not comply with these terms.
*Correspondence: Minxing Jiang, MTg1ODg4NDc1MTVAMTYzLmNvbQ==