 Yen-Po Lin
 Chen-Feng You
 Tsung-Yu Kao1
 Chung-Chieh Gary Hung
- 1Department of Earth Sciences, National Cheng Kung University, Tainan, Taiwan
- 2Institute of Archaeology, National Cheng Kung University, Tainan, Taiwan
To identify pollutant origins and their potential sources from either long-range transported (LRT) or local emissions, the Boron (B) concentrations and the B isotopic compositions (δ11B) in the water-soluble fraction of aerosols were determined. These aerosols were collected from an islet offshore in northeastern Taiwan, Peng Chia Yu (PCY), a non-residential islet, from January 1998 to March 2000. This islet may be influenced by various pollutants or chemical transport during monsoon periods, but suffers minimal human perturbation locally. The B in the specimens falls to 0.3–1.63 ng m−3 during the SW monsoon seasons when compared to 0.46–2.56 ng m−3 in the NE monsoon. However, the δ11B results show no clear variations in both monsoon seasons (10.7–24.3‰), regardless of differences in air mass origin. A two end-member mixing scenario is proposed to explain our observations using the obtained δ11B and 1/[B] results. The ocean endmember is characterized by high 1/[B] and high δ11B; while other endmember is from continental endmember or anthropogenic contributions that are characterized by of 1/[B] and lowδ11B (δ11B < 10‰). Based on these chemical and isotopic results, we found aerosol emissions in northern Taiwan are characterized as low B with nearly constant δ11B, when compared with long-range transported continental endmembers derived from nearby regions. This study provides preliminary B and δ11B levels in aerosols derived from LRT/local emissions and discusses potential monsoonal effects on aerosols offshore of NE Taiwan.
Introduction
Air pollution in Taiwan derives primarily from local emissions and long-range transported (LRT; Lin, 2001; Hsu et al., 2006). Identifying the sources of pollutants is the first step in developing greater air quality control program in the environment. The emissions from local sources are generated mainly by the domestic combustion of fossil fuels. In Southeast Asia, aerosol transportation from China has rapidly increased over the last few decades, because of a marked increase in coal consumption (Fogg and Duce, 1985; Park and Schlesinger, 2002; Zhao and Liu, 2010). The sources of pollutants varies seasonally due to differing weather patterns and wind directions (Cheng et al., 2010; Cheng et al., 2011). As a non-residential islet, Peng Chia Yu, offers limited environmental perturbations that make it is an excellent location for monitoring through airborne in pollutants southeastern Asia.
Water-soluble ions are major components (up to 60–70%) of the atmospheric aerosols, which include sulfate, nitrate, ammonium and alkali cations produced from various anthropogenic processes (Ali-Mohamed, 1991). The chemical and isotopic composition of water-soluble ions in aerosols provide valuable information for a better understanding of their chemical characteristics, pollutant sources, and transportation mechanisms (Hoffman et al., 1977; Zhang et al., 2011). Stable isotopes are powerful tools for investigating sources of atmospheric aerosols. For example, Pb isotopic fingerprints are tracers used for anthropogenic sources, but not for natural sources. B is a trace constituent in the environment that can be divided into a natural or an anthropogenic source in the atmosphere. Significant mass differences between 10B and 11B demonstrates and leads to larger δ11B variations from ∼60‰ rainwater and aerosols (Park and Schlesinger, 2002; Schlesinger and Vengosh, 2016). Its variations in aerosols are much larger than other natural isotopic systems that make it a powerful source for a future study on identification study.
B exists in as both particulate and gaseous forms in the atmosphere with total concentrations ranging from a few ng m−3 to more than 100 ng m−3 (Fogg and Duce, 1985; Miyata et al., 2000). Early works found B sources in the atmosphere were derived from multiple origins, including the evaporation of boric acid from seawater and sea spray by large fluxes (1.44 Tg B/year), erosion from terrestrial materials (0.017 Tg/year), emissions from the combustion of biomass (0.26–0.43 Tg B/year), and coals (0.20 Tg B/year) (Park and Schlesinger, 2002). B has two stable isotopes, 10B and 11B, with relative abundance 19.9 and 80.1%, respectively. In recent studies, B and B isotopes were used as tracers for rainwater and aerosols to identify the sources and transport routes of air pollutants (Sakata et al., 2010; Zhao and Liu, 2010; Sakata et al., 2013; Roux et al., 2017). B in the atmosphere was further divided into a natural or an anthropogenic source (Sakata et al., 2013; Roux et al., 2017; Sakata et al., 2017). Sea salt and the evaporation of boric acid from seawater are primary natural emissions characterized with high levels of δ11B close to seawater that of (δ11B = 39.6‰). Most terrestrial materials (e.g., rocks, evaporates, crude oil, and water) had δ11B values that ranged from −30 to 45‰ and were mostly greater than 0‰ (Williams and Hervig, 2004). Most of the anthropogenic contributions of B in the atmosphere were derived from the combustion of coals and characterized by much lower δ11B values (δ11B = −70 to 8‰) (Park and Schlesinger, 2002; Zhao and Liu, 2010). As mentioned above, sea salt aerosols and the evaporation of boric acid from seawater are primary natural emissions of B and the anthropogenic contributions of B to the atmosphere was derived from the combustion of coal. The B content vapor was condensed to aerosol and transmitted to PCY by NE or summer monsoon.
There has been insufficient research on B isotope studies in rainwater and aerosols because of limited amounts of B in the atmosphere. To date, B isotopes have only been used to trace the sources of particle emissions, including Shizuoka, Matsuura and Nakanoto in Japan (Sakata et al., 2013; Sakata et al., 2017) and in Lorraine and Paris in France (Chetelat et al., 2009; Roux et al., 2017).
In this study, we extracted and analyzed the elemental concentrations and δ11B in water-soluble fractions of aerosol specimens in PCY. This represents a preliminary attempt to analyze aerosols with B isotopic compositions for improving air-quality monitoring in Taiwan/Asia. Our objectives are to provide δ11B data in PCY, to study representative LRT/local emissions in NE Taiwan, and to identify any potential sources using B and δ11B data.
Materials and Methods
Aerosol samples were collected at a weather station at PCY under the Taiwan Central Weather Bureau (25°37′46″ N, 122°04′17″ E; Figure 1), from January 1998 to March 2000. The Meteorologic data for PCY is influenced alternatively by the Pacific subtropical high-pressure system in the summer and the NE monsoon in the winter. Aerosol sources changes caused by wind patterns alternate seasonally. To study source variations with seasonal monsoons, we choose samples from the summer monsoon (June to August) and the northeastern monsoon periods (September to March). Additionally, we selected samples from typhoon or dust storm events for analysis. A total of 29 samples were selected for this study.
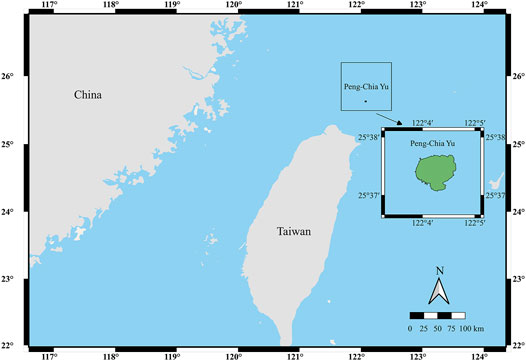
FIGURE 1. A schematic map showing the location of Peng Chia Yu Islet off of northeastern Taiwan. The insert figure shows in zoom of Peng Chia Yu Islet.
The PM2.5 fractions of aerosol were collected with the flow rate of 1.05 m3 min−1on acetate membrane filters (Whatman Grade 41 Quantitative Filter Pape, Thermo Fisher, Scientific™, 20 × 25 cm2). The sampler was placed on the rooftop of PCY weather station, which include an air sampler coupled with suction motor (GBM-2000H, General Metal Works Inc.), stainless steel grid (GFH-2100, General Metal Works Inc.), and continuous flow system (G105, General Metal Works Inc.). Those filters were kept in desiccator in the refrigerator at low temperature to prevent potential contaminations after sampling and put it in the sealed zipper bags to prevent element lost through evaporation.
To extract the water-soluble elements, aerosol filters were cut and placed in a clean Teflon vial, and then treated with 6 ml Milli-Q water for 90 min at room temperature under ultrasonic irradiation. Then the aerosol filters were removed from the Teflon vials after soaking in Milli-Q water at room temperature overnight. These solutions were passed through a 0.45 µm-membrane filter then acidified by adding 0.3 M HNO3 conditions that were used for the determination of element concentrations.
The concentration of major elements sodium (Na) and sulfur (S) were measured by inductively coupled plasma optical emission spectrometry (ICP-OES, Thermo-Fisher, iCAP) at the Earth Dynamic System Research Center, National Cheng Kung University (EDSRC, NCKU). The concentration of B and lead (Pb) were measured by Inductively Coupled Plasma Quadrupole Mass Spectrometry (ICP-Q-MS Thermo-Fisher, iCAP-Q) at EDSRC, NCKU. The analytical precision of the dissolved elements is better than 2%.
B in the sample solution was purified by using a micro-sublimation technique to separate B from all other matrices in natural water or low-B marine biogenic carbonates (Wang et al., 2010). This technique shows additional advantages for low procedural blanks (∼8 pg) and is easy to operate, i.e., it is an ideal way to efficiently purify low-B-content samples, such as those in aerosols and rainwater. 50 µl of acidified water-soluble ion samples were deposited at the center of the cap of a 5 ml conical vial. A minimum of 50 ng of B is needed for analysis; as a result, some samples with low B content were combined in multiple vials. These vials were tightly closed in an upside-down position on a homemade thermostatic hotplate with a Teflon coated graphite rack. They were then heated for 18 h under 98 ± 0.1°C. Each sample was diluted with 0.1 N HNO3 to a final volume of 1 ml for the MC-ICP-MS measurements.
All isotopic measurements were carried out using a Multi-Collector Inductively Coupled Plasma Mass Spectrometry (MC-ICP-MS, Thermo Fisher Scientific, Neptune) at EDSRC, NCKU. The B isotopic compositions are presented in delta notation relative to a Standard Reference Material (SRM) 951 boric acid standards, prepared by National Institute of Standards and Technology (NIST) and using the equation below:
The reproducibility (2SE) of δ11B for NIST SRM 951 in this laboratory was approximately of 0.4‰.
The evaporation of seawater is an important source of B in aerosols, by calculating the Enrichment Factors (EFs) using B/Na, the values can then be used to evaluate the total marine contribution in the data (Chabas and Lefevre, 2000). The EF values were calculated using the equation below:
where B and Na are the concentrations of water-soluble B and Na in samples and seawater, respectively (B/Na = 4.2 × 10⁻⁴; Li, 1991).
The air trajectory analysis allows for the evaluation of the pathways of air mass during different seasons. The Hybrid Single-Particle Lagrangian Integrated Trajectory (HYSPLIT) model was used.
Results
Seasonal Variations in Atmospheric Concentrations of Aerosol in Peng Chia Yu Water-Soluble Ions
Table 1 summarizes all measured constitutes in this study. Figure 2A. indicates the variations in the B (0.3–3.86 ng m−3) in the aerosols at PCY from January 1998 to March 2000. The B data show distinctive seasonal changes with the results, showing higher B values (0.46–3.86 ng m−3) in NE monsoon seasons (September–March) and low in summer (June–August) (0.3–1.29 ng m−3, with the exception of a potential volcanic emissions influenced sample, A13). The potential volcanic emissions sample (A13) has the highest B (1.63 ng m−3) in the summer. Two samples (A50 and A51) taken during dust storm events are characterized by high levels of B, 2.22 and 3.86 ng m−3, respectively. There were no significant changes in B during typhoon events.
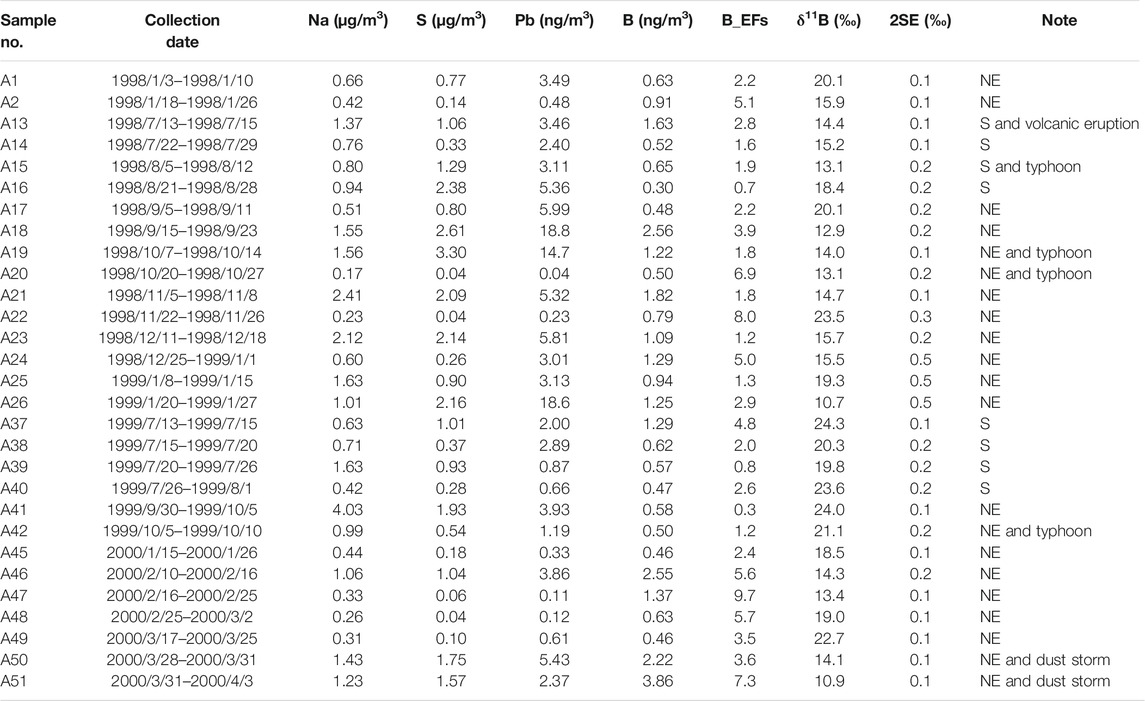
TABLE 1. The concentrations of Na, S, Pb, B, EFseawater, δ11B and analytical errors (2SE, n = 10) in selected aerosols at PCY. Samples were taken during NE monsoon (NE), summer monsoon(S), typhoon, dust storm and volcanic eruption periods.
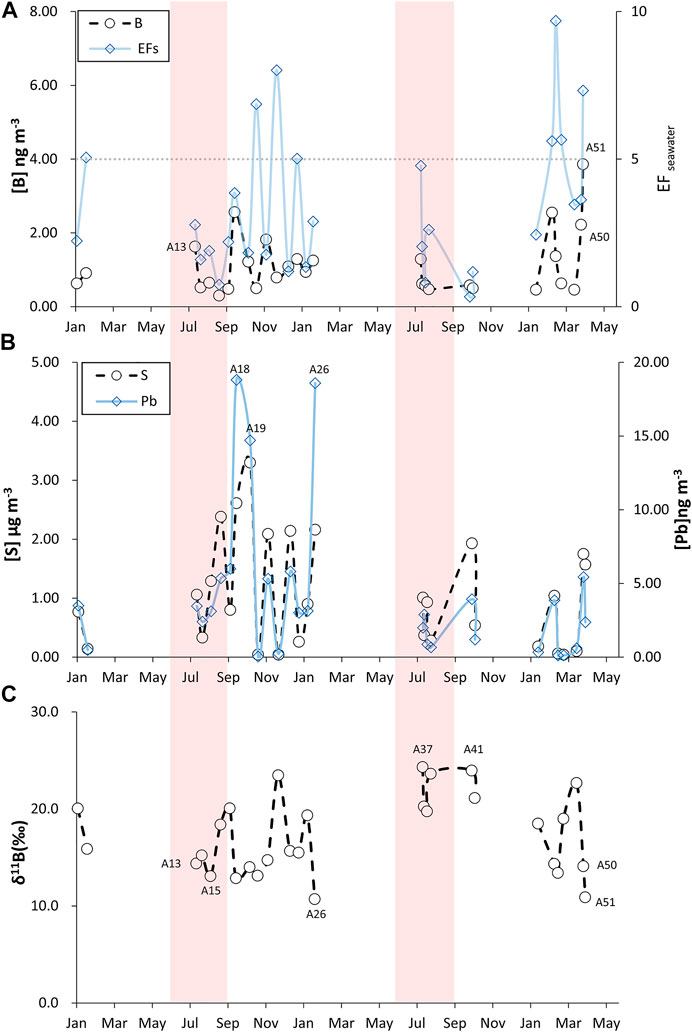
FIGURE 2. Variations of B, S, Pb, δ11B and EFseawater in selected aerosols during the 26 months study period at PCY. (A) B and EFseawater(B) S and Pb (C) δ11B.
The S and Pb concentrations in aerosols ranged from 0.04 to 3.3 μg m−3 and from 0.04 to 18.81 ng m−3, respectively. By mapping the two chemical values with the seasonal variation chart (Figure 2B), three samples (A18, A19 and A26) had relatively high Pb concentrations (14.7–18.8 ng m−3) that corresponded to NE monsoon the seasons. There were no significant changes in S and Pb during typhoons, dust storms and potential volcanic emissions events. Furthermore, the concentrations of S and Pb in aerosols during the NE monsoon period (with the exception of dust and typhoon sample) correlate positively (R2 = 0.64, p < 0.001; Figure 3) and demonstrate a similar trend over time.
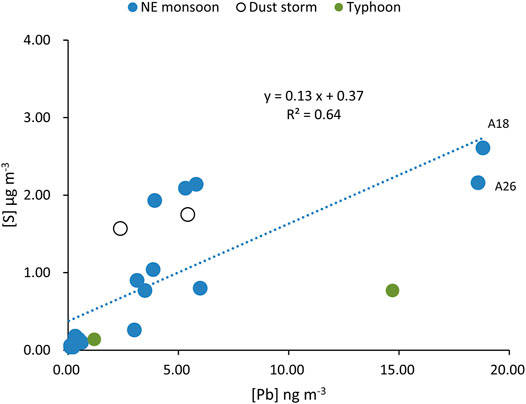
FIGURE 3. The concentration scatter plots of S vs. Pb in selected aerosols.
Seasonal δ11B Variations
The δ11B in aerosols during the NE monsoon period ranged from 10.7 to 24.0‰ (Figure 2C), where sample A41, with the heaviest δ11B, was characterized by a relatively low B concentration (0.58 ng m−3). On the other hand, the sample with the lightest δ11B is characterized by the highest B concentration. The δ11B in dust storm samples (A50 and A51) were characterized by more negative values, 14.1 and 10.9‰, respectively (Figures 2C, 4).
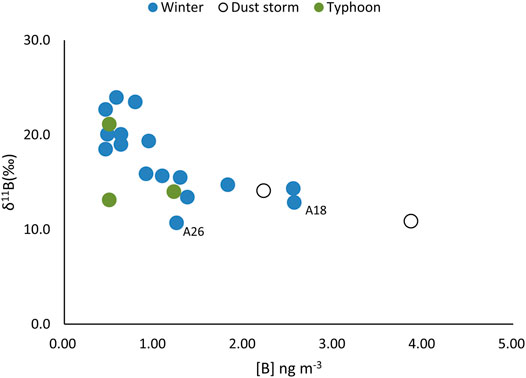
FIGURE 4. The plot of δ11B vs. [B] in selected aerosols during the NE monsoon, dust storm, and typhoon events.
The δ11B in aerosols range from 13.1 to 24.3‰ (Figure 2C) in the summer monsoon period and sample A37 had the heaviest δ11B. The typhoon sample (A15) and volcanic emissions (A13) were characterized relatively negative δ11B (Figures 2C, 5).
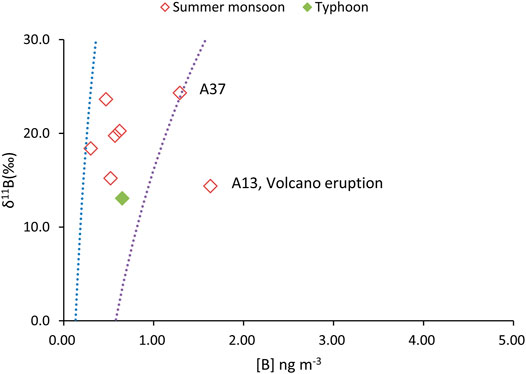
FIGURE 5. The plot of δ11B vs. [B] in selected aerosols during the summer monsoon and typhoon events.
Discussion
B and B Isotope Sources
Sea Salt and Seawater Evaporation
The B and the EFseawater showed similar seasonal changes (Figure 2; Table 1), the EFs values were higher during the NE monsoon than in summer monsoon seasons (0.7–4.8). In this study, dissolved Na was selected as reference element for EFseawater calculation. EFs higher than 1 indicated B in sample relative enrichment compared to seawater. Relatively high EFseawater (1.2–9.7 with the exception of the least sample A41) during the NE monsoons implies that severe contamination was caused by anthropogenic emissions. During summer monsoon, the relatively low EFseawater (0.7–4.8) is less than 5 and indicate a significant influence from seawater. Some samples of EFseawater valued less than 1, which was likely due to B were lost through the evaporation.
B isotopes can be used as tracers for aerosols to identify the contributions and transport routes for natural and anthropogenic sources. Although seawater evaporation is a primary source of B in aerosols, the marine endmember of B isotope in aerosols has yet to be clarified from the literature. The δ11B in the seawater and coastal rainwater ranged up to +45‰ (Chetelat et al., 2005). Previous studies utilized the general δ11B values between 39.6 and 45‰ to estimate the contributions of each source in the aerosols (Zhao and Liu, 2010; Sakata et al., 2013). In Sakata et al. (2013), they examined the B isotopic compositions in aerosols at Matsuura and Nakanoto in Japan, which showed that the highest δ11B value (21.7‰) in their study was different from the seawater values (39.6‰), even when the levels of B in this aerosol sample were mostly derived from seawater. All of the δ11B in aerosols published were markedly lower than the seawater values.
The δ11B in seawater and coastal rainwater should not refer directly to the δ11B for marine endmembers in aerosols. Significant negative isotopic fractionation (Δparticle-liquid) may occur during the transformation from liquid B to particulate B, due to the δ11B values of particulate B were expected to be 0–20‰ lower than gaseous B, and the liquid vapor isotopic fractionation (Δliquid-vapor) is positive (Sakata et al., 2017). Roux et al. (2017) examined the evolution of B and B isotopic compositions of atmospheric particulate deposition and total dissolved deposition between 2012 and 2013. The δ11B in particulate depositions was much lower than those from the dissolved depositions. As mentioned above, there were significant isotopic fractionation between rainwater and aerosol. The marine endmembers of B isotope within aerosols (particles) should be clarified in a future study.
We suggest the highest δ11B in marine aerosols can be potentially represented by the δ11B value for marine endmembers in aerosols. Aerosols and rainwater derived from seawater evaporation should display the highest δ11B, as seawater has the highest δ11B source in the atmosphere. As the δ11B and serves as a common in coastal rainwater increased to 45‰, the fractionation factors associated with the evaporation of seawater (αseawater-vapor = 1.025) and the vapor-condensation processes (αliquid-vapor = 1.031) are shown giving the first rains at 45‰ (Chetelat et al., 2005; Rose-Koga et al., 2006). To our knowledge, we reported the highest δ11B (24.3‰, A37) in aerosols in this study. Therefore, the δ11B marine aerosols is 24.3‰ and the rain-aerosol isotopic fractionation is 20.7‰ (δ11Brain − δ11Baerosol). Sakata et al. (2017) supported this hypothesis because they showed gaseous B was transformed into particulate B through the reaction of condensed B(OH)3 with chemical constituents on particles to that precipitate borates. The isotopic fractionation was about 20‰ between B(OH)3 and B(OH)4−, with B (OH)4− concentrating 10B (Kakihana et al., 1977). Our results (δ11Brain— − δ11Baerosol = δ11Bliquid − δ11Bparticle = 20.7‰) also supported this hypothesis.
Anthropogenic Emissions
The S and Pb concentrations in aerosols are often indicators of anthropogenic activities. Combining data with B isotopes can provide more concrete evidence for its evolutionary processes. There are two specimens (A18, A26) with the lightest B isotopic values (without the influences of typhoons) and also holds the highest Pb and S concentration levels (Figures 6, 7). The air mass from the LRT during the NE monsoon season was affected by anthropogenic activities in this region (Figure 8A). This indicated that B had common origins or similar transportation pathways as those of S and Pb.
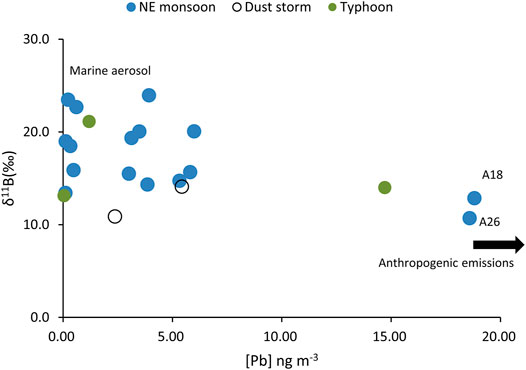
FIGURE 6. The plots of δ11B vs. [Pb] in selected aerosols during the NE monsoon and dust storm and typhoon events.
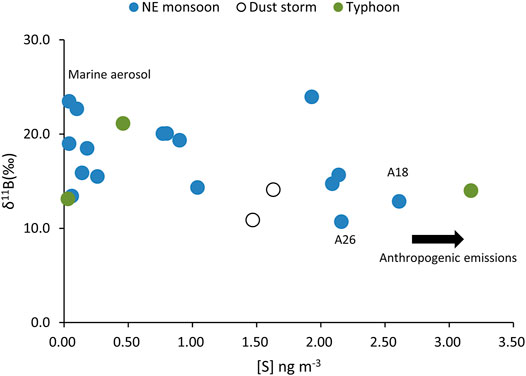
FIGURE 7. The plot of δ11B vs. [S] in selected aerosols during the NE monsoon and dust storm and typhoon events.
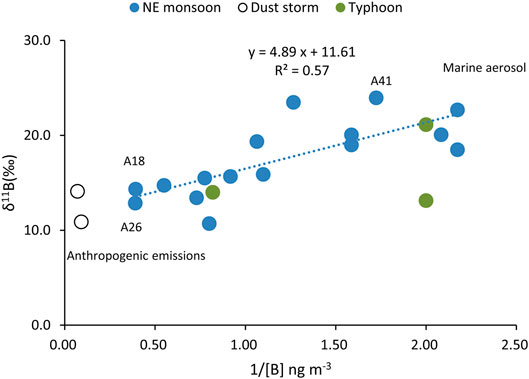
FIGURE 8. The air trajectory analysis during the NE and summer monsoon. (A) The NE monsoon period (A18). (B) The summer monsoon period (A37). (C) The dust period (A50). Meteorological datasets from the National Centers for Environmental Prediction, United States (www.necp.noaa.gov) were used as input data for the HYSPLIT model.
The marked Pb concentrations in aerosols were measured in the NE monsoon season and enhanced by LRT from China (Hsu et al., 2005). The dissolved Pb in PCY derived from Taiwan and LRT from Shanghai varied largely from 8.9 to 53.5% and 46.5 to 91.1%, respectively (Cheng et al., 2011).
Sakata et al. (2013) measured the atmospheric concentrations and isotopic composition of B and S in aerosol samples collected at two sites along the coast of the Japan Sea. They found that aerosols during the winter when air flows from northern China were dominant and characterized by negative δ11B values, which accurately reflected the conditions of δ11B for the coal use in this region.
To clarify possible anthropogenic sources of LRT from China in the NE monsoon season, we explored further the study of δ11B in aerosols from Zhao and Liu (2010) as measured with precipitation in Guiyang, China was important. The B extracted from the precipitation of Guiyang showed four B sources, which were marine, biomass, and organic matter, along with coal combustion at a regional level. This suggests that the δ11B values for aerosol biomass or organic matter and coal combustion were −5 and 8‰, respectively, and can be used to calculate the contribution of different end-members.
The air mass backward trajectory results (Figure 8A) indicated a predominant contribution by LRT from China during the NE monsoon periods (Cheng et al., 2010). Most B anthropogenic contributions in the atmosphere were derived from the combustion of coals (Park and Schlesinger, 2002; Zhao and Liu, 2010). The results showed a significant correlation (R2 = 0.57, p < 0.001, Figure 9) between δ11B and 1/[B]. Figure 9 shows that it intercepted at approximately 11.6‰, with two lightest δ11B values of 10.7 and 12.6‰. These values were rather close to coal combustion in Guiyang, China, 8‰ (Zhao and Liu, 2010). Hence, we assumed that the boron content and isotopic composition in the winter monsoon season composed of a combination of evaporation seawater and coal burning.
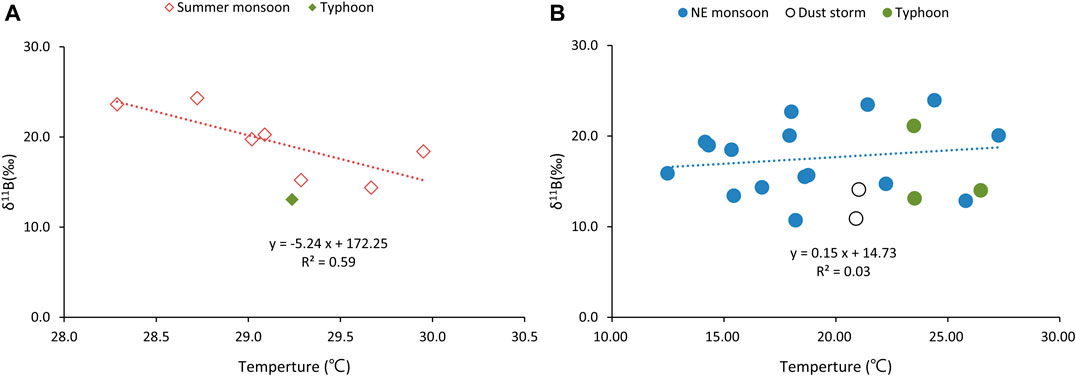
FIGURE 9. The plot of δ11B vs. 1/[B] in selected aerosols during the NE monsoon.
Potential Volcanic Emissions
In retrospect, the B concentrations in aerosol during the summer monsoon period show a narrow range (0.3–1.29 ng m−3), with the exception of there being the highest B sample (Figure 5). The highest B sample (A13) was four times greater than the summer average B and collected from July 13, 1998 to July 15, 1998. On July 11, 1998, the eruptions of the Mount Merapi volcano in Indonesia, which lasted for several weeks. The air mass backward trajectory results indicate the volcano ashes and gases were delivered across the equator, the South China Sea, and finally arrived at PCY (Cheng et al., 2010). Cheng et al. (2010) reported the anomalous strontium isotopic ratio (87Sr/86Sr) during this period, which was explained by the addition of the less radiogenic 87Sr/86Sr substances derived from the Merapi volcano eruption in July 1998.
During this period, the anomalous B and δ11B in aerosols was likely affected by the Merapi volcano eruption. In the B source-sink model, the flux of atmospheric B from volcanic eruption was only 0.02 Tg B/year, which was minimal to the overall atmospheric B flux (Park and Schlesinger, 2002). However, due to the high B concentration in the volcanic gases (0.2–104 µg m−3; Fogg and Duce, 1985), the atmospheric B of the region will significantly increase in short periods of time during eruption. The anomalous B and δ11B can be explained by additions of the substances derived from the Merapi volcano eruption in July 1998. The aerosol specimen analyzed clearly indicates the influence of volcanic gases with the value of δ11B = 14.4‰.
Dust Storm and Typhoon Events
Two samples (A50 and A51) taken during dust storm events and characterized by high [B] and low δ11B (Figures 4, 8C) during the NE monsoon. These samples had relatively low S and Pb levels when compared to anthropogenic sources (Figures 6, 7), which and indicated that B was not derived from coal burning. Dust storms arise when strong winds blow loose sand and dirt from a dry surface. The sandy loess in northeast China had a low δ11B (−12.1 to 9.4‰; Lei et al., 2021), which an important source of B aerosols during storm events. There were no significant change in B and δ11B during typhoon events. Sample A19 was affected by typhoon ZEB in 1998, which was the strongest typhoon in the western North Pacific that year. The NE monsoon wind will be enhanced for a short time prior to a typhoon making landfall. The unchanged wind direction and atmospheric sources may be the main reason for a lack of significant changes in B and δ11B during winter typhoon events.
Rayleigh-like Evolution δ11B Fractionation
As no significant differences within B concentration level and air mass backward trajectory results (Figure 8B) during the summer monsoon, we can assume that the changes to B isotopic ratios were not caused by mixture of marine and high B content endmembers (i.e., biofuel, coal). Apart from the effects of endmember mixing on the atmospheric B isotope, during the sea salt evaporation, condensation, or deposition processes, the isotopic values change and were subsequently affected the B isotope aerosol values. The combination of low B concentration with low δ11B was observed early on and explained by the evaporation of gaseous boric acid from the seawater and subsequent integration in rainwater of isotopically fractionated B (Roux et al., 2017). Boron isotopes in rainwater were then modeled by Rayleigh-like a distillation processes (Rose-Koga et al., 2006; Roux et al., 2017):
With R and R0 as the isotopic ratio of the rainwater and the original atmospheric gaseous B reservoir, respectively. f is the mass fraction of residual gaseous 10B and α is the boron isotopic fractionation factor between the gaseous reservoir and αliquid-vapor = 1.031 (Rose-Koga et al., 2006). The large variations in the 11B/10B ratio of atmospheric B, either as vapor or as precipitation, are related to the seawater boron reservoir via a Rayleigh-like distillation process (Rose-Koga et al., 2006). As mentioned above, we suggest the fractionation factor between liquid and particle is constant (αliquid-particle = 1.021). B isotopes in aerosols should also be affected by a Rayleigh-like distillation process. Using the empirical α value (αliquid-vapor = 1.031), the Rayleigh distillation model of marine aerosols and water/vapor exchange processes can explain most of the B data during the summer monsoon period (Figure 7).
The results show a significant correlation (R2 = 0.47, p < 0.001; Figure 10A) between δ11B and mean temperature for the summer samples. The mean temperature data for the collected day was retrieved from NOAA GSOD (https://www.ncdc.noaa.gov/). Palmer et al. (1987) demonstrated the fractionation factor between the dissolved and adsorbed species (αliquid-particle) remained constant at 5°C and at 40°C. Rose-Koga et al. (2006) demonstrated the fractionation factors between vapor and seawater (αliquid-vapor) also indicated no significant differences between 15°C (1.031) and 30°C (1.026). The variation isotope fractionation with temperature during evaporation and condensation can be ignored. Condensation of marine-derived gaseous B would be the dominant process during the summer when the higher temperatures promote the evaporation of B (Roux et al., 2017). This also enhanced the Rayleigh distillation process, strengthened B isotope fractionation, and decreased the B and δ11B in the aerosol.
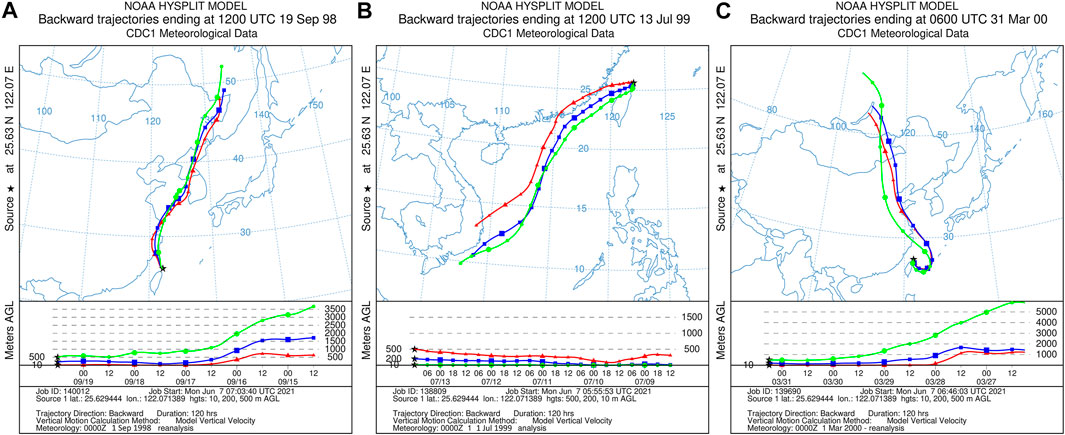
FIGURE 10. The plot of δ11B vs. Temperature in selected aerosols. (A) The summer monsoon period. (B) The NE monsoon period. Temperature data retrieved from NOAA GSOD (https://www.ncdc.noaa.gov/).
There was no significant correlation (R2 = 0.03, p > 0.001; Figure 10B) between δ11B and temperature for the NE monsoon (with the exception of dust and typhoon sample). The δ11B fractionation in Rayleigh distillation were enhanced in temperature increased, this process should be significant for the NE monsoon sample with large temperature range (12.5–27.3°C; Table 2). From our perspective, the δ11B fractionation during phase transformation was significantly lower than two end-member mixing during the NE monsoon months. The B content in coal is much higher than seawater. The B and δ11B in aerosol will be strongly affected by coal emission, if their derived from coal emission and seawater evaporation. The mixing of two end-member has played the most important role for δ11B during the NE monsoon in the winter.
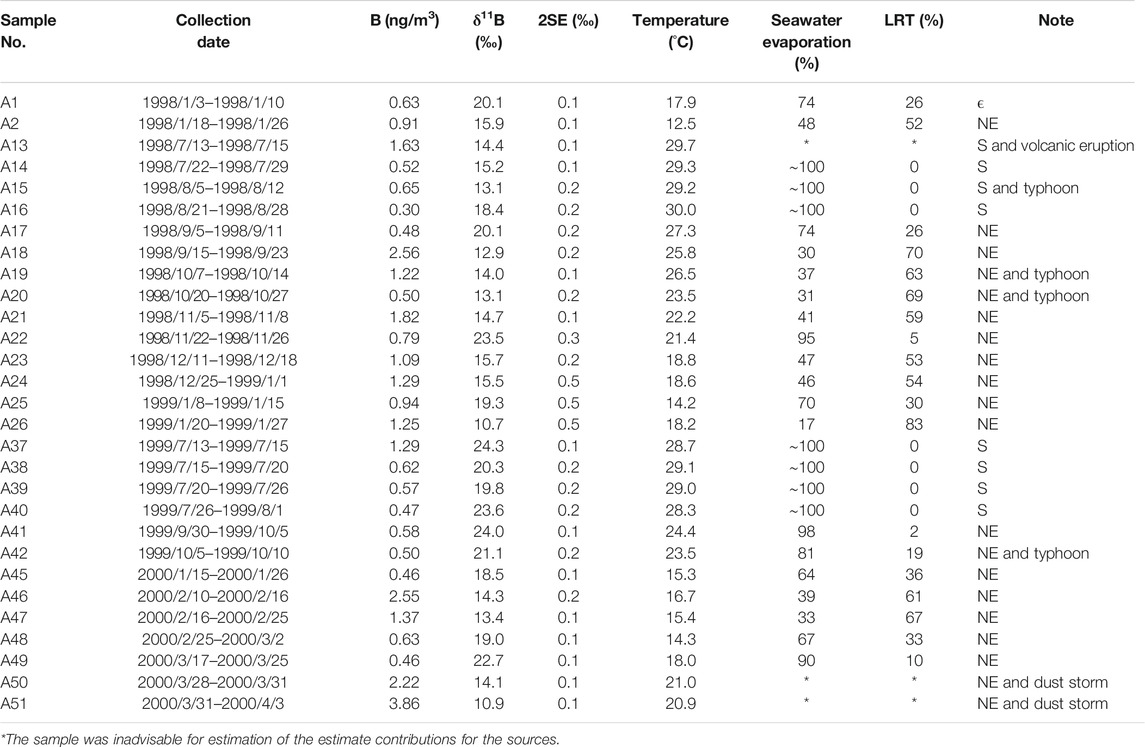
TABLE 2. δ11B, analytical errors (2SE, n = 10), temperature and the estimated relative contributions (%) from seawater evaporation, long-range transported (LRT) in selected aerosols at PCY. Samples were taken during NE monsoon (NE), summer monsoon (S), typhoon, dust storm and volcanic eruption periods. The mean temperature data for the collected day was retrieved from NOAA GSOD (https://www.ncdc.noaa.gov/).
Estimate Relative Contributions of Each Source in Peng Chia Yu Aerosols
As mentioned above, a two endmember mixing model (seawater evaporation and the coal burning) can be used qualitatively for the B and δ11B variations in aerosols during the NE monsoon period, which was supported by the plot of δ11B vs. 1/[B] (Figure 9). The contributions of the sources to total B accumulation can be estimated from an isotopic mass balance perspective as follows:
where the δ11B marine aerosol and δ11Bcoal burning is the δ11B in aerosol derived from seawater evaporation (δ11B = 24.3‰) and coal burning (δ11B = 8‰), respectively. ƒ is the fraction of B derived from seawater evaporation. During the NE monsoon with the exception of dust storm period, the B average contributions derived from seawater evaporation and coal burning from LRT was 57% (17–98%) and 43% (2–83%), respectively (Table 2). Samples taken during dust storm and volcanic emissions events were inadvisable for estimation of the estimate contributions for the sources from this formula, i.e., these samples contain dust or volcanic gas with unknown δ11B. As we mentioned above, Rayleigh-like evolution would be the dominant B fractionation process during the summer monsoon. The B contents in the summer monsoon samples demonstrated no significant differences, which implied that these samples were not mixtures of high B content endmembers (i.e. coal). From our perspective, most B came from seawater evaporation that occurred in the summer monsoon period.
Conclusion
In this study, we presented various B sources, and the characteristics of B and δ11B, in atmospheric aerosols at PCY. Our major observations are summarized below:
1) Seawater evaporation and coal burning are the major sources, characterized by high δ11B (δ11B = 24.3‰) and low δ11B (δ11B = 8‰), respectively. Climatic events including volcanic emissions and dust storms significantly influenced the B and δ11B over short periods of time during the events.
2) The Rayleigh distillation processes would be a dominant cause changes in of B and δ11B in the summer. The mixing of seawater evaporation and coal burning from China has played an important role during the NE monsoon in the winter.
3) The B in aerosols were derived mostly from seawater in the summer. Average B contributions were derived from marine and LRT coal burning at 57 and 43%, respectively, during the NE monsoon.
Data Availability Statement
The raw data supporting the conclusions of this article will be made available by the authors, without undue reservation.
Author Contributions
C-FY, Y-PL, and T-YK conceived and planned the experiments. C-HC, Y-PL, and T-YK carried out the experiments and sample preparation. C-FY, Y-PL, and T-YK contributed to the interpretation of the results. C-FY and Y-PL took the lead in writing the manuscript. C-HC has helped to improve the English in the manuscript. All authors provided critical feedback and helped shape the research, analysis, and manuscript.
Funding
This study is supported by grants from the Ministry of Science and Technology, Taiwan to C-FY (MOST 108-2116-M-006-011).
Conflict of Interest
The authors declare that the research was conducted in the absence of any commercial or financial relationships that could be construed as a potential conflict of interest.
Acknowledgments
We specially thank staff at the Weather Station in PCY and Prof. Fei-Jan Lin at NTU for the aerosols collection.
References
Ali-Mohamed, A. Y. (1991). Estimation of Inorganic Particulate Matter in the Atmosphere of Isa Town, Bahrain, by Dry Deposition. Atmos. Environ. 25, 397–405. doi:10.1016/0957-1272(91)90011-3
Chabas, A., and Lefèvre, R. A. (2000). Chemistry and Microscopy of Atmospheric Particulates at Delos (Cyclades-Greece). Atmos. Environ. 34, 225–238. doi:10.1016/s1352-2310(99)00255-1
Cheng, M.-C., You, C.-F., Lin, F.-J., Chung, C.-H., and Huang, K.-F. (2010). Seasonal Variation in Long-Range Transported Dust to a Subtropical Islet Offshore Northern Taiwan: Chemical Composition and Sr Isotopic Evidence in Rainwater. Atmos. Environ. 44, 3386–3393. doi:10.1016/j.atmosenv.2010.06.012
Cheng, M.-C., You, C.-F., Lin, F.-J., Huang, K.-F., and Chung, C.-H. (2011). Sources of Cu, Zn, Cd and Pb in Rainwater at a Subtropical Islet Offshore Northern Taiwan. Atmos. Environ. 45, 1919–1928. doi:10.1016/j.atmosenv.2011.01.034
Chetelat, B., Gaillardet, J., and Freydier, R. (2009). Use of B Isotopes as a Tracer of Anthropogenic Emissions in the Atmosphere of Paris, France. Appl. Geochem. 24, 810–820. doi:10.1016/j.apgeochem.2009.01.007
Chetelat, B., Gaillardet, J., Freydier, R., and Negrel, Ph. (2005). Boron Isotopes in the Seine River, France: A Probe of Anthropogenic Contamination. Environ. Sci. Technol. 39, 2486–2493. doi:10.1021/es048387j
Fogg, T. R., and Duce, R. A. (1985). Boron in the Troposphere: Distribution and Fluxes. J. Geophys. Res. 90, 3781–3796. doi:10.1029/jd090id02p03781
Hoffman, E. J., Huffman, G. L., Fletcher, I. S., and Duce, R. A. (1977). Further Consideration of Alkali and Alkaline Earth Geochemistry of Marine Aerosols: Results of a Study of Marine Aerosols Collected on Bermuda. Atmos. Environ. (1967) 11, 373–377. doi:10.1016/0004-6981(77)90167-6
Hsu, S.-C., Chen Liu, S., Jeng, W.-L., K. Chou, C. C., Hsu, R.-T., Huang, Y.-T., et al. (2006). Lead Isotope Ratios in Ambient Aerosols from Taipei, Taiwan: Identifying Long-Range Transport of Airborne Pb from the Yangtze Delta. Atmos. Environ. 40, 5393–5404. doi:10.1016/j.atmosenv.2006.05.003
Hsu, S. C., Liu, S. C., Jeng, W. L., Lin, F. J., Huang, Y. T., Lung, S. C. C., et al. (2005). Variations of Cd/Pb and Zn/Pb Ratios in Taipei Aerosols Reflecting Long-Range Transport or Local Pollutant Emissions. Sci. Total Environ. 347, 111–121. doi:10.1016/j.scitotenv.2004.12.021
Kakihana, H., Kotaka, M., Satoh, S., Nomura, M., and Okamoto, M. (1977). Fundamental Studies on the Ion-Exchange Separation of boron Isotopes. Bcsj 50, 158–163. doi:10.1246/bcsj.50.158
Lei, F., Wei, H.-Z., Yi, S.-W., Zeng, L., and Lu, H.-Y. (2021). Variations of the East Asian Monsoon over the Past 800 Kyr Constrained by the boron Isotope Composition of Paleo-Rainwater Inferred from Loess-Paleosol Deposits in NE China. Earth Planet. Sci. Lett. 561, 116826. doi:10.1016/j.epsl.2021.116826
Li, Y. H. (1991). Distribution Patterns of the Elements in the Ocean: a Synthesis. Geochim. Cosmochim. Acta 55, 3223–3240. doi:10.1016/0016-7037(91)90485-N
Lin, T.-H. (2001). Long-range Transport of Yellow Sand to Taiwan in spring 2000: Observed Evidence and Simulation. Atmos. Environ. 35, 5873–5882. doi:10.1016/s1352-2310(01)00392-2
Miyata, Y., Tokieda, T., Amakawa, H., Uematsu, M., and Nozaki, Y. (2000). Boron Isotope Variations in the Atmosphere. Tellus B: Chem. Phys. Meteorology 52, 1057–1065. doi:10.3402/tellusb.v52i4.17083
Palmer, M. R., Spivack, A. J., and Edmond, J. M. (1987). Temperature and pH Controls over Isotopic Fractionation during Adsorption of boron on marine clay. Geochimica et Cosmochimica Acta 51, 2319–2323. doi:10.1016/0016-7037(87)90285-7
Park, H., and Schlesinger, W. H. (2002). Global Biogeochemical Cycle of boron. Glob. Biogeochem. Cycles 16, 20–21. doi:10.1029/2001gb001766
Rose-Koga, E. F., Sheppard, S. M. F., Chaussidon, M., and Carignan, J. (2006). Boron Isotopic Composition of Atmospheric Precipitations and Liquid-Vapour Fractionations. Geochimica et Cosmochimica Acta 70 (7), 1603–1615. doi:10.1016/j.gca.2006.01.003
Roux, P., Turpault, M.-P., Kirchen, G., Redon, P.-O., and Lemarchand, D. (2017). Boron Dissolved and Particulate Atmospheric Inputs to a forest Ecosystem (Northeastern France). Environ. Sci. Technol. 51 (24), 14038–14046. doi:10.1021/acs.est.7b03226
Sakata, M., Ishikawa, T., and Mitsunobu, S. (2013). Effectiveness of Sulfur and boron Isotopes in Aerosols as Tracers of Emissions from Coal Burning in Asian Continent. Atmos. Environ. 67, 296–303. doi:10.1016/j.atmosenv.2012.11.025
Sakata, M., Natsumi, M., and Tani, Y. (2010). Isotopic Evidence of boron in Precipitation Originating from Coal Burning in Asian Continent. Geochem. J. 44, 113–123. doi:10.2343/geochemj.1.0049
Sakata, M., Phan, H. G., and Mitsunobu, S. (2017). Variations in Atmospheric Concentrations and Isotopic Compositions of Gaseous and Particulate boron in Shizuoka City, Japan. Atmos. Environ. 148, 376–381. doi:10.1016/j.atmosenv.2016.11.013
Schlesinger, W. H., and Vengosh, A. (2016). Global boron Cycle in the Anthropocene. Glob. Biogeochem. Cycles 30, 219–230. doi:10.1002/2015gb005266
Wang, B.-S., You, C.-F., Huang, K.-F., Wu, S.-F., Aggarwal, S. K., Chung, C.-H., et al. (2010). Direct Separation of boron from Na- and Ca-Rich Matrices by Sublimation for Stable Isotope Measurement by MC-ICP-MS. Talanta 82 (4), 1378–1384. doi:10.1016/j.talanta.2010.07.010
Williams, L. B., and Hervig, R. L. (2004). Boron Isotope Composition of Coals: a Potential Tracer of Organic Contaminated Fluids. Appl. Geochem. 19, 1625–1636. doi:10.1016/j.apgeochem.2004.02.007
Zhang, T., Cao, J. J., Tie, X. X., Shen, Z. X., Liu, S. X., Ding, H., et al. (2011). Water-soluble Ions in Atmospheric Aerosols Measured in Xi'an, China: Seasonal Variations and Sources. Atmos. Res. 102, 110–119. doi:10.1016/j.atmosres.2011.06.014
Keywords: aerosol, boron isotopes, long-range transported, local emission, tracers
Citation: Lin Y-P, You C-F, Kao T-Y, Chung C-H and Hung C-CG (2021) Boron Isotopic Analysis of Representative Atmospheric Aerosols Derived From Long-Range Transported/Local Emission on an Islet Offshore NE Taiwan. Front. Environ. Sci. 9:697844. doi: 10.3389/fenvs.2021.697844
Received: 20 April 2021; Accepted: 10 June 2021;
Published: 23 June 2021.
Edited by:
Maciej Górka, University of Wrocław, PolandReviewed by:
Ashwini Kumar, Council of Scientific and Industrial Research (CSIR), IndiaAndrius Garbaras, Center for Physical Sciences And Technology (CPST), Lithuania
Yangmei Zhang, Chinese Academy of Meteorological Sciences, China
Copyright © 2021 Lin, You, Kao, Chung and Hung. This is an open-access article distributed under the terms of the Creative Commons Attribution License (CC BY). The use, distribution or reproduction in other forums is permitted, provided the original author(s) and the copyright owner(s) are credited and that the original publication in this journal is cited, in accordance with accepted academic practice. No use, distribution or reproduction is permitted which does not comply with these terms.
*Correspondence: Chen-Feng You, Y2Z5MjBAbWFpbC5uY2t1LmVkdS50dw==