 Aly Noyola Cabrera
 Arjan Droste
 Bert G. Heusinkveld1
 Gert-Jan Steeneveld
95% of researchers rate our articles as excellent or good
Learn more about the work of our research integrity team to safeguard the quality of each article we publish.
Find out more
ORIGINAL RESEARCH article
Front. Environ. Sci. , 20 August 2021
Sec. Environmental Informatics and Remote Sensing
Volume 9 - 2021 | https://doi.org/10.3389/fenvs.2021.673937
This article is part of the Research Topic Urban Climate Informatics View all 12 articles
The ongoing urbanization requires enhanced understanding of the local meteorological and climatological conditions within the urban environment for multiple applications, concerning energy demand, human health, and spatial planning. Identifying areas with harmful meteorological conditions enables citizens and local authorities to take actions to optimize quality of life for urban dwellers. At the moment cities have (in general) limited networks of meteorological monitoring stations. To overcome this lack of observations, the use of non-traditional data sources is rapidly increasing. However, the use of such data sources without enough prior verification has become a controversial topic in the scientific community. This study aims to verify and assess one of the main non-traditional data sources, i.e. smartphones. The goal is to research the potential of smartphones (using the Samsung Galaxy S4 as an example phone model) to correctly sense air temperature, relative humidity, and solar radiation, and to determine to what extent environmental conditions negatively affect their performance. The smartphone readings were evaluated against observations from reference instrumentation at a weather station and a mobile measurement platform. We test the response time of the smartphone thermometer and hygrometer, and the light sensor’s cosine response. In a lab setting, we find that a smartphone can provide reliable temperature information when it is not exposed to direct solar radiation. The smartphone’s hygrometer performs better at low relative humidity levels while it can over-saturate at higher levels. The light sensor records show substantial correlation with global radiation observations, and short response times. Measurements along an urban transect of 10 km show the smartphone’s ability to react to fast changes of temperature in the field, both in time and space. However, a bias correction (dependent on wind speed and radiation) is required to represent the reference temperature. Finally we show that after such a bias correction, a smartphone record can successfully capture spatial variability over a transect as well.
Urban meteorology has been studied for nearly 200 years, including the “Urban Effects’” on temperature (Oke, 1982; Arnfield, 2003) and humidity (Hage, 1975). Howard (1833) was the first to show that air temperature is generally higher within a city (∼ 2°C higher) compared to its surroundings, known as the urban heat island (UHI). The intensity of the UHI and other “Urban Effects” depend largely on local climate, surrounding geography, extent of urban environment, urban geometry, type and quantity of anthropogenic emissions (Rydin et al., 2012; Oke et al., 2017) and population density (e.g., Steeneveld et al. (2011); Shi et al. (2019); Li et al. (2020)). Anthropogenic heat production is another key concept in urban meteorology, defined as the heat flux generated by vehicular emissions, heating and cooling of buildings, industrial processing Sailor (2011) and metabolic heat release by people (Santamouris and Kolokotsa, 2016).
The impacts of the UHI on society are diverse and interdependent, ranging from negative effects on human health to increased energy consumption. During warm spells the UHI can intensify health problems like heat strokes, and dehydration: especially to those with diabetes (Kovats and Bickler, 2012). Increased exposure to high temperatures shows an increment in morbidity and mortality rates (Höppe, 2002; Laaidi et al., 2006; Tertre et al., 2006; Baccini et al., 2008; Gasparrini et al., 2015). The IPCC (2014) states that by the end of the 21st century, heat-waves might double their frequency (in the worst case scenario RCP8.5), which will strongly impact the urban environment.
The urban microclimate also influences energy demand related to heating and cooling of buildings (Allegrini et al., 2012). This rising energy demand potentially increases both anthropogenic heat production and greenhouse gas emissions, creating a positive feedback loop. Several studies have found high correlations between temperature and energy demand (Keirstead and Sivakumar, 2012; Fazeli et al., 2016). These findings are already being considered by the urban design community (Svensson and Eliasson, 2002; Pijpers-van Esch, 2015; Klemm et al., 2017) whilst some governmental agencies are working on ways to minimize the negative effects of the UHI. All the mentioned problems can be reduced or even mitigated by early warning systems together with the identification of the most susceptible areas within a city.
The understanding of urban meteorology is of paramount importance as illustrated above. Gaining a better understanding of urban meteorological phenomena will allow meteorological institutes to develop better and faster weather forecasting systems, which consequently will facilitate timely and precise warning mechanisms to prevent adverse health problems and casualties. Many countries already implemented Heat Health Warning Systems, which have been promoted by the World Health Organization and the World Meteorological Organization. However, these warning systems are commonly based on simplified thermal assessment procedures. More detailed forecasting methods could offer more precise warnings in the near future (MacLeod et al., 2016; Di Napoli et al., 2020). A higher spatial density of these forecasting systems is necessary to determine local effects of urban meteorology phenomena including the UHI (Rydin et al., 2012; Ronda et al., 2017). Even though there are some networks of professional in-situ meteorological stations in several cities around the world, this is still not enough to research UHI at a finer scale.
To overcome the lack of spatiotemporal availability of meteorological observations in cities, crowdsourcing and citizen science projects might offer an alternative data source Meier et al. (2017); Chapman et al. (2017); Nipen et al. (2019); Masson et al. (2020); Cheval et al. (2020); Bárdossy et al. (2020). Muller et al. (2015) define crowdsourcing as: “obtaining data or information by enlisting the services of a potentially large number of people and/or sensors, generally transmitted via Internet”. Chapman et al. (2017) discuss whether using crowdsourcing weather observations is part of a paradigm shift in observational techniques in the atmospheric sciences. They conclude crowdsourcing has potentially far-reaching consequences for the way in which measurements are collected and used in the field. A large amount of data is now being obtained from such sources, and the quantity is substantially increasing Krennert et al. (2018); Uteuov et al. (2019). Zhu et al. (2020) summarized the crowdsourcing efforts at meteorological and hydrological services and categorized the use of crowdsourced data in relationship discovery, knowledge generalization and systemized service. Nazarian et al. (2021) provide a thorough showcase of the use of wearable devices (smartphones, smartwatches etc.,) to study biometeorology and (urban) heat exposure. Such devices are typically worn close to the skin, making them excellent choices for heat stress studies. The potential of using cars and other vehicles as sensor platforms has been acknowledged for a time now (Mahoney and O’Sullivan, 2013; Abdelhamid et al., 2014), and though the techniques are still being developed, recent results seem promising for e.g., improving precipitation forecasts based on windshield wiper data from cars (Siems-Anderson et al., 2020).
Nowadays, many people around the world carry smartphones, which are potential data acquisition devices. Several projects have been developed to take advantage of many smartphone features and sensors: among others, Madaus and Mass (2017) used smartphone pressure records harvested via crowdsourcing to assimilate in numerical weather prediction models to enhance the forecast of severe weather events. Overeem et al. (2013) used smartphone battery temperature records taken in eight different metropoles across the globe to estimate the air temperatures on a daily-mean and city-wide scale. Thereto they developed a linear heat-transfer model that accounts for heat conduction between the smartphone to the human body on one hand and to the atmosphere on the other hand. With about 800 smartphones records per day, they were able to successfully estimate air temperatures. Using São Paulo as testbed, Droste et al. (2017) refined this method towards smaller (hourly) scales and showed that this method also allows for estimating differences in the UHI effect between neighborhoods. A lab-test to refine this technique was performed by He et al. (2020), which reduced the temperature bias to around 1°C. In addition, de Vos et al. (2020) show the potential of the combined crowdsourcing of temperature, humidity, rainfall and radiation illustrated for Amsterdam (the Netherlands), using among others 3.14 million smartphone records collected over just 1 month. Also, Mandement and Caumont (2020) successfully applied low cost personal weather stations to monitor the evolution of deep convection.
Data from such unorthodox sources require a stringent quality-control to ensure its usefulness, since the devices are typically not built to measure the environment at high accuracy. Hamdi et al. (2020) mention the need to identify the signal-to-noise ratio in crowdsourced observations. Machine learning is often applied as a way to reduce this noise; e.g., Trivedi et al. (2021) successfully use machine learning to use smartphone records for estimating indoor temperatures, and Li et al. (2021) devised a bias-correction method for smartphone pressure data based on a machine learning approach. Napoly et al. (2018) and Meier et al. (2017) have developed a quality-control procedure for personal weather stations measuring temperature, and similar procedures have been developed for rainfall (de Vos et al., 2019) and wind observations (Droste et al., 2020).
Despite these research efforts, the accuracy and response times of smartphone sensors are poorly known. Some disadvantages of using smartphones as measurement equipment have been brought to light, but those mostly relate to the phone and its usage as a whole, not the sensors themselves. Examples are uncertain GPS location (indoors vs outdoors); unknown elevation; or the influence of human behavior on the readings. Knowledge about the performance of the most useful sensors for urban meteorology inside smartphones and identifying the variables that affect accuracy and reliability will enhance the potential of this crowdsourcing data. This study aims to investigate the accuracy and response times of smartphone temperature, humidity and light sensors, during different usage conditions. The goal of this work is to establish what the potential of the smartphone as a measurement platform is, in terms of response times and accuracy. To that end, we specifically focus on direct smartphone sensor measurements, and not of derived quantities using the battery temperature, for instance. We also aim to identify potential error sources that influence smartphone sensor readings. We make use of a specific type of smartphone: the Samsung Galaxy S4, a relatively older model which contains several environmental sensors, to answer the following research questions:
1. How do smartphone readings of air temperature, relative humidity and solar radiation compare (in accuracy and response time) to reference sensors specifically designed for meteorological observation? In particular, under weather conditions that are favorable for high UHI, as well as for different usage conditions (battery charging, intensive CPU usage etc.,)
2. Which variables and environmental conditions affect smartphone readings of ambient temperature and relative humidity, and to what effect?
While we do use a specific type of smartphone, we expect the type of error sources and typical response times to be illustrative for not just the specific sensor types in the S4, but rather for any smartphone used as a measurement platform. While values of response times might change between sensor brands, the errors and typical responses are expected to be more universal, related to how a smartphone is built and used. This paper is organized as follows: Section 2 presents our methodology and utilized observations, and section 3 presents the results for the temperature, humidity and light sensor. Section 4 discusses our findings and conclusions are drawn in section 5.
Air temperature, relative humidity and light intensity readings are obtained with a Samsung Galaxy S4 GT-I9515 smartphone (running Android 5.0.1). This smartphone has been selected for its wide global distribution, since more than 40 million devices were sold. This device incorporates the SHTC11 digital humidity and temperature sensor developed and manufactured by Sensirion. Furthermore, the smartphone contains a CM3323E light sensor, which is primarily used to sense RGB and white light to automatically adjust brightness and color temperature of the device screen. All sensor data is retrieved from the phone using the Android application “AndroSensor v1.9.6.3”. The main set of experiments was performed during September 2017 through to March 2018. A second field experiment under summer conditions was executed during a hot spell in June 2021.
Smartphone temperature (Ts), relative humidity (RHs), and light (Ls) are compared against in-situ measurements and (over a trajectory) against instrumentation mounted on a custom measurement-tricycle developed by Heusinkveld et al. (2010). The micrometeorological observations on the tricycle consist of a shielded thermometer-hygrometer (model CS215L, Campbell Scientific, United States), an ultrasonic 2-D anemometer (Gill WindSonic, Gill Instruments, United Kingdom) six pyranometers (Hukseflux) and six pyrheliometers, and a GPS system (Figure 1). In addition the wheel speed is recorded to estimate the true wind speed by correcting the sonic anemometer record with the wheel speed. Further details about the tricycle and its use in urban climate research are available in Heusinkveld et al. (2014) and Koopmans et al. (2020).
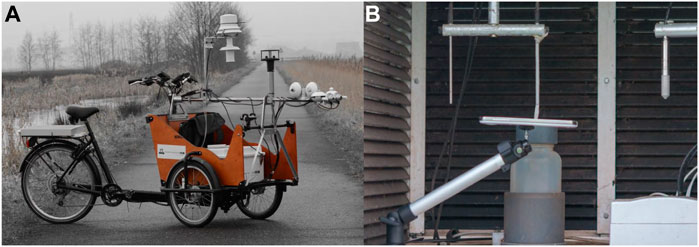
FIGURE 1. The measurement cargo tricycle (A) and the smartphone setup in the Stevenson screen at the Veenkampen weather field (B). The smartphone is positioned horizontally with minimum contact points to prevent conduction.
The experiments took place in and around Wageningen (the Netherlands) which is a mid-size town of about 3 × 3 km, and with ∼ 39,000 inhabitants. The site is located in a temperate climate [Cfb in the Köppen climate classification, Kottek et al. (2006)]. The urban morphology of Wageningen consists of typically two to three stories tall residential buildings. Observations from the Veenkampen weather station2, run by the Meteorology and Air Quality section of Wageningen University, are used to evaluate the accuracy of Ts, RH and Ls readings under diverse meteorological conditions. The weather station is located to the west of Wageningen (51.981°N, 5.622°E), and consists of a flat well-watered and regularly mowed grass field over a 0.5 m clay soil on top of a 1.5 m peat soil layer. The site has a Stevenson screen to measure temperature and humidity at 1.5 m level by a Väisälä-HMP155 sensor, containing a heated humidity sensor, and a PT100 temperature sensor. The measurement accuracy amounts to 0.2 K for temperature and 2% for RH (for 10 < RH <100%).
The first step in the research quantifies the response time of Ts, RHs and Ls. Time response is defined as the amount of time it takes to a sensor to respond to a rapid change of a variable, and reach the new value. To quantify this response the calculation of a time constant (τ) is needed. τ is the time for the system (sensor) needed to reach 63.2% or 1—(1/e) of its final asymptotic value (the expected value). To determine τ of the sensors, they have to reach an equilibrium state and then get exposed to a step change. The following series of experiments are designed to obtain (τ) for Ts and RHs (Table 1 contains the overview of the different experimental setups of this study):
1. To quantify the response time of Ts and RHs, the smartphone records data in a room at a constant temperature and constant relative humidity.
2. After reaching equilibrium the device is situated in a new place with different but also stable levels.
3. The experiments to calculate the response time have been designed in both directions (from warm to cold, from dry to humid, and vice versa) and starting from different steady states. The experiment has been repeated 12 times in each direction.
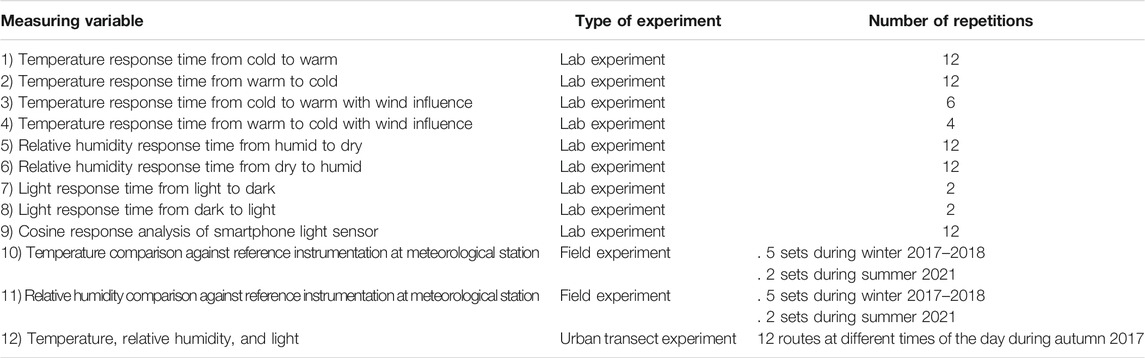
TABLE 1. Overview of the different experiments performed for this study.
For instance, the device is placed at room temperature/humidity (∼18°C and 60% RH), and then the smartphone is quickly placed into a freezer, which has a lower temperature and higher RH (∼ −8°C and 75% respectively) until equilibrium is reached. Precise details of starting and environmental temperature and RH are provided in the Supplementary Material. At all times the device is positioned on top of a platform which only has 3 contact points to minimize heat transfer. After some time, the equilibrium is reached, and the device is put outside the freezer until a new steady state is attained. In order to include more step-changes from different temperature levels, the device in some cases is also positioned below an incandescent light, which generates stable high temperatures (around 40°C). The selected sampling rate for these tests is 1 s with a resolution of 0.01°C and 0.01% RH. Furthermore, it is also important to understand the effect of wind on Ts and RHs response times. Hence, the previously explained experiment has been repeated while varying the wind speed. For these cases, a fan is used to generate wind, measured by a cup anemometer. This experiment variation has been repeated 10 times.
The response time of the light sensor is not specified by the manufacturer, but usually this type of sensor responds fast to a step change. To quantify τ of Ls:
1. The device is located in a dark room.
2. The light sensor is suddenly exposed to an intense concentrated light source, using a lamp.
3. The procedure is performed in the opposite way (from light to darkness).
Considering that a light sensor tends to have a relatively small τ, 10 milliseconds is the selected sample rate, which is the fastest rate available by the AndroSensor application.
Measurement accuracy of the smartphone is tested using the Veenkampen weather field reference instruments. Four different experiments are designed and executed to test the sensor accuracy under various conditions:
1. The smartphone is placed at the weather field, inside a Stevenson screen (Figure 1) next to the reference hygrometer and thermometer, at 1.5 m height. Data is recorded for 5 blocks of 12 daytime hours.
2. The smartphone is placed outside the Stevenson screen, around 0.5 m away at 1.3 m height.
3. The smartphone battery is being charged and smartphone’s CPU is under heavy workload. The experiment runs for 60 min and is executed under stable and constant room temperature.
4. Ts and RHs are compared against instrumentation installed in the tricycle (described in section 2 and Figure 1). The objective of this comparison is to analyze the accuracy of the smartphone readings across an urban transect, and to evaluate the characteristics and understand the general features of the data.
Data from the experiment outside the Stevenson screen, and the experiments mounting the smartphone on the tricycle are used to assess the accuracy of Ls. In addition, we test the response of the light sensor to radiation incident at an angle with respect to the surface. The sensor’s response to radiation incident at different angles is a parameter widely used to understand its capacity and overall quality. The response of such sensors to radiation incident at an angle θ, with respect to the horizontal plane is called cosine response. We calculate the cosine response by directing a light beam towards the sensor from different angles, always maintaining the same distance and light intensity. The ideal cosine response is proportional to θ, and any deviation from this ideal value causes underestimations (Martínez et al., 2009).
This section presents the results of the analyses for the sensor response time, accuracy and bias identification of the temperature, relative humidity and light sensors in a lab environment (in sections 3.1–3.3, respectively). Subsequently, the spatial/temporal performance of the smartphone sensors will be compared against reference instruments, as well as a bias-correction procedure following this verification (section 3.4).
As previously described, τ equals the time required by the thermometer to register 63.2% of a step change in air temperature (WMO, 2014). According to the manufacturer3, the SHTC1 sensor installed in the Samsung S4 has a τ between 5 and 30 s. However, as shown in Supplementary Table S1 and Supplementary Table S2, such values are difficult to achieve because the sensor is enclosed inside the device, and the ventilation is poor. The average τ estimated for the negative step-change in temperature amounts to 188.25 and 161.76 s for a positive step-change, with a standard deviation of 27.13 and 56.68 s, respectively (Supplementary Table S1 and Figure 2). The WMO states that for routine meteorological observations there is no advantage in using thermometers with very small τ. Instead, they recommend the use of thermometers with a τ of approximately 20 s (WMO, 2008; Burt and de Podesta, 2020). However, thermometers with large time constants can introduce errors in cases where air temperature changes at a fast rate (e.g., during urban transect measurements). Since τ is the time required for the sensor to reach 63.2% of a step change, five times τ is the time required to get a near full reading (99.3%). Therefore, during an abrupt change in temperature the smartphone might take around 15 min to get a correct reading compared, where 1.6 min is recommended for conventional meteorological observations with a thermometer.
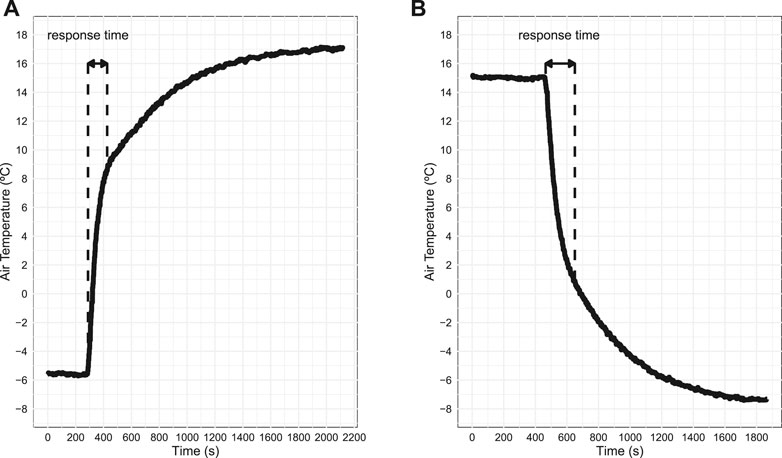
FIGURE 2. Observed temperature response for a positive (A) and negative (B) temperature exposure for one of the 12 experiments performed (see text). The time axis represents time since start of the measurements (s). Dashed lines indicate the estimated response time (τ).
The difference between the time responses can be explained since a relatively warm smartphone in a cold environment will induce turbulent convection which is an efficient transport mechanism for heat. On the contrary, when a relatively small cold smartphone is located in a warm environment, a stable layer will form over the smartphone, and turbulent transport in stable conditions is suppressed, which inhibits the heat exchange and as such results in a longer response time. The temperature response curve appears to behave like a second order system, with an overshoot (peak) in the temperature measured as consequence of the step change. However, after the overshoot, the response time appears to return to equilibrium as a first order system instead of having an oscillation effect.
The origin of the behavior previously described is difficult to identify, the measurements were taken alongside a calibrated Digital thermometer (GTH 175/Pt), and such behavior was not present in the thermometer readings. It seems that Sensirion (the sensor manufacturer) put in place a software algorithm which calibrates the air temperature readings by using “information from other areas of the device”, presumably battery temperature readings. This is called “The Sensirion Compensation Engine”, and according to them, the algorithm is specially calibrated for the Samsung S4 smartphone4. The same posts suggests that the post-processing algorithm helps to improve temperature response time. So, perhaps this compensation algorithm generates the measurement errors previously described. The latter might happen since ambient air is also supplied to the battery temperature sensor (due to wind exposure) warming it up at a faster rate than the assumed by the compensation-algorithm, therefore, generating the observed sudden increase in the sensed air temperature. Without further details on the functioning of the algorithm it is impossible to confirm this hypothesis. Such a “black box” algorithm is likely present in most mobile devices, where the manufacturers do not always detail how these algorithms are set up. As such, they could be considered inherent to such mobile devices which needs to be taken into account when using these devices to gather environmental data.
All the lab experiments described above were executed with airflow close to 0 ms−1. However, as stated by the WMO (2008), τ depends on the airflow over the sensor, which required some experiments to assess how wind affects τ. In theory, wind might help to reduce response time, since it helps to refresh the sensor with ambient air temperature and more efficiently dissipate heat. A separate set of experiments (not shown here) simulated the effect of low wind speeds (between 0.5 and 4 ms−1 generated by an electric fan) on τ. The τ for the experiments with wind was consistently higher than a wind-less environment. This could be caused by condensation of water vapor on the smartphone when moving into a warmer environment: this moisture requires energy to be evaporated again (a latent heat flux). Since this energy needs to be provided by the smartphone, this prolongs the time before temperature equilibrium is reached. All the ten experiments performed under these conditions exhibit the same behavior.
The air temperature measurements from the smartphone Ts are compared and validated against the air temperature readings from the Veenkampen meteorological station (Tref). One set of experiments was performed under relatively cold autumn and winter conditions (afternoon temperatures around 10°C; Figure 3) and another during a warm spell in summer (afternoon T above 25°C; Figure 4). The smartphone was placed inside the same Stevenson screen for 5 days, at the same height (1.5 m) as the calibrated thermometer, as described in section 2. The results show a cold bias for the smartphone both for the autumn and summer experiments (Figures 3,4, respectively). The mean error including day and night measurements amounts to −2.0°C. The timeseries is very similar to the reference, with the smartphone exhibiting a cold bias, even during much hot conditions. Part of the summer experiment also included a duplicate measurement with another smartphone of the same model, measuring at the same location. Differences between these duplicate measurements were not statistically significant (MAE of 0.1°C and RMSE of 0.13°C; results not shown), which indicates that this bias is systematic and not due to a single faulty sensor. Additionally, since the autumn and summer experiments were 3.5 years apart yet find a nearly identical bias, it suggests the sensors have not been subject to degradation due to aging. We find that the distribution of the observed temperature between the smartphone and the temperature sensor at Veenkampen meteorological station is very similar (Figure 5). Ts and Tref correlate very well: results show a strong positive linear relation with a Pearson correlation coefficient of 0.99 with a p-value < 0.05. The mean error was similar for the temperature range during the observations from inside the Stevenson screen, pointing at a good performance for sensitivity.
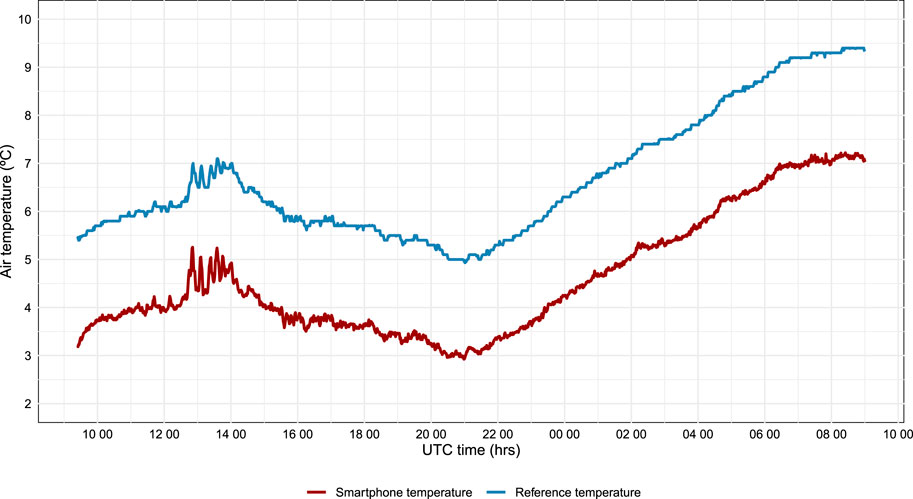
FIGURE 3. Time series of observed air temperature from the smartphone and reference weather station Veenkampen. During this experiment the smartphone is located inside the Stevenson screen. The experiment was executed from January 27th 2018 10:00 UTC till January 28th 2018 10:00 UTC.
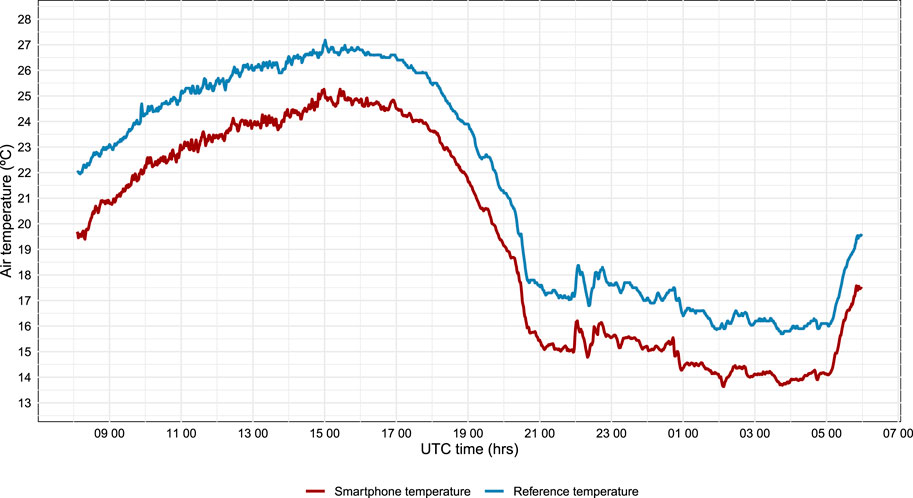
FIGURE 4. Time series of observed air temperature from the smartphone and reference weather station Veenkampen during a follow-up experiment in June 2021. During this experiment the smartphone is located inside the Stevenson screen. The experiment was executed from June 3rd 2021 08:00 UTC till June 4th 2021 06:00 UTC.
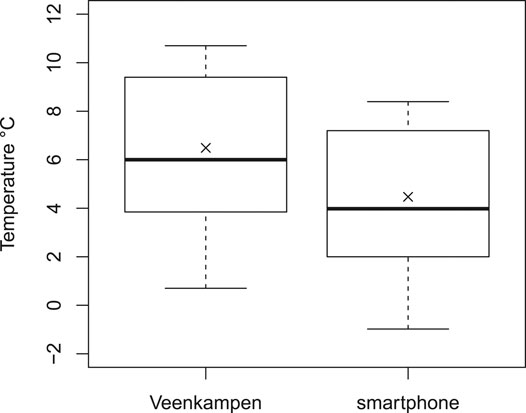
FIGURE 5. Box-plot comparing 1.5 m height air temperature observations from the smartphone and Veenkampen meteorology station thermometer (for the autumn and winter experiments). Smartphone is placed in the same Stevenson screen. Each box ranges from 25th to 75th percentile (interquartile range IQR), median is denoted as the horizontal line inside the box, arithmetic mean is represented by the cross, whiskers have a maximum length of 1.5 * IQR.
Heat generated by the smartphone battery and electronics when it is under heavy CPU/GPU workload has proven to be a major source of error for temperature measurements, and it is a source that is not directly related to external weather conditions. Ts can easily give readings twice as warm as the actual air temperature: one experiment resulted in Ts reading 35°C when the actual room temperature was 15°C. For this particular experiment the smartphone was placed directly over a textile padding for 60 min, it was covered by a cotton cloth (simulating being inside a pocket), thus, hindering the heat exchange between the smartphone and the atmosphere. Such conditions would portray a common usage of the phone.
Even providing the best possible conditions for the smartphone to dissipate the heat by itself (smartphone placed over a platform with a negligible contact area), Ts was 20°C in contrast with the 15°C room temperature, with a temperature increase rate of 1°C per minute after the workload simulation started (results not shown). In section 3.1.1 the mean response time was calculated for both positive and negative step changes (under lab conditions), but these values are not valid when Ts increases due to internal heat generation since the temperature changes are not fast enough to be considered step changes. For comparison a pseudo response time is calculated. The pseudo response time for the smartphone to cool down after heavy CPU/GPU workload amounts to 27 min, which might be a relatively long period for many meteorological applications, and is nearly double the τ previously found. This experiment was performed under conditions without wind, and thus with limited turbulent exchange of heat between the smartphone and the air, which explains the relatively long response time. In real-world applications the phone might be subject to air flows, which would make heat transfer much more efficient, as shown in section 3.1.1.
For the case when the smartphone battery is charging, the error proved difficult to characterize. During the charging, Ts decreases in sudden jumps. The most viable explanation for this behavior resides in the post-processing algorithm, which apparently tries to compensate for the increase in temperature caused by the battery being charged.
One of the main external sources of temperature measurement errors (for conventional thermometers) is the incoming solar radiation. Its effects become more prominent in cases where a sensor is directly exposed to solar radiation without proper ventilation. An effective ventilation system supplies a constant flow of ambient air to the sensor, thus preventing overheating issues. As shown in section 3.1.2, when the smartphone measures temperature inside a properly built Stevenson screen, measurement errors as consequence of global radiation (direct + diffuse solar radiation) are not relevant. However, during active outdoor use, the smartphone will likely be exposed to direct sunlight, hence it is necessary to quantify the relation between solar radiation and temperature error. This research took place mostly in winter; therefore, higher radiation values were artificially created using a heat lamp. Figure 6 shows the smartphone mean temperature bias as a combined function of wind speed and global radiation. The values are obtained from the experiments performed outside the Stevenson screen. The higher the radiation levels are at low wind speed, the more the device overheats, and the lack of ventilation prevents the ambient air from outside to quickly reach the sensor, thereby, increasing Ts.
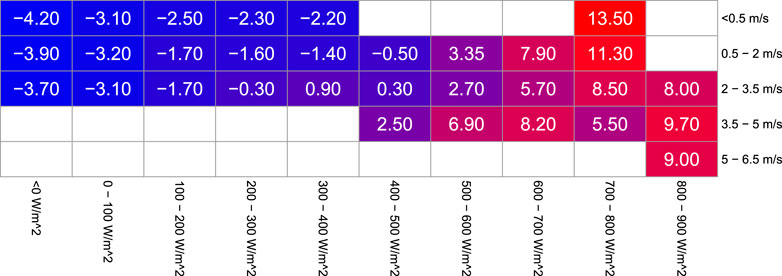
FIGURE 6. Radiation bias of smartphone temperature readings Ts as a function of wind speed and global radiation.
Note that when the smartphone is exposed to more than 600 Wm−2 the wind speed appears to play a relatively larger role. Lack of ventilation appears to worsen temperature measurement errors at relatively high values of global radiation, whereas at low levels of radiation it is less dominant. During nighttime (global radiation ≤0 Wm−2) the smartphone showed readings with an average of 4.2°C lower than the reference value, this is a net difference of 2.1°C colder in comparison with the smartphone inside the temperature screen. This difference suggests that the smartphone outside the Stevenson screen emits net more long-wave radiation which is not corrected for. The glass of which a smartphone has been composed of has a surface emissivity typically between 0.92 and 0.94, which is substantially smaller than the emissivity of the atmosphere. This process of rapid cooling is similar to the relatively rapid cooling of a car’s windshield on a clear calm night.
For the capacitive relative humidity sensor found in the Samsung S4, Sensirion specifies that τ = 8 s5, though this value corresponds to a stand-alone sensor at 25°C and an airflow of 1 ms−1. Twelve experiments were performed: the first ten experiments to calculate τ for a positive step-change involved an actual change of humidity in the air, while the last two, represent τ where the humidity remains constant but temperature decreases. The experiments show a much slower response time compared to manufacturer specification. When a change in humidity occurs, the average τ amounts to 13.4 min and when a change in relative humidity is only driven by a temperature change, τ is faster, with 4.7 min (details in Supplementary Table S3 and Supplementary Table S4). In the case of the negative step-change experiments (Figure 7), the results show an interesting phenomenon. When the smartphone is exposed from a cold and humid environment (inside the freezer) to a warmer and drier one (room temperature), the water vapor present in the surrounding air condenses outside and inside the smartphone. The condensation generates an abrupt increase in relative humidity, producing measurement errors and delaying the real response time of the sensor (see peak in Figure 7). Note that the abrupt initial decrease in RHs is an expected behavior: the hygrometer is reacting to the sudden change in temperature. In two cases, τ of RHs surpassed 30 min. However, without condensation occurring in the experiment, the average response time amounts to 2.04 min (Supplementary Table 3). WMO (2008) states that ideal τ for relative humidity sensors is between 1 and 50 s.
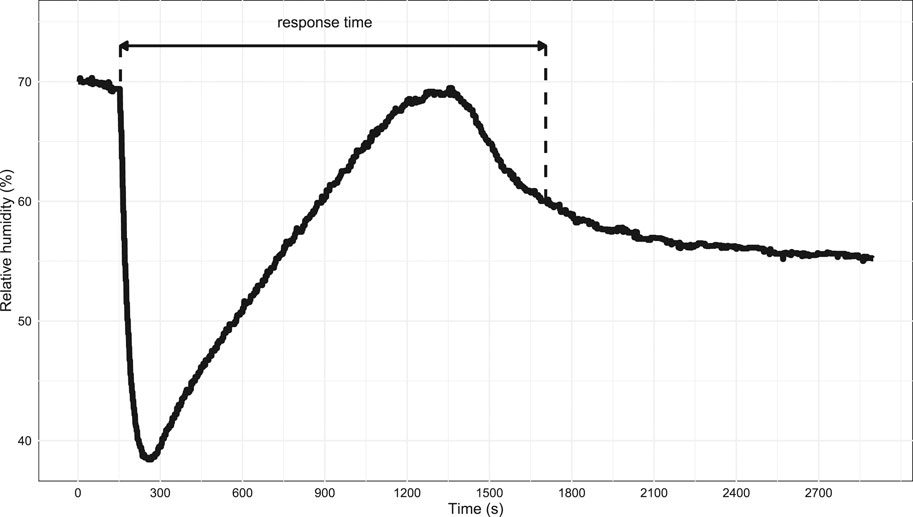
FIGURE 7. Negative step-change of relative humidity. The time axis represents time since the start of the measurements (s). The peak present around 1,300 s is a result of a measurement error generated by the condensation of water vapor present in the air surrounding the smartphone, this effect prolongs the response time of the sensor to a step-change in relative humidity.
Relative humidity measurements from the smartphone (RHs) are compared against reference observations from the Veenkampen meteorological station (RHref). The results show a mean positive bias of 7.42% RH when taking all the measurements into account. However, as shown in Figure 8, generally when RHref is greater than 90%, RHs reaches 100% RH, suggesting an oversaturation of the sensor. For this reason, a more accurate bias is calculated where RHs values of 100% are excluded, resulting in a mean bias of +8.16% RH. The Pearson correlation coefficient between RHs and RHref is 0.69, suggesting a moderate positive linear relation (p < 0.05). Possible causes of the errors are discussed in the following section.
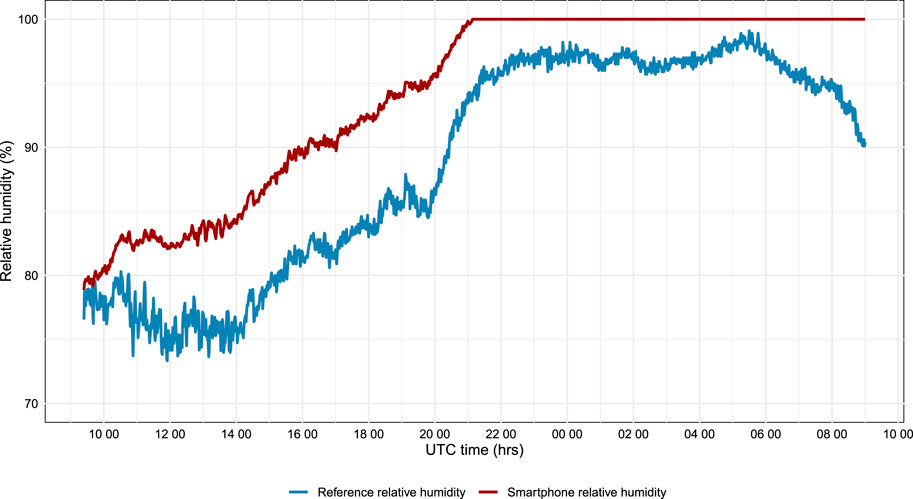
FIGURE 8. Observed RH by the smartphone sensor (red line) and the reference observations (blue line) for a 24 h period at the Veenkampen weather station. In this experiment, the smartphone was located inside the Stevenson screen for January 27th 2018 10:00 UTC—January 28th 2018 10:00 UTC.
To assess relative humidity measurements and quantify biases is a challenging task for many reasons. First, the sensor in the smartphone is a relatively inexpensive electrical capacitive hygrometer, which is not individually calibrated (the phones are mass-produced). Thus, the calibration process is not perfect, and the sensor might have significant systematic biases. For the case of the SHTC1 smartphone sensor, the accuracy is within ±4.5% RH (where the % unit is in RH units and not a percentage of the measurement) for RH between 20 and 80% at 25°C, and the accuracy might decrease to ±7.5% with RH < 20% and RH > 80%. Since the accuracy of relative humidity also depends on air temperature, typical RH accuracy values are evaluated at different temperatures and RH levels (note that the maximal tolerance accuracy values can still be ±3% RH). Sensirion6 explicitly states that the long-time exposure to conditions >80% may offset the RH signal, causing the sensor to recalibrate itself. Given the long duration of the experiments at fairly high humidity values, it is possible that this happened during the oversaturation periods, which offset the sensor. Given the errors present in the air temperature readings (section 3.1.3), the smartphone RH readings will have an additional level of uncertainty caused by the smartphone temperature sensor.
The light sensor in the smartphone is designed to measure light intensity (lux), rather than radiation. Nevertheless, obtained lux values correlate well with the pyranometer recording global radiation at the weather field (Pearson correlation values above 0.9 for all the field experiments).
The time response analysis gave a near-instant response to the change in light level: as fast or faster than the measurement frequency (10 ms). This fast response can be useful in certain weather conditions, e.g. rapid change in cloud cover. This might occur in the reported observations (Figure 9) just after 900 s, though cloud-cover observations are not available at the weather station. In addition, the fast response is also useful for traverse observations in streets in order to accurately trace sunlit shaded locations in street canyons.
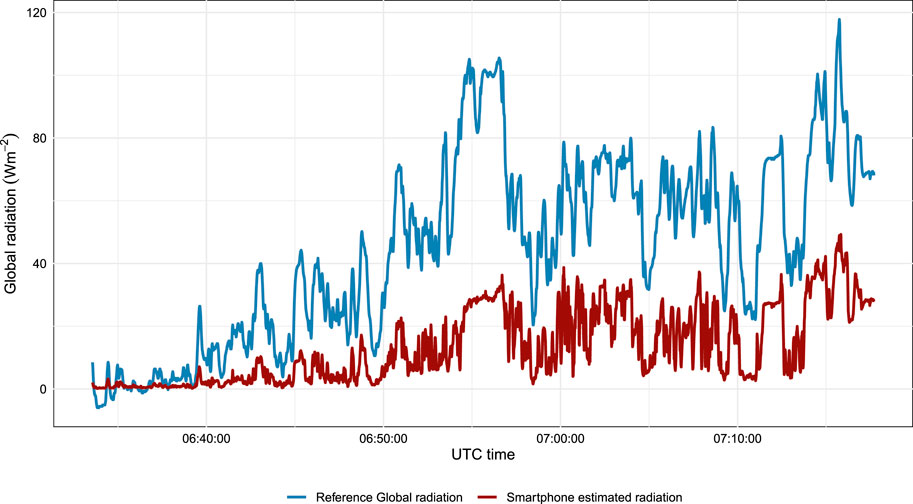
FIGURE 9. Observed light sensor signal from Samsung S4 (red line) and observed global radiation at the surface at the Veenkampen reference station (blue line) for a period of nearly three quarters of an hour. Measurements taken on October 19th 2017.
Figure 10 shows the sensor cosine response to the incident light from angles −90° to 90°. The experiment to calculate the cosine response of the light sensor was replicated more than 10 times, with similar results. For comparison, a second class pyranometer (like the Hukseflux LP02 installed on the tricycle) has a mean ± 2% deviation from the optimal cosine response for all zenith angles from −90 to 90°, while the smartphone light sensor mean deviation is −33.87%. Only between −45 and 45° the smartphone light sensor performs within the accepted range of ±5% deviation of the ideal cosine response of standard pyranometers. This has consequences for use of actual smartphone data, since those will likely not be angled towards the Sun, which will reduce their accuracy at estimating direct incoming radiation.
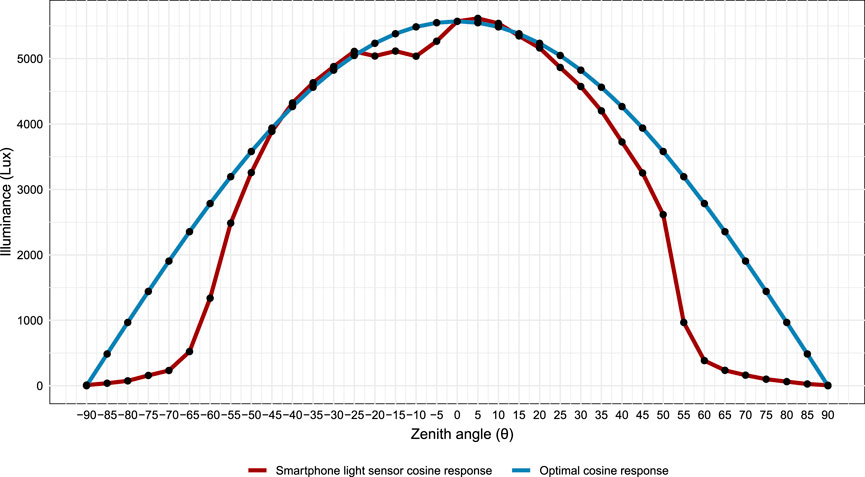
FIGURE 10. Observed cosine response of the light sensor in the smartphone Samsung S4 as function of zenith angle (red line) and ideal cosine response (blue line).
In this section air temperature from the smartphone is compared against the instrumentation on the tricycle. One-hour data of temperature, relative humidity, wind speed and global radiation retrieved by instrumentation installed on the tricycle was compared against the one retrieved by Veenkampen meteorological station at the same day as the transect measurements from Figures 11,12 (calibration results not shown). The comparison was made to double-check the data quality retrieved by the bicycle instrumentation and thus, being able to further use it for assessment and comparison against the smartphone data. Data from the tricycle shows a mean temperature bias of 0.02°C with respect to the Veenkampen weather station. However, for cases when global radiation is greater than 300 Wm−2, temperature shows a stronger positive bias of 0.43°C. All measurements were recorded with 1.4 ms−1 average wind speed at 2 m height. For relative humidity, the results (not shown) display a mean error of −3.4 %RH. For wind speed, no fully direct comparison is possible since the wind at the Veenkampen weather station and on the tricycle are measured at different heights, 1.5 and 2 m respectively. Nonetheless, the observations are between the expected values for a 0.5 m height difference between them, with the sonic anemometer averaging a mean error of −0.3 ms−1. Finally, when comparing global radiation, the pyranometer on the tricycle showed a mean error of −3.8 Wm−2, which meets the manufacturer specifications. This confirms that the tricycle instrumentation serves as a proper reference to compare the smartphone data against over a transect.
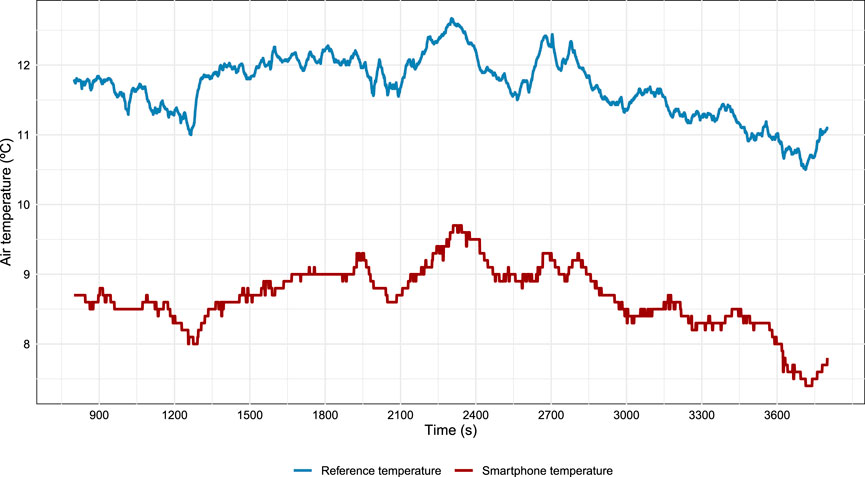
FIGURE 11. Smartphone measurements uncorrected for temperature bias and reference tricycle measurements. Measurements took place across a predefined path on October 17th 2017, in the evening, to ensure low radiation bias. The time axis represents the start since the experiment: the cut-off part was setting up the measurement devices.
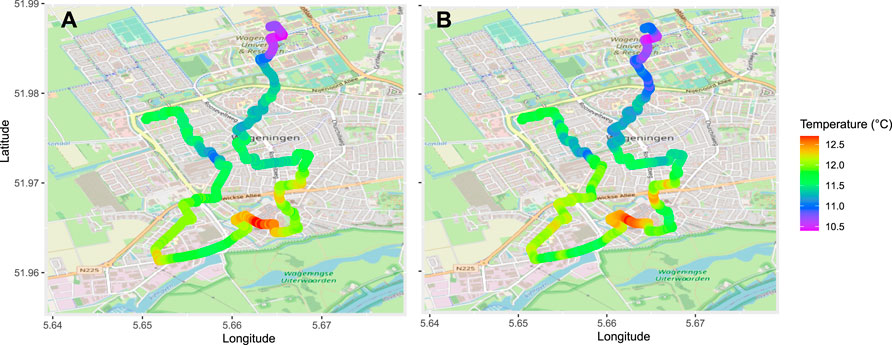
FIGURE 12. Bias corrected transect measurements of air temperature, measured from smartphone observations (A) and the measurement tricycle (B). Data was measured on the same instance as Figure 11, and has been bias corrected before plotting.
For transect measurements made during the day (results not shown), the downwelling solar radiation impacts the device directly, causing large occasional errors when the phone is exposed to the Sun. Spikes in Ts are preceded by higher levels of downwelling radiation, resulting in an overall correlation coefficient of 0.69. On the other hand, when the experiment is executed during the evening (Figure 11, the air temperature readings from smartphone and the ones from the tricycle instrumentation correlate better with one another, with a total correlation coefficient of 0.86, though the absolute difference is substantial still (3 K).
In scenarios with low levels of solar radiation, the bias correction to the smartphone temperature readings is a straightforward process, using linear regression analysis. However, the preconditions are the following:
1. Smartphone is not close to an external heat source.
2. The phone is not being charged.
3. The phone is not under heavy CPU/GPU workload (app usage).
The time series in Figure 11 has also been detrended, assuming an overall linear change in temperature between start and finish, to identify solely spatial differences in air temperature. When this data is plotted across the map (Figure 12), it is possible to see similar temperature patterns with both instruments (smartphone and calibrated thermometer on tricycle). This shows that the smartphone, even with its delayed reaction time, is capable of making meteorological measurements that vary on the urban scale. The various open and sunlit areas around the center of Wageningen that receive more solar radiation are well-represented by the smartphone data, as are some of the more shaded cooler locations. While a detrending and correction procedure are necessary, this does show that smartphone temperature data has the potential to represent even small-scale variability in time and space, even though the fairly large τ values for Ts would have initially suggested otherwise (section 3.1.1).
This section addresses the significance of this research within the context of urban meteorology, and approaches the opportunities crowdsourcing from smartphones may offer for urban meteorology.
The results of this exploratory research topic show the capabilities of a smartphone (illustrated by use of a Samsung S4) as a meteorological data acquisition device, although smartphones have not been designed nor manufactured to be accurate at measuring meteorological variables. Nonetheless, many smartphone types able to sense air temperature, light intensity and some devices even measure ambient humidity. Even though a single smartphone cannot record accurate measurements under all environmental conditions, the true potential is the large amount of data already available, together with the wide spatial and temporal distribution of the measurements. The two keys to fully take advantage of the amount of data already available is: firstly, to understand under which scenarios/circumstances the measurements are useful, and secondly, to identify, develop and test procedures to improve the data quality as in Meier et al. (2017), and Droste et al. (2020).
We find the outdoor smartphone temperature and relative humidity readings relate very well during periods of relatively small levels of downwelling solar radiation. This might be particularly useful to detect the UHI, which normally peaks several hours after sunset. Still, the device usage has to meet the right conditions to be useful and reliable for meteorological data acquisition. For instance, the device battery should not be charging, the smartphone CPU is not heavily used, and the device should not be influenced by the human body temperature. With information from about the battery status, light and/or proximity sensor, the right conditions can be selected for our analysis. Computing power increases rapidly and it might already be enough to evaluate big datasets and to identify reliable data in them. Since the thermometer and hygrometer sensor are encapsulated inside the smartphone, the response times exceed the WMO recommendations. WMO requires 20 s while our analysis finds a response time of around 120 s (though the RH sensor can oversaturate and take >20 minutes to get to equilibrium). In addition we would like to remark that we tested only the responses of a single smartphone. Of course, repeated experiments with multiple phones of the same brand and type would have resulted in more robust statistics, though the general source of errors and time responses will likely be the same.
Moreover, it is illustrative to compare the estimated time constants for our experiment with the earlier estimates as in Droste et al. (2017). They estimated the cooling rate of a smartphone with power P which is surrounded with clothing of heat conductivity κ and heat capacity mc. In their approach the typical time scale at which the temperature responds to a temperature change is estimated by κ/(mc), and amounts to 0.8 W/m/K/(0.13 kg * 600 J/kg/K) = 98 s. This value is slightly smaller, though still relatively close to our value of 170 s as reported in Supplementary Table 1, despite their estimate is an a priori estimate based on material properties. For comparison we report that Cao et al. (2020) found a time constant of 9.7 s for a basic temperature sensor built on IoT technology. Their study calculated this time constant during their transect measurements: we see in our Figures 11,12 that the time constant over the urban transect appears lower than in the lab, and more similar to Cao et al. (2020)’s findings.
Considering that our research found a typical temperature bias of about 2 K, Niforatos et al. (2017) studied the potential of participatory sensing for weather estimation, by developing the crowdsourcing weather app Atmos that periodically samples smartphones’ weather-related sensors. Their approach also allows users to enter their own estimates of both current weather conditions. Using 32 months of observations they found a temperature bias of 2.7°C based on the pure sensor data, which is close to our findings. Their bias dropped to 1.9°C when manual user input was allowed as well. Trivedi et al. (2021) show that this bias could be reduced by using machine learning and multiple phone records (they report 0.5°F).
Also, it is interesting to address the temperature differences in smartphones in case different sensors are employed. Gavin and Sidhu (2015) report on a lab study that compares two temperature sensor types to measure ambient temperatures with a smartphone. Both sensors were placed in a sheltered location and were left to take a series of readings at regular intervals. No significant difference between the readings taken from a smartphone temperature sensor and a established sensor. Their histogram shows that differences between the two sensors do not exceed 0.04 K, which is accurate for our application.
We have been positively surprised about the performance of the light sensor, which illustrates its enormous potential for smartphones to be used as “economic pyranometers”. Initially, more work is needed to be able to distinguish the light source detected by the light sensor (detect if solar light or artificial light). However, for specific, well defined experiments (during fast changes in cloud cover, or for fog observation/detection) the light sensor from smartphones is a good choice for research.
However, despite all the experiments performed and the data analyzed, the results represent the behavior of a single smartphone model. The duplicate measurement confirmed that other devices of the same brand and model behave in similar manner, but the use of other smartphones is recommended to check and increase the confidence of the findings presented in this research. The Samsung Galaxy S4 is used in this research, since there are already available datasets containing data from this smartphone, however it may be necessary to also work on more updated models. An earlier study by Breda et al. (2019) estimates indoor air temperatures by smartphones and found an error of 1.4%. They also estimate the time responses for the smartphone in modes of screen, CPU, network and charging activities. Most interesting for our application is their observed response time of about 1,000 s in a phase when the smartphone is cooling. Although this is slightly higher than in our case, and this may depend on the particular phone type (Google Pixel phone in their case), the order of magnitude is rather similar.
It is important to mention that despite this study provides a verification of the accuracy of smartphone records for UHI studies with respect to a professional weather station, in many of our applications in urban meteorological research, the human behavior remains a substantial player in the records that are obtained. Droste et al. (2017) and Overeem et al. (2013) utilize massive amounts of smartphone records, filter a substantial amount based on the proximity sensor and the charging status of the battery, though full control of the smartphone environment (in a hand, in a pocket, in a hand bag) remains unknown.
A particular problem with the use of smartphones is the gradual reduction of sensors in popular smartphones. In order to e.g., the recently released Samsung A50 does not have a temperature, humidity, or pressure sensor. On the other hand, the Covid-19 pandemic initiated the introduction of a temperature sensor again in the Honor Play4. Additionally, smartphones will maintain to be employed by battery temperature sensors for monitoring the health of the phone. To overcome the limited presence of air temperature sensors, Chau (2019) developed an approach in which air temperature data are estimated based on the recorded smartphone battery sensor, either from in pocket or out pocket readings. However their method was based on lab tests with a limited number of smartphone copies and models, and therefore an experiment to prove the wider and outdoor applicability needs to be developed.
Crowdsourcing, i.e., the harvesting of a large number of sensor data via internet has increased interest as data source for weather and climate studies, in particular in cities where traditional observation techniques are difficult to implement. Earlier studies showed that massive amounts of pressure, temperature, humidity and light observations by smartphones can offer successfully information of local weather conditions, provided a proper data quality assessment and selection is performed. To enhance our understanding of the value of these smartphones records, here we evaluate the quality of weather observations by smartphones (using a Samsung S4 in this case) with respect to automated weather station observations and traverse observation on a cargo bike. Under lab conditions, we find the smartphone observations have a time constant of about 180 s for temperature and between 120 and 650 s for relative humidity (depending on the direction of change and provided no condensation occurs). We show that smartphone temperature observations are subject to a bias that depends on wind speed and solar radiation, but this bias can be corrected for. After applying this bias correction during traverse observations, smartphone temperature observations can successfully replicate temperature observations by a professional weather station. The smartphone light sensor appears to have a cosine response with substantial data loss for angles >45°, though after a scaling correction the light sensor shows high potential for atmospheric research due to its immediate response.
The raw data supporting the conclusion of this article will be made available by the authors, without undue reservation.
AC contributed to the research design, execution, analysis, and manuscript writing. BGH contributed with research design and execution. AD, G-JS, and BGH supervised the research, and contributed to manuscript writing, and editing.
G-JS and AD acknowledge funding from NWO VIDI project 864.14.007.
The authors declare that the research was conducted in the absence of any commercial or financial relationships that could be construed as a potential conflict of interest.
All claims expressed in this article are solely those of the authors and do not necessarily represent those of their affiliated organizations, or those of the publisher, the editors and the reviewers. Any product that may be evaluated in this article, or claim that may be made by its manufacturer, is not guaranteed or endorsed by the publisher.
We thank our colleagues Aristofanis Tsiringakis, Bert Holtslag, Iris Manola, Sytse Koopmans, and former MSc student Fitria Sari for feedback on our results.
The Supplementary Material for this article can be found online at: https://www.frontiersin.org/articles/10.3389/fenvs.2021.673937/full#supplementary-material
1https://wikidevi.wi-cat.ru/Samsung_Galaxy_S4_(SHV-E300S)
2https://ruisdael-observatory.nl/veenkampen/
3https://www.mouser.com/datasheet/2/682/Sensirion_Humidity_Sensors_SHTC1_Datasheet-1511754.pdf
4https://www.sensirion.com/en/markets/sensor-solutions-for-smart-home-applications/
5https://www.mouser.com/datasheet/2/682/Sensirion_Humidity_Sensors_SHTC1_Datasheet-1511754.pdf
6https://www.mouser.com/datasheet/2/682/Sensirion_Humidity_Sensors_SHTC1_Datasheet-1511754.pdf
Abdelhamid, S., Hassanein, H. S., and Takahara, G. (2014). “Vehicle as a mobile Sensor,” in The 9th International Conference on Future Networks and Communications (FNC’14)/The 11th International Conference on Mobile Systems and Pervasive Computing (MobiSPC’14)/Affiliated Workshops, Niagara Falls, ON, August 17–20, 2014, 286–295. doi:10.1016/j.procs.2014.07.025
Allegrini, J., Dorer, V., and Carmeliet, J. (2012). Influence of the Urban Microclimate in Street Canyons on the Energy Demand for Space Cooling and Heating of Buildings. Energy Build. 55, 823–832. doi:10.1016/j.enbuild.2012.10.013
Arnfield, A. J. (2003). Two Decades of Urban Climate Research: a Review of Turbulence, Exchanges of Energy and Water, and the Urban Heat Island. Int. J. Climatol. 23, 1–26. doi:10.1002/joc.859
Bárdossy, A., Seidel, J., and El Hachem, A. (2020). The Use of Personal Weather Station Observation for Improving Precipitation Estimation and Interpolation. Hydrol. Earth Syst. Sci. Discuss. 2020, 1–23. doi:10.5194/hess-2020-42
Baccini, M., Biggeri, A., Accetta, G., Kosatsky, T., Katsouyanni, K., Analitis, A., et al. (2008). Heat Effects on Mortality in 15 European Cities. Int. J. Biometeorol. 19, 711–719. doi:10.1097/EDE.0b013e318176bfcd
Breda, J., Trivedi, A., Chulabhaya Wijesundara, P. B., Irwin, D., Shenoy, P., and Taneja, J. (2019). “Hot or Not: Leveraging mobile Devices for Ubiquitous Temperature Sensing,” in Proceedings of the 6th ACM International Conference on Systems for Energy-Efficient Buildings, Cities, and Transportation (BuildSys 2019), New York, November 13–14, 2019 (New York, NY: Association for Computing Machinery), 41–50.
Burt, S., and Podesta, M. (2020). Response Times of Meteorological Air Temperature Sensors. Q. J. R. Meteorol. Soc. 146, 2789–2800. doi:10.1002/qj.3817
Cao, C., Yang, Y., Lu, Y., Schultze, N., Gu, P., Zhou, Q., et al. (2020). Performance Evaluation of a Smart Mobile Air Temperature and Humidity Sensor for Characterizing Intracity Thermal Environment. J. Atmos. Oceanic Technol. 37, 1891–1905. doi:10.1175/jtech-d-20-0012.1
Chapman, L., Bell, C., and Bell, S. (2017). Can the Crowdsourcing Data Paradigm Take Atmospheric Science to a New Level? a Case Study of the Urban Heat Island of London Quantified Using Netatmo Weather Stations. Int. J. Climatol. 37, 3597–3605. doi:10.1002/joc.4940
Chau, N. H. (2019). Estimation of Air Temperature Using Smartphones in Different Contexts. J. Inf. Telecommun. 3, 494–507. doi:10.1080/24751839.2019.1634869
Cheval, S., Micu, D., Dumitrescu, A., Irimescu, A., Frighenciu, M., Iojă, C., et al. (2020). Meteorological and Ancillary Data Resources for Climate Research in Urban Areas. Climate 8, 37. doi:10.3390/cli8030037
Vos, L. W., Leijnse, H., Overeem, A., and Uijlenhoet, R. (2019). Quality Control for Crowdsourced Personal Weather Stations to Enable Operational Rainfall Monitoring. Geophys. Res. Lett. 46, 8820–8829. doi:10.1029/2019GL083731
de Vos, L. W., Droste, A. M., Zander, M. J., Overeem, A., Leijnse, H., Heusinkveld, B. G., et al. (2020). Hydrometeorological Monitoring Using Opportunistic Sensing Networks in the Amsterdam Metropolitan Area. Bull. Am. Meteorol. Soc. 101, E167–E185. doi:10.1175/BAMS-D-19-0091.1
Di Napoli, C., Barnard, C., Prudhomme, C., Cloke, H. L., and Pappenberger, F. (2020). ERA5‐HEAT: A Global Gridded Historical Dataset of Human thermal comfort Indices from Climate Reanalysis. Geosci. Data J. 8, 2–10. doi:10.1002/gdj3.102
Droste, A. M., Pape, J. J., Overeem, A., Leijnse, H., Steeneveld, G. J., Van Delden, A. J., et al. (2017). Crowdsourcing Urban Air Temperatures through Smartphone Battery Temperatures in São Paulo, Brazil. J. Atmos. Oceanic Technol. 34, 1853–1866. doi:10.1175/JTECH-D-16-0150.1
Droste, A. M., Heusinkveld, B. G., Fenner, D., and Steeneveld, G. J. (2020). Assessing the Potential and Application of Crowdsourced Urban Wind Data. Q. J. R. Meteorol. Soc. 146, 2671–2688. doi:10.1002/qj.381110.1002/qj.3811
Fazeli, R., Ruth, M., and Davidsdottir, B. (2016). Temperature Response Functions for Residential Energy Demand - A Review of Models. Urban Clim. 15, 45–59. doi:10.1016/j.uclim.2016.01.001
Gasparrini, A., Guo, Y., Hashizume, M., Lavigne, E., Zanobetti, A., Schwartz, J., et al. (2015). Mortality Risk Attributable to High and Low Ambient Temperature: a Multicountry Observational Study. Lancet 386, 369–375. doi:10.1016/s0140-6736(14)62114-0
Gavin, S., and Sidhu, B. (2015). The Effectiveness of Smartphone Temperature Sensors for Ambient Temperature Monitoring. BCIT Environ. Publ. Health J. doi:10.47339/ephj.2015.121
Hage, K. D. (1975). Urban-Rural Humidity Differences. J. Appl. Meteorol. 14, 1277–1283. doi:10.1175/1520-0450(1975)014<1277:urhd>2.0.co;2
Hamdi, R., Kusaka, H., Doan, Q.-V., Cai, P., He, H., Luo, G., et al. (2020). The State-Of-The-Art of Urban Climate Change Modeling and Observations. Earth Syst. Environ. 4, 631–646. doi:10.1007/s41748-020-00193-3
He, L., Lee, Y., and Shin, K. G. (2020). Mobile Device Batteries as Thermometers. Proc. ACM Interact. Mob. Wearable Ubiquitous Technol. 4, 1–21. doi:10.1145/3381015
Heusinkveld, B., van Hove, L., Jacobs, C., Steeneveld, G., Elbers, J., Moors, E., et al. (2010). “Use of a mobile Platform for Assessing Urban Heat Stress in Rotterdam,” in Proceedings of the 7th Conference on Biometeorology, Berichte des Meteorologischen Instituts der Albert-Ludwigs-Universität Freiburg, Freiburg, April 12–14, 2010 Freiburg: Albert-Ludwigs-Universität Freiburg, 433–438.
Heusinkveld, B. G., Steeneveld, G. J., van Hove, L. W. A., Jacobs, C. M. J., and Holtslag, A. A. M. (2014). Spatial Variability of the Rotterdam Urban Heat Island as Influenced by Urban Land Use. J. Geophys. Res. Atmos. 119, 677–692. doi:10.1002/2012JD019399
Höppe, P. (2002). Different Aspects of Assessing Indoor and Outdoor thermal comfort. Energy Build. 34, 661–665. Special Issue on Thermal Comfort Standards. doi:10.1016/s0378-7788(02)00017-8
IPCC (2014). Impacts, Adaptation, and Vulnerability. Summaries, Frequently Asked Questions, and Cross-Chapter Boxes (NA: IPCC).
Keirstead, J., and Sivakumar, A. (2012). Using Activity-Based Modeling to Simulate Urban Resource Demands at High Spatial and Temporal Resolutions. J. Ind. Ecol. 16, 889–900. doi:10.1111/j.1530-9290.2012.00486.x
Klemm, W., Lenzholzer, S., and van den Brink, A. (2017). Developing green Infrastructure Design Guidelines for Urban Climate Adaptation. J. Landscape Architect. 12, 60–71. doi:10.1080/18626033.2017.1425320
Koopmans, S., Heusinkveld, B. G., and Steeneveld, G. J. (2020). A Standardized Physical Equivalent Temperature Urban Heat Map at 1-m Spatial Resolution to Facilitate Climate Stress Tests in the Netherlands. Build. Environ. 181, 106984. doi:10.1016/j.buildenv.2020.106984
Kottek, M., Grieser, J., Beck, C., Rudolf, B., and Rubel, F. (2006). World Map of the Köppen-Geiger Climate Classification Updated. Meteorol. Z. 15, 259–263. doi:10.1127/0941-2948/2006/0130
Kovats, S., and Bickler, G. (2012). Health protection and Heatwaves: The Need for Systematic Reviews. Cochrane Database Syst. Rev. 11, ED000044. doi:10.1002/14651858.ED000044
Krennert, T., Pistotnik, G., Kaltenberger, R., and Csekits, C. (2018). Crowdsourcing of Weather Observations at National Meteorological and Hydrological Services in Europe. Adv. Sci. Res. 15, 71–76. doi:10.5194/asr-15-71-2018
Laaidi, M., Laaidi, K., and Besancenot, J.-P. (2006). Temperature-related Mortality in France, a Comparison between Regions with Different Climates from the Perspective of Global Warming. Int. J. Biometeorol. 51, 145–153. doi:10.1007/s00484-006-0045-8
Li, Y., Schubert, S., Kropp, J. P., and Rybski, D. (2020). On the Influence of Density and Morphology on the Urban Heat Island Intensity. Nat. Commun. 11, 2647. doi:10.1038/s41467-020-16461-9
Li, R., Zhang, Q., Sun, J., Chen, Y., Ding, L., and Wang, T. (2021). Smartphone Pressure Data: Quality Control and Impact on Atmospheric Analysis. Atmos. Meas. Tech. 14, 785–801. doi:10.5194/amt-14-785-2021
MacLeod, D. A., Cloke, H. L., Pappenberger, F., and Weisheimer, A. (2016). Improved Seasonal Prediction of the Hot Summer of 2003 over Europe through Better Representation of Uncertainty in the Land Surface. Q.J.R. Meteorol. Soc. 142, 79–90. doi:10.1002/qj.2631
Madaus, L. E., and Mass, C. F. (2017). Evaluating Smartphone Pressure Observations for Mesoscale Analyses and Forecasts. Weather Forecast. 32, 511–531. doi:10.1175/WAF-D-16-0135.1
Mahoney, W. P., and O'Sullivan, J. M. (2013). Realizing the Potential of Vehicle-Based Observations. Bull. Am. Meteorol. Soc. 94, 1007–1018. doi:10.1175/BAMS-D-12-00044.1
Mandement, M., and Caumont, O. (2020). Contribution of Personal Weather Stations to the Observation of Deep-Convection Features Near the Ground. Nat. Hazards Earth Syst. Sci. 20, 299–322. doi:10.5194/nhess-20-299-2020
Martínez, M., Andújar, J., and Enrique, J. (2009). A New and Inexpensive Pyranometer for the Visible Spectral Range. Sensors 9, 4615–4634. doi:10.3390/s90604615
Masson, V., Lemonsu, A., Hidalgo, J., and Voogt, J. (2020). Urban Climates and Climate Change. Annu. Rev. Environ. Resour. 45, 411–444. doi:10.1146/annurev-environ-012320-083623
Meier, F., Fenner, D., Grassmann, T., Otto, M., and Scherer, D. (2017). Crowdsourcing Air Temperature from Citizen Weather Stations for Urban Climate Research. Urban Clim. 19, 170–191. doi:10.1016/j.uclim.2017.01.006
Muller, C. L., Chapman, L., Johnston, S., Kidd, C., Illingworth, S., Foody, G., et al. (2015). Crowdsourcing for Climate and Atmospheric Sciences: Current Status and Future Potential. Int. J. Climatol. 35, 3185–3203. doi:10.1002/joc.4210
Napoly, A., Grassmann, T., Meier, F., and Fenner, D. (2018). Development and Application of a Statistically-Based Quality Control for Crowdsourced Air Temperature Data. Front. Earth Sci. 6, 118. doi:10.3389/feart.2018.00118
Nazarian, N., Liu, S., Kohler, M., Lee, J. K. W., Miller, C., and Chow, W. T. L. (2021). Project Coolbit: Can your Watch Predict Heat Stress and Thermal Comfort Sensation? Environ. Res. Lett. 16 (3), 034031. doi:10.1088/1748-9326/abd130
Niforatos, E., Vourvopoulos, A., and Langheinrich, M. (2017). Understanding the Potential of Human-Machine Crowdsourcing for Weather Data. Int. J. Human-Computer Stud. 102, 54–68. Special Issue on Mobile and Situated Crowdsourcing. doi:10.1016/j.ijhcs.2016.10.002
Nipen, T. N., Seierstad, I. A., Lussana, C., Kristiansen, J., and Hov, Ø. (2020). Adopting Citizen Observations in Operational Weather Prediction. Bull. Am. Meteorol. Soc. 101, E43–E57. doi:10.1175/BAMS-D-18-0237.1
Oke, T. R., Mills, G., Christen, A., and Voogt, J. A. (2017). Urban Climates. Cambridge: Cambridge University Press. doi:10.1017/9781139016476
Oke, T. (1982). The Energetic Basic of the Urban Heat Island. Q. J. R. Meteorol. Soc. 108, 1–24. doi:10.1002/qj.4971084550210.1256/smsqj.45501
Overeem, A., Robinson, J. C. R., Leijnse, G. J., Steeneveld, G. J., Horn, B. K. P., Uijlenhoet, R., et al. (2013). Crowdsourcing Urban Air Temperatures from Smartphone Battery Temperatures. Geophys. Res. Lett. 40, 4081–4085. doi:10.1002/grl.5078610.1002/grl.50786
Pijpers-van Esch, M. (2015). Designing the Urban Microclimate. Delft: Delft University of Technology. doi:10.7480/abe.2015.6
Ronda, R. J., Steeneveld, G. J., Heusinkveld, B. G., Attema, J. J., and Holtslag, A. A. M. (2017). Urban Finescale Forecasting Reveals Weather Conditions with Unprecedented Detail. Bull. Am. Meteorol. Soc. 98, 2675–2688. doi:10.1175/BAMS-D-16-0297.1
Rydin, Y., Bleahu, A., Davies, M., Dávila, J. D., Friel, S., De Grandis, G., et al. (2012). Shaping Cities for Health: Complexity and the Planning of Urban Environments in the 21st century. Lancet 379, 2079–2108. doi:10.1016/s0140-6736(12)60435-8
Sailor, D. J. (2011). A Review of Methods for Estimating Anthropogenic Heat and Moisture Emissions in the Urban Environment. Int. J. Climatol. 31, 189–199. doi:10.1002/joc.2106
Santamouris, M., and Kolokotsa, D. (2016). Urban Climate Mitigation Techniques. 1st Edn. London: Routledge.
Shi, Y., Xiang, Y., and Zhang, Y. (2019). Urban Design Factors Influencing Surface Urban Heat Island in the High-Density City of Guangzhou Based on the Local Climate Zone. Sensors 19, 3459. doi:10.3390/s19163459
Siems-Anderson, A., Lee, J. A., Brown, B., Wiener, G., and Linden, S. (2020). Impacts of Assimilating Observations from Connected Vehicles into a Numerical Weather Prediction Model. Transportation Res. Interdiscip. Perspect. 8, 100253. doi:10.1016/j.trip.2020.100253
Steeneveld, G. J., Koopmans, S., Heusinkveld, B. G., van Hove, L. W. A., and Holtslag, A. A. M. (2011). Quantifying Urban Heat Island Effects and Human comfort for Cities of Variable Size and Urban Morphology in the Netherlands. J. Geophys. Res. 116, D20129. doi:10.1029/2011JD015988
Svensson, M. K., and Eliasson, I. (2002). Diurnal Air Temperatures in Built-Up Areas in Relation to Urban Planning. Landscape Urban Plann. 61, 37–54. doi:10.1016/S0169-2046(02)00076-2
Le Tertre, A., Lefranc, A. s., Eilstein, D., Declercq, C., Medina, S., Blanchard, M., et al. (2006). Impact of the 2003 Heatwave on All-Cause Mortality in 9 French Cities. Epidemiology 17, 75–79. doi:10.1097/01.ede.0000187650.36636.1f
Trivedi, A., Bovornkeeratiroj, P., Breda, J., Shenoy, P., Taneja, J., and Irwin, D. (2021). Phone-based Ambient Temperature Sensing Using Opportunistic Crowdsensing and Machine Learning. Sustainable Comput. Inform. Syst. 29, 100479. doi:10.1016/j.suscom.2020.100479
Uteuov, A., Kalyuzhnaya, A., and Boukhanovsky, A. (2019). “The Cities Weather Forecasting by Crowdsourced Atmospheric Data,” in 8th International Young Scientists Conference on Computational Science, YSC2019, 24-28 June 2019, Heraklion, Greece, Heraklion, June 24–28, 2019, 347–356. doi:10.1016/j.procs.2019.08.211
WMO (2008). Guide to Instruments and Methods of Observation. Geneva: World Meteorological Organization.
Keywords: smartphone, urban heat island, urban meteorology, crowdsourcing, citizen science, opportunistic sensing, weather station, urban climate
Citation: Cabrera AN, Droste A, Heusinkveld BG and Steeneveld G-J (2021) The Potential of a Smartphone as an Urban Weather Station—An Exploratory Analysis. Front. Environ. Sci. 9:673937. doi: 10.3389/fenvs.2021.673937
Received: 28 February 2021; Accepted: 03 August 2021;
Published: 20 August 2021.
Edited by:
Benjamin Bechtel, Ruhr University Bochum, GermanyReviewed by:
Shuisen Chen, Guangzhou Institute of Geography, ChinaCopyright © 2021 Cabrera, Droste, Heusinkveld and Steeneveld. This is an open-access article distributed under the terms of the Creative Commons Attribution License (CC BY). The use, distribution or reproduction in other forums is permitted, provided the original author(s) and the copyright owner(s) are credited and that the original publication in this journal is cited, in accordance with accepted academic practice. No use, distribution or reproduction is permitted which does not comply with these terms.
*Correspondence: Arjan Droste, YXJqYW4uZHJvc3RlQHd1ci5ubA==
Disclaimer: All claims expressed in this article are solely those of the authors and do not necessarily represent those of their affiliated organizations, or those of the publisher, the editors and the reviewers. Any product that may be evaluated in this article or claim that may be made by its manufacturer is not guaranteed or endorsed by the publisher.
Research integrity at Frontiers
Learn more about the work of our research integrity team to safeguard the quality of each article we publish.