 Jahan Zeb Khan
 Long Sun1*
 Yinchang Feng
95% of researchers rate our articles as excellent or good
Learn more about the work of our research integrity team to safeguard the quality of each article we publish.
Find out more
ORIGINAL RESEARCH article
Front. Environ. Sci. , 29 April 2021
Sec. Toxicology, Pollution and the Environment
Volume 9 - 2021 | https://doi.org/10.3389/fenvs.2021.659329
This article is part of the Research Topic Physicochemical Characterization of Aerosols in Diverse Environments and Climatic Conditions View all 5 articles
The ambient particulate matter (PM) pollution adversely influences the human health and natural environment. The size distribution of ambient PM determines the physiochemical and optical properties of ambient aerosol, whereas it reflects the variability in local and regional PM emission sources and formation mechanisms. In the present work, the size distribution and characteristics of the carbonaceous, ionic, elemental, and saccharide species were categorically investigated for the fraction-wise PM in Tianjin during 2018 early summer. The average concentrations were 32.4, 20.9, and 49.3 μg/m3 for the PM1, PM1–2.5, and PM2.5–10, respectively. The coarse PM2.5–10 accounted for most of the PM10 mass (47%), followed by the fine PM1 (33%) and intermodal PM1–2.5 (20%). The carbonaceous and ionic species exhibited bimodal distribution and were distributed mostly to the fine size fraction and then to the coarse size fraction. The elemental species exhibited unimodal distribution and were distributed mostly to the coarse size fraction. The specific saccharide species indicated the significant contribution of biomass burning and primary biogenic emissions. The bimodal mass size distribution of levoglucosan indicated the significant biomass burning contributions to the fine and coarse size fractions. The unimodal glucose, fructose, and arabitol distribution and the bimodal mannitol distribution indicated the dominant primary biogenic contributions to the coarse size fraction. The PM1/PM10, PM1–2.5/PM10, PM2.5–10/PM10, OC/EC, SOC/OC, AE/CE, NO3–/SO42–, K+/EC, and levoglucosan/K+ ratios were used to investigate the characteristics of the ambient size-fractionated PM. The anthropogenic sources (combustion processes, traffic emissions, and secondary particles, etc.) contributed mostly to the fine PM1 and intermodal PM1–2.5 fractions, whereas the natural sources (primary biogenic, marine salt, and mineral dust, etc.) contributed mostly to the coarse PM2.5–10 fraction. This work is a significant addition to the multi-size ambient PM’s size distribution and characterization studies.
- The size-resolved PM (PM1, PM1–2.5, and PM2.5–10) was investigated in Tianjin, China.
- The carbonaceous, ionic, elemental, and saccharide species were categorically investigated.
- The saccharide species indicated the biomass burning and primary biogenic contributions.
- The anthropogenic sources contributed more to the fine and intermodal fractions.
- The natural sources were more evident in the coarse mass fraction.
The ambient particulate matter (PM) pollution is a serious environmental concern, which adversely impacts the human health and natural environment. The ambient PM pollution leads to air quality degradation, haze formation, reduced visibility, climate change, global warming, ecosystem deterioration, and human health risks (Ari et al., 2020; Cesari et al., 2020; Jain et al., 2020). The ambient PM originates from diverse primary sources (anthropogenic and natural), as well as in the form of secondary particles formed by the photochemical processes involving both the anthropogenic and natural precursors (Dai et al., 2019; Zalakeviciute et al., 2020).
The ambient PM is a complex mixture ranging across various diameter sizes having different source origins, formation processes, physiochemical characteristics, and health effects. The ambient PM is constituted of the fine PM1 fraction, intermodal PM1–2.5 fraction, and coarse PM2.5–10 fraction. The PM10 enters the upper respiratory system, the PM2.5 reaches the lower respiratory system involving the alveolar part, and the PM1 crosses the blood–air barrier of the lungs entering the blood system of humans (Samek et al., 2018). The fine PM1 fraction is generally composed of the particles originating from the combustion processes, traffic emissions, industrial emissions, and secondary particles phenomena. The coarse PM2.5–10 fraction is generally composed of the particles originating from the mineral dust, marine salt, biogenic sources, and mechanical processes. The intermodal PM1–2.5 fraction is composed of the particles having both the finer and coarser source origins. The finer particles have a deeper reach and more toxic constituents, leading to more serious health risks, such as cardiovascular diseases, respiratory problems, and more (Liu et al., 2013; Pateraki et al., 2020; Rivas et al., 2020).
Tianjin is China’s major urban center influenced by the ambient PM pollution. The characteristics and sources of the PM10 and PM2.5 were comprehensively investigated in Tianjin (Kong et al., 2010; Tian et al., 2014, 2018; Liu et al., 2020). The characteristics and sources of the PM1 and PM2.5 were recently investigated in China (Zhang et al., 2018; Liang et al., 2019; Khan et al., 2021). The fine PM2.5 and coarse PM2.5–10 fractions were investigated in numerous studies worldwide, such as in Hong Kong, Nigeria, and Australia (Cheng et al., 2015; Owoade et al., 2016; Keywood et al., 2020). The characteristics and associations of the intermodal PM1–2.5 fraction were investigated in Czechia (Kozáková et al., 2018). Most research studies are focused on the characteristics and sources of the PM10 and PM2.5 (Tian et al., 2017; Dai et al., 2018; Hopke et al., 2020).
The specific saccharide species are the chemical markers of biomass burning and primary biogenic emissions. The levoglucosan is a typical marker of the biomass burning (agricultural residue burning, wood combustion, and forest fires, etc.), whereas the glucose, fructose, arabitol, and mannitol are the typical markers of the primary biogenic sources (vegetation, bacteria and viruses, and fungal spores, etc.) (Li et al., 2016; Theodosi et al., 2018; Alvi et al., 2020). The contributions of biomass burning (forest fires, agricultural residue burning, and wood combustion, etc.) are more evident during early summer. The elevated biological activity during early summer leads to more evident primary biogenic contributions (Graham et al., 2003; Waked et al., 2014). Therefore, the size distribution of specific saccharide species may provide valuable information regarding the contribution of biomass burning and primary biogenic emissions to the observed levels.
In the present work, the focus is given on the mass size and chemical characterization of ambient PM in Tianjin, China during early summer. The size distribution and characteristics of the carbonaceous, ionic, elemental, and saccharide species were categorically explored for the fraction-wise PM (PM1, PM1–2.5, and PM2.5–10). The important characteristic ratios of the fraction-wise PM were investigated. This work’s novelty and added value is the combined analysis of specific saccharide species together with carbonaceous, ionic, and elemental species. This work is a significant addition to the size distribution and characterization studies of the ambient PM involving the fine PM1, intermodal PM1–2.5, and coarse PM2.5–10 fractions.
Tianjin is China’s major urban center (megacity) having 11,947 km2 area and above 15 million inhabitants. The sampling location (NKU Air Quality Research Supersite; 38.99°N, 117.33°E) is situated in the sub-urban Jinnan District of Tianjin, China (Figure 1). The sampling site’s height is approximately 5 m above ground and situated in the Jinnan New Campus of Nankai University. The diverse sources of various origins influence the ambient PM pollution here due to the sub-urban location. The biomass relevant and biogenic sources are also more evident here due to the vegetative surroundings.
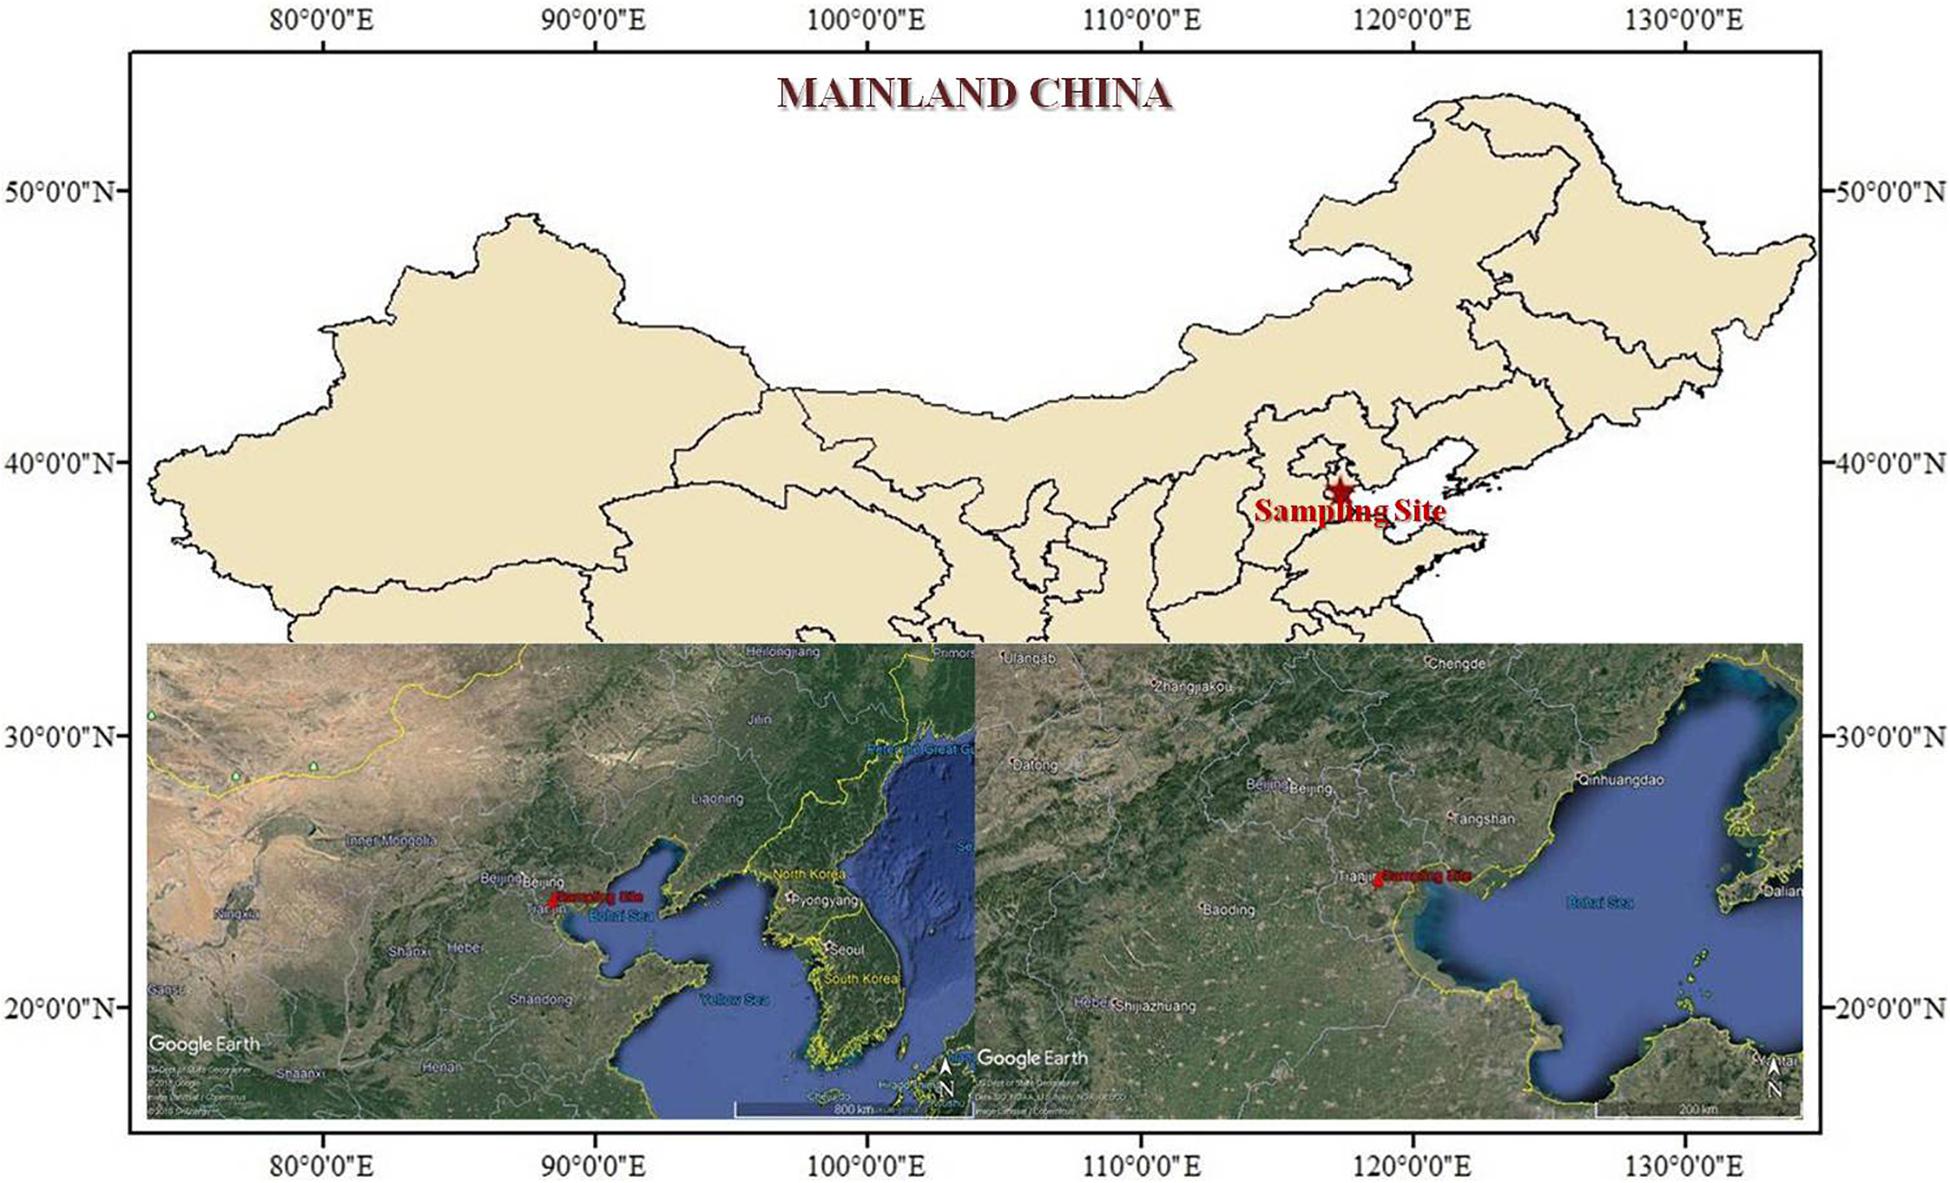
Figure 1. Sampling site location.
At this site during sampling days, the meteorological conditions of the temperature, the wind speed, and the relative humidity were concurrently monitored. The temperature averaged at 25.6 ± 3.9°C ranging from 17.0 to 32.7°C, the wind speed averaged at 3.1 ± 0.8 m/s ranging from 1.4 to 6.0 m/s, and the relative humidity averaged at 55.8% ± 18.2% ranging from 23.4% to 96.3%. These meteorological parameters exhibited lesser fluctuations during the sampling period, and their influence was lesser on the ambient PM concentrations. The temporal trends of the meteorological conditions (temperature, relative humidity, and wind speed) are presented in Supplementary Figure 1.
The 23-h daily sampling (9:40 am till the following day at 8:40 am) was carried out for the PM1, PM2.5, and PM10 from May 6th till July 4th during early summer in 2018. During this season, the biomass burning and primary biogenic contributions become more evident due to more frequent biomass burning events and elevated primary biogenic emissions. The China’s Ministry of Ecology and Environment ‘‘Technical Guidelines for Source Apportionment of Atmospheric Particulate Matter’’ were followed for the ambient PM sampling1.
The PM1, PM2.5, and PM10 sample collection was conducted by a Sunray ZR3930 six-channel ambient air PM sampler (Chongrui, Qingdao, China). The 47-mm polypropylene filters (Beijing Synthetic Fiber Research Institute, China) were fitted at the 1st, 3rd, and 5th channels. The 47-mm quartz filters (Pall Life Sciences, United States) were fitted at the 2nd, 4th, and 6th channels. The PM10 samples were collected using the 1st and 2nd channels, the PM2.5 samples were collected using the 3rd and 4th channels, and the PM1 samples were collected using the 5th and 6th channels. An air flow rate of 16.7 L/min was employed for all the channels. The collected samples (placed in the glass boxes) were kept under dark and cold settings at −20°C in a freezer before subsequent chemical analyses.
The electronic microbalance MX5 (Mettler Toledo, Switzerland) having 1 μg precision was used for the gravimetric analysis of sample filters. Under controlled conditions of 50% ± 5% relative humidity and 20 ± 2°C temperature in the balance room, the filters were equilibrated before weighing for 48 h. The filters’ gravimetric analysis was in accordance with the quality controlled procedures for avoiding the probable contamination.
The chemical analyses were carried out for the carbonaceous, ionic, elemental, and saccharide species. The polypropylene filter samples were used for the chemical analyses of the ionic species (Cl–, NO3–, SO42–, Na+, NH4+, and K+) and the elemental species (Al, Ca, Fe, Mg, Si, As, Cu, Mn, Ni, Pb, Ti, V, and Zn). The quartz filter samples were employed for the chemical analyses of the carbonaceous species [organic carbon (OC) and elemental carbon (EC)] and the saccharide species (levoglucosan, glucose, fructose, arabitol, and mannitol).
The carbonaceous species were detected using the carbon analyzer DRI/OGC (Atmoslytic Inc., Calabasas, CA, United States) with TOR (thermal/optical reflectance) IMPROVE protocol. Daily before and after analysis, the calibration within 2% precision was performed for the carbon analyzer. The ionic species were detected using the DX-120 ion chromatography (DIONEX, United States) having the chromatography columns (anion AS22 and cation CS12A). The lower relative standard deviations were ensured by preparing and analyzing the standard solutions for three times, and also the samples’ adequate extraction into solution was ensured by performing all the extractions for three times. The elemental species were detected using the inductively coupled plasma atomic emission spectroscopy (ICP-AES, IRIS Intrepid II; Thermo Electron, United States). The QA/QC (quality assurance and quality control) was ensured by employing the same procedures for the reference standards keeping precision within 5% of the certified values. Please refer to our previous studies for further details about the QA/QC, pre-treatment, and analysis procedures (Tian et al., 2014, 2017, 2018; Khan et al., 2021).
The saccharide species were detected using the HPAEC-PAD employing the Metrohm 940 ion chromatograph (Metrohm AG, Herisau, Switzerland) equipped with an integrated amperometric detector and a 919 professional sample processor. The RCX-30 250 Hamilton column (Hamilton Bonaduz AG, Switzerland) was used for saccharides’ separation. The USP (Rockville, MD, United States) reference standards were used for the standardization of levoglucosan and mannitol. The Dr. Ehrenstorfer (Augsburg, Germany) reference standards were used for the standardization of glucose, fructose, and arabitol. A half quartz filter was dipped in 0.5 ml ultra-pure water for extraction via 40 min ultrasonic agitation. A syringe filter was used for extract purification before transferring it to the sample injector vial for subsequent chemical analysis. All the quartz filters were extracted through this procedure. The sufficient blank tests were performed using the same procedure for calibration and validation of saccharides data. The QA/QC was confirmed by employing the same procedures for the saccharides’ reference standards, and the recovery was within 10% range of the certified values. Please see the relevant studies for standardization, pre-treatment, instrumental settings, and QA/QC details (Iinuma et al., 2009; Li et al., 2016; Khan et al., 2021).
For all constituent species, the PM1–2.5’s concentration values were determined as PM2.5–PM1 values, and the PM2.5–10’s concentration values were determined as PM10–PM2.5 values (Cheng et al., 2015). The statistical summary and temporal trends of the size-wise PM are presented in Supplementary Table 1 and Supplementary Figure 2.
The present ambient PM’s size distribution and characterization study involved the investigation of the fraction-wise PM (PM1, PM1–2.5, and PM2.5–10). The average PM1 concentration was 32.4 ± 17.4 μg/m3 ranging from 13.7 to 93.9 μg/m3, the average PM1–2.5 concentration was 20.9 ± 14.4 μg/m3 ranging from 1.5 to 84.2 μg/m3, and the average PM2.5–10 concentration was 49.3 ± 29.3 μg/m3 ranging from 9.7 to 151.2 μg/m3. The statistical summary of the fraction-wise PM concentrations and chemical compositions is presented in Table 1. The temporal trends of the fraction-wise PM and the PM ratios (PM1/PM10, PM1–2.5/PM10, and PM2.5–10/PM10) are presented in Figure 2.
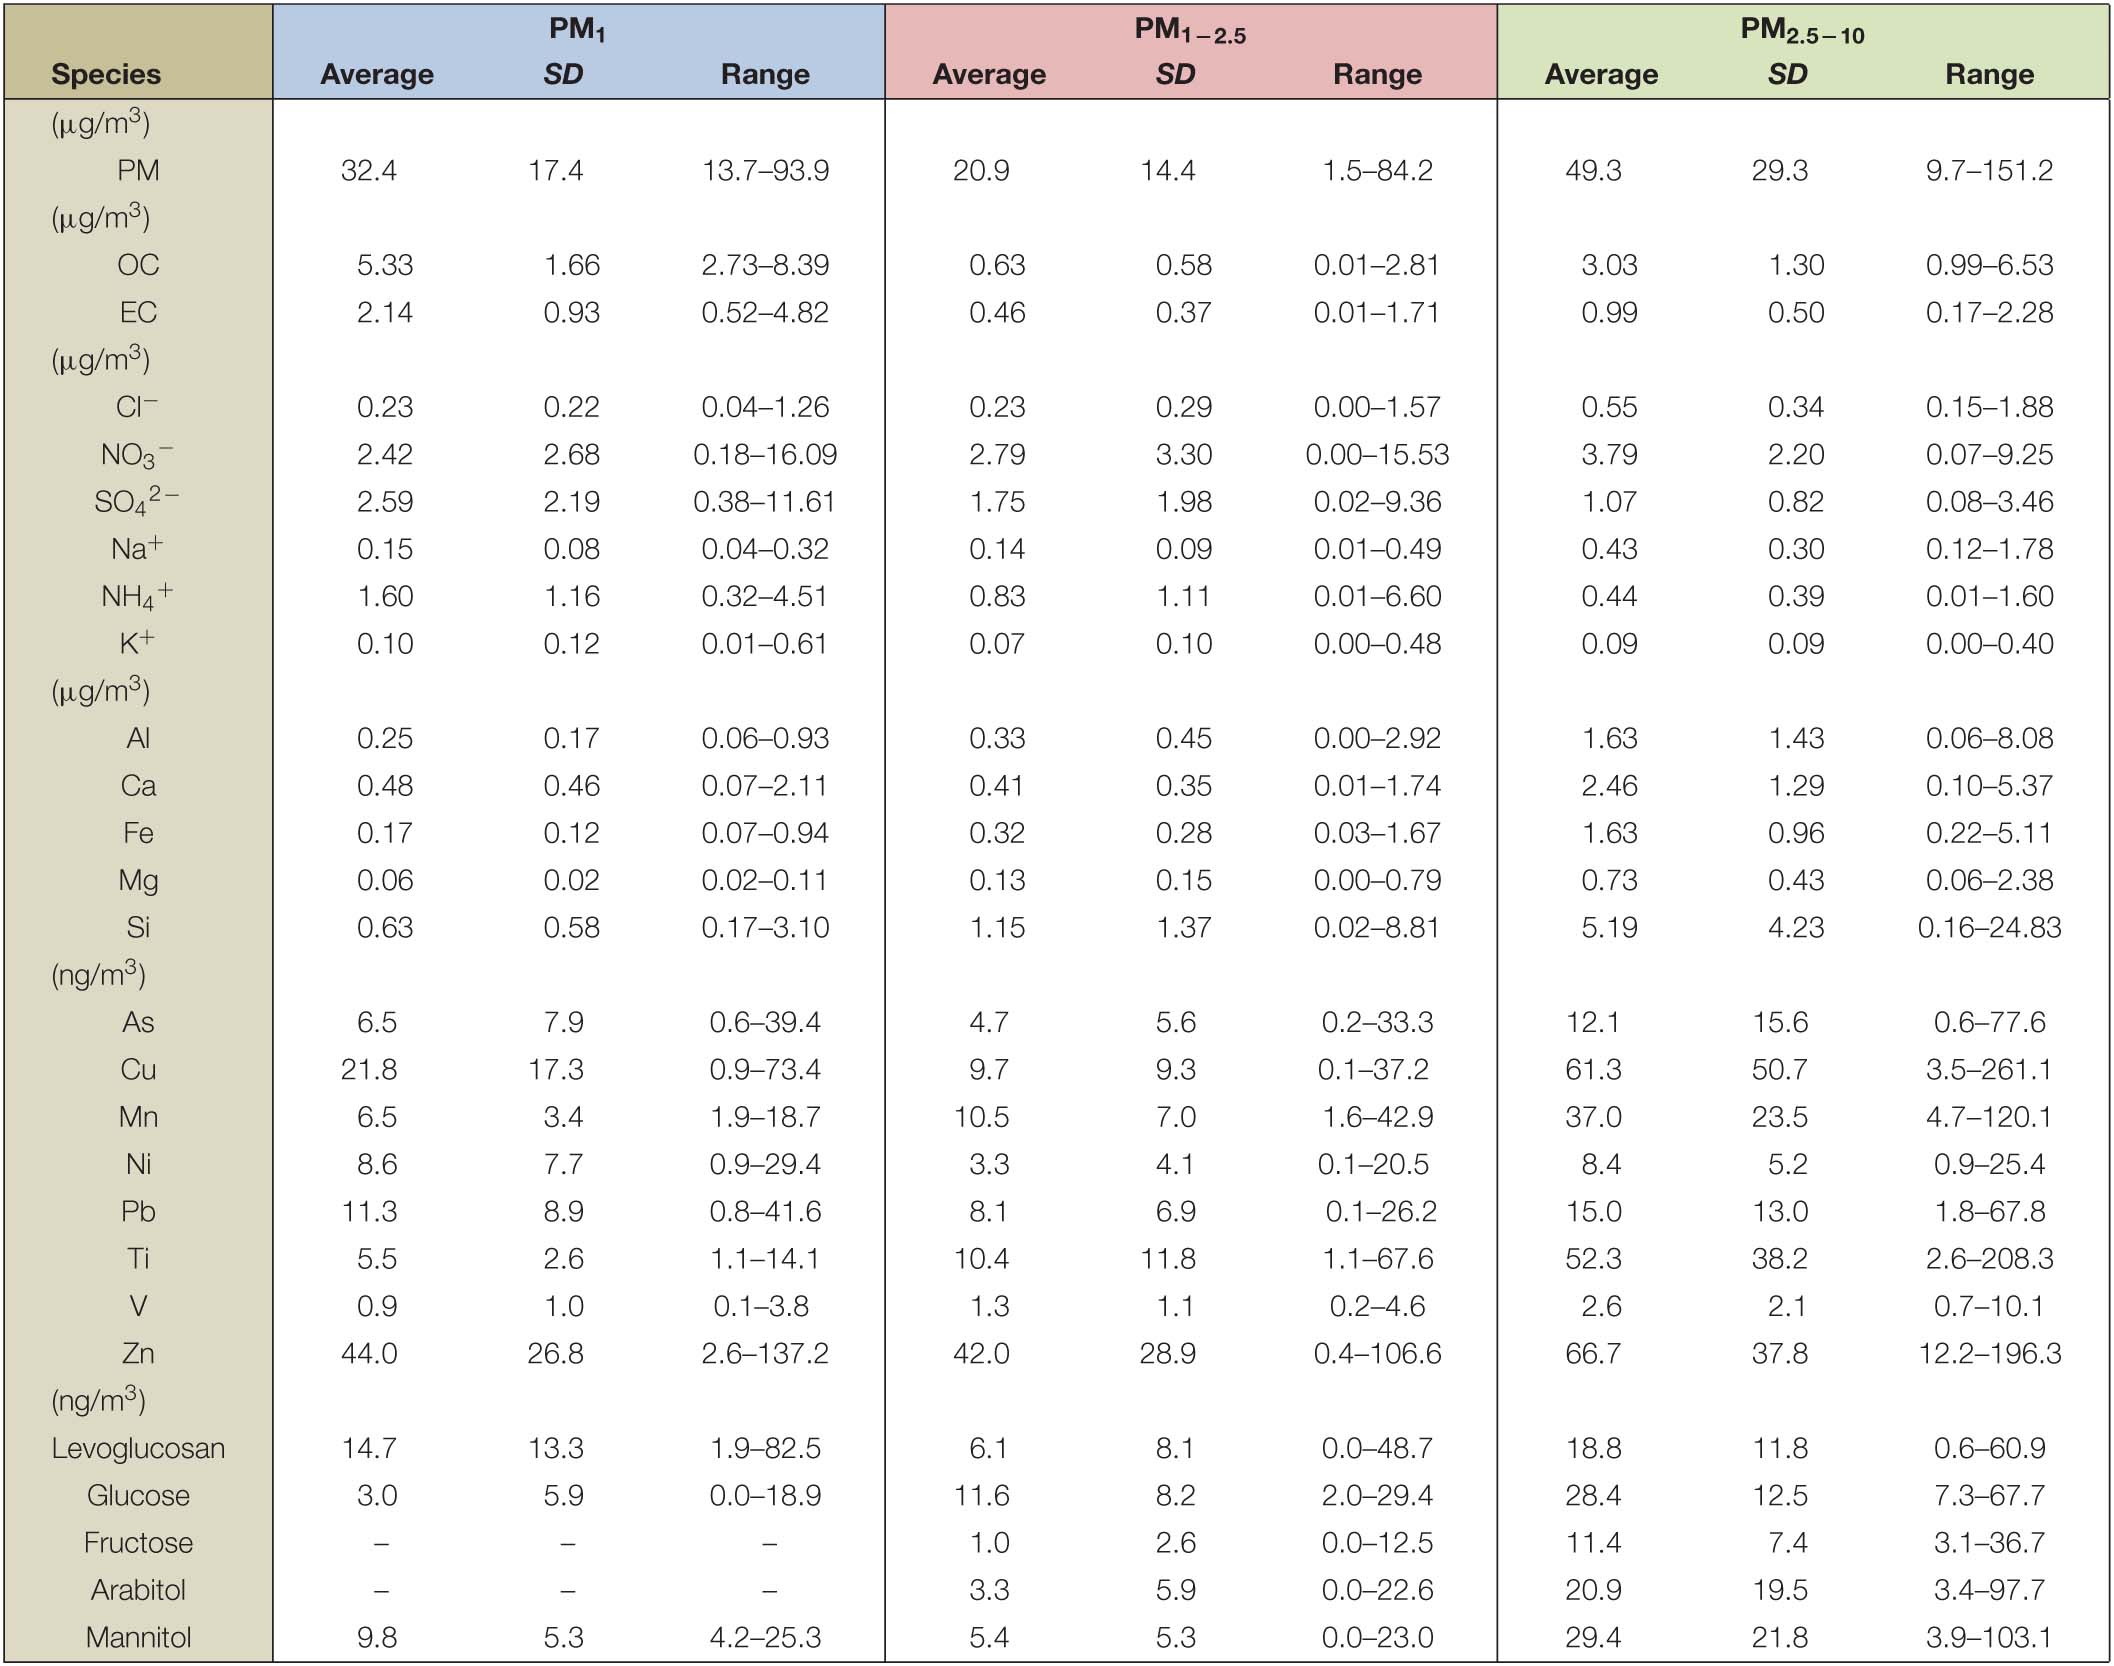
Table 1. Statistical summary of the fraction-wise PM and its chemical compositions.
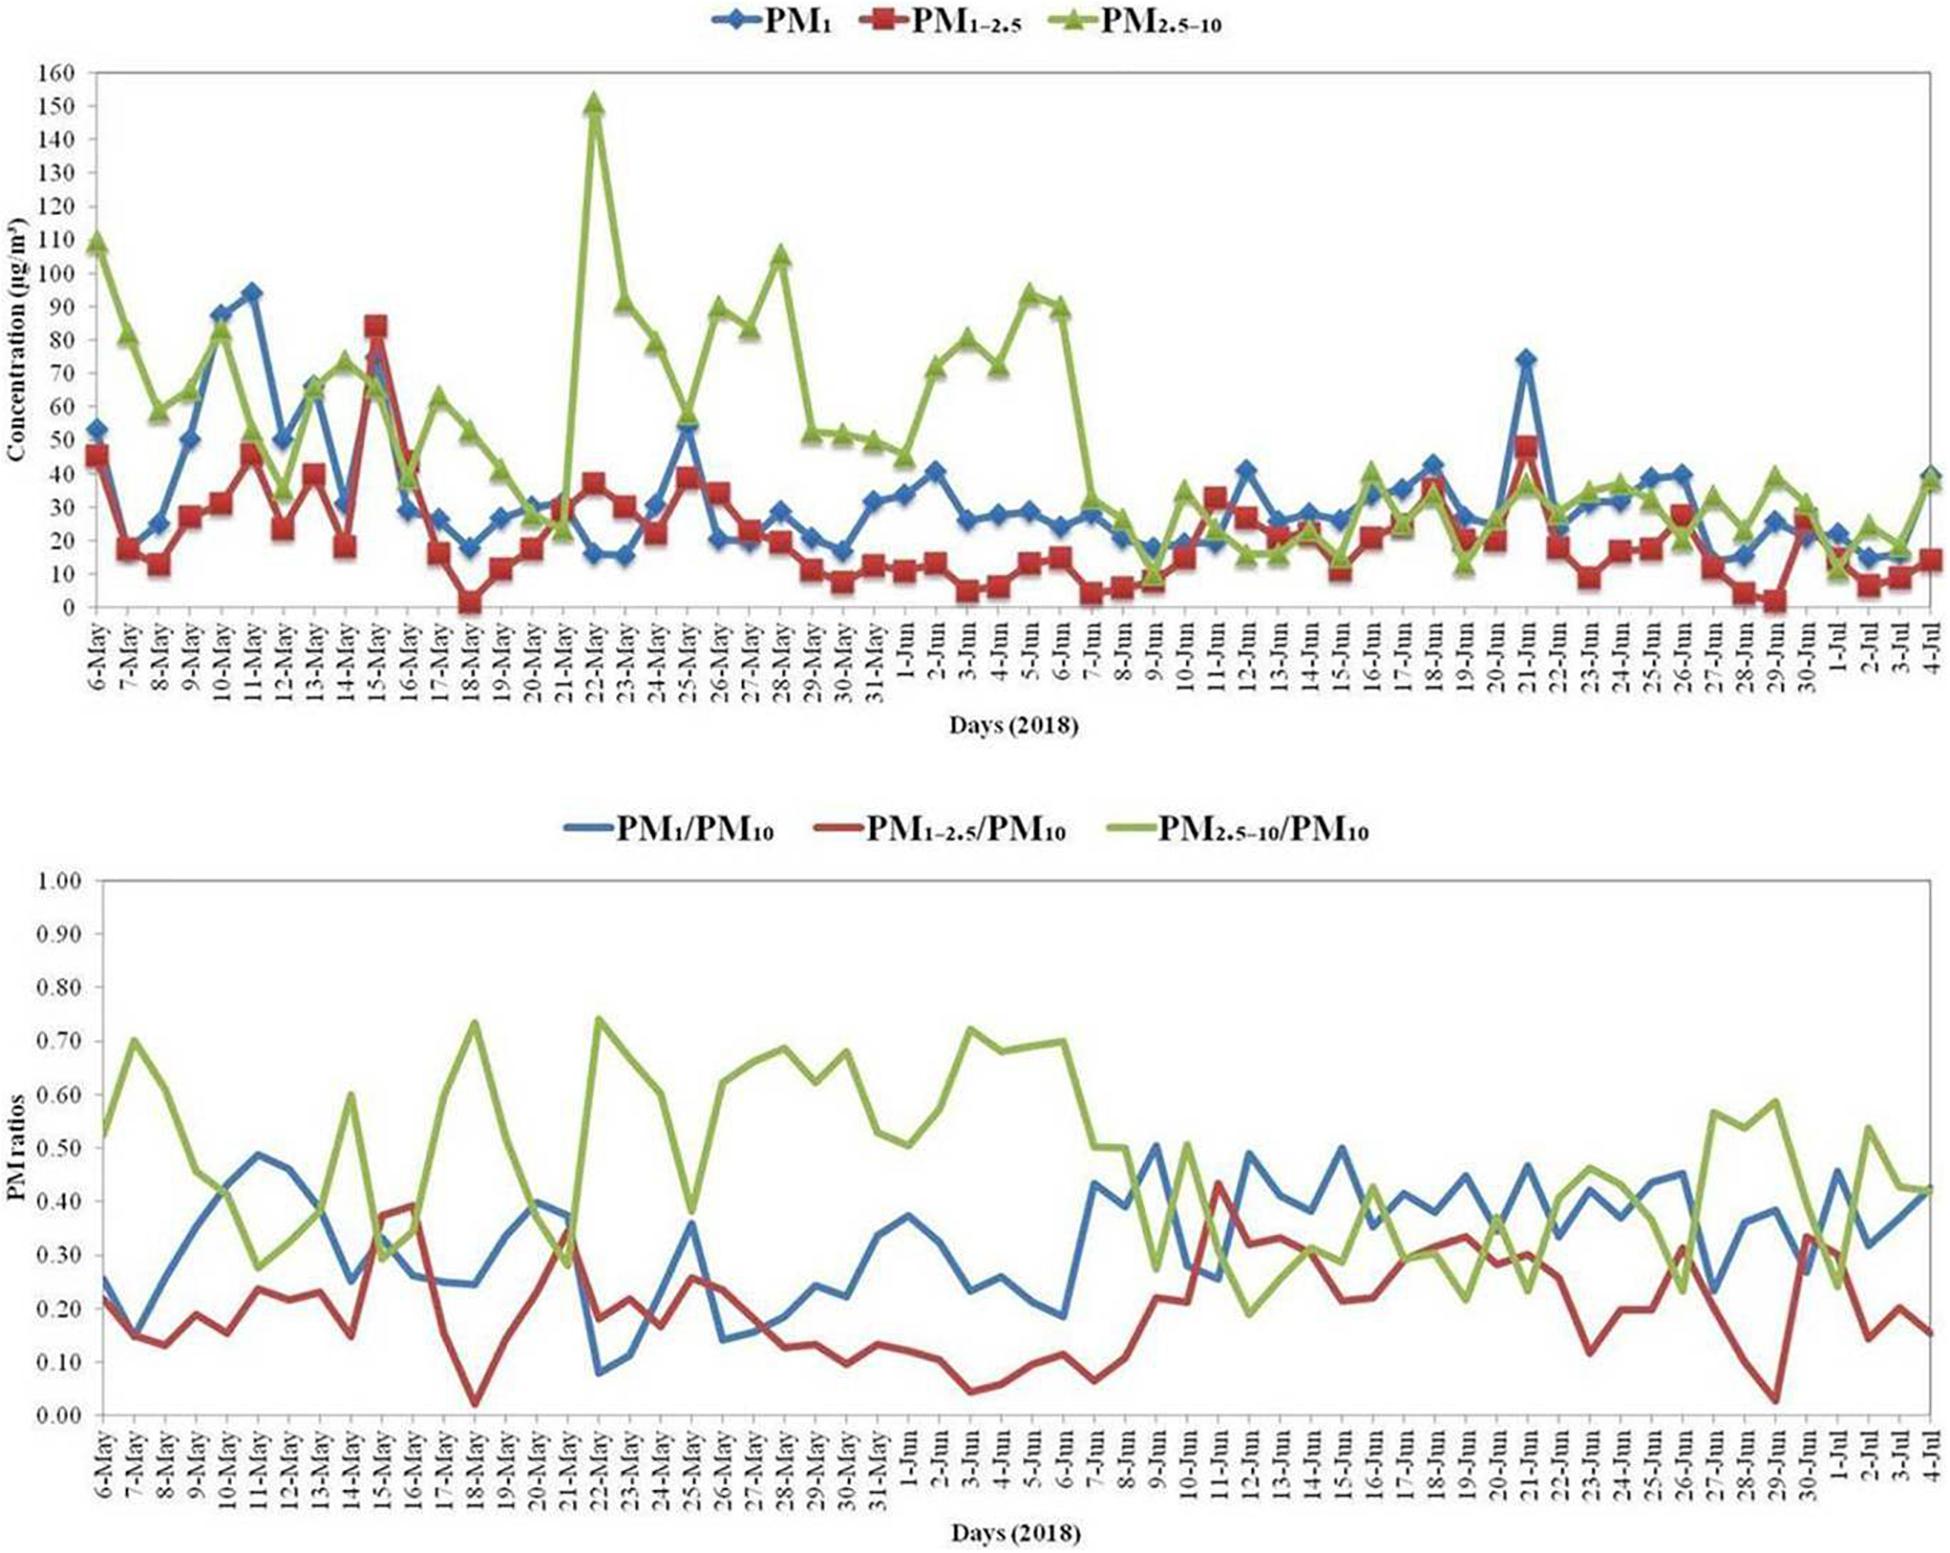
Figure 2. Temporal trends of the PM1, PM1–2.5, and PM2.5–10 concentrations (μg/m3) and the PM1/PM10, PM1–2.5/PM10, and PM2.5–10/PM10 ratios.
The average PM1/PM10 ratio was 0.33 ± 0.10 ranging from 0.08 to 0.51, the average PM1–2.5/PM10 ratio was 0.20 ± 0.09 ranging from 0.02 to 0.43, and the average PM2.5–10/PM10 ratio was 0.47 ± 0.16 ranging from 0.19 to 0.74. The PM1 constituted 33%, the PM1–2.5 constituted 20%, and the PM2.5–10 constituted 47% of the ambient PM, on average. The PM mass was distributed mostly in the coarse PM2.5–10 fraction, distributed moderately in the fine PM1 fraction, and distributed considerably in the intermodal PM1–2.5 fraction. The statistical summary of the PM ratios is presented in Table 2. The higher PM2.5–10/PM10 average ratio indicated the significant contribution of coarse particles to the PM10 mass concentrations, due to the elevated mineral dust (soil, crustal, and re-suspended dust), mechanical abrasion, and primary biogenic sources (Xu et al., 2019). The moderate PM1/PM10 average ratio indicated the fine PM’s significant anthropogenic combustion, industrial, and traffic sources. The comparatively lower but considerable PM1–2.5/PM10 ratio indicated that the intermodal PM1–2.5 contains particles of both the natural and anthropogenic origins (Kozáková et al., 2018).
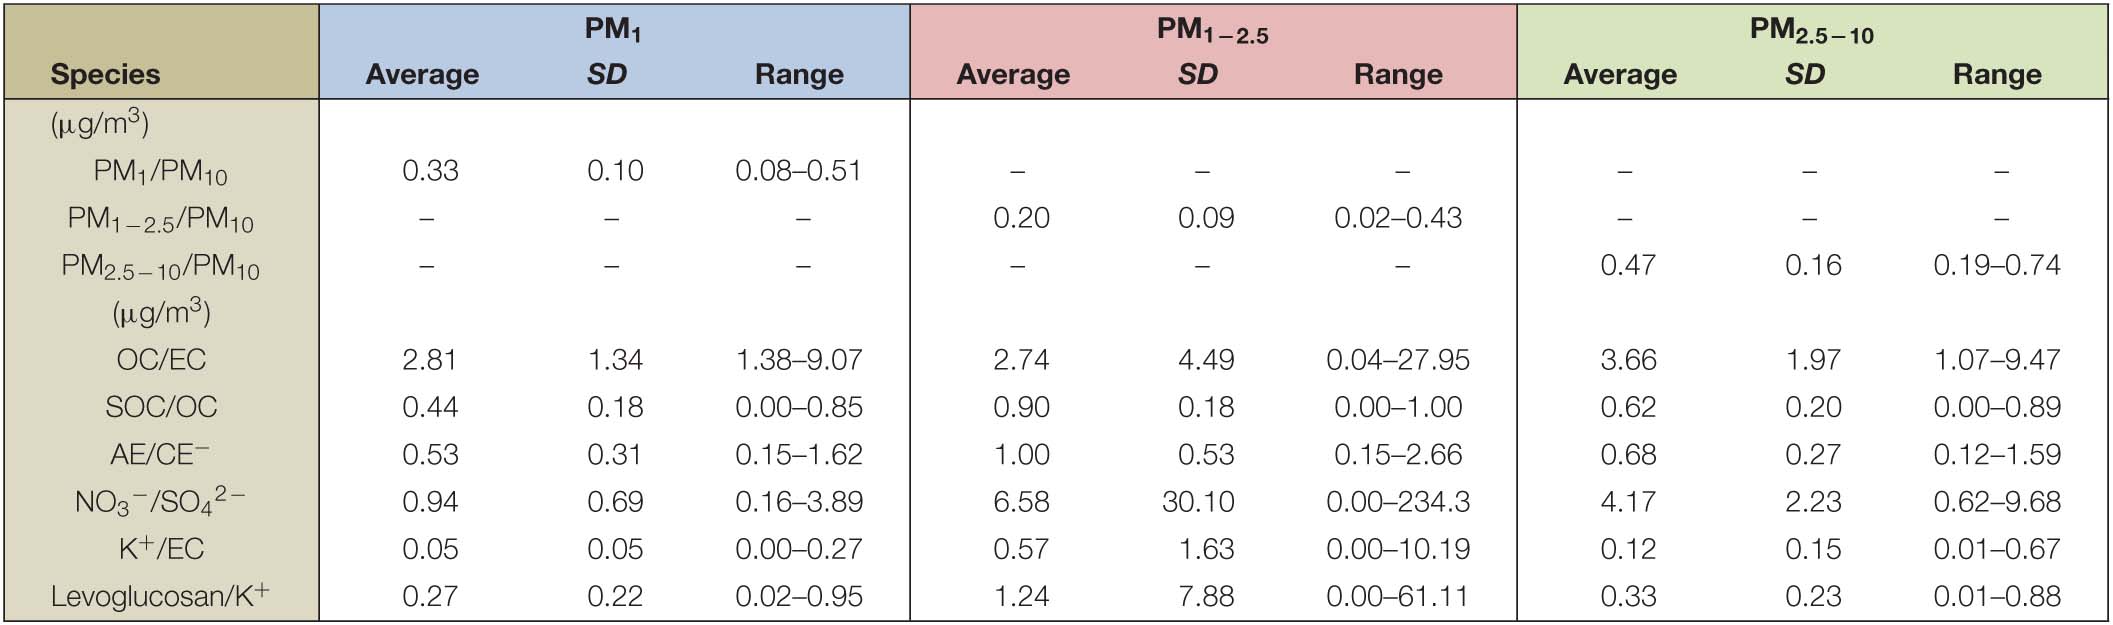
Table 2. Statistical summary of the fraction-wise PM’s characteristic ratios.
The ambient PM’s chemical compositions involved the carbonaceous species (OC and EC), the ionic species (Cl–, NO3–, SO42–, Na+, NH4+, and K+), the elemental species (Al, Ca, Fe, Mg, Si, As, Cu, Mn, Ni, Pb, Ti, V, and Zn), and the saccharide species (levoglucosan, glucose, fructose, arabitol, and mannitol). The statistical summary of the fraction-wise PM’s chemical compositions is presented in Table 1.
The PM1’s dominant chemical species (average concentration > 0.5 μg/m3) were the OC (16.46%), SO42– (7.98%), NO3– (7.47%), EC (6.62%), NH4+ (4.94%), and Si (1.93%). The PM1–2.5’s dominant chemical species (average concentration > 0.5 μg/m3) were the NO3– (13.31%), SO42– (8.35%), Si (5.49%), NH4+ (3.98%), and OC (3.02%). The PM2.5–10’s dominant chemical species (average concentration > 1 μg/m3) were the Si (10.54%), NO3– (7.70%), OC (6.15%), Ca (4.98%), Fe (3.32%), Al (3.31%), and SO42– (2.18%). The OC and EC were more abundant in the fine fraction, whereas the Si, Ca, Fe, and Al were more abundant in the coarse fraction. NO3– was more abundant in the intermodal and coarse fractions, whereas SO42– and NH4+ were more abundant in the fine and intermodal fractions. The fine PM1 was mostly composed of the carbonaceous (OC and EC) and ionic (NO3–, SO42–, and NH4+) species, the intermodal PM1–2.5 was more composed of the ionic (NO3–, SO42–, and NH4+) species, and the coarse PM2.5–10 had more elemental (Si, Ca, Fe, and Al) species. NO3–, SO42–, and NH4+ were mainly composed of the secondary inorganic aerosol (SIA). The SIA’s contribution to the total PM mass concentration was 6.60 (20%), 5.37 (26%), and 5.30 μg/m3 (11%) for the PM1, PM1–2.5, and PM2.5–10, respectively. The PM mass reconstruction can provide the contribution of component species to the total PM mass concentration for the PM size fractions. The PM mass reconstruction involved the PM components of organic matter (OM), EC, NO3–, SO42–, NH4+, Cl–, Na+, K+, mineral matter (MM), and trace elements (TE). The TE is the sum of As, Cu, Ni, Pb, V, and Zn. The OM and MM were estimated according to Equations 1, 2 (Tian et al., 2016).
The component species’ contributions to the total PM mass concentration for the PM size fractions are presented in Supplementary Figure 3. The Pearson correlation coefficients were determined for the fraction-wise PM’s constituent chemical species and are discussed accordingly in the next size distribution section (Supplementary Tables 3–5).
The size distribution of the ambient PM is an important aspect to be explored. The size distribution involved the concentration and percentage contributions of the constituent chemical species (carbonaceous, ionic, elemental, and saccharide species) to the fraction-wise PM.
The total carbon (TC) refers to the sum of carbonaceous species, the ions refer to the sum of ionic species, and the elements refer to the sum of elemental species. The size distributions and contributions of the TC, ions, and elements (major and trace elements) were investigated for the fraction-wise PM (Figure 3).
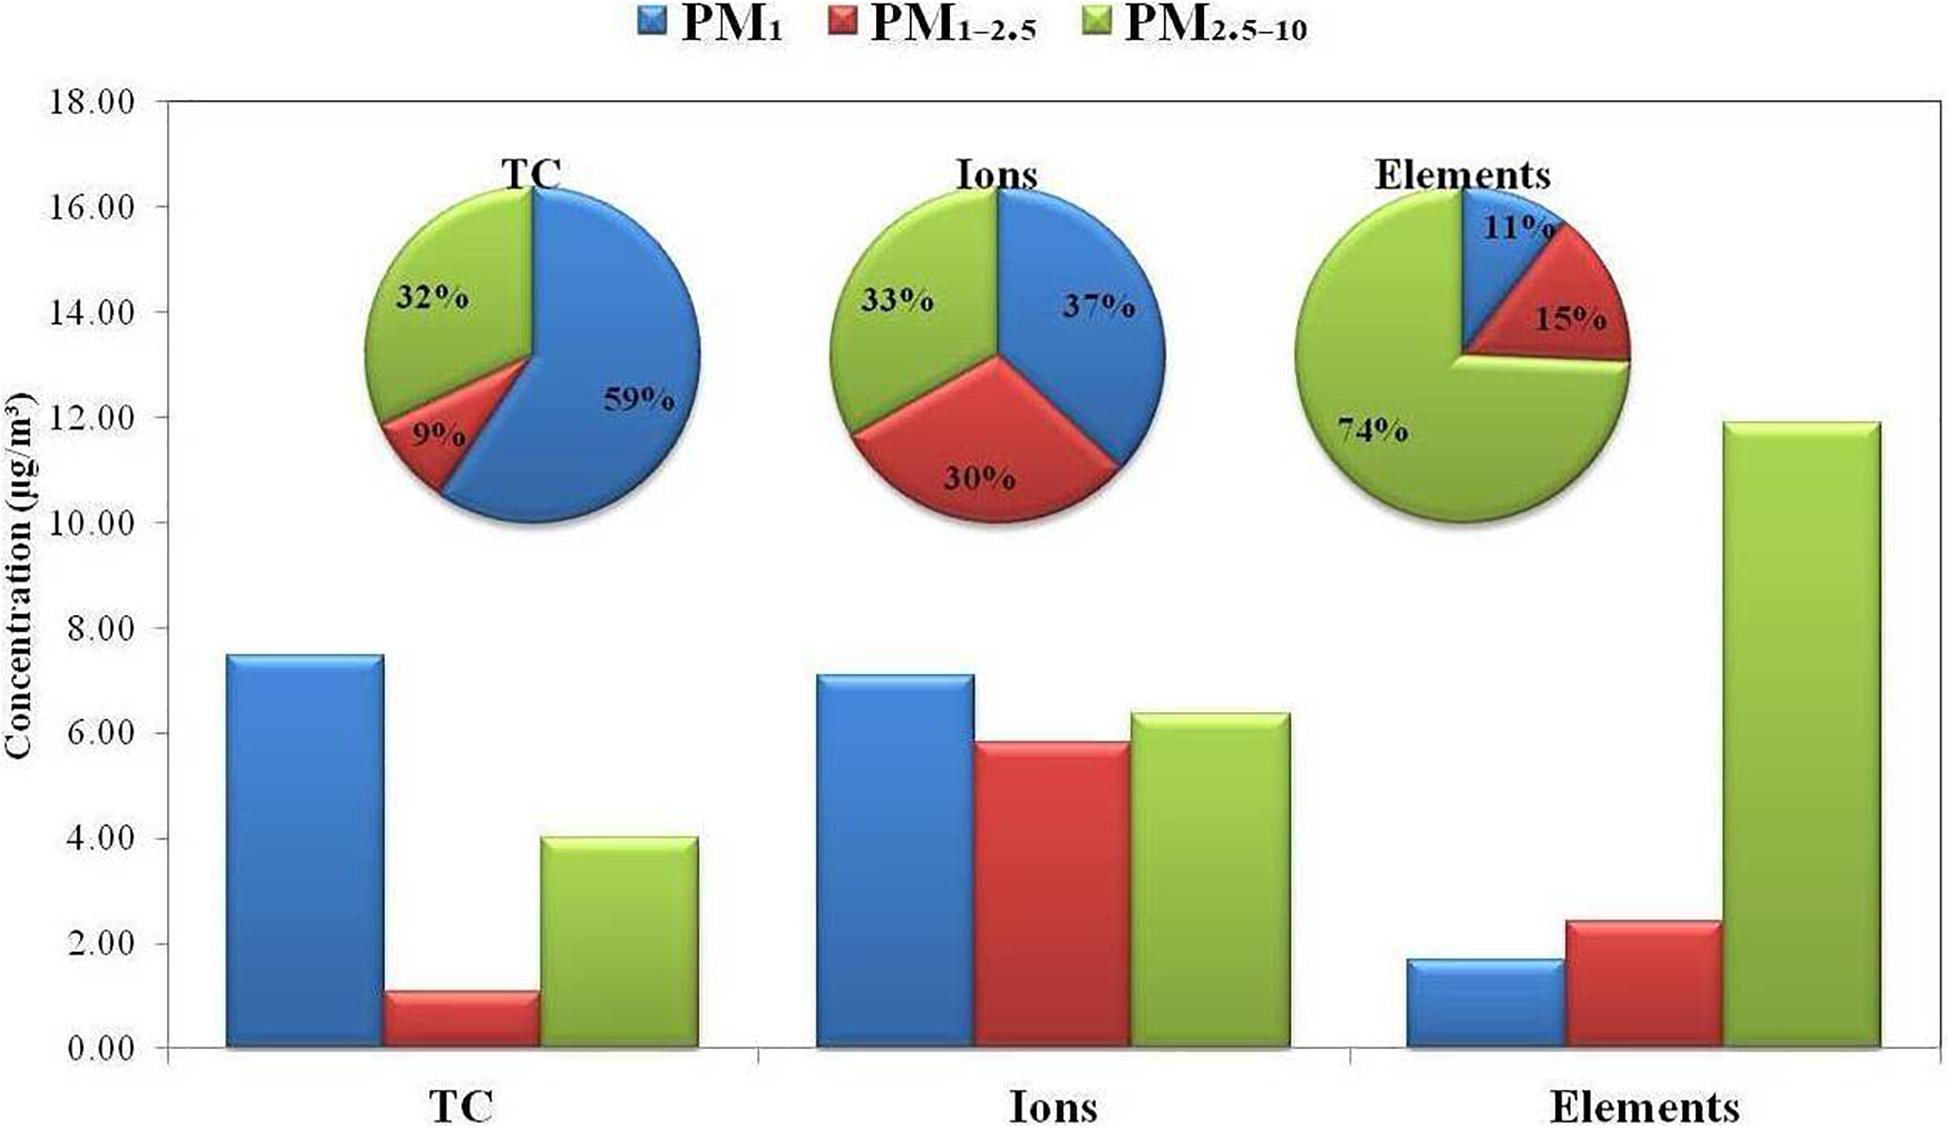
Figure 3. Size distributions and contributions of the TC, ions, and elements.
The fine PM1’s total species mass was composed of 46% TC, 44% ions, and 10% elements. The intermodal PM1–2.5’s total species mass was composed of 12% TC, 62% ions, and 26% elements. The coarse PM2.5–10’s total species mass was composed of 18% TC, 29% ions, and 53% elements. The fraction-wise PM’s TC, ions, and elements compositions are presented in Supplementary Figure 4. The fine composition had more TC, the intermodal composition had more ions, and the coarse composition had more elements.
The TC distribution was 7.47 (59%), 1.09 (9%), and 4.02 μg/m3 (32%) to the PM1, PM1–2.5, and PM2.5–10, respectively. The ionic distribution was 7.09 (37%), 5.81 (30%), and 6.37 μg/m3 (33%) to the PM1, PM1–2.5, and PM2.5–10, respectively. The elemental distribution was 1.68 (11%), 2.43 (15%), and 11.90 μg/m3 (74%) to the PM1, PM1–2.5, and PM2.5–10, respectively. The TC and ions were mostly distributed in the fine fraction and then in the coarse fraction. The elements were mostly distributed in the coarse fraction and then in the intermodal fraction.
The TC and ions exhibited bimodal distribution peaking at the fine and coarse PM fractions. The elements exhibited unimodal distribution peaking at the coarse fraction, as increased with the increasing PM size. The categorical size distribution for the carbonaceous, ionic, elemental, and saccharide species is explored in the next sections.
The OC and EC are the carbonaceous species, which mainly indicate the primary combustion sources and some secondary organic particles and primary biogenic sources. The size distributions and contributions of the carbonaceous species were investigated for the fraction-wise PM (Figure 4).
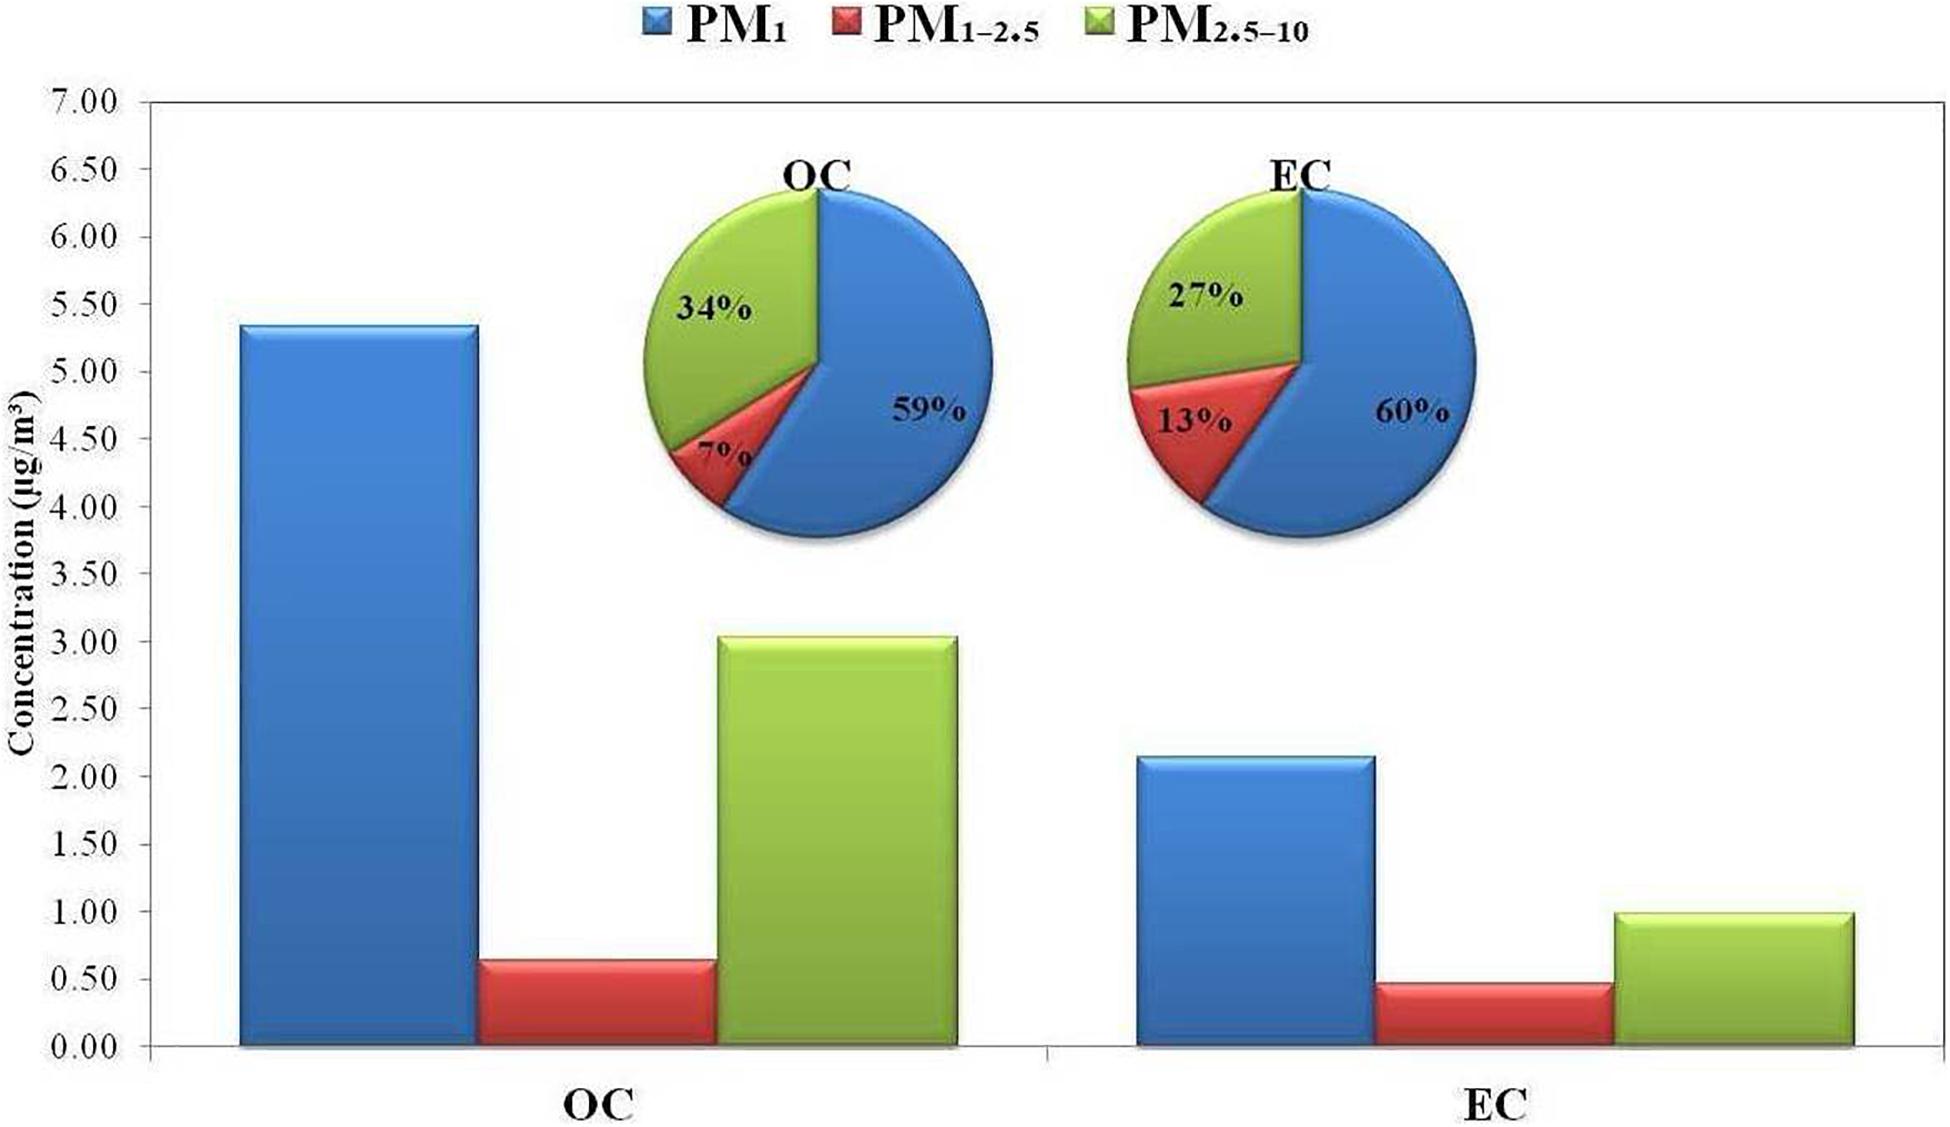
Figure 4. Size distributions and contributions of the carbonaceous species.
The fine PM1’s total carbonaceous mass was composed of 71% OC and 29% EC. The intermodal PM1–2.5’s total carbonaceous mass was composed of 58% OC and 42% EC. The coarse PM2.5–10’s total carbonaceous mass was composed of 75% OC and 25% EC. The fraction-wise PM’s carbonaceous compositions are presented in Supplementary Figure 5. The fine and coarse compositions had significantly higher OC, whereas the EC was more evident in the intermodal composition.
The OC originates from the combustion processes as well as the secondary organic particles and primary biogenic sources, whereas the EC primarily originates from the combustion processes (Liang et al., 2019). The OC and EC generally originate from the primary combustion processes (biomass burning, coal combustion, and traffic emission) in the fine and intermodal mass fractions, whereas the primary biogenic sources mainly contribute to the coarse mass fraction. Dust re-suspension may also enhance the adhesion of OC and EC onto the surface of coarse particles (Martins et al., 2020).
The OC distribution was 5.33 (59%), 0.63 (7%), and 3.03 μg/m3 (34%) to the PM1, PM1–2.5, and PM2.5–10, respectively. The EC distribution was 2.14 (60%), 0.46 (13%), and 0.99 μg/m3 (27%) to the PM1, PM1–2.5, and PM2.5–10, respectively. The OC and EC were mostly distributed in the fine fraction and then in the coarse fraction.
The OC and EC exhibited bimodal distribution peaking at the fine and coarse PM fractions. The OC and EC were strongly correlated in the fine fraction and moderately correlated in the coarse fraction. The OC and EC of the fine fraction had more similar sources, such as the primary combustion and traffic emissions, whereas the intermodal and coarse OC originated mainly from the secondary sources. The combustion sources of OC and EC contributed mostly to the fine fraction than other fractions, whereas the secondary organic particles were more evident in the intermodal fraction. The primary biogenic and re-suspended dust contributions were more evident in the coarse fraction. The combustion sources of OC and EC decreased with the increasing PM size and peaked at the fine fraction, whereas their re-suspended sources increased with the increasing PM size and peaked at the coarse fraction. The OC’s primary biogenic sources increased with the increasing PM size and peaked at the coarse fraction.
The Cl–, NO3–, SO42–, Na+, NH4+, and K+ are the ionic species, which indicate various secondary and primary contributing sources of diverse origins. The size distributions and contributions of the ionic species were investigated for the fraction-wise PM (Figure 5).
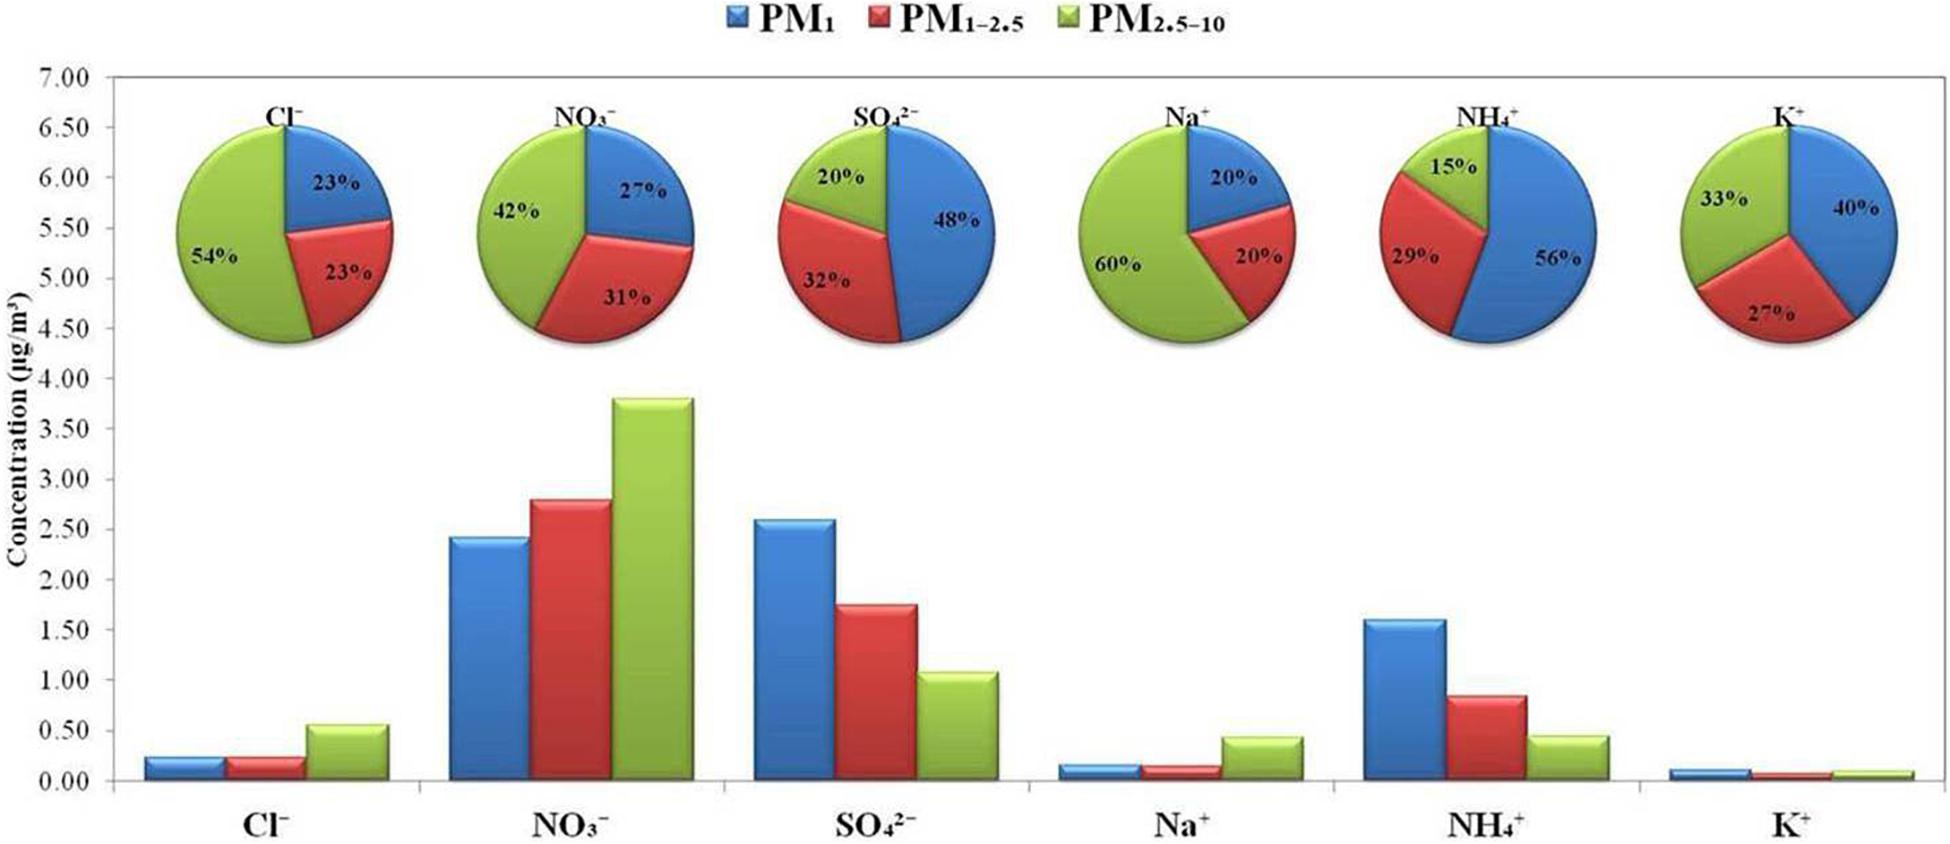
Figure 5. Size distributions and contributions of the ionic species.
The fine PM1’s total ionic mass was composed of 3% Cl–, 34% NO3–, 37% SO42–, 2% Na+, 23% NH4+, and 1% K+. The intermodal PM1–2.5’s total ionic mass was composed of 4% Cl–, 48% NO3–, 30% SO42–, 3% Na+, 14% NH4+, and 1% K+. The coarse PM2.5–10’s total ionic mass was composed of 8% Cl–, 60% NO3–, 17% SO42–, 7% Na+, 7% NH4+, and 1% K+. The fraction-wise PM’s ionic compositions are presented in Supplementary Figure 6. The SIA (NO3–, SO42–, and NH4+) was the major contributor to the total ionic mass for all the PM size fractions.
The NO3–, SO42–, and NH4+ are the main components of the SIA (Waked et al., 2014). The NO3–, SO42–, and NH4+ mainly originate from the gas-to-particle processes involving precursor gaseous reactions (Xu et al., 2019). The heterogeneous reactions of HNO3 and H2SO4 with the mineral dust or marine salts can enhance the adhesion of NO3– and SO42– onto the surface of coarse particles.
The NO3– distribution was 2.42 (27%), 2.79 (31%), and 3.79 μg/m3 (42%) to the PM1, PM1–2.5, and PM2.5–10, respectively. The SO42– distribution was 2.59 (48%), 1.75 (32%), and 1.07 μg/m3 (20%) to the PM1, PM1–2.5, and PM2.5–10, respectively. The NH4+ distribution was 1.60 (56%), 0.83 (29%), and 0.44 μg/m3 (15%) to the PM1, PM1–2.5, and PM2.5–10, respectively. The NO3– was dominant in the coarse size fraction due to the heterogeneous reactions between the HNO3 and crustal species (mineral dust) or sea salts (marine salt), whereas the SO42– and NH4+ were more abundant in the fine and intermodal size fractions due to the gas-to-particle conversion processes. The average NH4+/SO42– ratios were 0.75, 0.87, and 0.46 for the PM1, PM1–2.5, and PM2.5–10, respectively. The lower NH4+/SO42– ratios indicated the heterogeneous reactions of HNO3 and H2SO4 with the mineral dust or marine salts leading to the NO3– and SO42– formation (Huang et al., 2011). The lower average NH4+/SO42– ratio for the coarse size fraction confirmed dominant NO3– and SO42– formation by the heterogeneous reactions of HNO3 and H2SO4 with the mineral dust or marine salts in the coarse size fraction.
The NO3– exhibited unimodal distribution peaking at the coarse PM fraction, as increased with the increasing PM size. The SO42– and NH4+ exhibited unimodal distribution peaking at the fine PM fraction, as decreased with the increasing PM size. The NO3–, SO42–, and NH4+ were more strongly correlated in the fine and intermodal fractions than in the coarse fraction. Therefore, the NO3–, SO42–, and NH4+ had more similar sources in the fine and intermodal fractions than in the coarse fraction. The secondary sources of the NO3–, SO42–, and NH4+ contributed mostly to the fine and intermodal fractions. The re-suspended contributing sources (adhesion onto the surface of particles) of the NO3– and SO42– were more evident in the coarse fraction. The secondary sources of NO3–, SO42–, and NH4+ decreased with the increasing PM size and peaked at the fine fraction, whereas the re-suspended (resulting from the interactions with MM and marine salts) sources increased with the increasing PM size and peaked at the coarse fraction (Ocskay et al., 2006; Kawamura et al., 2007).
The Cl– mainly originates from the coal combustion, and the K+ mainly originates from the biomass burning (Wang et al., 2017). The Na+ mainly originates from the marine salt, but is also substantially released during the coal combustion and biomass burning (Zhang et al., 2018). The Cl–, Na+, and K+ are also substantially released during the waste incineration.
The Cl– distribution was 0.23 (23%), 0.23 (23%), and 0.55 μg/m3 (54%) to the PM1, PM1–2.5, and PM2.5–10, respectively. The Na+ distribution was 0.15 (21%), 0.14 (20%), and 0.43 μg/m3 (60%) to the PM1, PM1–2.5, and PM2.5–10, respectively. The K+ distribution was 0.10 (39%), 0.07 (27%), and 0.09 μg/m3 (33%) to the PM1, PM1–2.5, and PM2.5–10, respectively. The Cl– and Na+ were mostly distributed in the coarse fraction and then in the fine fraction. The K+ was mostly distributed in the fine fraction and then in the coarse fraction.
The Cl–, Na+, and K+ exhibited bimodal distribution peaking at the fine and coarse PM fractions. The Cl– and Na+ were well correlated in the intermodal and coarse fractions. The K+ was well correlated with Cl– and Na+ in the fine and intermodal fractions. Therefore, the Cl– and Na+ had more similar sources in the intermodal and coarse fractions, whereas the K+ had more similar source with Cl– and Na+ in the fine and intermodal fractions. The coal combustion, biomass burning, and waste incineration sources of the Cl–, Na+, and K+ contributed mostly to the fine fraction and then to the intermodal fraction. The marine salt sources of the Cl–, Na+, and K+ were more evident in the coarse fraction. The marine salt sources of Cl–, Na+, and K+ increased with the increasing PM size and peaked at the coarse fraction, whereas their coal combustion, biomass burning, and waste incineration sources decreased with the increasing PM size and peaked at the fine fraction (Van Do et al., 2021).
The Al, Ca, Fe, Mg, Si, and TE are the elemental species, which indicate various natural and anthropogenic sources of diverse origins. The size distributions and contributions of the elemental species were investigated for the fraction-wise PM (Figure 6).
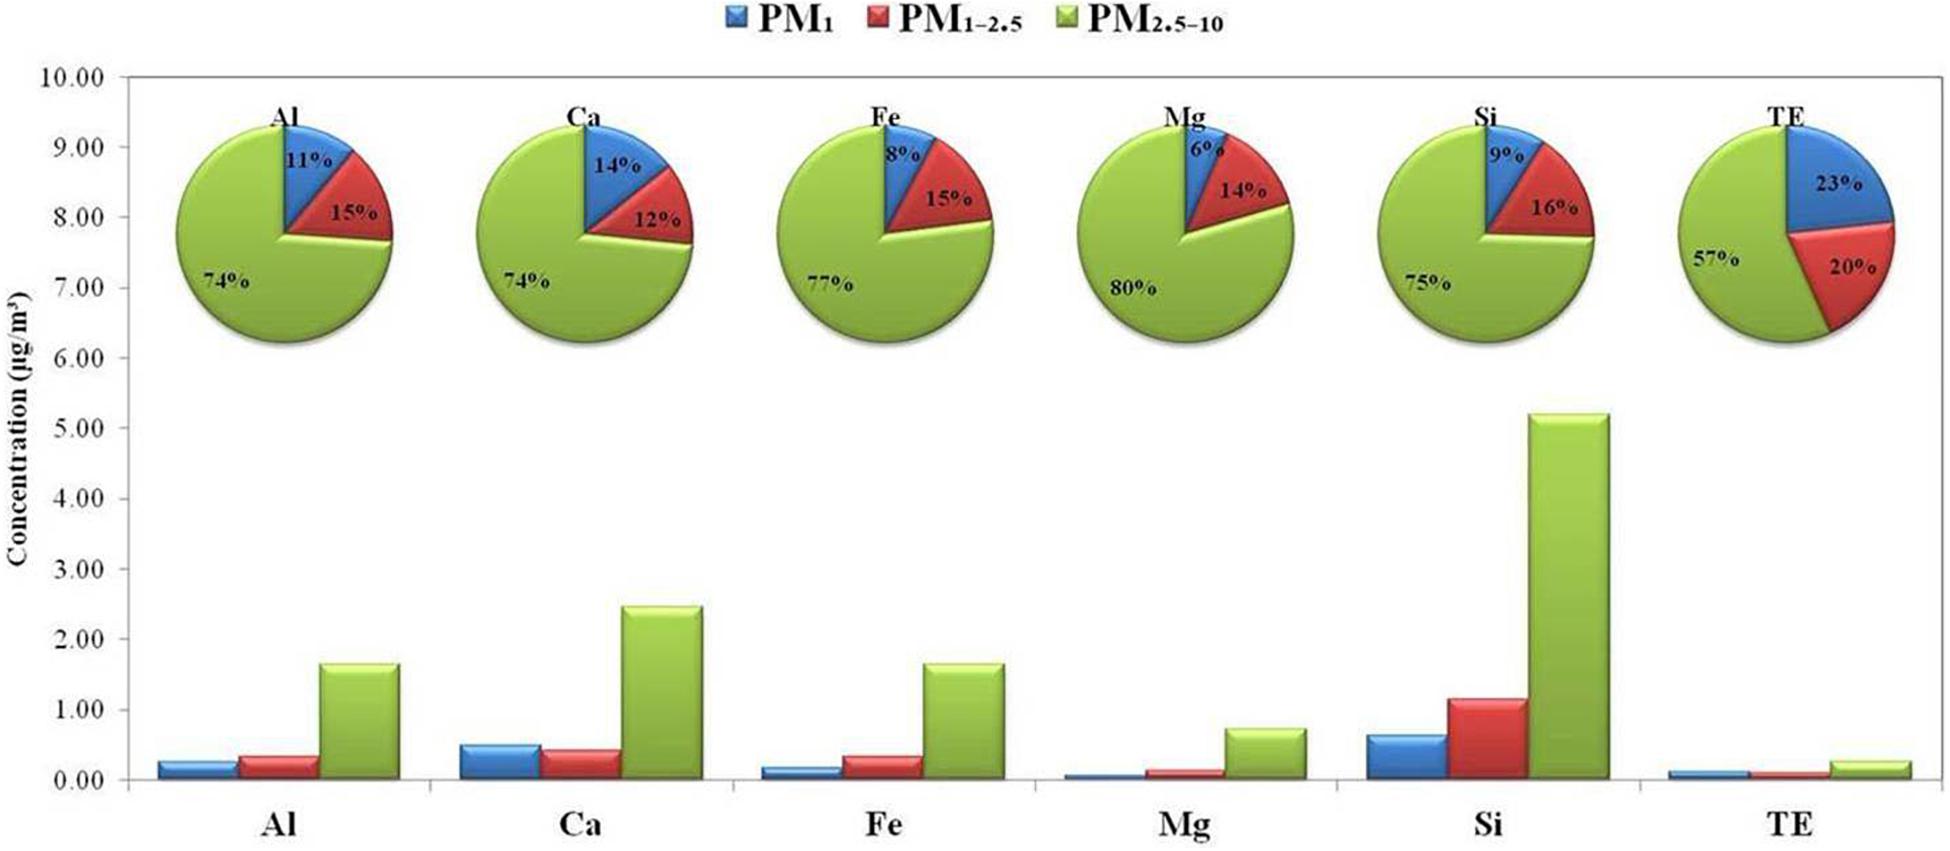
Figure 6. Size distributions and contributions of the elemental species.
The fine PM1’s total elemental mass was composed of 15% Al, 29% Ca, 10% Fe, 3% Mg, 37% Si, and 6% TE. The intermodal PM1–2.5’s total elemental mass was composed of 14% Al, 17% Ca, 13% Fe, 5% Mg, 47% Si, and 4% TE. The coarse PM2.5–10’s total elemental mass was composed of 14% Al, 20% Ca, 14% Fe, 6% Mg, 44% Si, and 2% TE. The fraction-wise PM’s elemental compositions are presented in Supplementary Figure 7. The Al, Ca, Fe, and Si were significantly higher in all the elemental compositions.
The Al, Ca, Fe, Mg, and Si are the well-known mineral dust indicators, and these mineral dust elements constitute the MM (Martins et al., 2020). The mineral dust elements have both local and regional origins and are mainly associated with soil, crustal, and re-suspended dust (Tian et al., 2018). The TE are the main indicators of anthropogenic sources.
The Al distribution was 0.25 (11%), 0.33 (15%), and 1.63 μg/m3 (74%) to the PM1, PM1–2.5, and PM2.5–10, respectively. The Ca distribution was 0.48 (14%), 0.41 (12%), and 2.46 μg/m3 (74%) to the PM1, PM1–2.5, and PM2.5–10, respectively. The Fe distribution was 0.17 (8%), 0.32 (15%), and 1.63 μg/m3 (77%) to the PM1, PM1–2.5, and PM2.5–10, respectively. The Mg distribution was 0.06 (6%), 0.13 (14%), and 0.73 μg/m3 (80%) to the PM1, PM1–2.5, and PM2.5–10, respectively. The Si distribution was 0.63 (9%), 1.15 (16%), and 5.19 μg/m3 (75%) to the PM1, PM1–2.5, and PM2.5–10, respectively. The TE distribution was 0.10 (23%), 0.09 (20%), and 0.26 μg/m3 (57%) to the PM1, PM1–2.5, and PM2.5–10, respectively. The Al, Fe, Mg, and Si were mostly distributed in the coarse fraction and then in the intermodal fraction. The Ca and TE were mostly distributed in the coarse fraction and then in the fine fraction.
The Al, Fe, Mg, and Si exhibited unimodal distribution peaking at the coarse fraction, as increased with the increasing PM size. The Ca and TE exhibited bimodal distribution peaking at the fine and coarse PM fractions. The Al, Ca, Fe, Mg, and Si were well correlated in the intermodal and coarse fractions. The mineral dust (soil, crustal, and re-suspended dust) sources of Al, Ca, Fe, Mg, and Si contributed mostly to the coarse fraction and then to the intermodal fraction. The anthropogenic (construction, industrial, and road activities) sources of Al, Ca, Fe, Mg, and Si were more evident in the fine fraction. The mineral dust (MM) contribution increased with the increasing PM size, as the increasing contributions of soil, crustal, and re-suspended dust elements of Al, Ca, Fe, Mg, and Si (Martins et al., 2020). The bimodal TE distribution was due to the contribution of their mineral dust and re-suspended sources in the coarse PM fraction.
The As, Cu, Mn, Ni, Pb, Ti, V, and Zn are the TE, which have lower concentrations and are more toxic mainly indicating anthropogenic origins. The size distributions and contributions of the TE were investigated for the fraction-wise PM (Figure 7).
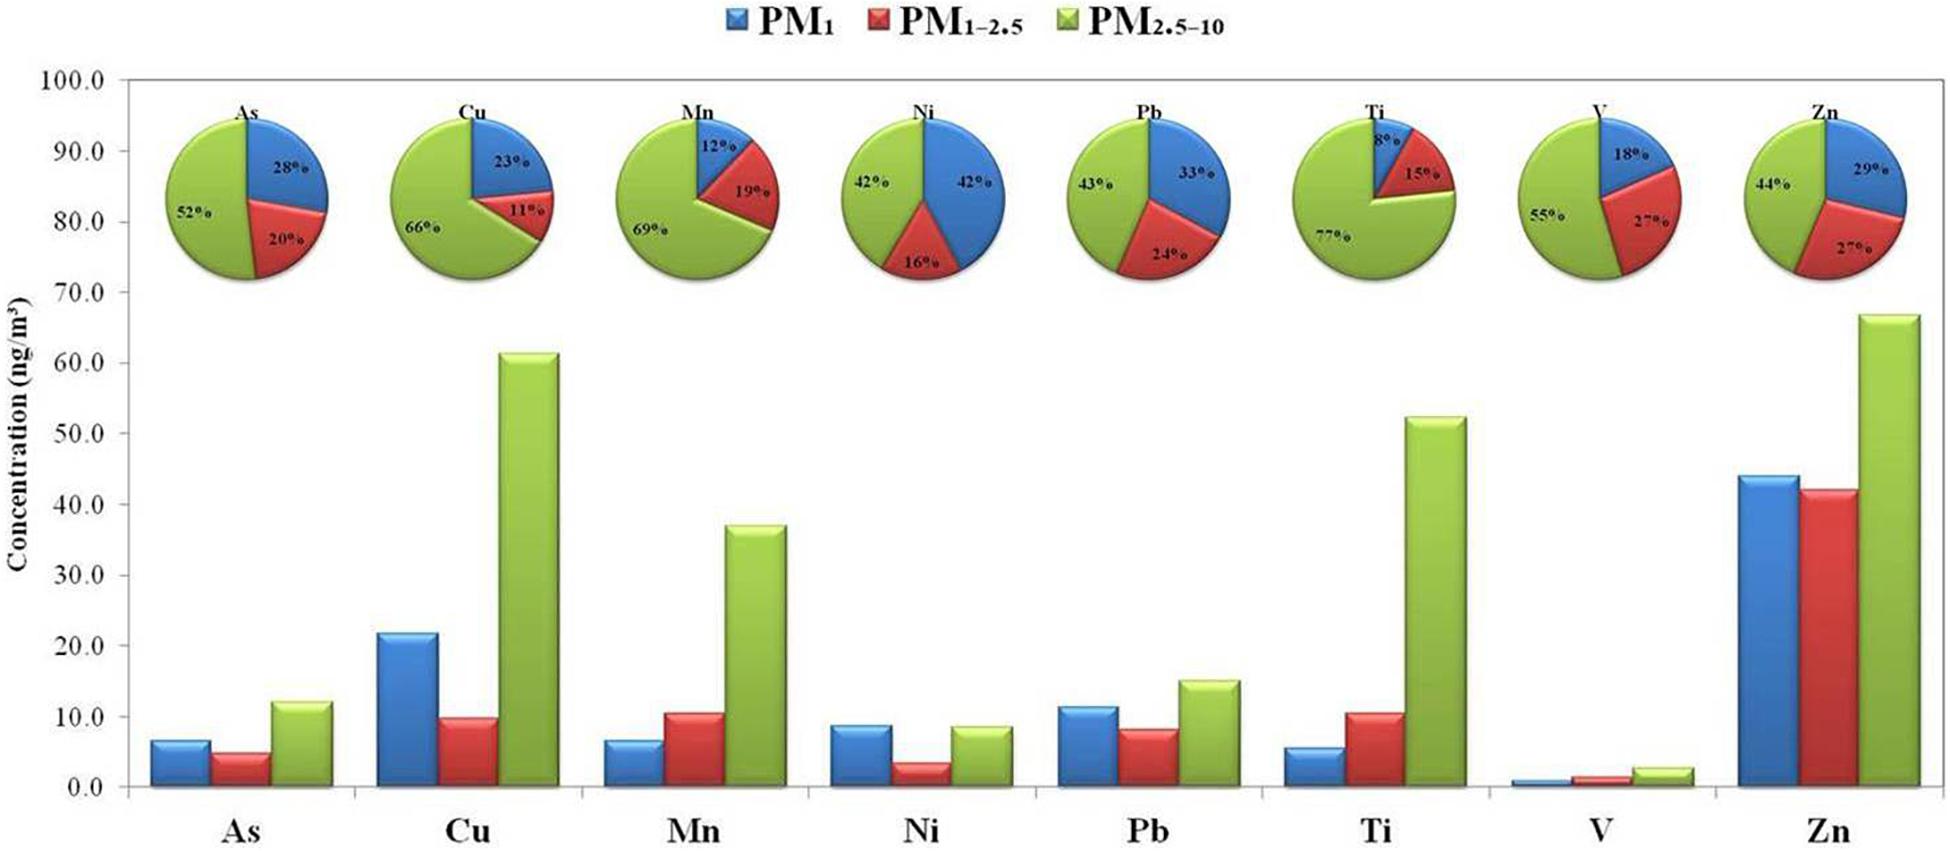
Figure 7. Size distributions and contributions of the trace elements.
The fine PM1’s total trace elemental mass was composed of 6% As, 21% Cu, 6% Mn, 8% Ni, 11% Pb, 5% Ti, 1% V, and 42% Zn. The intermodal PM1–2.5’s total trace elemental mass was composed of 5% As, 11% Cu, 12% Mn, 4% Ni, 9% Pb, 11% Ti, 1% V, and 47% Zn. The coarse PM2.5–10’s total trace elemental mass was composed of 5% As, 24% Cu, 15% Mn, 3% Ni, 6% Pb, 20% Ti, 1% V, and 26% Zn. The fraction-wise PM’s trace elemental compositions are presented in Supplementary Figure 8. The Cu and Zn were significantly higher in all the trace elemental compositions.
The As, Cu, Mn, Ni, Pb, Ti, V, and Zn mainly indicate the combustion, traffic, and industrial sources and are more toxic in nature (Wu et al., 2007). The Cu mainly indicates the industrial and traffic sources, whereas the V is a good indicator of shipping emissions (Saraga et al., 2019). The Mn and Ti indicate the mineral dust as well as some industrial and traffic sources (Dai et al., 2018).
The As distribution was 6.5 (28%), 4.7 (20%), and 12.1 ng/m3 (52%) to the PM1, PM1–2.5, and PM2.5–10, respectively. The Cu distribution was 21.8 (23%), 9.7 (10%), and 61.3 ng/m3 (66%) to the PM1, PM1–2.5, and PM2.5–10, respectively. The Mn distribution was 6.5 (12%), 10.5 (19%), and 37.0 ng/m3 (69%) to the PM1, PM1–2.5, and PM2.5–10, respectively. The Ni distribution was 8.6 (42%), 3.3 (16%), and 8.4 ng/m3 (42%) to the PM1, PM1–2.5, and PM2.5–10, respectively. The Pb distribution was 11.3 (33%), 8.1 (24%), and 15.0 ng/m3 (44%) to the PM1, PM1–2.5, and PM2.5–10, respectively. The Ti distribution was 5.5 (8%), 10.4 (15%), and 52.3 ng/m3 (77%) to the PM1, PM1–2.5, and PM2.5–10, respectively. The V distribution was 0.9 (18%), 1.3 (27%), and 2.6 ng/m3 (55%) to the PM1, PM1–2.5, and PM2.5–10, respectively. The Zn distribution was 44.0 (29%), 42.0 (28%), and 66.7 ng/m3 (44%) to the PM1, PM1–2.5, and PM2.5–10, respectively. The As, Cu, Pb, and Zn were mostly distributed in the coarse fraction and then in the fine fraction. The Ni was mostly distributed in the fine fraction and then in the coarse fraction. The Mn, Ti, and V were mostly distributed in the coarse fraction and then in the intermodal fraction.
The As, Cu, Ni, Pb, and Zn exhibited bimodal distribution peaking at the fine and coarse PM fractions. The Mn, Ti, and V exhibited unimodal distribution peaking at the coarse fraction, as increased with the increasing PM size. The Mn and Ti were well correlated with mineral dust elements in the intermodal and coarse fractions, whereas Cu and V in the coarse fraction. The mineral dust sources of Mn and Ti contributed mostly to the intermodal and coarse fractions, whereas their industrial and traffic sources were more evident in the fine fraction. The industrial, traffic, and shipping sources of Cu and V contributed mostly to the fine and intermodal fractions, whereas their mineral dust sources were more evident in the coarse fraction. The As, Ni, Pb, and Zn had various combustion, traffic, and industrial sources for all the PM fractions. The higher contributions of Cu, Mn, Ti, and V in the coarse PM fraction depicted their mineral dust nature with the increasing PM size. The significant contributions of As, Ni, Pb, and Zn in all the PM fractions depicted the anthropogenic contributions in all the PM size fractions.
The saccharide species are the levoglucosan, glucose, fructose, arabitol, and mannitol, which indicate the biomass burning and primary biogenic sources. The size distributions and contributions of the saccharide species were investigated for the fraction-wise PM (Figure 8).

Figure 8. Size distributions and contributions of the saccharide species.
The fine PM1’s total saccharides mass was composed of 53% levoglucosan, 11% glucose, and 36% mannitol. The intermodal PM1–2.5’s total saccharides mass was composed of 22% levoglucosan, 42% glucose, 4% fructose, 12% arabitol, and 20% mannitol. The coarse PM2.5–10’s total saccharides mass was composed of 17% levoglucosan, 26% glucose, 11% fructose, 19% arabitol, and 27% mannitol. The fraction-wise PM’s saccharides compositions are presented in Supplementary Figure 9. The levoglucosan was the dominant saccharide species in the fine fraction, and the glucose was more abundant in the intermodal fraction, whereas the mannitol was more abundant in the coarse fraction.
The levoglucosan is a well-known biomass burning indicator and is the degradation product of cellulose burning generated during thermal breakdown (Simoneit et al., 1999; Puxbaum et al., 2007). The levoglucosan is released during biomass burning phenomena, such as agricultural residue burning, forest fires, wood combustion, bio-fuel combustion, and bio-waste incineration.
The levoglucosan distribution was 14.7 (37%), 6.1 (15%), and 18.8 ng/m3 (47%) to the PM1, PM1–2.5, and PM2.5–10, respectively. The levoglucosan was mostly distributed in the coarse fraction and then in the fine fraction.
The levoglucosan exhibited bimodal distribution peaking at the fine and coarse PM fractions. The levoglucosan was better correlated with K+ in the fine fraction than in the other fractions. The levoglucosan in the fine fraction can also be influenced by the lignite (coal) combustion, but lesser during summer (Yan et al., 2018). The contributions of biomass burning were more evident in the fine and coarse fractions. The biomass burning particles are generally larger than the particles released during fossil fuel combustion. The bimodal levoglucosan distribution suggested the significant biomass burning contributions (particularly agricultural residue burning) to the fine and coarse fractions during early summer (Wang et al., 2009; Ari et al., 2020).
The glucose, fructose, arabitol, and mannitol indicate the primary biogenic sources, such as vegetation, plant fragments, bacteria and viruses, lichens, vegetative detritus, and fungal spores (Yttri et al., 2007; Theodosi et al., 2018).
The glucose distribution was 3.0 (7%), 11.6 (27%), and 28.4 ng/m3 (66%) to the PM1, PM1–2.5, and PM2.5–10, respectively. The fructose distribution was 1.0 (8%) and 11.4 ng/m3 (92%) to the PM1–2.5 and PM2.5–10, respectively. The arabitol distribution was 3.3 (13%) and 20.9 ng/m3 (87%) to the PM1–2.5 and PM2.5–10, respectively. The mannitol distribution was 9.8 (22%), 5.4 (12%), and 29.4 ng/m3 (66%) to the PM1, PM1–2.5, and PM2.5–10, respectively. The glucose, fructose, and arabitol were mostly distributed in the coarse fraction and then in the intermodal fraction. The mannitol was mostly distributed in the coarse fraction and then in the fine fraction.
The glucose, fructose, and arabitol exhibited unimodal distribution peaking at the coarse fraction, as increased with the increasing PM size. The mannitol exhibited bimodal distribution peaking at the fine and coarse PM fractions. The glucose, fructose, arabitol, and mannitol were better correlated in the coarse fraction. The glucose and fructose refer to the vegetation, plant fragments, and lichens (Jia and Fraser, 2011). The arabitol and mannitol refer to the fungal sources, bacteria and viruses, and decomposed vegetation detritus (Bauer et al., 2008). The primary biogenic sources contributed mostly to the coarse fraction and then to the intermodal fraction. The primary biogenic saccharides are also released during biomass burning, as they are significant constituents of biomass. The unimodal distribution of glucose, fructose, and arabitol suggested the increasing primary biogenic contributions with the increasing PM size. The bimodal mannitol distribution revealed more fungal contributions in the coarse fraction, whereas there were bacteria, viruses, and decomposed vegetation detritus in addition to fungal sources in the fine fraction (Burshtein et al., 2011; Li et al., 2016).
The fraction-wise PM’s important characteristic ratios were investigated, and their statistical summary is presented in Table 2. The statistical summary of size-wise PM’s characteristic ratios is presented in Supplementary Table 2. The PM1/PM10, PM1–2.5/PM10, and PM2.5–10/PM10 ratios are described in the previous mass concentrations section. The OC/EC, SOC/OC, AE/CE, NO3–/SO42–, K+/EC, and levoglucosan/K+ ratios are discussed below.
The OC/EC ratio is usually employed to determine the sources of carbonaceous aerosols. The OC/EC ratios ranging 0.7–2.4 indicate the traffic emissions, 0.3–7.6 indicate the coal combustion, and 4.1–14.5 refer to the biomass burning (Watson et al., 2001; Sandrini et al., 2014). Moreover, the OC/EC ratios greater than 2.00 indicate the secondary OM presence (Chow et al., 1996). The OC/EC ratio’s temporal trends are presented in Supplementary Figure 10. The average OC/EC ratios were 2.81, 2.74, and 3.66 for the PM1, PM1–2.5, and PM2.5–10, respectively. The lower OC/EC ratios in the fine and intermodal fractions suggested more fossil fuel (coal combustion and traffic emissions) contributions to the fine and intermodal fractions, whereas the biomass burning contributions were more evident in the coarse fraction.
The OC is further made up of the primary OC (POC) and the secondary OC (SOC). The POC is released during the primary combustion and biogenic processes, whereas the SOC formation originates from the photochemical phenomena leading to secondary organic particles (Lim and Turpin, 2002). Equation 3 was employed for the SOC estimation (Turpin and Huntzicker, 1995; Castro et al., 1999).
Where (OC/EC)pri) is the primary lowest OC/EC ratio observed during the sampling period. The estimated SOC was then used for the SOC/OC ratio to assess the SOC’s contribution to the OC. The SOC/OC ratio’s temporal trends are presented in Supplementary Figure 11. The average SOC/OC ratios were 0.44, 0.90, and 0.62 for the PM1, PM1–2.5, and PM2.5–10, respectively. The SOC contribution to OC was more evident in the intermodal fraction than in the other fractions.
The PM’s ions balance influences the toxicity, morphology, and heterogeneous reactions. The ions balance was calculated by the anion equivalent (AE) and cation equivalent (CE), where AE and CE were estimated by Equations 4, 5 (Tao et al., 2013; Shi et al., 2017).
The AE/CE ratios above 1.00 suggest the acidic state and below 1.00 suggest the alkaline state of the PM. The AE/CE ratio’s temporal trends are presented in Supplementary Figure 12. The average AE/CE ratios were 0.53, 1.00, and 0.68 for the PM1, PM1–2.5, and PM2.5–10, respectively. The higher AE/CE ratio in the intermodal fraction than in the other fractions suggested more anion-rich and acidic contributions to the intermodal fraction, whereas there were more cation-rich and alkaline contributions to the fine and coarse fractions.
The significance of the mobile vs. stationary particulate nitrate and sulfate sources is generally determined by the NO3–/SO42– ratio (Arimoto et al., 1996). The high NO3–/SO42– ratios indicate more contribution from the mobile sources, and the low NO3–/SO42– ratios indicate more contribution from the stationary sources. The NO3–/SO42– ratio’s temporal trends are presented in Supplementary Figure 13. The average NO3–/SO42– ratios were 0.94, 6.58, and 4.17 for the PM1, PM1–2.5, and PM2.5–10, respectively. The higher NO3–/SO42– ratios in the intermodal and coarse fractions than in the fine fraction suggested more mobile and diverse contributions to the intermodal and coarse fractions, whereas there were more stationary and industrial contributions to the fine fraction.
The fossil fuels combustion and biomass burning contributions are generally assessed by the K+/EC ratio. The K+/EC ratios ranging 0.03–0.09 indicate more fossil fuels contribution and 0.2–0.5 indicate more biomass burning contribution (Tao et al., 2016). The K+/EC ratio’s temporal trends are presented in Supplementary Figure 14. The average K+/EC ratios were 0.05, 0.57, and 0.12 for the PM1, PM1–2.5, and PM2.5–10, respectively. The lower K+/EC ratios in the fine fraction suggested more fossil fuel contributions to the fine fraction, whereas the biomass burning contributions were more evident in the intermodal and coarse fractions.
The types of biomass burning sources are generally determined by the levoglucosan/K+ ratio. The lower levoglucosan/K+ ratios suggest the agricultural residue burning, whereas the higher levoglucosan/K+ ratios suggest different types of biomass burning, such as the softwoods and hardwoods burning. The levoglucosan’s emission rate remains the same during both the smoldering and flaming phases, whereas the K+ emission rate is higher in the flaming phase than in the smoldering phase (Urban et al., 2012). The levoglucosan/K+ ratio’s temporal trends are presented in Supplementary Figure 15. The average levoglucosan/K+ ratios were 0.27, 1.24, and 0.33 for the PM1, PM1–2.5, and PM2.5–10, respectively. The lower levoglucosan/K+ ratios in the fine and coarse fractions than in the intermodal fraction suggested more contributions of the agricultural residue burning to the fine and coarse fractions.
This work presents the size distribution and characterization of ambient PM during early summer in Tianjin, China. The size distribution and characterization involved the fraction-wise PM (PM1, PM1–2.5, and PM2.5–10). The fine PM1 constituted 33%, the intermodal PM1–2.5 constituted 20%, and the coarse PM2.5–10 constituted 47% of the ambient PM, on average. The carbonaceous and ionic species exhibited bimodal distribution and were distributed mostly to the fine mass fraction and then to the coarse mass fraction. The elemental species exhibited unimodal distribution and were distributed mostly to the coarse mass fraction. The individual size distributions and contributions of the carbonaceous, ionic, elemental, and saccharide species were categorically explored and investigated.
The mass size distributions of levoglucosan and the levoglucosan/K+ ratio in each size fraction indicated that the different types of biomass burning significantly contributed to both the fine and coarse mode particles. The primary biogenic sources mainly contributed to the coarse size fraction. However, considerable contributions to the fine and intermodal size fractions were observed as indicated by the mass size distributions of glucose, fructose, arabitol, and mannitol. The specific ratios (PM1/PM10, PM1–2.5/PM10, PM2.5–10/PM10, OC/EC, SOC/OC, AE/CE, NO3–/SO42–, K+/EC, and levoglucosan/K+) provide insight into the possible emission sources and formation mechanisms of the ambient aerosol. The anthropogenic sources (combustion processes, traffic emissions, secondary particles, and industrial activities) contributed mostly to the fine fraction and then to the intermodal fraction. The natural sources (primary biogenic, marine salt, mineral dust, and mechanical processes) were most evident in the coarse fraction. This work is a significant addition to the size distribution and characterization studies of the ambient PM involving the fine PM1, intermodal PM1–2.5, and coarse PM2.5–10 fractions.
The raw data supporting the conclusions of this article will be made available by the authors, without undue reservation.
JK: sampling, chemical analyses, data analysis, and manuscript writing. LS: data elaboration and manuscript review. YT: sampling, chemical analyses, data elaboration, manuscript editing, and manuscript review. QD: sampling, chemical analyses, and data analysis. TH: data analysis and manuscript editing. YF: conceptualization, data elaboration, manuscript editing, and manuscript review. All authors contributed to the article and approved the submitted version.
This study was supported by the Tianjin Science and Technology Program (18ZXSZSF00160 and 20JCYBJC01170) and the National Natural Science Foundation of China (32001324 and 32071777).
The authors declare that the research was conducted in the absence of any commercial or financial relationships that could be construed as a potential conflict of interest.
The Supplementary Material for this article can be found online at: https://www.frontiersin.org/articles/10.3389/fenvs.2021.659329/full#supplementary-material
Alvi, M. U., Kistler, M., Shahid, I., Alam, K., Chishtie, F., Mahmud, T., et al. (2020). Composition and source apportionment of saccharides in aerosol particles from an agro-industrial zone in the Indo-Gangetic Plain. Environ. Sci. Pollut. Res. 27, 14124–14137. doi: 10.1007/s11356-020-07905-2
Ari, P. E., Ari, A., Dumanoǧlu, Y., Odabasi, M., and Gaga, E. O. (2020). Organic chemical characterization of size segregated particulate matter samples collected from a thermal power plant area. Environ. Pollut. 262, 114360. doi: 10.1016/j.envpol.2020.114360
Arimoto, R., Duce, R. A., Savoie, D. L., Prospero, J. M., Talbot, R., Cullen, J. D., et al. (1996). Relationships among aerosol constituents from Asia and the North Pacific during PEM-West A. J. Geophys. Res. Atmos. 101, 2011–2023. doi: 10.1029/95jd01071
Bauer, H., Claeys, M., Vermeylen, R., Schueller, E., Weinke, G., Berger, A., et al. (2008). Arabitol and mannitol as tracers for the quantification of airborne fungal spores. Atmos. Environ. 42, 588–593. doi: 10.1016/j.atmosenv.2007.10.013
Burshtein, N., Lang-Yona, N., and Rudich, Y. (2011). Ergosterol, arabitol and mannitol as tracers for biogenic aerosols in the eastern Mediterranean. Atmos. Chem. Phys. 11, 829–839. doi: 10.5194/acp-11-829-2011
Castro, L. M., Pio, C. A., Harrison, R. M., and Smith, D. J. T. (1999). Carbonaceous aerosol in urban and rural European atmospheres: estimation of secondary organic carbon concentrations. Atmos. Environ. 33, 2771–2781. doi: 10.1016/s1352-2310(98)00331-8
Cesari, D., Merico, E., Dinoi, A., Gambaro, A., Morabito, E., Gregoris, E., et al. (2020). An inter-comparison of size segregated carbonaceous aerosol collected by low-volume impactor in the port-cities of Venice (Italy) and Rijeka (Croatia). Atmos. Pollut. Res. 11, 1705–1714. doi: 10.1016/j.apr.2020.06.027
Cheng, Y., Lee, S., Gu, Z., Ho, K., Zhang, Y., Huang, Y., et al. (2015). PM2.5 and PM10–2.5 chemical composition and source apportionment near a Hong Kong roadway. Particuology 18, 96–104. doi: 10.1016/j.partic.2013.10.003
Chow, J. C., Watson, J. G., Lu, Z., Lowenthal, D. H., Frazier, C. A., Solomon, P. A., et al. (1996). Descriptive analysis of PM2.5 and PM10 at regionally representative locations during SJVAQS/AUSPEX. Atmos. Environ. 30, 2079–2112. doi: 10.1016/1352-2310(95)00402-5
Dai, Q., Bi, X., Huangfu, Y., Yang, J., Li, T., Khan, J. Z., et al. (2019). A size-resolved chemical mass balance (SR-CMB) approach for source apportionment of ambient particulate matter by single element analysis. Atmos. Environ. 197, 45–52. doi: 10.1016/j.atmosenv.2018.10.026
Dai, Q., Bi, X., Liu, B., Li, L., Ding, J., Song, W., et al. (2018). Chemical nature of PM2.5 and PM10 in Xi’an, China: Insights into primary emissions and secondary particle formation. Environ. Pollut. 240, 155–166. doi: 10.1016/j.envpol.2018.04.111
Graham, B., Guyon, P., Maenhaut, W., Taylor, P. E., Ebert, M., Matthias-Maser, S., et al. (2003). Composition and diurnal variability of the natural Amazonian aerosol. J. Geophys. Res. Atmos. 108, .1–.5. ∗AAC5.1–AAC5.16,Google Scholar
Hopke, P. K., Dai, Q., Li, L., and Feng, Y. (2020). Global review of recent source apportionments for airborne particulate matter. Sci. Total Environ. 740, 140091. doi: 10.1016/j.scitotenv.2020.140091
Huang, X., Qiu, R., Chan, C. K., and Kant, P. R. (2011). Evidence of high PM2.5 strong acidity in ammonia-rich atmosphere of Guangzhou, China: transition in pathways of ambient ammonia to form aerosol ammonium at [NH4+]/[SO42–]= 1.5. Atmos. Res. 99, 488–495. doi: 10.1016/j.atmosres.2010.11.021
Iinuma, Y., Engling, G., Puxbaum, H., and Herrmann, H. (2009). A highly resolved anion-exchange chromatographic method for determination of saccharidic tracers for biomass combustion and primary bio-particles in atmospheric aerosol. Atmos. Environ. 43, 1367–1371. doi: 10.1016/j.atmosenv.2008.11.020
Jain, S., Sharma, S. K., Vijayan, N., and Mandal, T. K. (2020). Seasonal characteristics of aerosols (PM2.5 and PM10) and their source apportionment using PMF: A four year study over Delhi. India. Environ. Pollut. 262, 114337. doi: 10.1016/j.envpol.2020.114337
Jia, Y., and Fraser, M. (2011). Characterization of saccharides in size-fractionated ambient particulate matter and aerosol sources: The contribution of primary biological aerosol particles (PBAPs) and soil to ambient particulate matter. Environ. Sci. Technol. 45, 930–936. doi: 10.1021/es103104e
Kawamura, K., Narukawa, M., Li, S. M., and Barrie, L. A. (2007). Size distributions of dicarboxylic acids and inorganic ions in atmospheric aerosols collected during polar sunrise in the Canadian high Arctic. J. Geophys. Res. Atmos. 112, D10307.
Keywood, M., Hibberd, M. F., Selleck, P. W., Desservettaz, M., Cohen, D. D., Stelcer, E., et al. (2020). Sources of Particulate Matter in the Hunter Valley. New South Wales, Australia. Atmosphere 11, 4. doi: 10.3390/atmos11010004
Khan, J. Z., Sun, L., Tian, Y., Shi, G., and Feng, Y. (2021). Chemical characterization and source apportionment of PM1 and PM2.5 in Tianjin, China: Impacts of biomass burning and primary biogenic sources. J. Environ. Sci. 99, 196–209. doi: 10.1016/j.jes.2020.06.027
Kong, S., Han, B., Bai, Z., Chen, L., Shi, J., and Xu, Z. (2010). Receptor modeling of PM2.5, PM10 and TSP in different seasons and long-range transport analysis at a coastal site of Tianjin, China. Sci. Total Environ. 408, 4681–4694. doi: 10.1016/j.scitotenv.2010.06.005
Kozáková, J., Leoni, C., Klán, M., Hovorka, J., Racek, M., Koštejn, M., et al. (2018). Chemical Characterization of PM1–2.5 and its Associations with PM1, PM2.5–10 and Meteorology in Urban and Suburban Environments. Aerosol Air Qual. Res. 18, 1684–1697.
Li, X., Jiang, L., Hoa, L. P., Lyu, Y., Xu, T., Yang, X., et al. (2016). Size distribution of particle-phase sugar and nitrophenol tracers during severe urban haze episodes in Shanghai. Atmos. Environ. 145, 115–127. doi: 10.1016/j.atmosenv.2016.09.030
Liang, X., Huang, T., Lin, S., Wang, J., Mo, J., Gao, H., et al. (2019). Chemical composition and source apportionment of PM1 and PM2.5 in a national coal chemical industrial base of the Golden Energy Triangle. Northwest China. Sci. Total Environ. 659, 188–199. doi: 10.1016/j.scitotenv.2018.12.335
Lim, H. J., and Turpin, B. J. (2002). Origins of primary and secondary organic aerosol in Atlanta: Results of time-resolved measurements during the Atlanta supersite experiment. Environ. Sci. Technol. 36, 4489–4496. doi: 10.1021/es0206487
Liu, B., Sun, X., Zhang, J., Bi, X., Li, Y., Li, L., et al. (2020). Characterization and Spatial Source Apportionments of Ambient PM10 and PM2.5 during the Heating Period in Tian’jin. China. Aerosol Air Qual. Res. 20, 1–13. doi: 10.4209/aaqr.2019.06.0281
Liu, L., Breitner, S., Schneider, A., Cyrys, J., Brüske, I., Franck, U., et al. (2013). Size-fractioned particulate air pollution and cardiovascular emergency room visits in Beijing. China. Environ. Res. 121, 52–63. doi: 10.1016/j.envres.2012.10.009
Martins, V., Faria, T., Diapouli, E., Manousakas, M. I., Eleftheriadis, K., Viana, M., et al. (2020). Relationship between indoor and outdoor size-fractionated particulate matter in urban microenvironments: Levels, chemical composition and sources. Environ. Res. 183, 109203. doi: 10.1016/j.envres.2020.109203
Ocskay, R., Salma, I., Wang, W., and Maenhaut, W. (2006). Characterization and diurnal variation of size-resolved inorganic water-soluble ions at a rural background site. J. Environ. Monit. 8, 300–306. doi: 10.1039/b513915e
Owoade, K. O., Hopke, P. K., Olise, F. S., Adewole, O. O., Ogundele, L. T., and Fawole, O. G. (2016). Source apportionment analyses for fine (PM2.5) and coarse (PM2.5–10) mode particulate matter (PM) measured in an urban area in southwestern Nigeria. Atmos. Pollut. Res. 7, 843–857. doi: 10.1016/j.apr.2016.04.006
Pateraki, S., Asimakopoulos, D. N., Maggos, T., Assimakopoulos, V. D., Bougiatioti, A., Bairachtari, K., et al. (2020). Chemical characterization, sources and potential health risk of PM2.5 and PM1 pollution across the Greater Athens Area. Chemosphere 241, 125026. doi: 10.1016/j.chemosphere.2019.125026
Puxbaum, H., Caseiro, A., Sánchez-Ochoa, A., Kasper-Giebl, A., Claeys, M., Gelencsér, A., et al. (2007). Levoglucosan levels at background sites in Europe for assessing the impact of biomass combustion on the European aerosol background. J. Geophys. Res. Atmos. 112, 1–11.
Rivas, I., Beddows, D. C., Amato, F., Green, D. C., Järvi, L., Hueglin, C., et al. (2020). Source apportionment of particle number size distribution in urban background and traffic stations in four European cities. Environ. Int. 135, 105345. doi: 10.1016/j.envint.2019.105345
Samek, L., Stegowski, Z., Styszko, K., Furman, L., and Fiedor, J. (2018). Seasonal contribution of assessed sources to submicron and fine particulate matter in a Central European urban area. Environ. Pollut. 241, 406–411. doi: 10.1016/j.envpol.2018.05.082
Sandrini, S., Fuzzi, S., Piazzalunga, A., Prati, P., Bonasoni, P., Cavalli, F., et al. (2014). Spatial and seasonal variability of carbonaceous aerosol across Italy. Atmos. Environ. 99, 587–598.
Saraga, D. E., Tolis, E. I., Maggos, T., Vasilakos, C., and Bartzis, J. G. (2019). PM2.5 source apportionment for the port city of Thessaloniki. Greece. Sci. Total Environ. 650, 2337–2354. doi: 10.1016/j.scitotenv.2018.09.250
Shi, G., Xu, J., Peng, X., Xiao, Z., Chen, K., Tian, Y., et al. (2017). pH of aerosols in a polluted atmosphere: source contributions to highly acidic aerosol. Environ. Sci. Technol. 51, 4289–4296. doi: 10.1021/acs.est.6b05736
Simoneit, B. R., Schauer, J. J., Nolte, C. G., Oros, D. R., Elias, V. O., Fraser, M. P., et al. (1999). Levoglucosan, a tracer for cellulose in biomass burning and atmospheric particles. Atmos. Environ. 33, 173–182. doi: 10.1016/s1352-2310(98)00145-9
Tao, J., Zhang, L., Engling, G., Zhang, R., Yang, Y., Cao, J., et al. (2013). Chemical composition of PM2.5 in an urban environment in Chengdu, China: Importance of springtime dust storms and biomass burning. Atmos. Res. 122, 270–283. doi: 10.1016/j.atmosres.2012.11.004
Tao, J., Zhang, L., Zhang, R., Wu, Y., Zhang, Z., Zhang, X., et al. (2016). Uncertainty assessment of source attribution of PM2.5 and its water-soluble organic carbon content using different biomass burning tracers in positive matrix factorization analysis—A case study in Beijing. China. Sci. Total Environ. 543, 326–335. doi: 10.1016/j.scitotenv.2015.11.057
Theodosi, C., Panagiotopoulos, C., Nouara, A., Zarmpas, P., Nicolaou, P., Violaki, K., et al. (2018). Sugars in atmospheric aerosols over the Eastern Mediterranean. Prog. Oceanogr. 163, 70–81. doi: 10.1016/j.pocean.2017.09.001
Tian, Y., Liu, J., Han, S., Shi, X., Shi, G., Xu, H., et al. (2018). Spatial, seasonal and diurnal patterns in physicochemical characteristics and sources of PM2.5 in both inland and coastal regions within a megacity in China. J. Hazard. Mater. 342, 139–149. doi: 10.1016/j.jhazmat.2017.08.015
Tian, Y. Z., Chen, G., Wang, H. T., Huang-Fu, Y. Q., Shi, G. L., Han, B., et al. (2016). Source regional contributions to PM2.5 in a megacity in China using an advanced source regional apportionment method. Chemosphere 147, 256–263. doi: 10.1016/j.chemosphere.2015.12.132
Tian, Y. Z., Chen, J. B., Zhang, L. L., Du, X., Wei, J. J., Fan, H., et al. (2017). Source profiles and contributions of biofuel combustion for PM2.5, PM10 and their compositions, in a city influenced by biofuel stoves. Chemosphere 189, 255–264. doi: 10.1016/j.chemosphere.2017.09.044
Tian, Y. Z., Wang, J., Peng, X., Shi, G. L., and Feng, Y. C. (2014). Estimation of the direct and indirect impacts of fireworks on the physicochemical characteristics of atmospheric PM10 and PM2.5. Atmos. Chem. Phys. 14, 9469–9479. doi: 10.5194/acp-14-9469-2014
Turpin, B. J., and Huntzicker, J. J. (1995). Identification of secondary organic aerosol episodes and quantitation of primary and secondary organic aerosol concentrations during SCAQS. Atmos. Environ. 29, 3527–3544. doi: 10.1016/1352-2310(94)00276-q
Urban, R. C., Lima-Souza, M., Caetano-Silva, L., Queiroz, M. E. C., Nogueira, R. F., Allen, A. G., et al. (2012). Use of levoglucosan, potassium, and water-soluble organic carbon to characterize the origins of biomass-burning aerosols. Atmos. Environ. 61, 562–569. doi: 10.1016/j.atmosenv.2012.07.082
Van Do, T., Vuong, Q. T., and Choi, S. D. (2021). Day–night variation and size distribution of water-soluble inorganic ions in particulate matter in Ulsan. South Korea. Atmos. Res. 247, 105145. doi: 10.1016/j.atmosres.2020.105145
Waked, A., Favez, O., Alleman, L. Y., Piot, C., Petit, J. E., Delaunay, T., et al. (2014). Source apportionment of PM10 in a north-western Europe regional urban background site (Lens, France) using positive matrix factorization and including primary biogenic emissions. Atmos. Chem. Phys. 14, 3325–3346. doi: 10.5194/acp-14-3325-2014
Wang, G., Kawamura, K., Xie, M., Hu, S., Cao, J., An, Z., et al. (2009). Organic molecular compositions and size distributions of Chinese summer and autumn aerosols from Nanjing: characteristic haze event caused by wheat straw burning. Environ. Sci. Technol. 43, 6493–6499. doi: 10.1021/es803086g
Wang, J., Zhang, J. S., Liu, Z. J., Wu, J. H., Zhang, Y. F., Han, S. Q., et al. (2017). Characterization of chemical compositions in size-segregated atmospheric particles during severe haze episodes in three mega-cities of China. Atmos. Res. 187, 138–146. doi: 10.1016/j.atmosres.2016.12.004
Watson, J. G., Chow, J. C., and Houck, J. E. (2001). PM2.5 chemical source profiles for vehicle exhaust, vegetative burning, geological material, and coal burning in Northwestern Colorado during 1995. Chemosphere 43, 1141–1151. doi: 10.1016/s0045-6535(00)00171-5
Wu, Y. S., Fang, G. C., Lee, W. J., Lee, J. F., Chang, C. C., and Lee, C. Z. (2007). A review of atmospheric fine particulate matter and its associated trace metal pollutants in Asian countries during the period 1995–2005. J. Hazard. Mater. 143, 511–515. doi: 10.1016/j.jhazmat.2006.09.066
Xu, H., Xiao, Z., Chen, K., Tang, M., Zheng, N., Li, P., et al. (2019). Spatial and temporal distribution, chemical characteristics, and sources of ambient particulate matter in the Beijing-Tianjin-Hebei region. Sci. Total Environ. 658, 280–293. doi: 10.1016/j.scitotenv.2018.12.164
Yan, C., Zheng, M., Sullivan, A. P., Shen, G., Chen, Y., Wang, S., et al. (2018). Residential coal combustion as a source of levoglucosan in China. Environ. Sci. Technol. 52, 1665–1674. doi: 10.1021/acs.est.7b05858
Yttri, K. E., Dye, C., and Kiss, G. (2007). Ambient aerosol concentrations of sugars and sugar-alcohols at four different sites in Norway. Atmos. Chem. Phys. 7, 4267–4279. doi: 10.5194/acp-7-4267-2007
Zalakeviciute, R., Rybarczyk, Y., Granda-Albuja, M. G., Suarez, M. V. D., and Alexandrino, K. (2020). Chemical characterization of urban PM10 in the Tropical Andes. Atmos. Pollut. Res. 11, 343–356. doi: 10.1016/j.apr.2019.11.007
Keywords: particulate matter, chemical composition, size distribution, size characterization, Tianjin
Citation: Khan JZ, Sun L, Tian Y, Dai Q, Hu T and Feng Y (2021) Size Distribution of Ambient Particulate Matter and Its Constituent Chemical Species Involving Saccharides During Early Summer in a Chinese Megacity. Front. Environ. Sci. 9:659329. doi: 10.3389/fenvs.2021.659329
Received: 27 January 2021; Accepted: 04 March 2021;
Published: 29 April 2021.
Edited by:
Manousos-Ioannis Manousakas, Paul Scherrer Institut (PSI), SwitzerlandReviewed by:
Imran Shahid, Qatar University, QatarCopyright © 2021 Khan, Sun, Tian, Dai, Hu and Feng. This is an open-access article distributed under the terms of the Creative Commons Attribution License (CC BY). The use, distribution or reproduction in other forums is permitted, provided the original author(s) and the copyright owner(s) are credited and that the original publication in this journal is cited, in accordance with accepted academic practice. No use, distribution or reproduction is permitted which does not comply with these terms.
*Correspondence: Long Sun, c3VubG9uZzM2NUAxMjYuY29t; Yingze Tian, dGlhbnlpbmd6ZUBob3RtYWlsLmNvbQ==
Disclaimer: All claims expressed in this article are solely those of the authors and do not necessarily represent those of their affiliated organizations, or those of the publisher, the editors and the reviewers. Any product that may be evaluated in this article or claim that may be made by its manufacturer is not guaranteed or endorsed by the publisher.
Research integrity at Frontiers
Learn more about the work of our research integrity team to safeguard the quality of each article we publish.