
95% of researchers rate our articles as excellent or good
Learn more about the work of our research integrity team to safeguard the quality of each article we publish.
Find out more
ORIGINAL RESEARCH article
Front. Environ. Sci. , 22 April 2021
Sec. Atmosphere and Climate
Volume 9 - 2021 | https://doi.org/10.3389/fenvs.2021.657764
This article is part of the Research Topic Frontiers in Environmental Science – Editor’s Picks 2021 View all 25 articles
 Dejanira Ferreira Braz1*
 Tércio Ambrizzi1*
 Rosmeri Porfírio da Rocha1*
 Iago Algarra2*
 Raquel Nieto2*
 Luis Gimeno2*
Given the crucial role of low-level circulation in convective events, this study presents a climatological characterization of the moisture sources and sinks associated with the occurrence of nocturnal low-level jets (NLLJs) in South America. Six selected NLLJ cores are identified according to the jet index that considers a vertical wind speed shear of the lower troposphere at 00:00 local time (LT). The Lagrangian FLEXible PARTicle (FLEXPART) model was used to provide the outputs for tracking atmospheric air masses to determine the moisture sources and sinks for the NLLJ cores (Argentina, Venezuela, and the regions of Brazil: south—Brazil-S, southeast—Brazil-SE, north—Brazil-N, and northeast—Brazil-NE). The analysis is based on 37 years (1980–2016) of the ERA-Interim reanalysis. We found that the NLLJ index is stronger in the warm periods of a year (austral spring and summer) for the six selected regions. The NLLJ frequency is also higher in the warm months of the year, except in Brazil-NE where it is very frequent in all months. In Brazil-NE, the NLLJ also persists for 8 or more days, while the other NLLJs frequently persist for 1–2 days. The NLLJs occupy a broad low-level layer (from 1000 to 700 hPa) and exhibit a mean speed between 7 and 12 ms–1, which peaks mostly at 900 hPa. The moisture transport for each NLLJ shows that in addition to the intense local moisture sources, the NLLJs in Argentina and Brazil-S receive moisture from the tropical-subtropical South Atlantic Ocean and the Amazon basin, while the tropical-subtropical South Atlantic Ocean is the main moisture source for the NLLJ in Brazil-SE. Both moisture sources and sinks are stronger in the austral summer and fall. The NLLJ in Brazil receives moisture from the tropical South Atlantic (TSA) Ocean, which has weak seasonality. The moisture sources for the NLLJs in Brazil-N and Venezuela come from the tropical North Atlantic (TNA) Ocean in the austral summer and fall, while the TSA Ocean appears as an additional moisture source in the austral winter. This research contributes to improving our understanding of the NLLJs and their role in transporting moisture and controlling precipitation over the continent according to the seasons of a year, helping to improve seasonal climate forecasting.
A nocturnal low-level jet (NLLJ) is defined as a maximum of wind velocity in the first few kilometers of lower troposphere occurring at nighttime (Means, 1952). NLLJ is classified as an intense airflow observed in several regions of the globe, presenting sub-synoptic dimensions and a vertical depth from 0.5 to 0.9 km (Bluestein, 1992).
The dynamics of NLLJs have been described by various theories in the literature. Although each theory attempts to explain some particular characteristics, a single or full theory describing NLLJs has not yet been developed. One of the possible explanations for the NLLJ formation is through the inertial oscillation in the convective planetary boundary layer (PBL) where nocturnal inversion, turbulence, and large wind shear play an important role (Blackadar, 1957). This oscillation results in the nocturnal wind vector rotating around the geostrophic wind vector. According to Stull (1988), other mechanisms that may explain the NLLJ development are the topographic effects (mechanical and thermal) and the effects associated with the heterogeneous surface (sea, land, lakes, forests, plantations, cities, etc.) resulting in thermal gradients (baroclinicity). NLLJs are often observed in continental North America, Australia, Europe, North Africa, South America, and other parts of the globe (Blackadar, 1957; Hoecker, 1963; Bonner, 1968; Parish et al., 1988; Stensrud, 1996; Zhong et al., 1996; Whiteman et al., 1997; Marengo et al., 2004; Song et al., 2005; Vera et al., 2006; Baas et al., 2009; Oliveira et al., 2018; Montini et al., 2019).
Nocturnal low-level jets play an extremely important role by transporting heat and humidity at low levels from the tropics to the poles. In addition, the peak of its cycle occurs at night, with maximum velocities observed between 900 and 850 hPa (Stensrud, 1996). For example, they may be important for the initiation of the deep convection and severe weather phenomena where their strong vertical wind shear can be dangerous for aviation near airports (Newton, 1950; Saulo et al., 2007; dos Santos et al., 2008; Montini et al., 2019).
In South America, NLLJs are responsible for influencing the weather and climate in the whole continent, and they can be observed with greater frequency and intensity in the warmer months of a year (Nicolini et al., 2004; Saulo et al., 2004; Marengo et al., 2004; Vera et al., 2006; Montini et al., 2019). The most studied NLLJ in the continent named South America low-level Jet (SALLJ), occurs on the eastern side of the Andes Mountains occupying a large meridional extension. In general, SALLJs were mostly identified by using Bonner’s (1968) criterion, which is based on a minimum value of wind speed at the level of the jet and vertical speed shear. Using these criteria, Nicolini et al. (2004) identified different types of SALLJs on the east of the Andes Mountains: the Chaco low-level jet (CJE) occurring southward of 25°S; the non-Chaco LLJ (NCJE) acting to the north of 25°S; and the LLJ over the north-west of Argentina (LLJA) and also occurring southward of 25°S. The CJE and LLJA differ in the wind direction and associated synoptic system, with the CJE showing north-northwesterly winds and northeasterly predominating for LLJA.
Rife et al. (2010) proposed a more general intensity index to identify NLLJs considering a vertical shear of wind speed and stronger winds at local nighttime. This index, named as the NLLJ index, does not impose any minimum value for the shear or wind speed, as occurs with Bonner’s (1968) criterion. The fact of not using fixed wind speed thresholds reduces the subjectivity in the identification of NLLJs. Moreover, Rife et al. (2010) base the characterization of NLLJ events on an intensity index. Algarra et al. (2019) have applied this NLLJ index to an ERA-Interim reanalysis in sigma-pressure levels for all the globe for the months of January and July. Specifically, for South America, the NLLJ index was able to identify the nocturnal jets occurring in both months in Maracaibo, Llanos, Guyana, northeastern Brazil (Rio Grande do Norte and Piauí), and also in subtropical latitudes on the east of the Andes Mountains (Algarra et al., 2019).
Most of the studied SALLJs, identified at some points in eastern of Bolivia and Paraguay, is the NCJE, due to its role in transporting moisture from the tropical to subtropical South America (Marengo et al., 2004; Vera et al., 2006; Algarra et al., 2019; Montini et al., 2019). The moisture transport in SALLJ organizes deep convective systems in the form of a mesoscale convective complex and also contributes to the extreme precipitation events associated with cyclones over the La Plata basin (Velasco and Fritsch, 1987; Nicolini and Saulo, 2006; Salio et al., 2007; Cavalcanti et al., 2009; Reboita et al., 2010; Reboita et al., 2015; Carril et al., 2016; De Jesus et al., 2016), giving this region the highest occurrence of thunderstorms in the continent (Morales Rodriguez, 2019). In South America, moisture transport has been studied by using the Eulerian approach, i.e., the vertically integrated moisture flux (Arraut et al., 2012; Satyamurty et al., 2013; Zemp et al., 2014; Montini et al., 2019) or the Lagrangian one that computes the change of moisture following the air particles (Dirmeyer et al., 2009; Durán-Quesada et al., 2010; Van der Ent et al., 2010; Gimeno et al., 2012; Martinez and Dominguez, 2014; Zemp et al., 2014; Algarra et al., 2019).
Given the important control of NLLJ over the weather and climate events, the objective of this study is to obtain a complete seasonal climatology of the NLLJs in South America and their associated moisture sources and sinks. Therefore, we applied the NLLJ index proposed by Rife et al. (2010) to identify the jets and to analyze their characteristics. To obtain the moisture sources and sinks for a 37-year period (1980–2016), the outputs from the Lagrangian FLEXible PARTicle (FLEXPART) model (Stohl and James, 2005) were used. This study is of paramount importance since it will provide guidance for weather forecasting by identifying the regions where NLLJs are more frequent. In addition, the identification of the moisture sources and sinks for each NLLJ can help to understand extreme climate events such as drought or flood.
The study is organized as follows. Section “Data and Methodology” describes the data and methodology for the identification of NLLJ and Lagrangian algorithm for the moisture sources and sinks. Section “Results” discusses a climatology of the NLLJs and associated moisture sources and sinks, while Section “Discussion and Conclusion” presents the main conclusions.
The climatology of NLLJs and associated moisture sources are obtained by using the ERA-Interim reanalysis data set from the European Centre for Weather and Forecasting (ECMWF; Dee et al., 2011). The FLEXPART tracking model uses the ERA-Interim data [three dimensional (3D) wind components and specific humidity] interpolated for a horizontal grid with 1° × 1° of latitude by longitude and considers all 61 levels in the vertical available in the reanalysis (from the surface to 0.1 hPa). We identify the NLLJ using ERA-Interim data sets in a horizontal grid with 1.5° × 1.5° longitude by latitude at different pressure levels. For all analyzes, we use the ERA-Interim data for every 6 h [00:00, 06:00, 12:00, and 18:00 Coordinated Universal Time (UTC)] from 1980 to 2016 (37 years). More details on the ECMWF-Interim are available at https://apps.ecmwf.int/datasets/data/interim-full-daily/levtype=sfc/. Montini et al. (2019) discussed the better performance of the ERA-Interim compared with other reanalyzes to represent a vertical structure of the South American low-level jet. In addition, Anselmo et al. (2020) found minor differences between the ERA-Interim and a modern and finer resolution reanalysis (MERRA-2) to reproduce a vertical structure of the low-level jet in the Amazon. They showed that the MERRA-2 low-level jet has a time of occurrence and vertical structure (with maximum wind speeds at 950 hPa) similar to local sounding observations, although it underestimates the wind intensity. These comparisons with local observations indicating reliable features of low-level jets in the ERA-Interim reanalysis motivated its use in the present study.
For NLLJ days we also evaluated the relationship between the moisture sinks and rainfall using rainfall from the ERA-Interim and Climate Prediction Centre (CPC) data set (Xie et al., 2010). For continental areas of the globe, CPC is an intermediary resolution (0.5° × 0.5° of latitude by longitude) analysis of daily rainfall based only on rain gauge observations. It is available at https://psl.noaa.gov/data/gridded/data.cpc.globalprecip.html.
The identification of the NLLJ follows the method proposed by Rife et al. (2010), which checks the time evolution of a vertical structure of horizontal wind (zonal and meridional components, respectively, u and v) according to the expression:
where the subindices 00 and 12 correspond, respectively, to 00:00 (midnight) and 12:00 (noon) local time (LT); L1 and L2 are, respectively, the near-surface (originally 500 m AGL) and middle (originally 4000 m AGL) levels; λ and Φ are two binary numbers that compare, respectively, the time evolution of wind speed and its vertical shear. Lambda is given by:
i.e., λ compares the near-surface wind speed (W) at local midnight and local noon. According to Equation (2), λ = 1 corresponds to the near-surface wind speed at local midnight greater than at local noon, otherwise λ = 0. As lambda, Φ assumes the values 0 or 1 according to the criteria:
i.e., Φ compares the near-surface (L1) and mid-level (L2) wind speeds at local midnight; Φ = 1 requires a near-surface wind velocity greater than that at mid-levels, otherwise Φ = 0. In this way, Φ ensures the existence of a vertical structure of the jet at local midnight.
For the present study, the NLLJ index [Equation (2)] is adapted by using vertical levels in an isobaric vertical coordinate rather than height as proposed by Rife et al. (2010) or the sigma levels as in Algarra et al. (2019). The two pressure levels selected to calculate the NLLJ index are 900 and 650 hPa, corresponding approximately to 1000 and 4000 m above sea level, respectively. These two levels are more appropriate in order to define a vertical structure of the jet at midnight than the other two-level combinations tested over the region (1000–650, 1000–700, 1000–750, 1000–850, 1000–900, 900–850, 900–700, 900–650, 850–650, and 850–700 hPa; not shown). With these combinations, it was possible to verify that the NLLJ cores for the six regions are more evident (more intense) using the levels of 900–650 hPa. In this way, the levels that best represent the NLLJ indices in SA on a spatial scale and speed intensity are 900–650 hPa. The wind components at 00:00 LT are obtained as an average of 00:00 and 06:00 UTC (∼21:00 and 03:00 LT in most parts of the continent), while 12:00 LT is given by an average of 12:00 and 18:00 UTC (∼09:00 and 15:00 LT in most parts of the continent). Using these adaptations, the NLLJ index is calculated for each grid point by using the data from the ERA-Interim in South America, which allows the regions with NLLJ activity to be identified. The application of Equation (2) results in a daily NLLJ index that is used to obtain the seasonal climatology of the NLLJ and the associated moisture sources and sinks for the selected areas with a great frequency of occurrence of NLLJs.
The FLEXPART dispersion model based on a Lagrangian method was developed by Stohl et al. (1995; 1998; Stohl and James, 2005) and has been widely used to identify the moisture sources for many regions and atmospheric systems (Gimeno et al., 2010, 2012, 2013). The method calculates the changes in the water vapor content (i.e., evaporation minus precipitation) for each particle of the air parcels along its trajectory from a source area to a target region, or vice versa, following the parcels forward or backward in time, respectively (Stohl and James, 2004; Sodemann et al., 2008; Sodemann and Stohl, 2009; Gimeno et al., 2010; Drumond et al., 2014; Gimeno et al., 2016; Durán-Quesada et al., 2017). The first step in the FLEXPART moisture screening is to divide the atmosphere into a large number of “particles” (2 million in this experiment) with constant mass homogeneously distributed according to the atmosphere mass distribution. The FLEXPART calculates the trajectories of the particles using a 3D wind field (among other variables and several parameterizations). The variations of the moisture at each point of the trajectory are calculated by considering the changes in the specific humidity (q). For each particle, the net rate of change in water vapor content at each time step (6 h) is calculated as:
(e − p) = m (dq/dt) (4)
where m, the mass of the particle, is a function of the density of the air, which remains constant throughout the simulation, and where e and p represent an increase or a decrease in the rates of moisture, which are seen as evaporation or precipitation, respectively. The difference in (e − p) represents an increase or a decrease in the humidity of each particle along its trajectory. The sum of the values (e − p) for all the tracked particles (k) that reside in a specific atmospheric column (A) is:
where i is the total number of particles in the column, E is the total evaporation, and P is the total precipitation per unit area (A), and the difference (E − P) represents the net surface freshwater flux.
In order to determine the moisture sources for a particular NLLJ region, the particles modeled by FLEXPART are first followed in a backward mode to identify those regions where evaporation is greater than precipitation (E − P) > 0 values. To identify the areas where moisture flux contributes to the precipitation, the moisture sinks [those areas with (E − P) < 0 values] and the particles leaving the NLLJ region were tracked forward. From a global point of view, the choice of using 10 days has been frequently used in the studies of the global water budget. Some studies discuss the ideal time for tracking moisture particles. Läderach and Sodemann (2016), using an offline tracking methodology, obtained a shorter time scale of 4–5 days for the average time of the moisture residence in the atmosphere. van der Ent and Tuinenburg (2017) used a reanalysis and modeling to derive the average global residence time of 8–10 days (that is closer to the classic values for the water vapor residence time in the atmosphere; Numaguti, 1999). The moisture computation results using Lagrangian tracks are susceptible to the time of integration definition. In this way, Nieto and Gimeno (2018, 2019) provided an annual and a monthly database of an optimal integration time for the Lagrangian studies of atmospheric moisture sources and sinks. Therefore, we used for both backward and forward tracking modes the time limitation to the results of the averaged values from Gimeno (2014), Nieto and Gimeno (2018) for all the NLLJ selected regions. Our results related to the sources and sinks of moisture associated with the NLLJ using these times are comparable to those by Algarra et al. (2019).
Composite analysis is a useful technique to understand a particular weather-type event providing the information of a more recurrent atmospheric pattern. The daily time series of the NLLJ index at the center of the NLLJs occurrence regions is separated into days with and without NLLJ for all 37 years (1980–2016). This data allows us to calculate the climatology (seasonality, persistence, vertical profiles, etc.) of the NLLJ events as well as to identify the associated moisture sources and sinks of NLLJs through the FLEXPART model. In addition, we calculate for some variables (precipitation and winds) the composite anomaly, i.e., the difference between the days with and without NLLJ events.
Figure 1 shows the seasonal climatology for the period 1980–2016 of the NLLJ index and the wind at 900 hPa. In all South America and adjacent oceans, the NLLJ index (in velocity units, m/s) is stronger in the warm periods of a year, i.e., austral spring [September–October–November (SON)] and summer [December–January–February (DJF)]. A relatively intense NLLJ index occurs throughout the year over northeastern Brazil and northern Argentina, while in other regions it only intensifies in specific seasons as in northern Brazil in DJF, and Venezuela in DJF-March–April–May (MAM). By comparing the seasons, Figure 1 presents a greater number of cores with an intense NLLJ index in the austral spring-summer. In northeastern Brazil, an intense NLLJ index is associated with climatological easterly low-level winds over the year, while in northern Argentina the winds are mostly from the north-northeast. In the north of Brazil and Venezuela, a more intense NLLJ index occurs and immersed in the climatological northeasterly trade flow. Figures 1A,C resemble that of Rife et al. (2010), but our indices, with a maximum of ∼3.5 m s–1, are weaker (as occurs also in Algarra et al., 2019) than ∼6–8 m s–1 in their study. In Rife et al. (2010), the possibility of a stronger NLLJ index exists because they used finer resolution data (25 km) with high time-frequency (for every 1 h) and only January and July for the climatology.
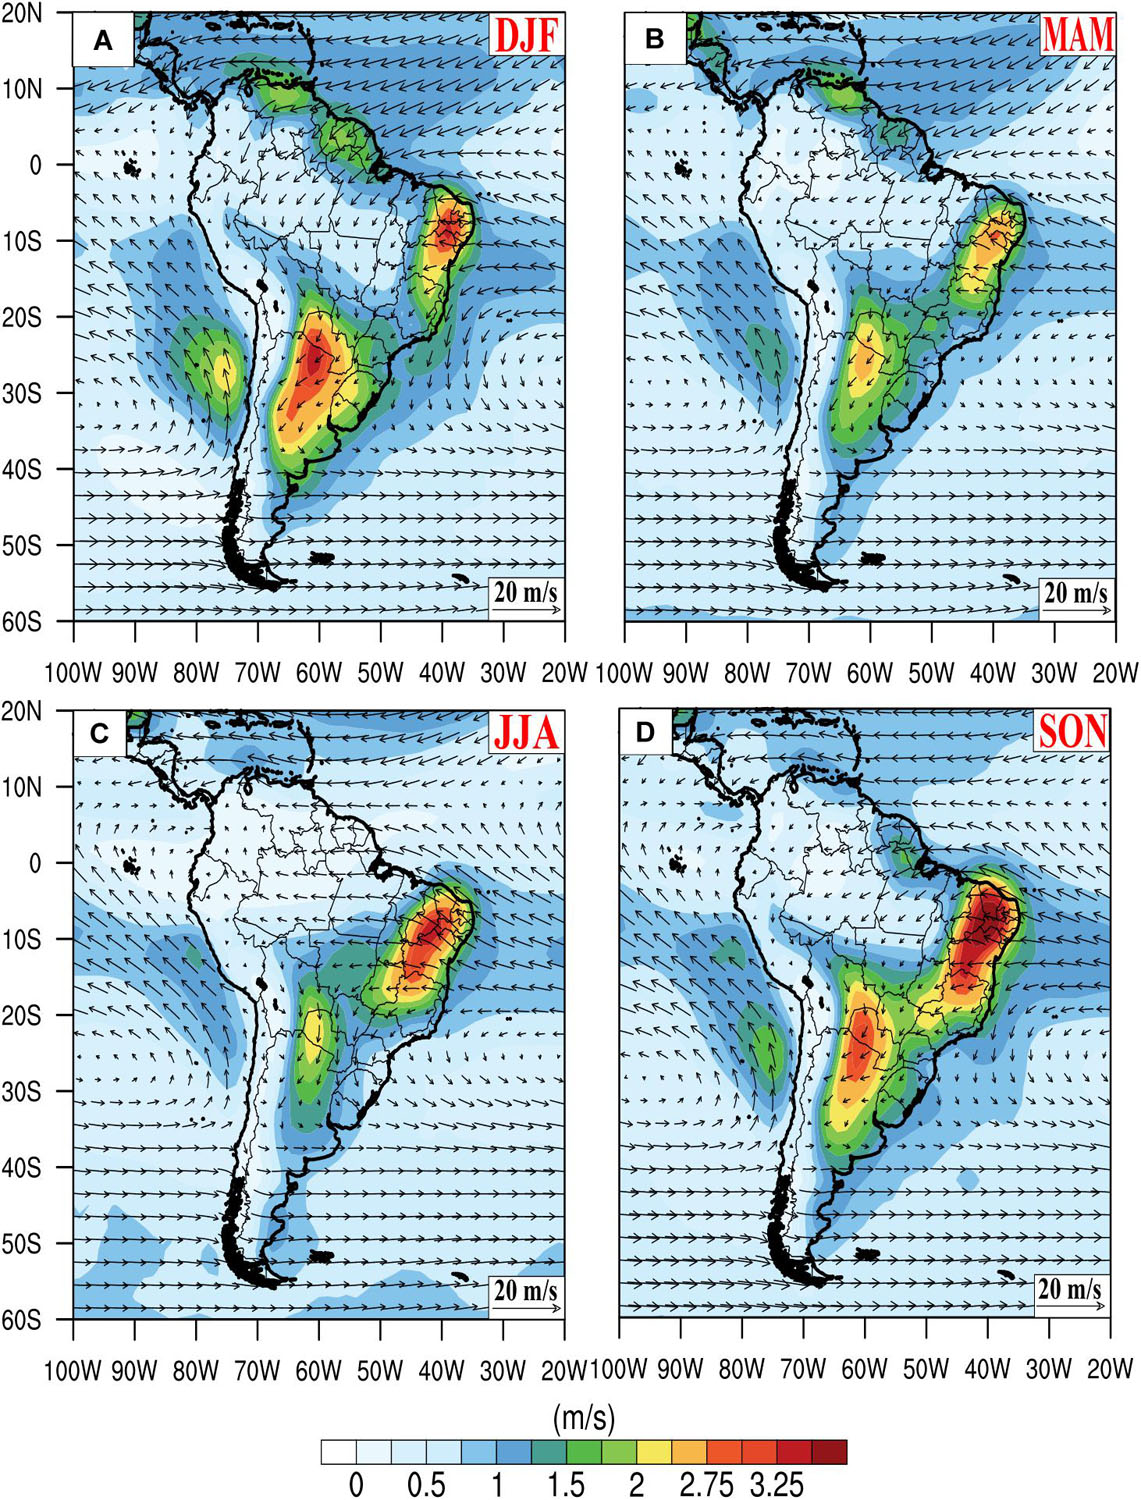
Figure 1. Seasonal climatology (1980–2016) of the nocturnal low-level jet (NLLJ) index (shaded in m s–1), and wind (vectors with scale in the bottom right in m s–1) at 900 hPa for: (A) December–January–February (DJF); (B) March–April–May (MAM); (C) June–July–August (JJA); (D) September–October–November (SON).
The NLLJ index in Figure 1 highlights the seasons with a high frequency of occurrence and secondary regions, such as southeastern Brazil, with an NLLJ, that have not been previously documented using the other criteria or in the specific months of a year (Marengo et al., 2004; Rife et al., 2010; Algarra et al., 2019). This is the case of the NLLJ in northeastern Brazil that is stronger in the austral spring (SON) than in the summer (DJF), as previously reported in the literature (Rife et al., 2010; Algarra et al., 2019). In this season, a relatively intense NLLJ index advances into southeastern Brazil right to western São Paulo and Minas Gerais (∼52°W–20°S; Figure 1D).
An intense NLLJ index east of the Andes Mountains, from Bolivia to northern Argentina, was analyzed previously and received different denominations in terms of a function of the location and its main characteristics (Nicolini et al., 2004; Salio et al., 2007). Considering the Bonner (1968) criterion, Nicolini et al. (2004) classified the low-level jet to the east of the Andes as the CJEs occurring southward of 25°S, the NCJE developing northward of 25°S, and LLJA the low-level Argentina jet. Both CJE and NCJE are associated with the eastern Andes poleward northerly northwesterly flow extending from the equator to the subtropics of South America but differ in the latitude of the jet core; LLJA is characterized by prevailing northeasterly flow occurring in the western sector of a postfrontal anticyclone (Nicolini et al., 2004, 2006).
Considering the classification of Nicolini et al. (2004, 2006), the most studied LLJ east of the Andes (Marengo et al., 2004; Saulo et al., 2007; Oliveira et al., 2018; Jones, 2019; Montini et al., 2019), occurring between 15°S and 25°S in the neighborhood of Santa Cruz de la Sierra (∼18°S, Bolivia), would be classified as NCJE. According to Figure 1, our results provide the most intense NLLJ index core in northern Argentina (∼26°S–61°W), a latitude that characterizes it as LLJ Argentina (LLJA) according to the classification of Nicolini et al. (2004).
The NLLJ index in Figure 1 also presents relatively strong values associated with southerly/southeasterly winds along the western coast of South America over the South Pacific Ocean, with a core of the NLLJ index migrating from the coast of Chile (∼28°S) in the austral summer to the Peruvian (∼12°S) coast in the winter. This intense NLLJ index basically follows the north-south displacement of the subtropical anticyclone and is known as the Peru-Chile coastal low-level jet (Lima et al., 2018). We have not selected this coastal NLLJ for further analysis because we are only interested in understanding the moisture transport for the continental areas.
For each season, Figure 2 presents the relative frequency of the NLLJ index. The NLLJ is more frequent during the austral summer, reaching values from 60% in northern Argentina to above 90% in the northeast-north of South America (Figure 2A). Specifically, over northeastern Brazil, the NLLJ occurs more than 80% of the days in all seasons. In other regions, the frequency of the NLLJ depends on the season of the year: in Venezuela, it is greater in the austral summer-autumn; in north Brazil, the coast of Chile–Peru, northern Argentina–Paraguay in the austral summer. Therefore, in South America, there is a preference for the development of the NLLJs during the warmer months of a year, except in the northeast of Brazil where the frequency is high all year round.
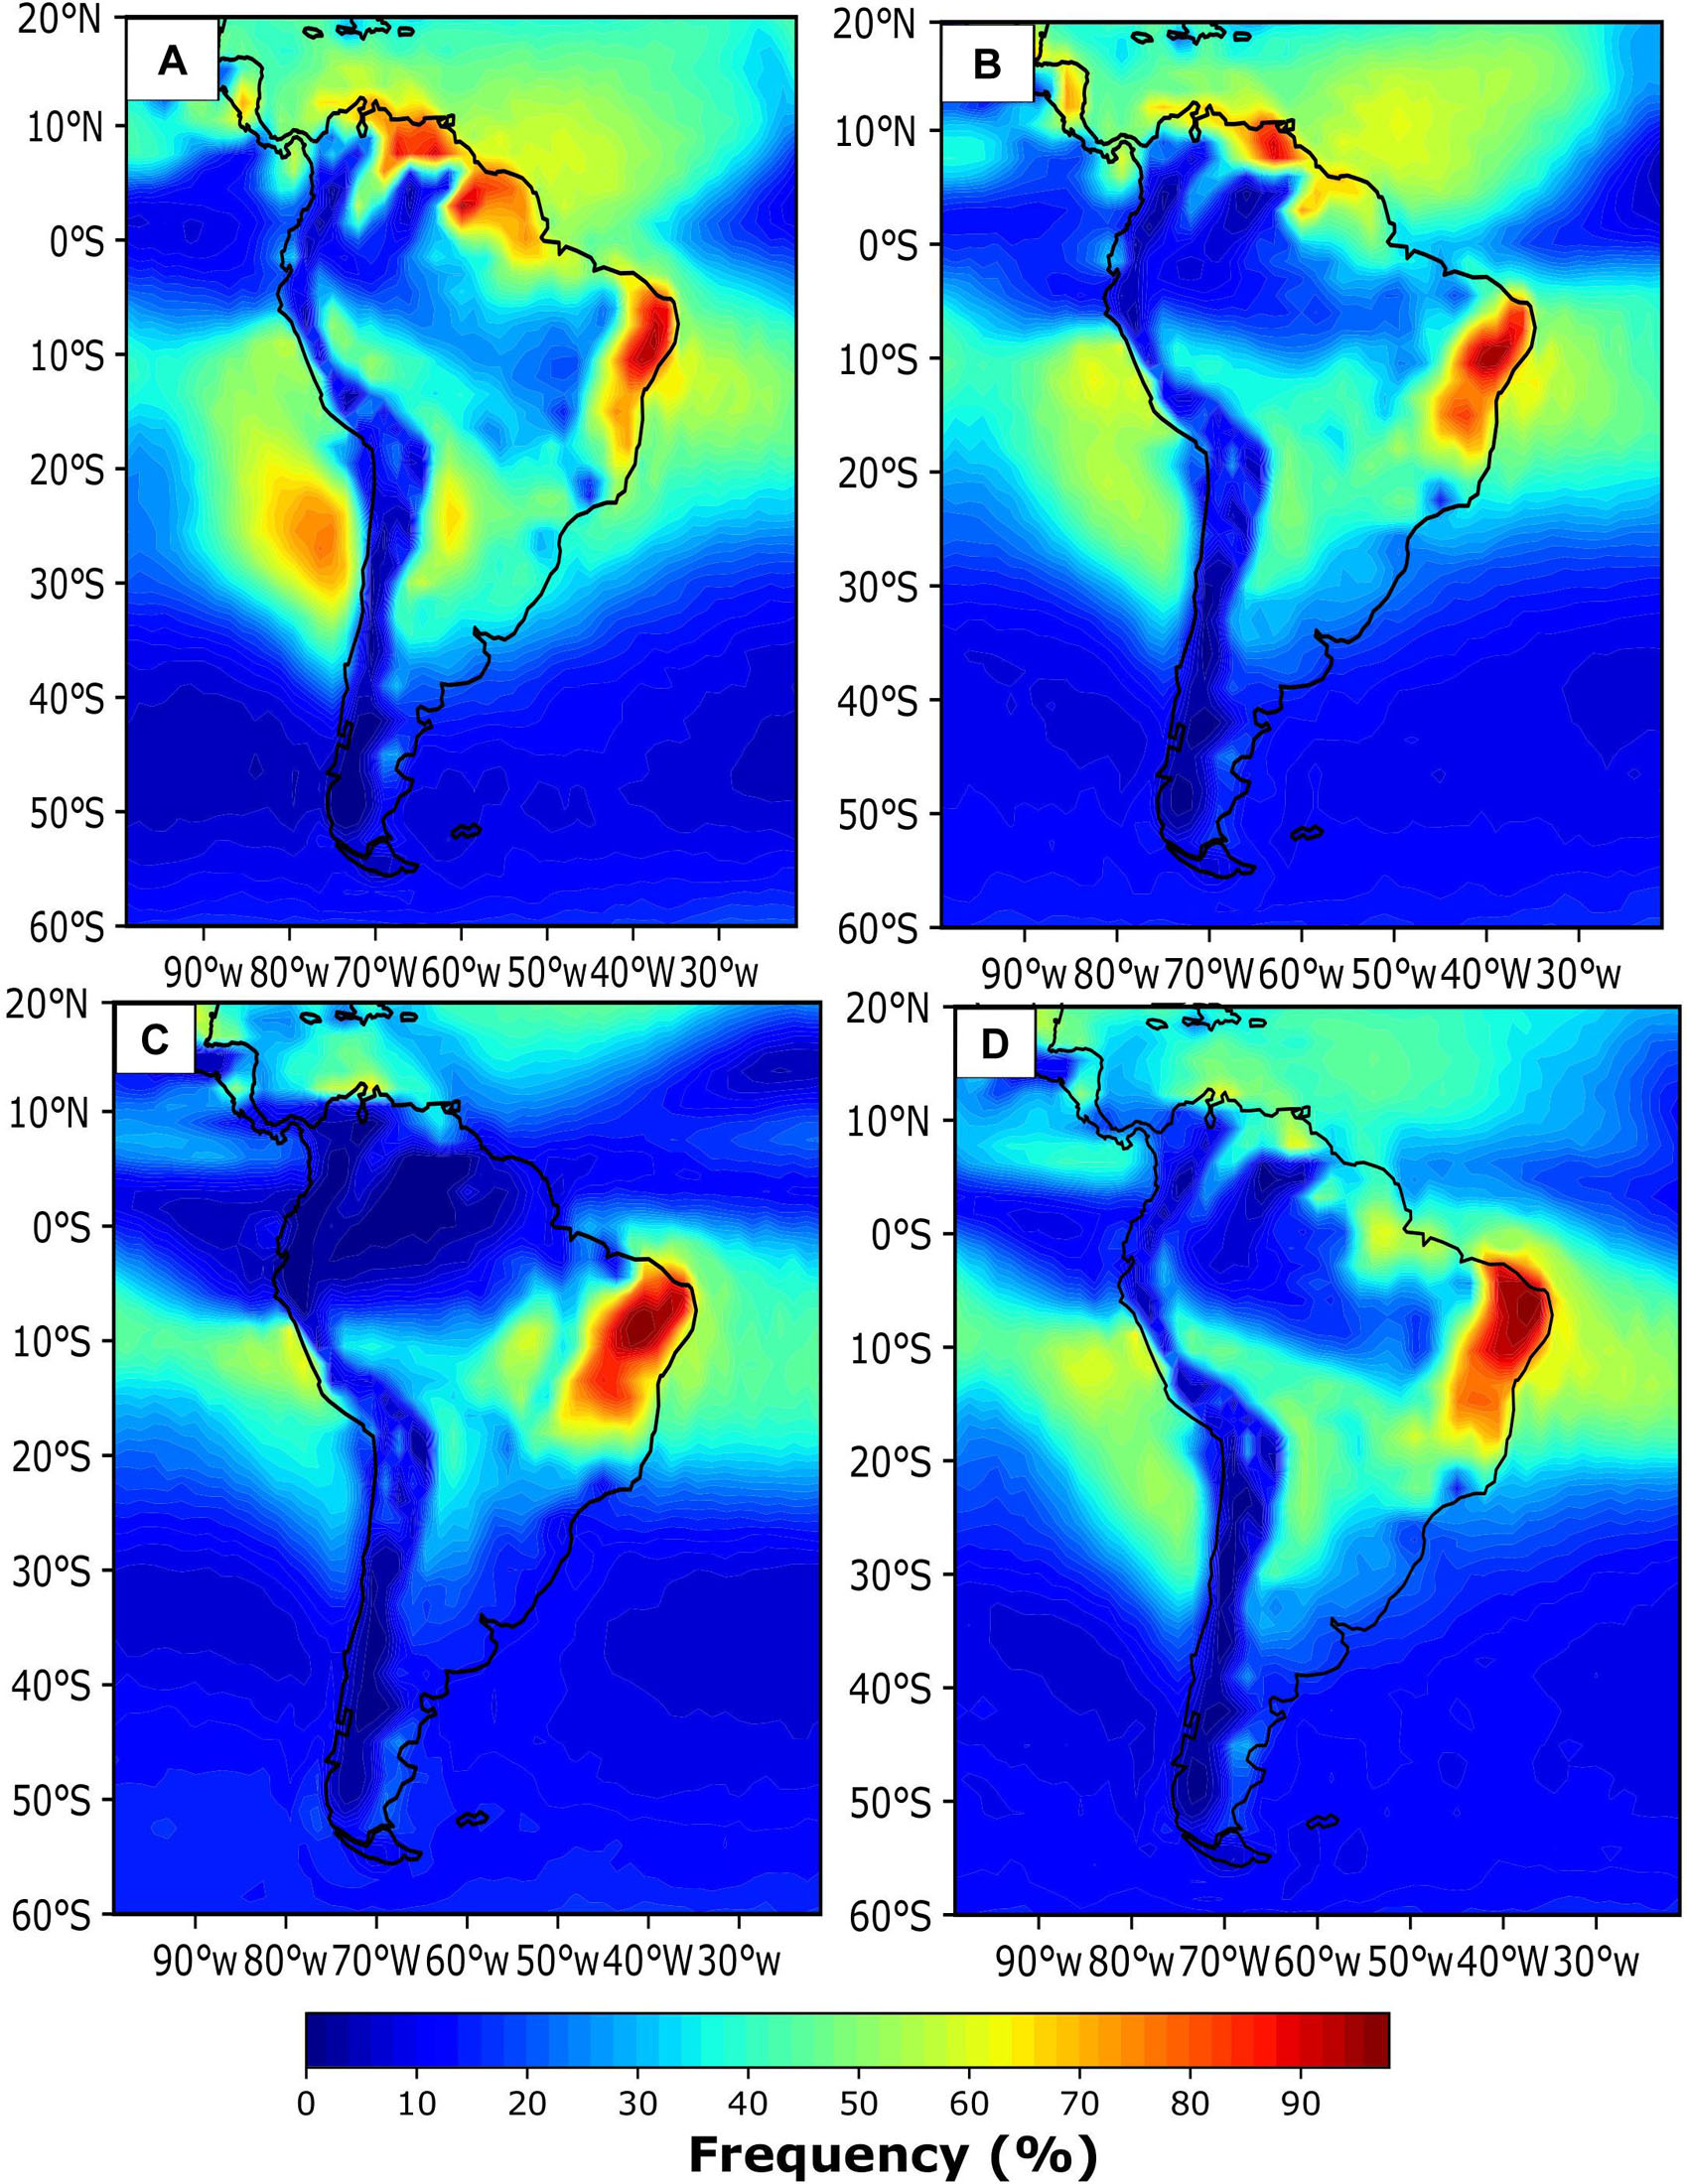
Figure 2. Seasonal climatology (1980–2016) of the relative frequency (% in shaded) of the NLLJ occurrence for: (A) DJF; (B) MAM; (C) JJA; and (D) SON.
Figures 1, 2 allow us to identify the regions of South America in which the NLLJ index is more intense and frequently occurs throughout the year. Based on these two features, Figure 3 shows the four maximum NLLJ cores denominated herein as: Venezuela, Argentina, northeastern Brazil (Brazil-NE), and northern Brazil (Brazil-N). In addition, Figure 3 also presents two secondary NLLJ cores, one over southern Brazil (Brazil-S) and the other over southeastern Brazil (Brazil-SE), due to their importance for the South America austral summer precipitation. They are located at two points of the continent normally associated with the anomalous precipitation in a pattern known as “seesaw” (Doyle and Barros, 2002; Carvalho et al., 2011). The six cores shown in Figure 3 are used to understand the NLLJ climatological features while the surrounding boxes [with 5 by 5 degrees of latitude by longitude, except for Venezuela (5 by 4.5) and Brazil-N (4 by 4) because the areas occupied by these NLLJs are a little smaller] define the areas to calculate the associated moisture sources and sinks through the FLEXPART model.
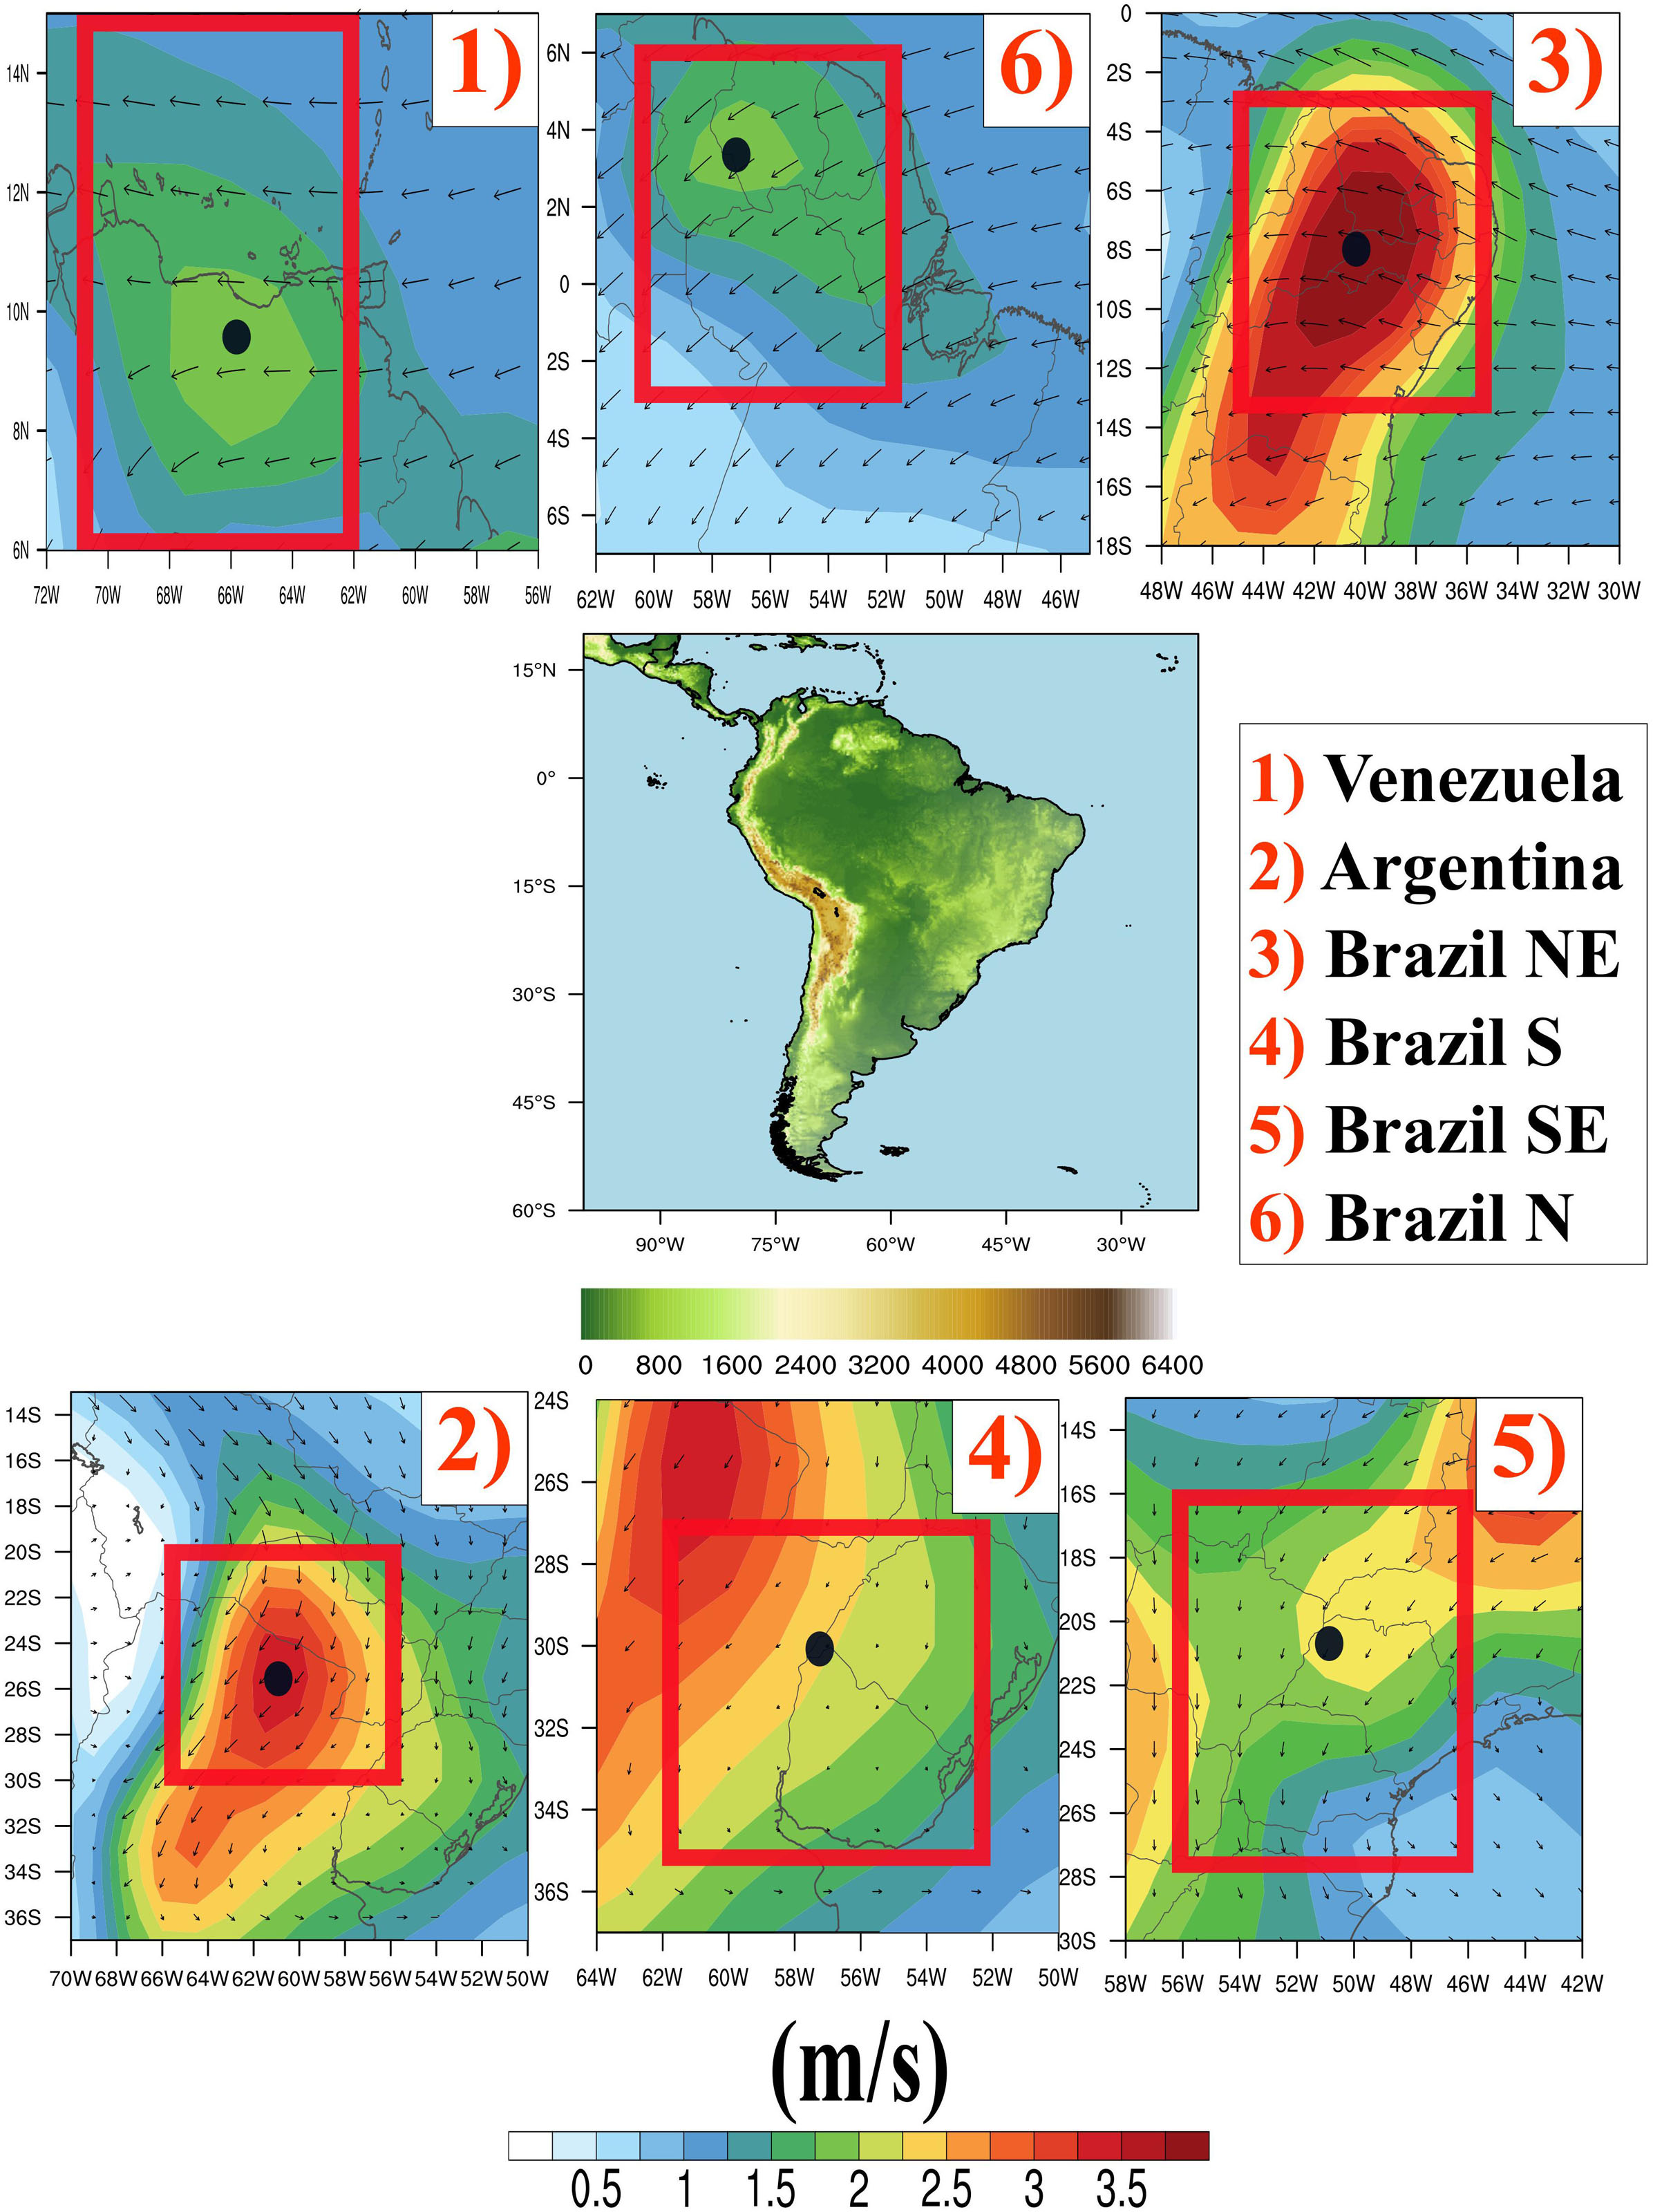
Figure 3. The numbers in the central map identify the locations of the six NLLJ cores for the regions named: (1) Venezuela, (2) Argentina, (3) Brazil-NE (northeastern Brazil), (4) Brazil-S (southern Brazil), (5) Brazil-SE (southeastern Brazil), and (6) Brazil-N (northern Brazil). Central panel includes the topography (in m) of South America. The small panels present the 00:00 local time (LT) mean wind (vectors and in shaded the intensity in m s–1) at 900 hPa for the NLLJ days during DJF for Venezuela, Argentina, Brazil-S, Brazil-N; SON for Brazil-NE and Brazil-S. The black dot in each panel represents the NLLJ center.
The mean annual cycles of the NLLJ frequency in each of the six selected regions of the NLLJ occurrence are shown in Figure 4. Comparing all six regions, the highest NLLJ occurrences throughout the year are registered in Brazil-NE, and from December to April for the NLLJs in Brazil-N and Venezuela. We identify three main patterns of NLLJ mean annual cycles: (a) Venezuela and Brazil-N presenting a stronger seasonality with a very high and low frequency, respectively, in December–April and June–September; (b) Brazil-NE with a small amplitude, i.e., the jet occurs with the similar frequency over the months throughout the year, with a slightly higher (lower) frequency in July–November (February–April); (c) Argentina, Brazil-S, and Brazil-SE with an intermediary amplitude, being slightly more and less frequent, respectively, in the austral summer and winter.
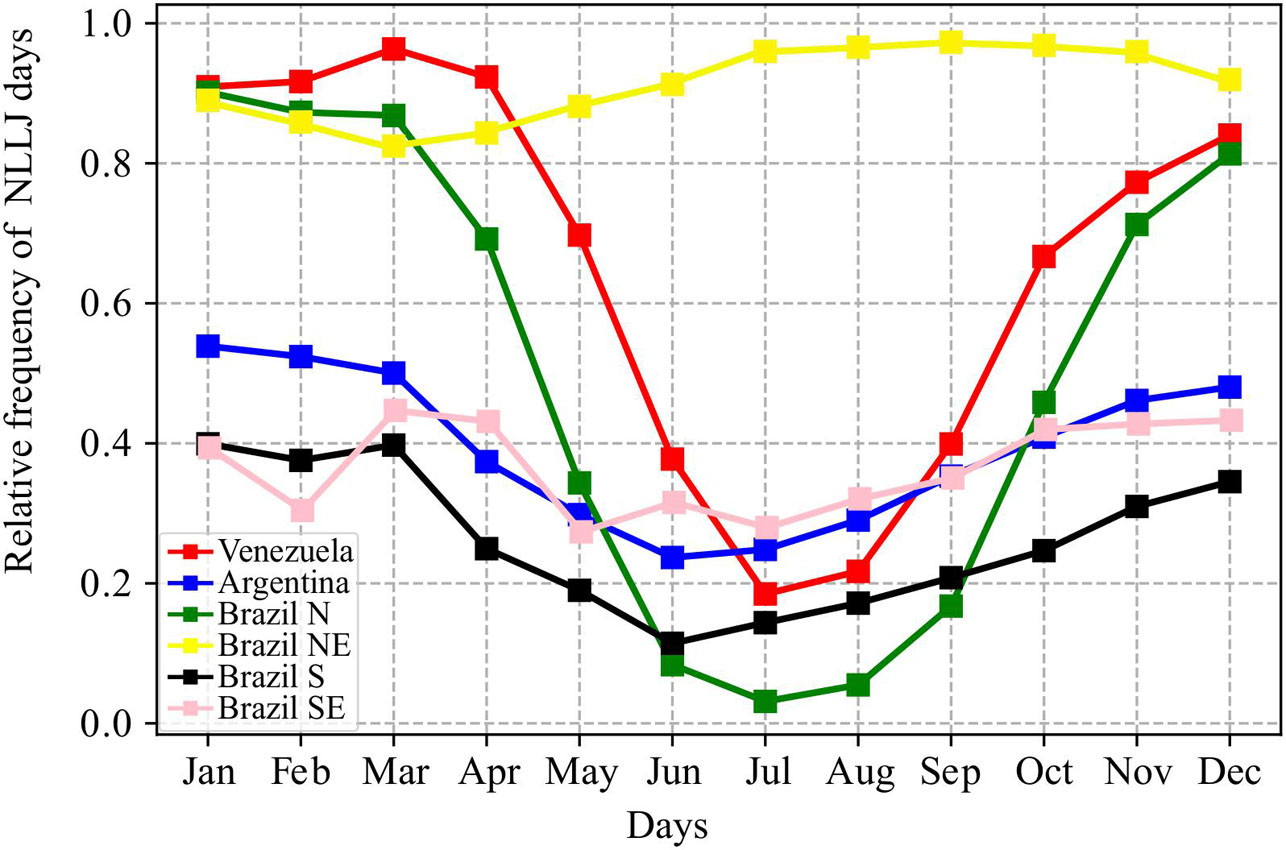
Figure 4. Mean (1980–2016) annual cycle of the relative frequency of the days with the NLLJ in each one of the six core regions: Venezuela, Argentina, Brazil-N, Brazil-NE, Brazil-S, and Brazil-SE.
For each season, the relative frequency of the persistence (number of consecutive days with the NLLJ index) of the NLLJ for the six cores is shown in Figure 5. For most of the seasons and regions, the NLLJ persists for 1–2 days with a greater frequency. One exception occurs in Brazil-NE where the NLLJ is over 8 days with a higher frequency, except in the austral autumn, when the frequency is similar for all classes of persistence. The different behavior of persistence of the NLLJ in Brazil-NE in the autumn may be associated with the establishment of the rainy season and the associated change in the circulation (De Souza et al., 2005). According to Figure 5, the longest persistence of NLLJ is registered for Venezuela in the austral summer-autumn and Brazil-N in the summer (Martin and Schumacher, 2011). This may be associated with the establishment of the intertropical convergence zone in these seasons, with the persistent northeasterly trade winds over the north of SA, including Venezuela and Brazil-N (Poveda et al., 2006, 2014).
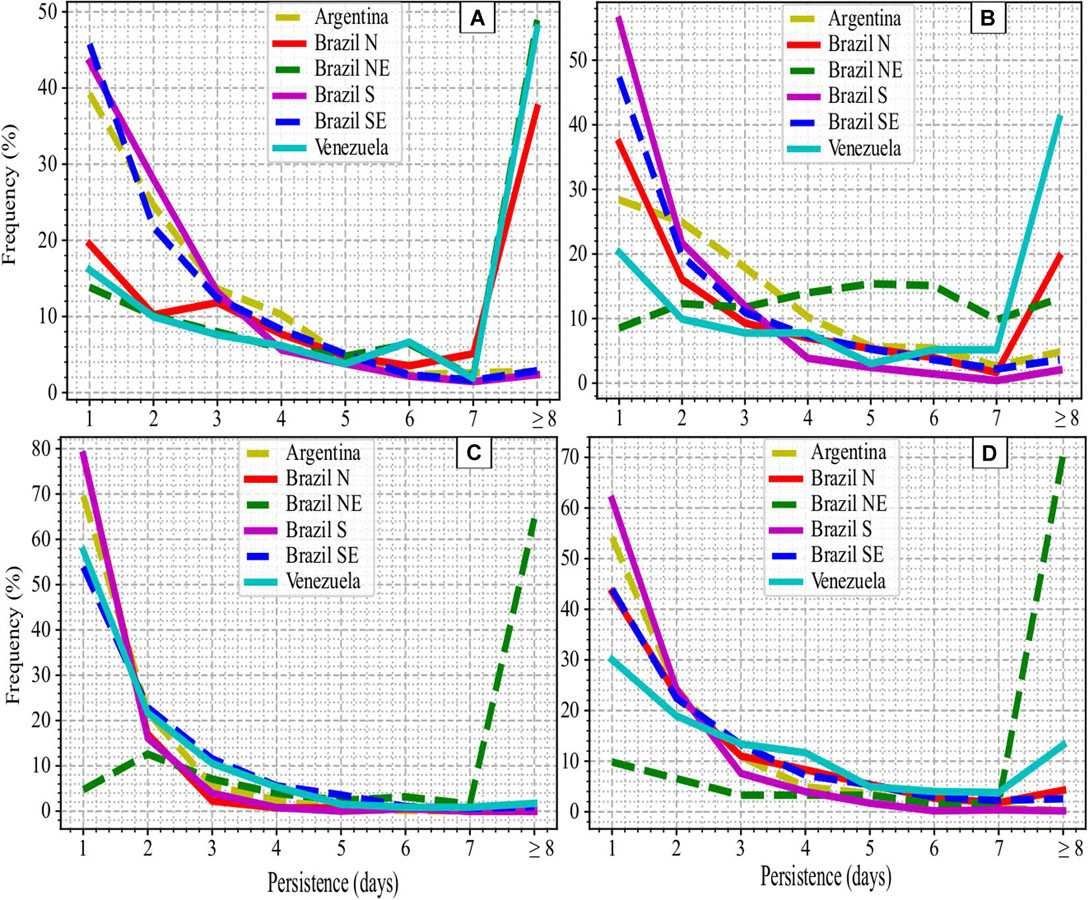
Figure 5. Seasonal climatology (1980–2016) of the relative frequency of the persistence (days) of the NLLJ events for each region for: (A) DJF, (B) MAM, (C) JJA, and (D) SON. The category eight includes values equal to or greater than 8 days.
Figure 5 also shows that over 70% of the NLLJ persists for only 1 day in Argentina and Brazil-S during the austral winter, which may be associated with the postfrontal characteristic of these jets and will be shown in the subsection “Moisture transport associated to NLLJs.”
The NLLJ index in the core of each region (black dotted points in Figure 3) is used to calculate the mean vertical profiles of the wind speed for days with and without NLLJ at 12:00 and 00:00 LT. Figure 6 shows the NLLJs having a broad low-level layer from 1000 to 700 hPa, with a mean speed between 7 m s–1 (Brazil-SE in MAM) and 12 m s–1 (Brazil-NE and Argentina), and mostly peaking at 900 hPa. Exceptions in relation to the level of maximum wind speed occur for the NLLJ in Argentina in June–July–August (JJA) and the NLLJ in Brazil in SON, where it appears at 850 hPa. The most intense NLLJ cores, with a mean wind speed of ∼11–12 m s–1, are observed over Argentina and Brazil-NE during JJA and SON. The stronger jets are also associated with a stronger vertical wind shear above the jet core as already mentioned by Bonner (1968). For the days without NLLJ, some regions in specific seasons (Argentina in SON-DJF, Brazil-NE in JJA-SON) still have a wind speed with a vertical structure similar to a jet, but the vertical wind shear criterion does not allow it to be classified as a jet. For the local midnight (00:00 LT), the mean wind direction at 900 hPa during the NLLJ are from: (a) the east for Venezuela and Brazil-NE; the northeast for Argentina, Brazil-S, and Brazil-N; the north-northeast for Brazil-SE (see insets in Figure 3).
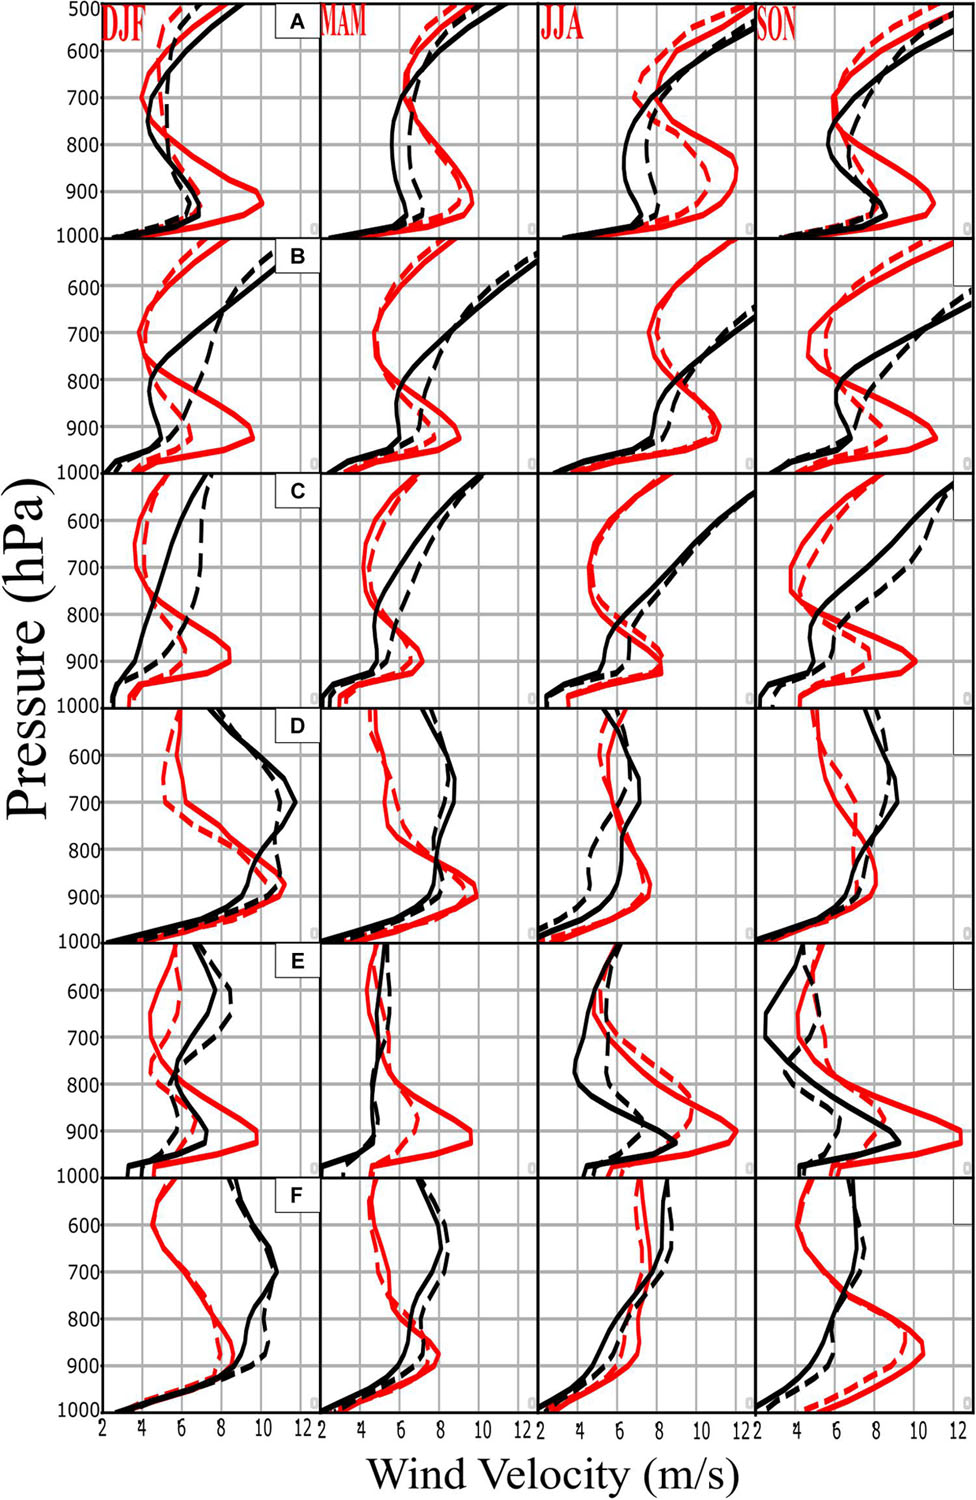
Figure 6. Seasonal climatology (1980–2016) of the vertical profile of wind intensity (m s–1) for the days with (red) and without (black) NLLJ at 00:00 LT (continuous lines) and 12:00 LT (dotted lines) for the regions: (A) Argentina, (B) Brazil-S, (C) Brazil-SE, (D) Brazil-N, (E) Brazil-NE, and (F) Venezuela.
In Rife et al. (2010), the wind velocity and vertical speed shear at 00:00 LT are stronger than those at 12:00 LT, as shown in Figure 6, but, in some regions and seasons, a vertical structure of the jet with relatively intense speeds is still observed at 12:00 LT. The differences in most of the vertical profiles of the wind speed from 00:00 to 12:00 LT make clear the nocturnal mechanism described by Blackadar (1957), i.e., the absence of large eddies leads to a decoupling between the parts of the near-surface layer, resulting in a super geostrophic flow. According to Figure 6, this mechanism is more evident in NLLJs in Argentina, Brazil-S, Brazil-SE, and Brazil-NE than in Brazil-N and Venezuela. As in this study, an LLJ in the Orinoco basin located (9.5°N and 64.2°W) closer to our (jet core) Venezuela point also presents a maximum jet speed at night (∼00:00 LST) between 950 and 800 hPa (Jiménez-Sánchez et al., 2019). For this LLJ, in addition to the mentioned mechanism, Jiménez-Sánchez et al. (2019) also proposed that the wind acceleration is explained by a combination of sea breeze penetration over the Orinoco River delta and Unare, and downsloping winds along the Coastal Cordillera River.
Some differences are found between the NLLJs identified in this study and those previously identified by Bonner (1968) or other criteria. The main difference is the level where the wind speed peaks, which is 900 hPa in the present study and 850 hPa in the other studies (Marengo et al., 2004; Jones, 2019; Montini et al., 2019). Using the ERA-Interim in a sigma vertical coordinate for the global identification of NLLJs, Algarra et al. (2019) found that the NLLJ cores are located from 400 to 700 m above the surface, which is similar to our results.
Previous analysis has argued that the low-level jets carry moisture from the tropical North Atlantic (TNA) and tropical South Atlantic (TSA) Oceans or continental regions, as is the case of the Amazon basin due to strong tropical forest evapotranspiration, to subtropical latitudes of South America (Marengo et al., 2004; Drumond et al., 2008; Knippertz et al., 2013; Landsberg et al., 2014; Durán-Quesada et al., 2012, 2017; Rocha et al., 2017; Algarra et al., 2019).
The Lagrangian FLEXPART tracking are integrated along 10 days, which are close to the mean values of the optimal time of integration for the selected six regions calculated using the annual database for the Lagrangian optimal times of integration available in Nieto and Gimeno (2018, 2019) [for Venezuela and Brazil-S (DJF), Brazil-NE and Brazil-SE (SON) the optimal time results in 10 days, for Argentina (DJF) in 8 days, and for Brazil-N (DJF) in 12 days]. These time integrations agree, for example, with Drumond et al. (2008) that found higher contributions of TSA occurring at least in 8 days (behind) for the La Prata basin, and with the time used in Algarra et al. (2019). Only considering the NLLJ days, the methodology applied in a backward mode allows identifying the moisture source (E − P > 0 values), while a forward integration provides the sinks of moisture sinks (E − P < 0 values). The climatology (1980–2016) of the moisture sources and moisture sinks for each of the selected six regions are shown for DJF and JJA in Figures 7, 8. In the Supplementary Figures 1, 2, we present similar figures for the intermediary seasons MAM and SON. These figures also depict the seasonal composites of the wind at 900 hPa, the most frequent level of maximum speed for the NLLJ days at 00:00 LT (see Figure 5).
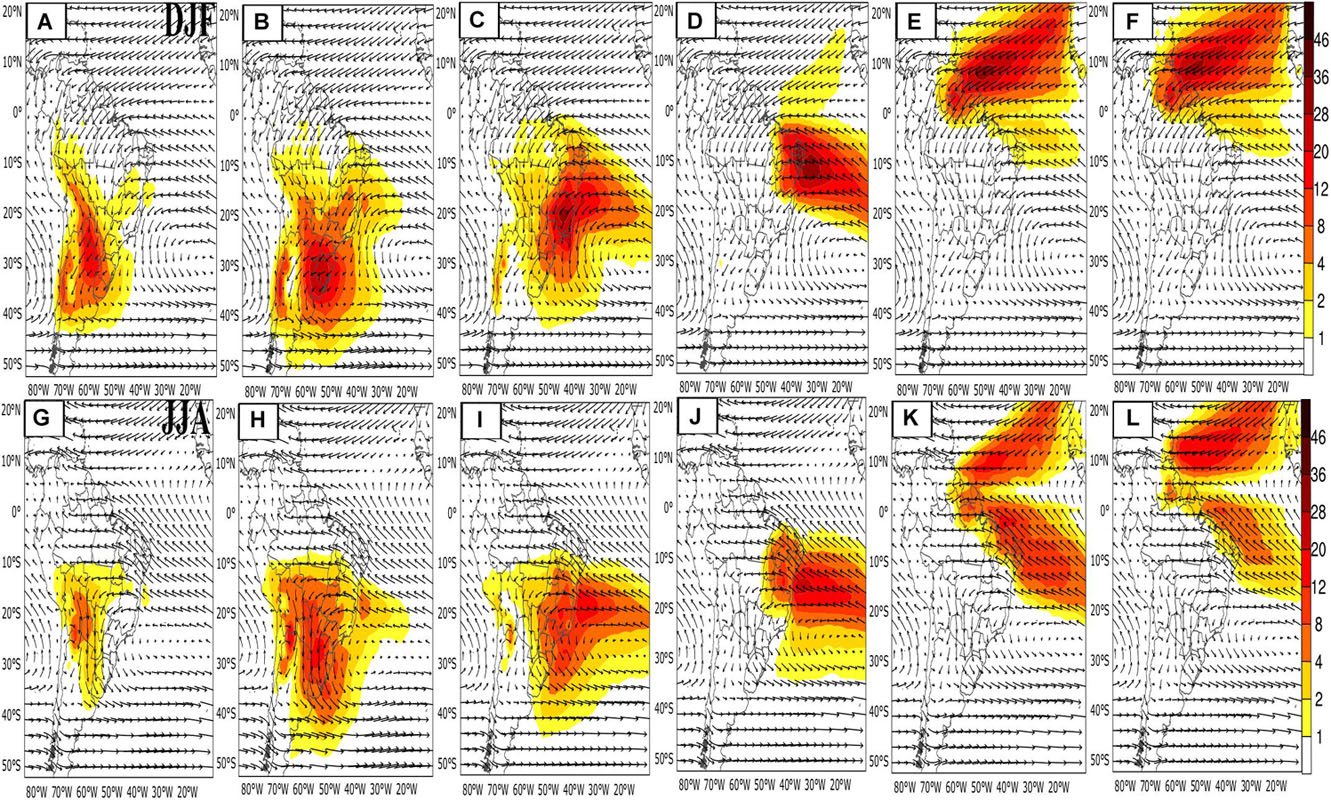
Figure 7. DJF (top) and JJA (bottom) climatology (1980–2016) of the moisture sources (10-days integrated E – P > 0 in mm day–1) and 900 hPa wind (vectors; m s–1) at 00:00 LT for the NLLJ days in: (A–G) Argentina, (B–H) Brazil-S, (C–I) Brazil-SE, (D–J) Brazil-NE, (E–K) Brazil-N, and (F–L) Venezuela. The moisture sources (E – P > 0, i.e., evapotranspiration greater than precipitation) are provided by backward trajectories (red colors intensity scale in the right side).
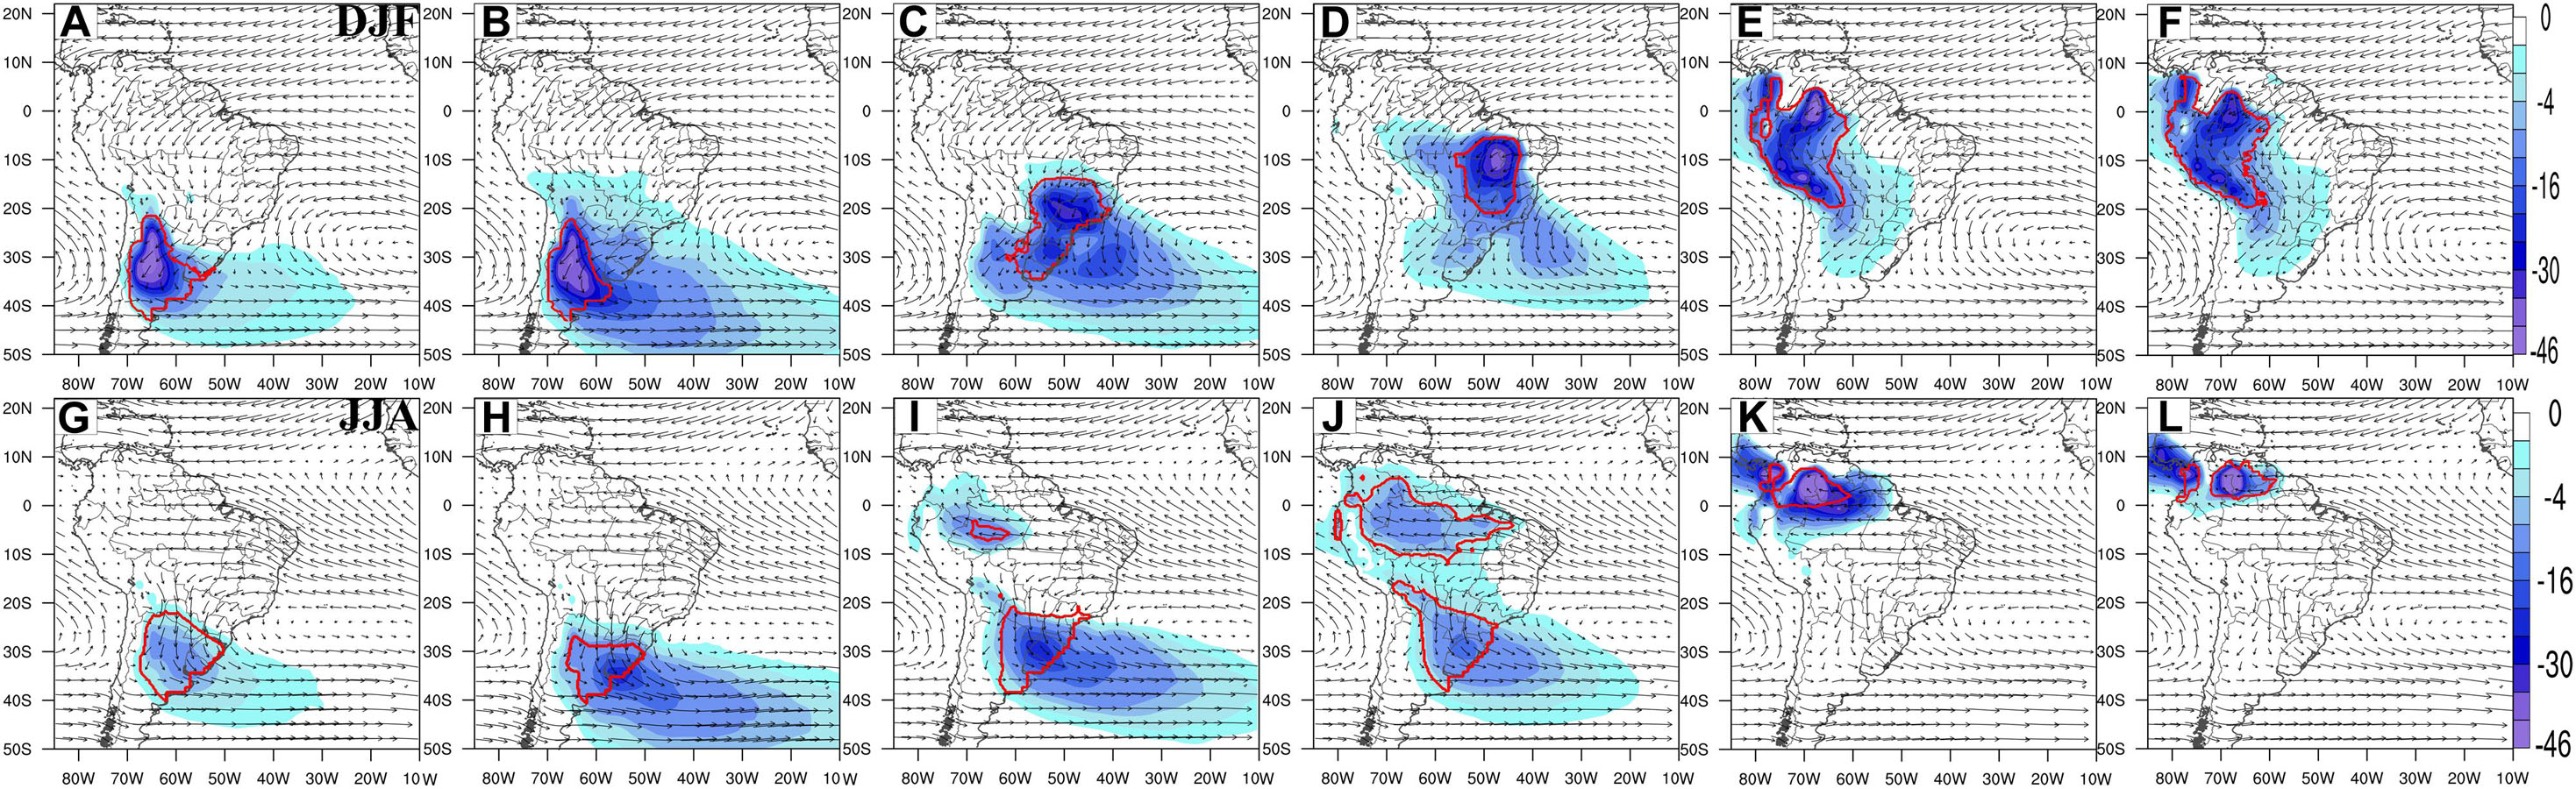
Figure 8. DJF (top) and JJA (bottom) climatology (1980–2016) of the moisture sinks (10-days integrated E – P < 0 in mm day–1) and 900 hPa wind (vectors; m s–1) at 00:00 LT for the NLLJ days in: (A–G) Argentina, (B–H) Brazil-S, (C–I) Brazil-SE, (D–J) Brazil-NE, (E–K) Brazil-N, and (F–L) Venezuela. The moisture sinks (E – P < 0, i.e., precipitation greater than evapotranspiration) are obtained from forward trajectories (a blue colors intensity scale in the right). The red lines delimitate the continental areas where moisture sink (E – P < 0) thresholds exceed the 75th percentile.
By comparing all regions, Figure 7 and Supplementary Figure 1 show the moisture sources occupying a broader and smaller area for the NLLJ days, respectively, in Brazil-S and Argentina.
According to Figure 7A, in DJF the NLLJ days in Argentina take the contributions of moisture transported by low-level northwesterly winds from the Amazon basin and by northeasterly winds from the TSA to the region. However, a very strong local moisture source is located over southeastern South America, more specifically over northeastern Argentina, Paraguay, and southwestern Brazil. Another remote moisture source of an intermediary magnitude (∼6–10 mm/day) is located over the Andes Mountains, occupying a latitudinal band of 25–45°S. For summer, Drumond et al. (2008) also detected all these sources when investigating the climatology of the moisture sources for the La Plata Basin. As expected, for only NLLJ days the moisture sources (Figure 7A) are stronger than in the climatology of Drumond et al. (2008), while they are slightly weaker than for the NLLJ days in January (Algarra et al., 2019). As in Figure 7A, Drumond et al. (2008) also highlighted a great contribution of local sources to the moisture in the La Plata Basin. The moisture origin pattern observed in DJF (Figure 7A) also occurs in the intermediary seasons MAM and SON (Supplementary Figures 1A–G) where the NLLJ winds are predominantly from the northeast. Some important changes are noted in DJF (Figure 7B), when the moisture sources originate in the South Atlantic Ocean and local sources, and the winds at 900 hPa are from north on the NLLJ days.
For Brazil-S, the moisture sources are more intense in DJF than JJA on the days with NLLJ (Figure 7B and Supplementary Figures 1B,H). They are the main contribution of the local source, while a less intense remote contribution is carried out by northeasterly winds from TSA and northwesterly winds from the Amazon basin to the region during most of the year (Figure 7B and Supplementary Figures 1B,H). The NLLJ days in JJA have TSA as their main source of humidity, which is associated with easterly northeasterly mean winds (Figure 7H and Supplementary Figure 1H). Particularly in the austral summer (DJF), there is an additional moisture source being carried out from the southern Amazon basin to Brazil-SE (Figure 7A).
The days with the NLLJ in Brazil-SE have TSA as a main source of humidity, in particular there is an additional source of moisture being carried from the south of the Amazon basin to Brazil-SE (Figure 7C and Supplementary Figures 1C,I). Specifically, for DJF, the changes in circulation imposed a northern NLLJ, and the humidity comes from TSA and local sources (Figure 7C). Except in SON (Supplementary Figure 1I), the north-south extension of the TSA moisture source for the NLLJ in Brazil-SE occupies a broad latitudinal band (Martín-Gómez et al., 2016), from the equator to subtropical latitudes (35°S).
Tropical South Atlantic is also the most important moisture source for the NLLJ days in Brazil, being stronger and concentrated in narrow southern bands in DJF and JJA (Figures 7D,J and Supplementary Figures 1D,J). The direction of mean winds is from the southeast for the NLLJ days for most of the year, except in DJF, when it changes to easterly. A small amount of humidity comes from the TNA to the Brazil-NE during the NLLJ days in the austral autumn (Supplementary Figure 1D), which corresponds to the rainy season in most parts of the northeast of Brazil. In this season, a stronger TSA moisture source core is over the sea away from the continent.
The spatial patterns of the moisture sources have similarities for the NLLJ days in Brazil-N and Venezuela (Figures 7E,F and Supplementary Figures 1 E,F). The NLLJ days in Brazil-N are characterized by an intensification of the northeasterly and southeasterly trade winds transporting moisture, respectively, from TNA (5–15°N and 55–35°W) and TSA to the region during DJF and JJA (Figures 7E–K). In NLLJ locations, the mean wind at 900 hPa is from the east. The contribution of TNA continues intensification of the NLLJ days in Venezuela and Brazil-N during MAM (Supplementary Figures 1E,F), while it practically disappears in SON (Supplementary Figures 1K,L), when the main moisture source is over the TSA with predominant easterly winds at NLLJ locations.
The seasonal climatology in Figure 8 and Supplementary Figure 2 shows the maximum and minimum areas of the moisture sinks occupied by the NLLJ days. The NLLJ days in Argentina have moisture sinks with a stronger intensity in DJF (Figure 8A). For all seasons, the moisture sources are located downstream (to the west) of the low-level jet core, i.e., over the center-north of Argentina, Uruguay, and extending to the east over the South Atlantic Ocean. In MAM, the moisture sinks occupy a broader area over the ocean (Supplementary Figure 2A). A general weakening of the moisture sinks is noted for the NLLJ days in JJA (Figure 8G), which intensify again in SON (Supplementary Figure 2G) and reach a stronger intensity in DJF (Figure 8A). The moisture sinks for the NLLJs in Brazil-S present a spatial pattern and seasonality similar to those for the NLLJ days in Argentina but occupy a broader area of midlatitudes and advance north toward the south of Brazil (Figures 8B,H and Supplementary Figures 2B,H).
For Brazil-SE, the moisture sinks spread over a wider area, from the central part of Brazil to northeastern Argentina, south Brazil, and the adjacent ocean during the NLLJ days in DJF (Figure 8C). In JJA the moisture sink is concentrated downstream of the NLLJ region, affecting a smaller area from eastern Argentina to south Brazil, advancing over the sea (Figure 8I). In addition, there is a remote impact of the NLLJ days in Brazil-SE that can be seen in a weak and small area of the moisture sink over the northwest Amazon in JJA, which would be explained by the deceleration of the easterly winds crossing the tropical sector of the continent (Figure 8F). Moisture sinks continue to intense and occupy a broader area in MAM (Supplementary Figure 2C), but weaken in SON (Supplementary Figure 2I).
The moisture sinks for the NLLJ days in Brazil-NE covers a broad area of the continent throughout the year (Figures 8D,G and Supplementary Figures 2D,G). The spatial pattern is similar in DFJ and MAM, where stronger moisture sinks occur near and downstream of the NLLJ point (Figure 8D and Supplementary Figure 2D). For JJA, there is a general weakening of the moisture sinks and two main cores occur away from the NLLJ area, i.e., one over the north of the continent, and the other over the southeast of South America (Figure 8J). The moisture sinks in MAM and SON are stronger than those in JJA (Supplementary Figures 2D,J and Figure 8D).
The NLLJ days in Brazil-N and Venezuela have associated moisture sinks located downstream and occupying a broad area from the Amazon basin to the center-west of the continent in DJF (Figures 8E,F) and SON (Supplementary Figures 2E,F) when nocturnal jets are more frequent. The source receives moisture from the NLLJ and contributes to the precipitation downstream over the Amazon basin and the center-west of the continent. In DJF, the stronger (reaching until 45 mm/day) moisture sinks occur over the Andes Mountains for both NLLJ days in Brazil-N and Venezuela (Figures 8E,F). DJF moisture sources and sinks for the NLLJ days in Venezuela and Brazil-N have similar patterns to those obtained only for January by Algarra et al. (2019). In JJA, when the frequency of the NLLJ decreases, the moisture sinks continue to intensify, but they occupy a smaller area near the NLLJ points in Brazil-N and Venezuela (Figures 8K,L). In SON, there are large differences between the moisture sinks for Venezuela and Brazil-N, i.e., they occupy a small area near the NLLJ point for Venezuela and a larger area for Brazil-N (Supplementary Figures 2K,L).
The synoptic climatology and anomalous moisture sources/sinks for the six regions of NLLJs are discussed in this section. The objective is to understand the meteorological systems influencing the moisture sources/sinks associated with the nocturnal low-level cores.
Figures 9, 10 present the seasonal anomalies (difference between the days with and without NLLJ) of the moisture sources/sinks along with the anomalies of 900 hPa winds at 00:00 LT. In these figures, the positive (indicating decreased precipitation) and negative (indicating increased precipitation) anomalies of the moisture sink (precipitation, E − P < 0) are shaded; for the moisture sources (E − P > 0) only positive anomalies (above climate values) are shown in continuous lines.
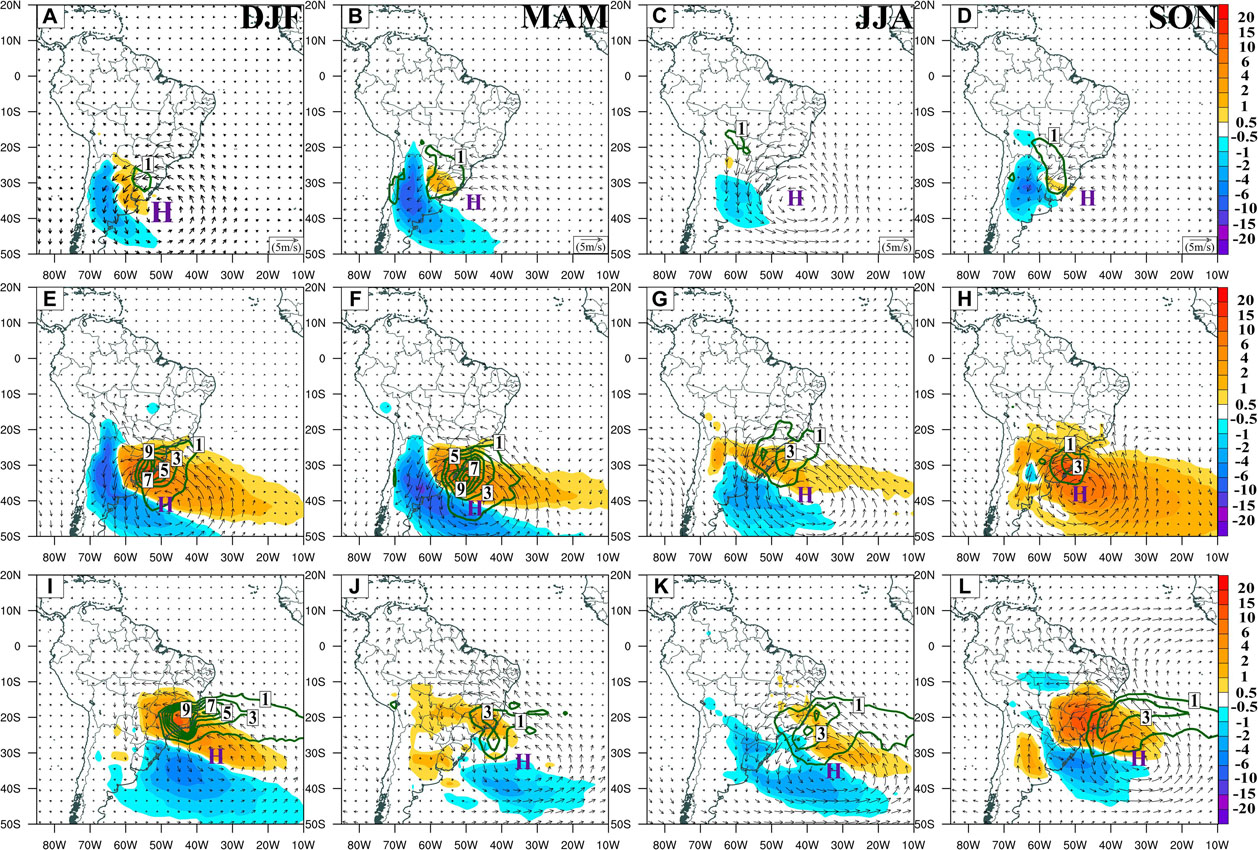
Figure 9. Seasonal anomalies (the days with minus without the NLLJ) of 10-days integrated (E – P) and 900 hPa wind (vectors; m s–1) at 00:00 LT for: (A–D) Argentina, (E–H) Brazil-S, and (I–L) Brazil-SE. The letter H identifies the anomalous anticyclone circulation referred in the text. Shaded areas represent moisture sink (in mm day–1) anomalies (red is positive; blue negative); green lines represent only the positive anomalies of moisture sources (in mm day–1).
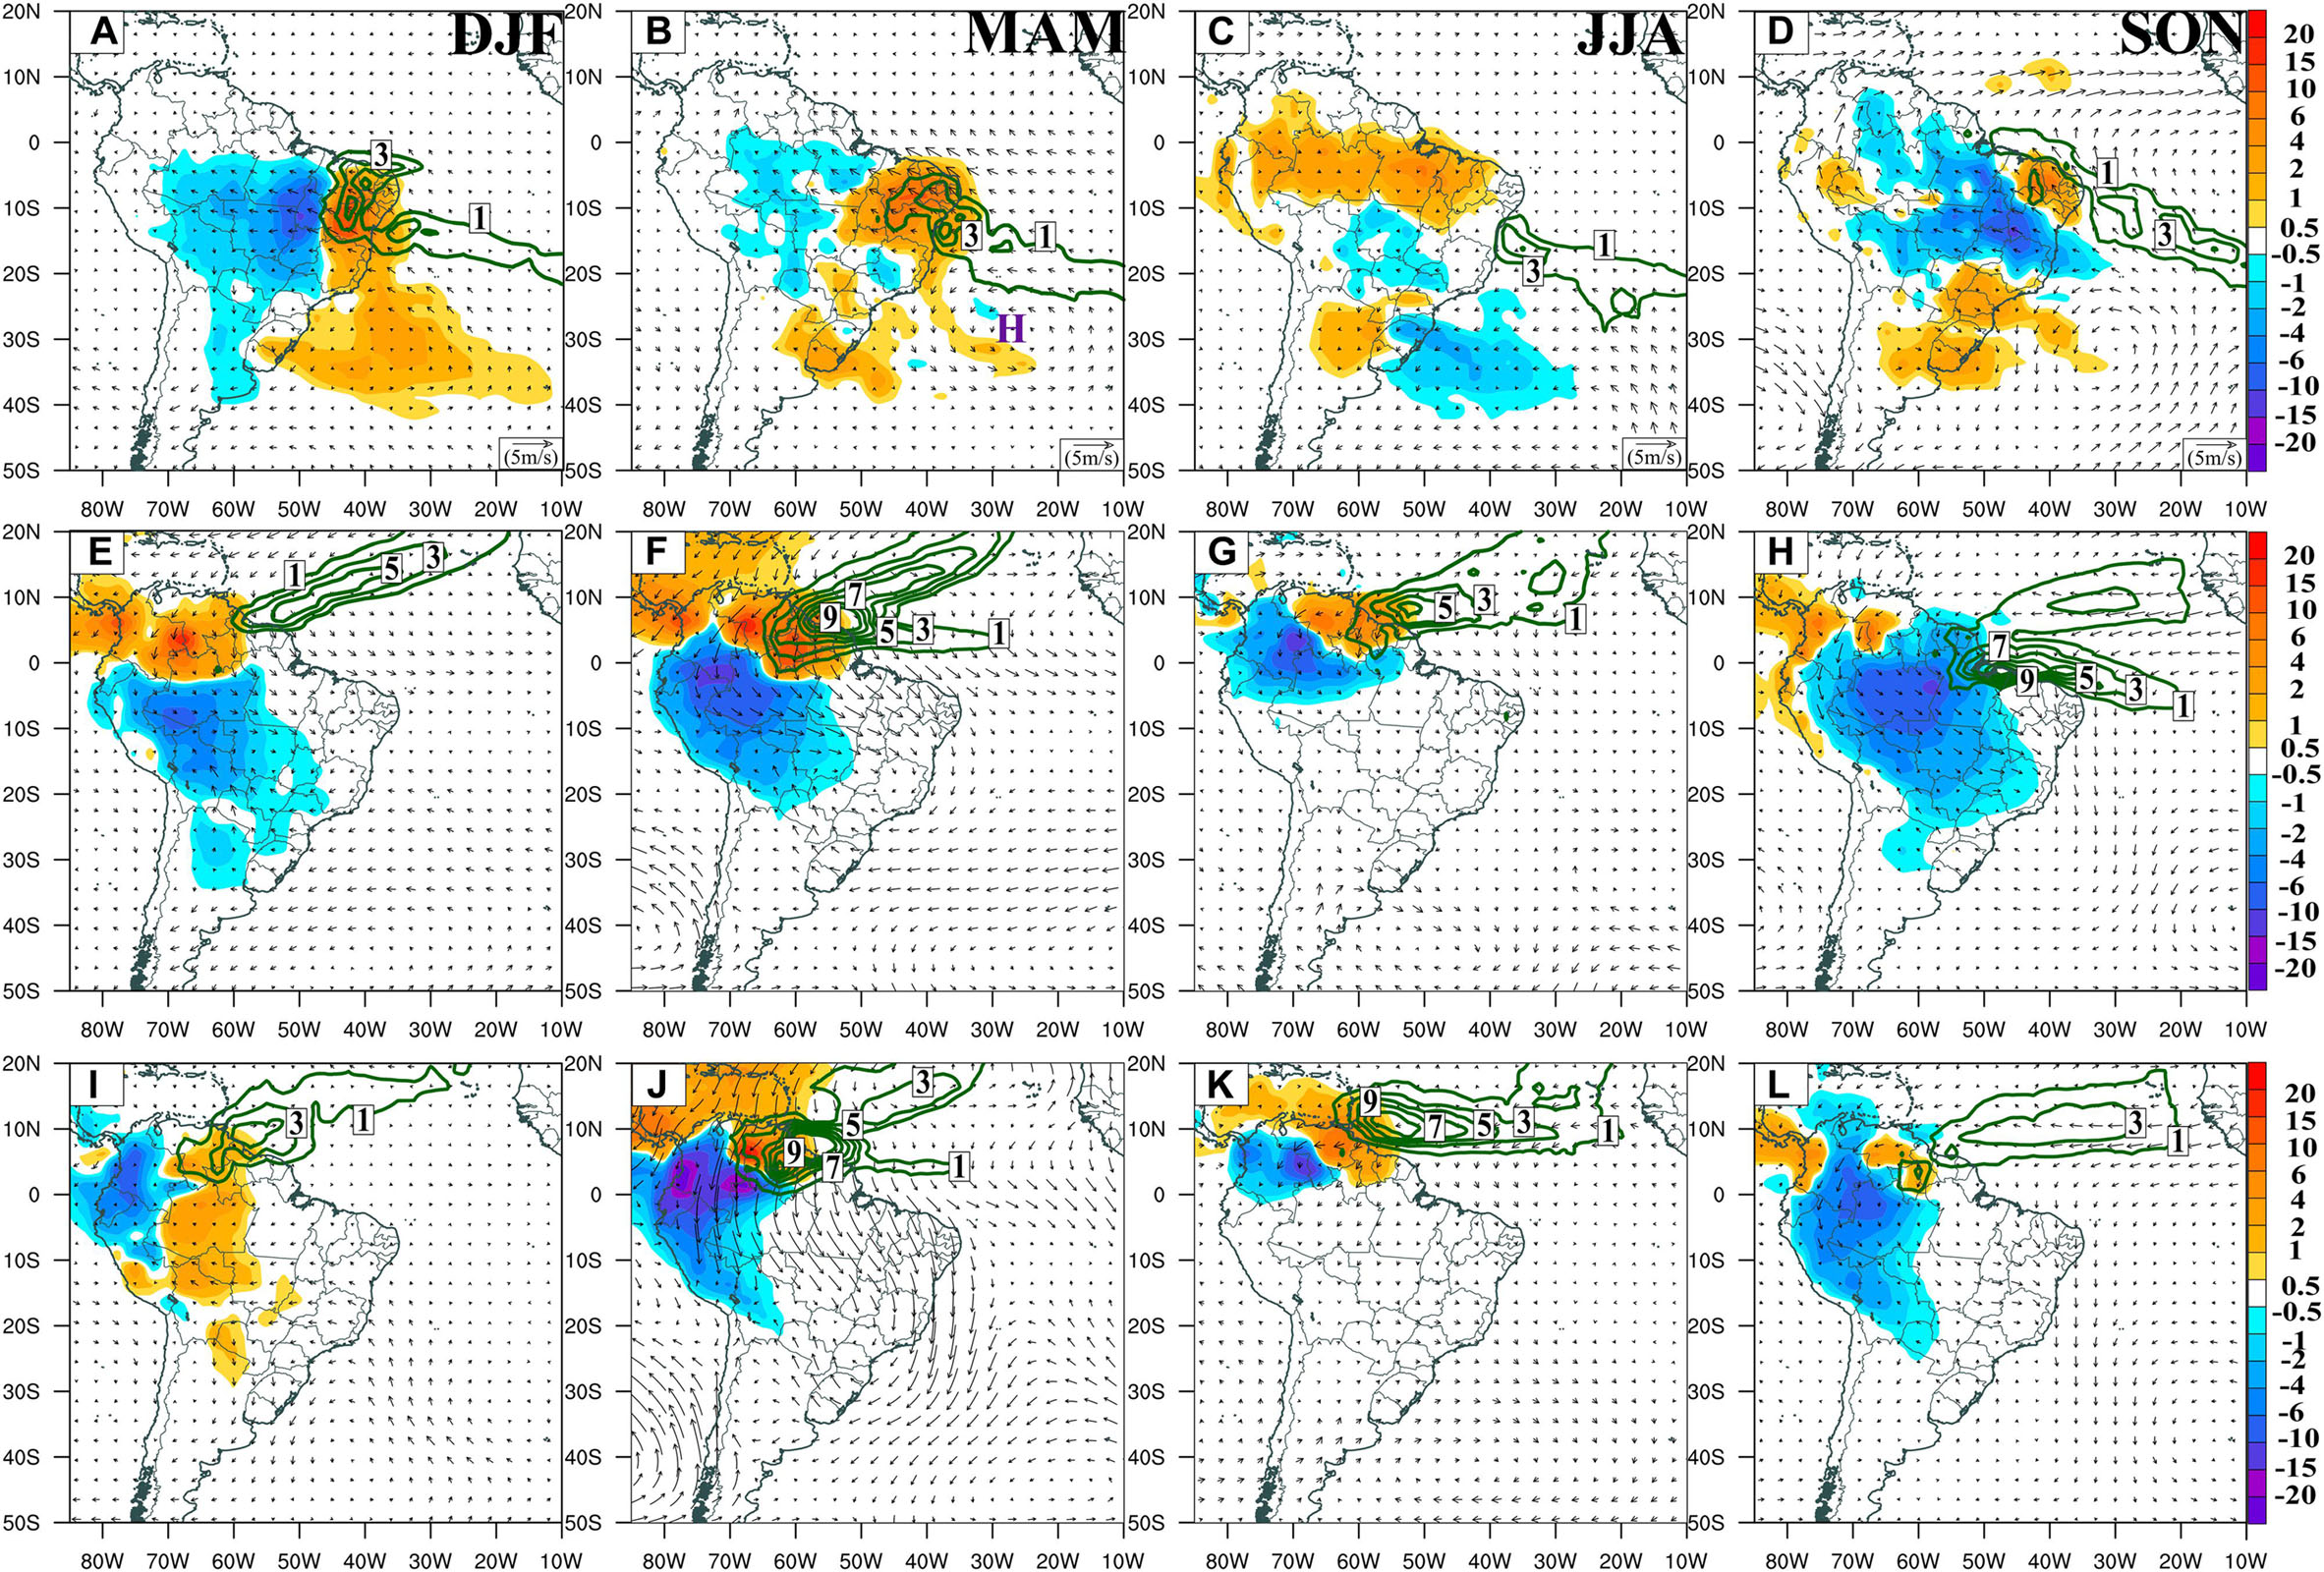
Figure 10. Seasonal anomalies (days with minus without NLLJ) of 10-days integrated (E-P) and 900 hPa wind (vectors; m s–1) at 00:00 LT for: (A–D) Brazil-NE; (E–H) Brazil-N; (I–L) Venezuela.
In DJF and MAM, the NLLJ days in Argentina and Brazil-S are characterized by a negative anomaly of the moisture sink (intensified precipitation) covering the center-west of Argentina, while a positive anomaly (decreased precipitation) is observed over the south of Brazil and Paraguay (Figures 9A,B,E,F). Both positive (less precipitation) and negative (more precipitation) anomalous moisture sinks are stronger for the NLLJ days in Brazil-S than Argentina. Observing Figures 9A,B,E,F, one can see that the NLLJs in these regions at the nighttime 900 hPa winds, there is the establishment of an anomalous anticyclone centered over the South Atlantic (∼38–40°S and 48–50°W), which intensifies the northerly/northeasterly winds at the jet cores, as described by Nicolini et al. (2004) for the LLJ Argentina. For the DJF and MAM seasons, the positive anomalies of the moisture sources (continues green lines) are also stronger for the NLLJ in Brazil-S than the Argentina, which is also probably related to the anomalous anticyclone described before and produces a more intense easterly wind at 900 hPa (Figures 9A,D). The stronger winds reinforce both the moisture transport from the sea to the NLLJ core in Brazil-S and the local moisture source. The anomalous low-level anticyclonic circulation centered on ∼35°S and 40–45°W is also one common feature in the JJA/SON seasons for the NLLJ days in Argentina and Brazil-S (Figures 9C–H), but the moisture sink anomalies (positive and negative) are weaker in comparison to DJF/MAM. In addition, there are some differences in a spatial pattern of anomalies between the NLLJ days in Argentina and Brazil-S, i.e., in SON the NLLJ days in Argentina (Figures 9C,D) are characterized by increased precipitation (negative moisture sink anomaly), while for Brazil-S (Figures 9G,H) the suppression of precipitation (positive moisture sink anomaly) predominates. Moisture source positive anomalies are a clear characteristic of the NLLJ days in Argentina and Brazil-S, as well as in JJA/SON (Figures 9C,D,G,H). The anomalous low-level circulation patterns for Argentina and Brazil-S have similarities to those described by Nicolini et al. (2004, 2006), as in Argentina LLJ, i.e., the low-level jet is from north-northeasterly and occurs in the western sector of a postfrontal anticyclone. Our study shows that for most of the year these NLLJs have their main source of moisture over the TSA ocean (green lines in Figures 10A–H) and contribute to an increase/decrease in precipitation in the west/east dipole mode covering northern central Argentina and southern Brazil (shaded in Figures 10A–H). This is in line with the previous analyses in this region (Silva et al., 2009; Martinez and Dominguez, 2014).
The NLLJ days in Brazil-SE are characterized by positive moisture sink anomalies (suppression of precipitation) over the east of southeastern Brazil during most of the year, while the moisture sources are intensified over the subtropical (centered on 20°S) South Atlantic Ocean (Figures 9I,L). At the same time, except in MAM, there is increased rainfall (negative moisture sink anomaly) over the south of Brazil where the low-level winds slow down, configuring a dipole pattern of precipitation between southeastern (increased) and southern (decreased) Brazil during the NLLJs in Brazil-SE. In low levels, the anomalous moisture sinks/sources are associated with the presence of an anticyclone over the South Atlantic Ocean (centered on ∼30°S and 30–35°W), which accelerates the northerly/northeasterly wind in the region of the NLLJ in Brazil-SE.
The NLLJ days in Brazil-NE are associated with the intensification of the easterly/southeasterly winds over the northeast of Brazil, with the consequent intensification of moisture sources over TSA and some sectors of northeastern Brazil (Figures 10A–D). The acceleration of low-level winds is stronger in SON and weaker in JJA. According to Figures 10A–D, for in Brazil-NE, the NLLJ days have a great influence over the local and remote moisture sinks. Although the frequency of NLLJ days increases a little during the year (Figure 4), the moisture sink anomalies exhibit different patterns according to the season of a year (Figures 10A–D). For DJF and MAM, there is suppression of rainfall over the northeast of Brazil and enhanced rainfall downstream of the NLLJ core (Figures 10A,B). For JJA, the local impact is weaker, but the remote effect is greater and results in a large area of the Amazon basin having decreased rainfall during the NLLJ days (Figure 10C). Another different anomalous pattern occurs in SON (Figure 10D). In this season, the moisture sinks exhibit decreased precipitation only in the northern sector of northeastern Brazil, and a broad area of enhanced rainfall is located to the south and east of the NLLJ core.
The intensification of southeasterly trade winds for Brazil-SE and Brazil-NE for the NLLJ days, mainly during the austral spring, favors greater evaporation from the sea to the atmosphere, thereby increasing the availability of water vapor in the atmosphere, and, in consequence, the sources of moisture (lines in Figures 9I,L, 10A,D), which is transported to the remote regions (Drumond et al., 2014).
The NLLJ days in Venezuela and Brazil-N have similar patterns of the negative anomaly of the moisture sink, i.e., the precipitation exceeding evapotranspiration downstream of the jet cores covering the central-western Amazon basin, including Peru and Colombia, during MAM and SON (Figures 10F,H,J,L). In these seasons, small areas with a positive moisture sink (less precipitation) are established near the NLLJ cores. Comparatively, enhanced precipitation associated with the NLLJ is stronger in MAM than SON for Brazil-N and the Venezuela jets. In this season, the anomalous moisture sources (green lines) are also more intense than in the rest of the year. During JJA, compared to other seasons, a decrease in the areas of the positive and negative moisture sinks can be seen (Figures 10G,K). Different spatial pattern anomalies of the moisture sink emerge in DJF for the NLLJs in Brazil-N and Venezuela (Figures 10E,I). For Brazil-N, there is a north-south dipole with suppression of precipitation in the northwest of South America and an increase over the Amazon basin extending to a central part of the continent (Figure 10E). For Venezuela, the dipole is east-west oriented with increased rainfall occupying Colombia and Peru, while a deficit of rainfall is noted in the center-west of the Amazon basin (Figure 10I). This difference could be explained by the stronger northeasterly winds occurring in the NLLJ days in Brazil-N than those in Venezuela. Although the NLLJs in Venezuela and Brazil-N present a higher frequency in DJF, we note that the anomalous moisture sources are stronger (more than 5 mm day–1) in MAM and JJA, associated with the intensification of north-northeasterly winds in TNA (Figures 10F,G,J,K). Specifically, in SON, the NLLJ days in Brazil-N also present a strong moisture source anomaly, but this is associated with the intensification of the easterly winds in TSA (Figure 10H).
For the NLLJ days, the composites of the winds at 250 hPa have a great similarity with the climatology presented by Reboita et al. (2010). For example, in DJF, there is the presence of the Bolivian High over Bolivia followed downstream by a trough over the northeast of Brazil, while for SON, westerly winds extend from extratropical to tropical latitudes (∼12°S), and there is the presence of a high pressure over the northwestern of Amazon basin (figure not shown). As a result, we can discuss the upper-level circulation only in terms of anomalies, i.e., the differences between the days with NLLJ and without NLLJ. Thus, Figure 11 presents the anomalies of 250 hPa winds and precipitation (CPC). The anomalies of precipitation are related to the moisture sinks since more negative (positive) values of moisture sinks are associated with an intensification (weakening) of precipitation.
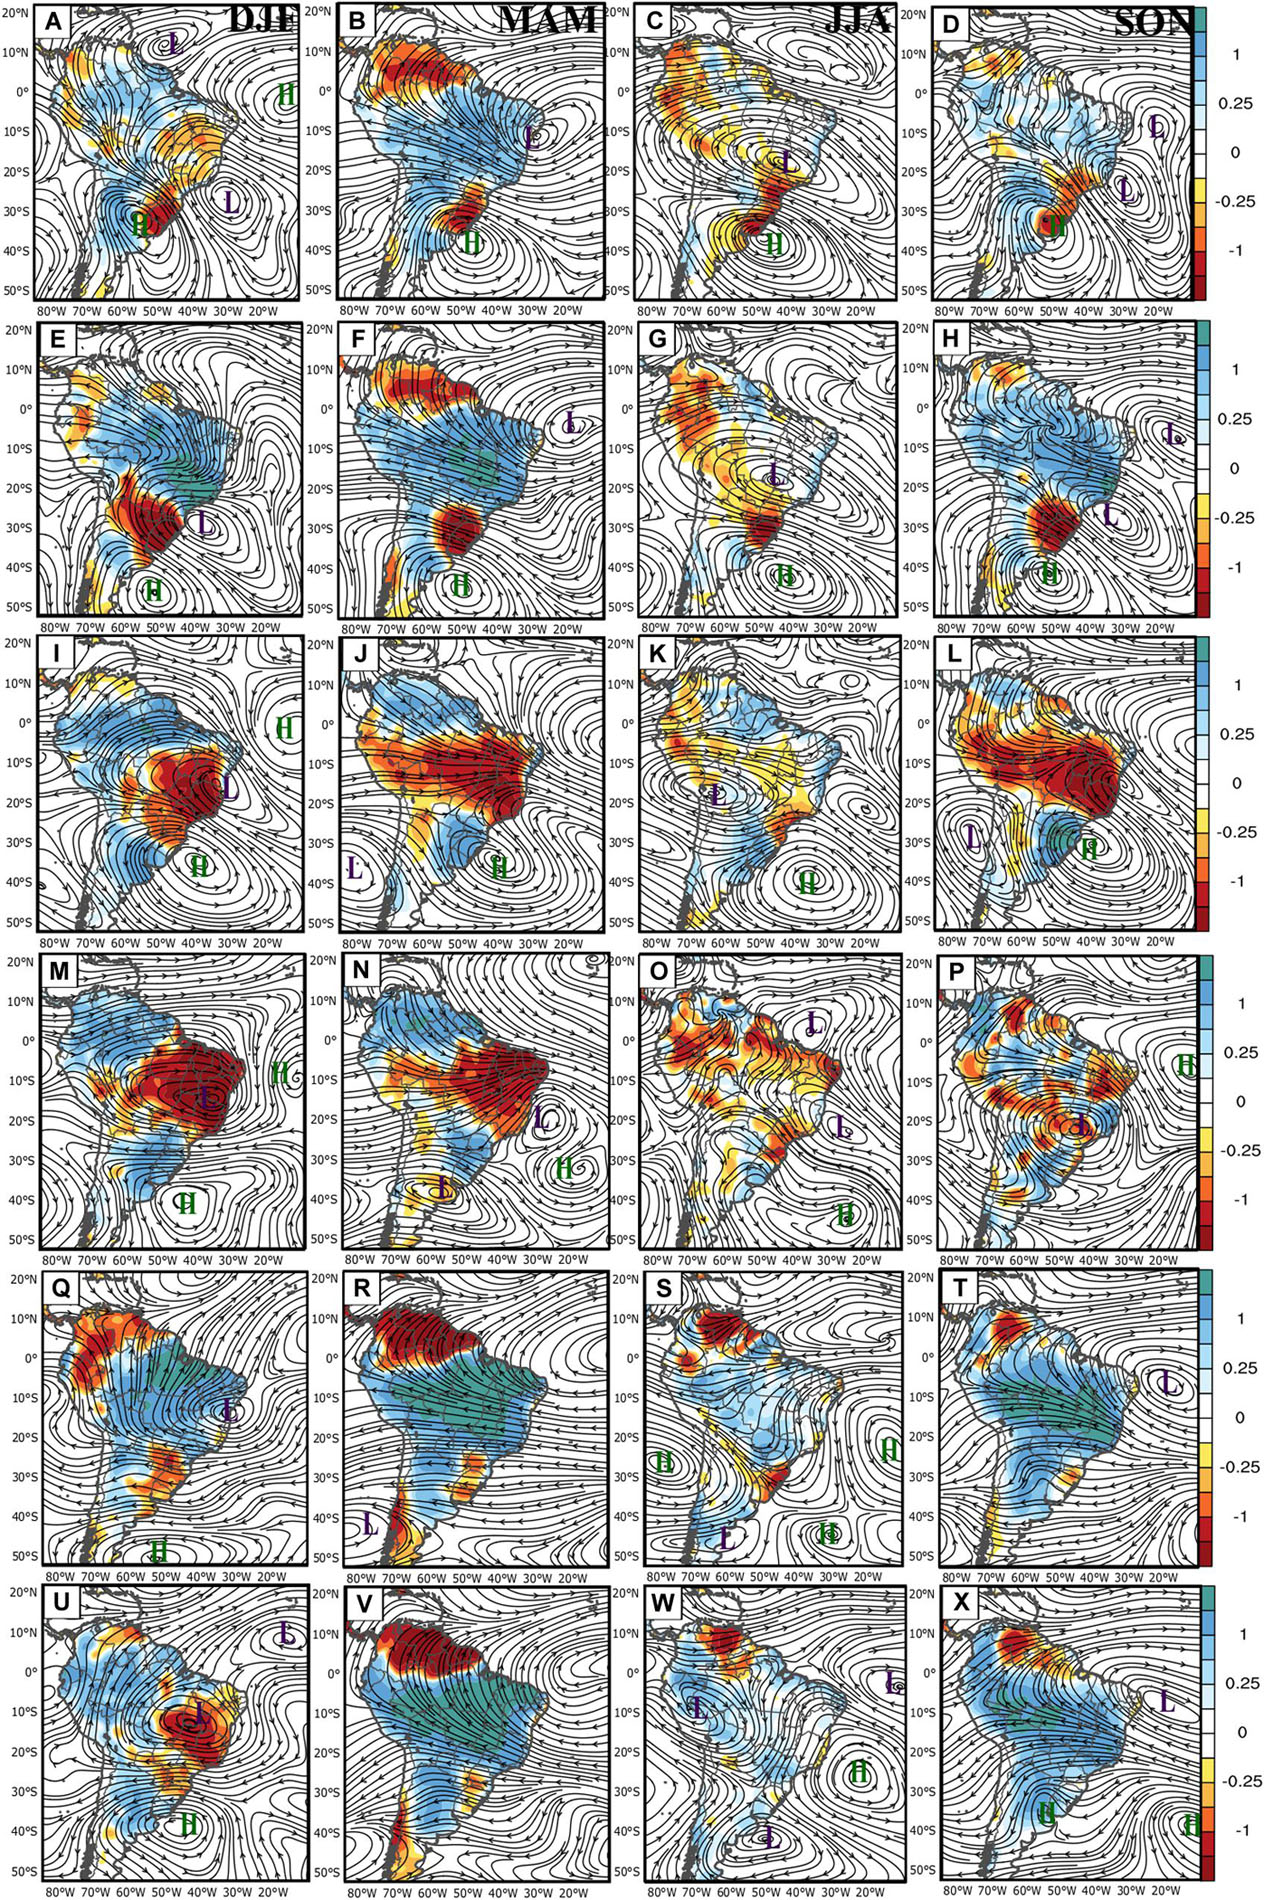
Figure 11. Seasonal anomalies (differences between the days with and without NLLJs) of daily precipitation (mm day–1) and streamlines at 250 hPa at 00:00 LT for: (A–D) Argentina, (E–H) Brazil-S, (I–L) Brazil-SE, (M–P) Brazil-NE, (Q–T) Brazil-N, and (U–X) Venezuela. Shaded areas indicate the anomalies of precipitation (red colors are negative and blue colors are positive).
For the NLLJ days in Argentina, an anomalous anticyclone at 250 hPa is located over Uruguay, followed downstream by an anomalous low pressure in the east of southeastern Brazil during DJF and SON (Figures 11A,D). These circulation patterns are associated with above-normal precipitation over the center-north of Argentina, which coincides with the areas of intensification of the moisture sinks (Figures 11A,D). Immediately downstream over Uruguay and southern Brazil, the suppression of the precipitation in agreement with the positive anomaly of moisture sinks is noted. For MAM and JJA, the anomalous anticyclone at upper levels is located to the southeast of that in DJF and SON (in eastern Uruguay), and the common signal in both seasons is a negative anomaly of precipitation over southern Brazil (Figures 11B,C).
For each season, we defined the area limited by the 75th percentile of the moisture sink (negative values in Figure 9) to integrate the moisture sink and precipitation in the NLLJs. We then calculated the time correlation between these time series. For NLLJs in Argentina, the moisture sinks and precipitation are statistically significantly correlated (negative correlations indicate an increase in rainfall when the moisture sinks are more negative), as shown in Table 1. The correlations are greater (in modules) when the moisture sinks are compared to the ERA-Interim than with CPC. This is an expected result considering that the moisture sinks are obtained directly from the ERA-Interim, and a water budget is expected to exist in the reanalysis data. This balance does not occur in CPC since it only interpolates rain gauge observations without considering any other dynamic or thermodynamic processes in the atmosphere.
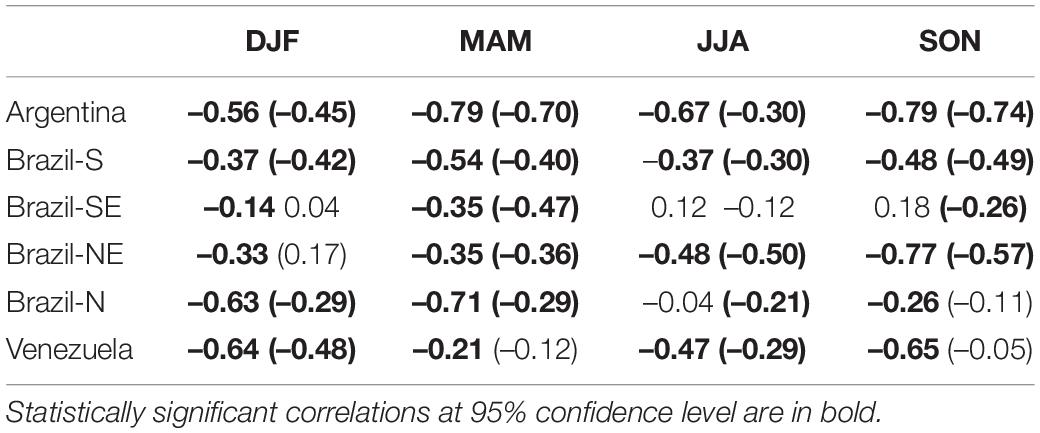
Table 1. Correlation coefficients between the moisture sink areas (the areas are highlighted with red lines in Figure 8) and the Era-Interim and Climate Prediction Centre (CPC; values in parenthesis) precipitation during the nocturnal low-level jet (NLLJ) days.
For all seasons, the NLLJ days in Brazil-S are characterized by an anomalous upper-level high pressure with similarities (Figures 9E–H) to that of Argentina (Figures 9A–D), but its center is slightly shifted to the south. The most evident consequence of the NLLJ in Brazil-S is the strong suppression of rainfall over southern Brazil and Uruguay and an increase in central-northern Argentina. Some remote impacts are noted also over central-eastern Brazil, with positive anomalies of rainfall, except in JJA (Figure 11G). The correlations between the areas (75% percentile) of moisture sink (Figures 8D–H) and rainfall (Figures 11D–H) anomalies are also statistically significant but smaller in a module than in the NLLJ days in Argentina (Table 1).
Except in winter, the rainfall anomalies associated with the NLLJ days in Argentina and Brazil-S (Figures 11A–H) present a dipole pattern, in the form of a northwest-southeast band, with the rainfall suppression over most of southeastern South America (southern Brazil, northeastern Argentina, and Paraguay) and a rainfall increase from the Amazon to southeastern Brazil, a pattern normally referred to as seesaw (Carvalho et al., 2011).
When the NLLJ in Brazil-SE occurs, there is also the presence of one anomalous anticyclone at upper levels located eastward of southern Brazil, with an anomalous low pressure (or trough) downstream over southeastern Brazil (Figures 9I–M). Associated with this anomalous circulation, another dipole pattern in the precipitation anomalies emerges during the NLLJ days in Brazil-SE, i.e., less precipitation in the center-east of Brazil and more precipitation over the south of Brazil (Figures 11I–L). In this case, the areas of negative moisture sink anomalies (percentile 90%) are relatively less correlated with rainfall in comparison to Brazil-S and Argentina, but they are still statistically significant in some seasons (Table 1). These smaller correlations may be associated with the moisture sink anomalies occupying larger areas over the ocean than in the continent (Figures 9I–L), while the opposite occurs for precipitation anomalies (Figures 11I–L). A greater increase in precipitation over southern Brazil in the austral spring (Figure 11L) during the NLLJs in Brazil-SE may be associated with a higher occurrence of cold fronts crossing the south/southeast of Brazil, reinforcing the formation of clouds and precipitation over the region (Rodrigues et al., 2004; De Jesus et al., 2016).
Upper-level circulation anomalies for the NLLJs in Brazil show the presence of low pressure over the northeast of Brazil in DJF, which migrates to the southeast during MAM and JJA and to the south in SON (Figures 11M–P). This low pressure induces subsidence with the consequent suppression of precipitation during the NLLJs over a wide area, which exceeds that of the NLLJ core and advances from the northeast to the southeast of Brazil in DJF and MAM. The negative anomaly of rainfall occupies a greater area in comparison to the positive moisture sink (less precipitation in Figures 10A–D). When in JJA and SON, the anomalous upper-level low pressure moves away (to the south), the negative precipitation anomaly occupies a smaller area. The time correlations between the moisture sink and precipitation anomalies are greater in SON, decreasing in the other seasons (Table 1).
According to Figures 11Q–T, the NLLJ days in Brazil-N and Venezuela have similar upper-level circulation (and precipitation) anomalies, mainly in DJF and MAM, when these regions present higher frequencies of NLLJs (Figure 4). At tropical latitudes (15°S to15°N), the circulation anomalies show a weakening and an intensification of easterly winds, respectively, to the north and south of the equator, except in DJF when a cross-equatorial southerly southwesterly anomaly (Figures 11Q–T) can be noted. In addition, these NLLJs are associated with the suppression of convection near the jet cores in agreement with a positive anomaly of the moisture sink (Figures 10E–H) and excessive precipitation downstream of the cores. In most seasons, there is a statistically significant correlation between the moisture sinks and precipitation for the NLLJ days in Brazil-N and Venezuela (Table 1).
We used 37 years (1980–2016) of the ERA-Interim reanalysis to identify the regions of occurrence of NLLJs and associated moisture sources and sinks in South America. The NLLJ identification considered an index based on the vertical wind speed shear at 00:00 LT compared to 12:00 LT proposed by Rife et al. (2010), while the moisture sources/sinks are obtained by the Lagrangian FLEXPART model (Stohl et al., 1995).
In South America, the NLLJ index is stronger in the warm periods of the year, i.e., austral spring and summer. Relatively intense NLLJs occur throughout the year over northeastern Brazil and northern Argentina, while in the other regions they only intensify in specific seasons (northern Brazil in DJF and Venezuela in DJF-MAM). The NLLJ index permits the identification of the seasons with a high frequency of occurrence and secondary regions, such as southeastern Brazil, where this kind of jet has not been previously documented. Based on the NLLJ index, we selected six main regions of the NLLJ occurrence: Argentina, southern Brazil (Brazil-S), southeastern Brazil (Brazil-SE), northeastern Brazil (Brazil-NE), northern Brazil (Brazil-N), and Venezuela. The vertical profiles of wind speed show these NLLJs acting between 900 and 650 hPa layers, with mean speeds between 7 and 12 m s–1 peaking mainly at 900 hPa level. Therefore, the NLLJs analyzed here have maximum velocity at lower levels than previously documented for the SALLJ, with a peak velocity at 850 hPa (Marengo et al., 2004; Montini et al., 2019).
For most of the selected regions, NLLJs are more frequent in the austral spring and summer, except for Brazil-NE, where the NLLJ is very frequent during all months of a year, with a small increase in frequency in the austral spring. The NLLJs in Argentina, Brazil-S, Brazil-N, and Venezuela are more frequent in the summer. In terms of persistence, the NLLJs for most seasons and regions persist with a higher frequency for 1 or 2 days. The exception is a great occurrence of the long-lived NLLJs (up to 8 days) in Brazil-NE for most of the year, except in austral winter. The greater persistence of the NLLJ in Brazil-NE is explained by the link between the jet and the persistence and intense easterly/southeasterly trade winds in the northwestern sector of subtropical South Atlantic anticyclone.
The track in a backward and forward mode of the particle trajectories from the outputs of the Lagrangian FLEXPART model over the six NLLJ core regions allows identifying the origin and the sink of moisture, respectively. The NLLJs in Argentina and Brazil-S are characterized by the predominance of northerly and northeasterly low-level winds, respectively, in the austral winter and other seasons. The main moisture sources for these NLLJs are from the tropical/subtropical South Atlantic Ocean and Amazon basin, which are stronger in the austral summer-autumn and weaker in the winter. For both NLLJs, the local moisture sources also are intense over the year. Northeasterly low-level wind characterizes the NLLJ in Brazil-SE throughout the year, having the tropical-subtropical South Atlantic Ocean as its main remote moisture source. Local moisture sources are also found to contribute to the moisture during the Brazil-SE NLLJ episodes. For the subtropical NLLJs (Argentina, Brazil-S, and Brazil-SE), the moisture transported could precipitate (their moisture sinks) over the center-north of Argentina, southern Brazil, part of southeastern Brazil, and the subtropical South Atlantic Ocean. As for the moisture sources, subtropical NLLJs have relatively stronger moisture sinks during the austral summer and fall.
Throughout the year, the NLLJ in Brazil-NE receives moisture from the TSA Ocean through the intensification of the low-level easterly/southeasterly trade winds. As this jet is very frequent throughout the year, weak variations in the intensity of the associated moisture sources may also occur. The moisture transported by this NLLJ will precipitate downstream over remote and wide areas of the tropical and subtropical South America. The moisture sources for the tropical NLLJs (Brazil-N and Venezuela) come from the tropical North Atlantic Ocean in the austral summer and fall. In the austral winter and spring, the TSA Ocean appears to be an additional source of moisture for both NLLJs. The Brazil-N and Venezuela NLLJ moisture sinks (precipitation) are located downstream from the jet core, occupying a large (small) area of western South America in austral summer-fall (winter-spring).
Low- and high-level circulation anomalies for the subtropical NLLJs (Argentina, Brazil-S, and Brazil-SE) show an equivalent barotropic vertical structure with the presence of an anomalous anticyclone located to the east-southeast of the jet cores. In low levels, the jet is characterized by the intensification of north/northeasterly winds on the western side of the anomalous anticyclone, which generate precipitation (negative anomaly of moisture sinks) downstream of the NLLJ cores. A dipole pattern is found with increases and decreases, respectively, in the precipitation over southern and southeastern Brazil during the establishment of the NLLJ in Brazil-SE. In addition, for tropical NLLJs, the core region is characterized by the suppression (positive moisture sink anomaly) of the precipitation with enhanced precipitation occurring downstream. In addition, the moisture sink associated with the NLLJ is positively statistically significantly correlated with precipitation for most of the seasons.
The methodology of the NLLJ identification allowed us to describe some new and less explored regions of activity of the NLLJs (Brazil-S, Brazil-SE, Brazil-NE, and Argentina) as well as the associated moisture transport over South America. Thus, research contributes to improving our understanding of the NLLJs and their role in transporting moisture and controlling precipitation over the continent according to the season of a year. However, the role of the NLLJs and their relationship with the interannual variability of the moisture sources and sinks need to be further explored. A better understanding of the NLLJ modulation on the climate variability may help to improve the seasonal to sub-seasonal climate forecasting in the region. A more detailed study in this direction is underway. Another point in the future will be the use of new ERA5 reanalysis data, which are available with finer resolution, from hour to hour, and also with more vertical levels.
The original contributions presented in the study are included in the article/Supplementary Material, further inquiries can be directed to the corresponding author/s.
DB processed and analyzed the data and wrote the manuscript. IA, RN, and LG contributed with data processing and analysis of the Flexpart model. TA and RR in the process of analyzing the results of nocturnal low-level jets in continental South America. All authors discussed the results and worked together on the manuscript.
TA was supported by the National Institute of Science and Technology for Climate Change Phase 2 under CNPq Grant 465501/2014-1, FAPESP Grants 2014/50848-9 and 2017/09659-6. TA also specifically acknowledges the support of CNPq under Grants 304298/2014-0 and 301397/2019-8. RR acknowledges CNPq Grant 304949/2018-3. RN, LG, and IA were supported by the Spanish Government within the LAGRIMA Project (RTI2018-095772-B-I00). IA acknowledges the support by the Spanish Government (MINECO, under grant CGL2015-65141-R). Partial support was also obtained from the Xunta de Galicia under the Project ED431C 2017/64-GRC Programa de Consolidación e Estructuración de Unidades de Investigación Competitivas (Grupos de Referencia Competitiva) and Consellería de Educación e Ordenación Universitaria. All of them co-funded from the ERDF, in the framework of the Operational Program Galicia 2014–2020.
The authors declare that the research was conducted in the absence of any commercial or financial relationships that could be construed as a potential conflict of interest.
The Supplementary Material for this article can be found online at: https://www.frontiersin.org/articles/10.3389/fenvs.2021.657764/full#supplementary-material
Algarra, I., Eiras-Barca, J., Nieto, R., and Gimeno, L. (2019). Global climatology of nocturnal low-level jets and associated moisture sources and sinks. Atmos. Res. 229, 39–59. doi: 10.1016/j.atmosres.2019.06.016
Anselmo, E. M., Schumacher, C., and Machado, L. A. (2020). The amazonian low-level jet and its connection to convective cloud propagation and evolution. Month. Weather Rev. 148, 4083–4099. doi: 10.1175/MWR-D-19-0414.1
Arraut, J. M., Nobre, C., Barbosa, H. M., Obregon, G., and Marengo, J. (2012). Aerial rivers and lakes: looking at large-scale moisture transport and its relation to Amazonia and to subtropical rainfall in South America. J. Clim. 25, 543–556. doi: 10.1175/2011jcli4189.1
Baas, P., Bosveld, F. C., Klein Baltink, H., and Holtslag, A. A. M. (2009). Uma climatologia de jatos noturnos de baixo nível em Cabauw. J. Appl. Meteorol. Climatol. 48, 1627–1642.
Blackadar, A. K. (1957). Boundary layer wind maxima and their significance for the growth of nocturnal inversions. Bull. Am. Meteorol. Soc. 38, 283–290. doi: 10.1175/1520-0477-38.5.283
Bluestein, H. B. (1992). Synoptic-Dynamic Meteorology in Midlatitudes: Observations and theory of Weather Systems, Vol. 2. Milton Park, MI: Taylor & Francis.
Bonner, W. D. (1968). Climatology of the low level jet. Month. Weather Rev. 96, 833–850. doi: 10.1175/1520-0493(1968)096<0833:cotllj>2.0.co;2
Carril, A. F., Cavalcanti, I. F., Menendez, C. G., Sörensson, A., López-Franca, N., Rivera, J. A., et al. (2016). Extreme events in the La Plata basin: a retrospective analysis of what we have learned during CLARIS-LPB project. Clim. Res. 68, 95–116. doi: 10.3354/cr01374
Carvalho, L. M., Silva, A. E., Jones, C., Liebmann, B., Dias, P. L. S., and Rocha, H. R. (2011). Moisture transport and intraseasonal variability in the South America monsoon system. Clim. Dyn. 36, 1865–1880. doi: 10.1007/s00382-010-0806-2
Cavalcanti, I. F. D. A., Ferreira, N. J., Dias, M. A. F. D. S., and Silva, M. G. A. J. D. (2009). Tempo e Clima no Brasil. São Paulo: Oficina de textos.
De Jesus, E. M., da Rocha, R. P., Reboita, M. S., Llopart, M., Dutra, L. M. M., and Remedio, A. R. C. (2016). Contribution of cold fronts to seasonal rainfall in simulations over the southern La Plata Basin. Clim. Res. 68, 243–255. doi: 10.3354/cr01358
De Souza, E. B., Kayano, M. T., and Ambrizzi, T. (2005). Intraseasonal and submonthly variability over the eastern Amazon and Northeast Brazil during the autumn rainy season. Theor. Appl. Climatol. 81, 177–191. doi: 10.1007/s00704-004-0081-4
Dee, D. P., Uppala, S. M., Simmons, A. J., Berrisford, P., Poli, P., Kobayashi, S., et al. (2011). The ERA-Interim reanalysis: configuration and performance of the data assimilation system. Q. J. R. Meteorol. Soc. 137, 553–597.
Dirmeyer, P. A., Brubaker, K. L., and DelSole, T. (2009). Import and export of atmospheric water vapor between nations. J. Hydrol. 365, 11–22. doi: 10.1016/j.jhydrol.2008.11.016
dos Santos, J. G. M. D., Campos, C. R. J. D., and Lima, K. C. (2008). Análise de jatos de baixos níveis associados aum sistema convectivo de mesoescala na américa do sul: um estudo de caso. Rev. Brasil. Geofís. 26, 451–468. doi: 10.1590/S0102-261X2008000400006
Doyle, M. E., and Barros, V. R. (2002). Midsummer low-level circulation and precipitation in subtropical South America and related sea surface temperature anomalies in the South Atlantic. J. Clim. 15, 3394–3410. doi: 10.1175/1520-0442(2002)015<3394:mllcap>2.0.co;2
Drumond, A., Marengo, J., Ambrizzi, T., Nieto, R., Moreira, L., and Gimeno, L. (2014). The role of the Amazon Basin moisture in the atmospheric branch of the hydrological cycle: a Lagrangian analysis. Hydrol. Earth Syst. Sci. 18:2577. doi: 10.5194/hess-18-2577-2014
Drumond, A., Nieto, R., Gimeno, L., and Ambrizzi, T. (2008). A Lagrangian identification of major sources of moisture over Central Brazil and La Plata Basin. J. Geophys. Res. Atmos. 113, 1–9.
Durán-Quesada, A. M., Gimeno, L., and Amador, J. (2017). Role of moisture transport for Central American precipitation. Earth Syst. Dyn. 8, 147–161. doi: 10.5194/esd-8-147-2017
Durán-Quesada, A. M., Reboita, M., and Gimeno, L. (2012). Precipitation in tropical America and the associated sources of moisture: a short review. Hydrol. Sci. J. 57, 612–624. doi: 10.1080/02626667.2012.673723
Durán-Quesada, A. M., Gimeno, L., Amador, J. A., and Nieto, R. (2010). Moisture sources for Central America: Identification of moisture sources using a Lagrangian analysis technique. J. Geophys. Res. Atmos. 115, 1–15.
Gimeno, L. (2014). Oceanic sources of continental precipitation. Water Resour. Res. 50, 3647–3649. doi: 10.1002/2014wr015477
Gimeno, L., Dominguez, F., Nieto, R., Trigo, R., Drumond, A., Reason, C. J., et al. (2016). Major mechanisms of atmospheric moisture transport and their role in extreme precipitation events. Annu. Rev. Environ. Resour. 41, 117–141. doi: 10.1146/annurev-environ-110615-085558
Gimeno, L., Drumond, A., Nieto, R., Trigo, R. M., and Stohl, A. (2010). On the origin of continental precipitation. Geophys. Res. Lett. 37, 1–7.
Gimeno, L., Nieto, R., Drumond, A., Castillo, R., and Trigo, R. (2013). Influence of the intensification of the major oceanic moisture sources on continental precipitation. Geophys. Res. Lett. 40, 1443–1450. doi: 10.1002/grl.50338
Gimeno, L., Stohl, A., Trigo, R. M., Dominguez, F., Yoshimura, K., Yu, L., et al. (2012). Oceanic and terrestrial sources of continental precipitation. Rev. Geophys. 50, 1–41.
Hoecker, W. H. (1963). Three southerly low-level jet systems delineated by the Weather Bureau special pibal network of 1961. Month. Weather Rev. 91, 573–582. doi: 10.1175/1520-0493(1963)091<0573:tsljsd>2.3.co;2
Jiménez-Sánchez, G., Markowski, P. M., Jewtoukoff, V., Young, G. S., and Stensrud, D. J. (2019). The Orinoco low-level jet: an investigation of its characteristics and evolution using the WRF model. J. Geophys. Res. Atmos. 124, 10696–10711. doi: 10.1029/2019JD030934
Knippertz, P., Wernli, H., and Gläser, G. (2013). A global climatology of tropical moisture exports. J. Clim. 26, 3031–3045. doi: 10.1175/jcli-d-12-00401.1
Läderach, A., and Sodemann, H. (2016). A revised picture of the atmospheric moisture residence time. Geophys. Res. Lett. 43, 924–933. doi: 10.1002/2015GL067449
Landsberg, J., Romanini, D., and Kerstel, E. (2014). Very high finesse optical-feedback cavity-enhanced absorption spectrometer for low concentration water vapor isotope analyses. Opt. Lett. 39, 1795–1798. doi: 10.1364/OL.39.001795
Lima, D. C., Soares, P. M., Semedo, A., and Cardoso, R. M. (2018). A global view of coastal low-level wind jets using an ensemble of reanalyses. J. Clim. 31, 1525–1546. doi: 10.1175/jcli-d-17-0395.1
Marengo, J. A., Soares, W. R., Saulo, C., and Nicolini, M. (2004). Climatology of the low-level jet east of the Andes as derived from the NCEP-NCAR reanalyses: characteristics and temporal variability. J. Clim. 17, 2261–2280. doi: 10.1175/1520-0442(2004)017<2261:cotlje>2.0.co;2
Martin, E. R., and Schumacher, C. (2011). The Caribbean low-level jet and its relationship with precipitation in IPCC AR4 models. J. Clim. 24, 5935–5950. doi: 10.1175/jcli-d-11-00134.1
Martinez, J. A., and Dominguez, F. (2014). Sources of atmospheric moisture for the La Plata River basin. J. Clim. 27, 6737–6753. doi: 10.1175/JCLI-D-14-00022.1
Martín-Gómez, V., Hernández-Garcia, E., Barreiro, M., and López, C. (2016). Interdecadal variability of southeastern South America rainfall and moisture sources during the austral summertime. J. Clim. 29, 6751–6763. doi: 10.1175/jcli-d-15-0803.1
Means, L. L. (1952). On thunderstorm forecasting in the central United States. Month. Weather Rev. 80, 165–189. doi: 10.1175/1520-0493(1952)080<0165:otfitc>2.0.co;2
Montini, T. L., Jones, C., and Carvalho, L. M. (2019). The South American low-level jet: a new climatology, variability, and changes. J. Geophys. Res. Atmos. 124, 1200–1218. doi: 10.1029/2018jd029634
Morales Rodriguez, C. A. (2019). Thunderstorm efficiency regimes in South America as observed by STARNET and TRMM. J. Geophys. Res. Atmos. 124, 11428–11451. doi: 10.1029/2019jd030950
Newton, C. W. (1950). Structure and mechanism of the prefrontal squall line. J. Meteorol. 7, 210–222. doi: 10.1175/1520-0469(1950)007<0210:samotp>2.0.co;2
Nicolini, M., Salio, P., and Borque, P. (2006). “Thermodynamic and kinematic characterization of the low-level troposphere during SALLJEX under different large-scale environments,” in Proceedings of the Eighth International Conference on Southern Hemisphere Meteorology and Oceanography, Brazil.
Nicolini, M., Salio, P., Ulke, G., Marengo, J., Douglas, M., Paegle, J., et al. (2004). South American low-level jet diurnal cycle and three-dimensional structure. Clivar Exchang. 9, 6–9.
Nicolini, M., and Saulo, A. C. (2006). Modeled Chaco low-level jets and related precipitation patterns during the 1997-1998 warm season. Meteorol. Atmos. Phys. 94, 129–143. doi: 10.1007/s00703-006-0186-7
Nieto, R., and Gimeno, L. (2019). A database of optimal integration times for Lagrangian studies of atmospheric moisture sources and sinks. Sci. Data 6, 1–10.
Nieto, R., and Gimeno, L. P. (2018). Optimal Integration Times for Lagrangian Studies of Atmospheric Moisture Sources and Sinks. Zenodo. Available online at: https://doi.org/10.5281/zenodo
Numaguti, A. (1999). Origin and recycling processes of precipitating water over the Eurasian continent: Experiments using an atmospheric general circulation model. J. Geophys. Res. Atmos. 104, 1957–1972. doi: 10.1029/1998jd200026
Oliveira, M. I., Nascimento, E. L., and Kannenberg, C. (2018). A new look at the identification of low-level jets in South America. Month. Weather Rev. 146, 2315–2334. doi: 10.1175/mwr-d-17-0237.1
Parish, T. R., Rodi, A. R., and Clark, R. D. (1988). A case study of the summertime great plains low level jet. Month. Weather Rev. 116, 94–105. doi: 10.1175/1520-0493(1988)116<0094:acsots>2.0.co;2
Poveda, G., Jaramillo, L., and Vallejo, L. F. (2014). Seasonal precipitation patterns along pathways of South American low-level jets and aerial rivers. Water Resour. Res. 50, 98–118. doi: 10.1002/2013WR014087
Poveda, G., Waylen, P. R., and Pulwarty, R. S. (2006). Annual and inter-annual variability of the present climate in northern South America and southern Mesoamerica. Palaeogeogr. Palaeoclimatol. Palaeoecol. 234, 3–27. doi: 10.1016/j.palaeo.2005.10.031
Reboita, M. S., Gan, M. A., Rocha, R. P. D., and Ambrizzi, T. (2010). Precipitation regimes in South America: a bibliography review. Rev. Brasil. Meteorol. 25, 185–204.
Reboita, M. S., Oliveira, D. D., Freitas, C. D., Oliveira, G. D., and Pereira, R. D. A. (2015). Anomalias dos Padrões Sinóticos da Atmosfera na América do Sul nos Meses de Janeiro de 2014 e 2015. Rev. Brasil. Energ. Renov. 4, 1–12.
Rife, D. L., Pinto, J. O., Monaghan, A. J., Davis, C. A., and Hannan, J. R. (2010). Global distribution and characteristics of diurnally varying low-level jets. J. Clim. 23, 5041–5064. doi: 10.1175/2010jcli3514.1
Rocha, V. M., Correia, F. W. S., Silva, P. R. T. D., Gomes, W. B., Vergasta, L. A., Moura, R. G. D., et al. (2017). Precipitation recycling in the Amazon Basin: the role of moisture transport and surface evapotranspiration. Rev. Brasi. Meteorol. 32, 387–398.
Rodrigues, M. L. G., Franco, D., and Sugahara, S. (2004). Climatologia de frentes frias no litoral de Santa Catarina. Rev. Brasil. Geofís. 22, 135–151. doi: 10.1590/S0102-261X2004000200004
Salio, P., Nicolini, M., and Zipser, E. J. (2007). Mesoscale convective systems over southeastern South America and their relationship with the South American low-level jet. Month. Weather Rev. 135, 1290–1309. doi: 10.1175/mwr3305.1
Satyamurty, P., da Costa, C. P. W., and Manzi, A. O. (2013). Source of moisture for the Amazon Basin: a study of contrasting years. Theoret. Appl. Climatol. 111, 195–209. doi: 10.1007/s00704-012-0637-7
Saulo, A. C., Seluchi, M. E., and Nicolini, M. (2004). A case study of a Chaco low-level jet event. Month. Weather Rev. 132, 2669–2683. doi: 10.1175/mwr2815.1
Saulo, C., Ruiz, J., and Skabar, Y. G. (2007). Synergism between the low-level jet and organized convection at its exit region. Month. Weather Rev. 135, 1310–1326. doi: 10.1175/mwr3317.1
Silva, C. M., de Freitas, S. R., Gielow, R., and de Barros, S. S. (2009). Evaluation of high-resolution precipitation estimate over the Amazon Basin. Atmos. Sci. Lett. 10, 273–278. doi: 10.1002/asl.242
Sodemann, H., Schwierz, C., and Wernli, H. (2008). Interannual variability of Greenland winter precipitation sources: Lagrangian moisture diagnostic and North Atlantic Oscillation influence. J. Geophys. Res. Atmos. 113, 1–17.
Sodemann, H., and Stohl, A. (2009). Asymmetries in the moisture origin of Antarctic precipitation. Geophys. Res. Lett. 36, 1–5.
Song, J., Liao, K., Coulter, R. L., and Lesht, B. M. (2005). Climatology of the low-level jet at the southern Great Plains atmospheric boundary layer experiments site. J. Appl. Meteorol. 44, 1593–1606. doi: 10.1175/jam2294.1
Stohl, A., Hittenberger, M., and Wotawa, G. (1998). Validation of the Lagrangian particle dispersion model FLEXPART against large-scale tracer experiment data. Atmos. Environ. 32, 4245–4264.
Stohl, A., and James, P. (2004). A Lagrangian analysis of the atmospheric branch of the global water cycle. Part I: method description, validation, and demonstration for the August 2002 flooding in central Europe. J. Hydrometeorol. 5, 656–678.
Stohl, A., and James, P. (2005). A Lagrangian analysis of the atmospheric branch of the global water cycle. Part II: moisture transports between Earth’s ocean basins and river catchments. J. Hydrometeorol. 6, 961–984.
Stohl, A., Wotawa, G., Seibert, P., and Kromp-Kolb, H. (1995). Interpolation errors in wind fields as a function of spatial and temporal resolution and their impact on different types of kinematic trajectories. J. Appl. Meteorol. 34, 2149–2165.
Stull, R. B. (1988). “Mean boundary layer characteristics,” in An Introduction to Boundary Layer Meteorology, ed. R. B. Stull (Dordrecht: Springer), 1–27.
Van der Ent, R. J., Savenije, H. H., Schaefli, B., and Steele-Dunne, S. C. (2010). Origin and fate of atmospheric moisture over continents. Water Resour. Res. 46:9127. doi: 10.1029/2010WR009127
van der Ent, R. J., and Tuinenburg, O. A. (2017). The residence time of water in the atmosphere revisited. Hydrol. Earth Syst. Sci. 21, 779–790. doi: 10.5194/hess-21-779-2017
Velasco, I., and Fritsch, J. M. (1987). Mesoscale convective complexes in the Americas. J. Geophys. Res. Atmos. 92, 9591–9613.
Vera, C., Baez, J., Douglas, M., Emmanuel, C. B., Marengo, J., Meitin, J., et al. (2006). The South American low-level jet experiment. Bull. Am. Meteorol. Soc. 87, 63–78.
Whiteman, C. D., Bian, X., and Zhong, S. (1997). Low-level jet climatology from enhanced rawinsonde observations at a site in the southern Great Plains. J. Appl. Meteorol. 36, 1363–1376.
Xie, P., Chen, M., and Shi, W. (2010). “CPC unified gauge-based analysis of global daily precipitation,” in Proceedings of the 24th Conference on Hydrology, American Meteorological Society Annual Meeting, Vol. 2, Atlanta, GA.
Zemp, D. C., Schleussner, C. F., Barbosa, H. M. J., Van der Ent, R. J., Donges, J. F., Heinke, J., et al. (2014). On the importance of cascading moisture recycling in South America. Atmos. Chem. Phys. 14, 13337–13359.
Keywords: nocturnal low-level jet, South America, moisture transport, precipitation, Lagrangian model
Citation: Braz DF, Ambrizzi T, da Rocha RP, Algarra I, Nieto R and Gimeno L (2021) Assessing the Moisture Transports Associated With Nocturnal Low-Level Jets in Continental South America. Front. Environ. Sci. 9:657764. doi: 10.3389/fenvs.2021.657764
Received: 24 January 2021; Accepted: 23 March 2021;
Published: 22 April 2021.
Edited by:
Ashish Sharma, University of Illinois at Urbana-Champaign, United StatesReviewed by:
J. Alejandro Martinez, University of Antioquia, ColombiaCopyright © 2021 Braz, Ambrizzi, da Rocha, Algarra, Nieto and Gimeno. This is an open-access article distributed under the terms of the Creative Commons Attribution License (CC BY). The use, distribution or reproduction in other forums is permitted, provided the original author(s) and the copyright owner(s) are credited and that the original publication in this journal is cited, in accordance with accepted academic practice. No use, distribution or reproduction is permitted which does not comply with these terms.
*Correspondence: Dejanira Ferreira Braz, ZGVqYW5pcmEuYnJhekBpYWcudXNwLmJy; Tércio Ambrizzi, YW1icml6emlAbW9kZWwuaWFnLnVzcC5icg==; Rosmeri Porfírio da Rocha, cm9zbWVyaXJAbW9kZWwuaWFnLnVzcC5icg==; Iago Algarra, aWFsZ2FycmFAdXZpZ28uZXM=; Raquel Nieto, cm5pZXRvQHV2aWdvLmVz; Luis Gimeno, bC5naW1lbm9AdXZpZ28uZXM=
Disclaimer: All claims expressed in this article are solely those of the authors and do not necessarily represent those of their affiliated organizations, or those of the publisher, the editors and the reviewers. Any product that may be evaluated in this article or claim that may be made by its manufacturer is not guaranteed or endorsed by the publisher.
Research integrity at Frontiers
Learn more about the work of our research integrity team to safeguard the quality of each article we publish.