 Jiadong Peng1,2
 Qingxiang Li
95% of researchers rate our articles as excellent or good
Learn more about the work of our research integrity team to safeguard the quality of each article we publish.
Find out more
ORIGINAL RESEARCH article
Front. Environ. Sci. , 29 April 2021
Sec. Interdisciplinary Climate Studies
Volume 9 - 2021 | https://doi.org/10.3389/fenvs.2021.656794
This article is part of the Research Topic Advances in Global Warming Observations and their Uncertainties View all 17 articles
Based on the high-quality homogenized precipitation data from all 2,419 national weather stations in China, the climatology and anomaly percentage fields are derived, and then the digital elevation model (DEM) is employed to reduce the influence of elevation on the spatial interpolation accuracy of precipitation due to the unique topography in China. Then, the gradient plus inverse distance squared (GIDS) method and the inverse distance squared (IDS) method are used to grid the climatology field and the anomaly percentage field, respectively, and the 0.5 × 0.5° gridded datasets during 1961–2018 in China are obtained by combining them together. The evaluation shows that the mean absolute error (MAE) between the analysis value and the observation is 15.8 mm/month. The MAE in South China is generally higher than that in North China, and the MAE is obviously larger in summer than in other seasons. Specifically, 94.6, 54.4, 4.6, and 53.8% of the MAE are below 10 mm/month in winter (DJF), spring (MAM), summer (JJA), and autumn (SON), respectively, and 99.5, 79.9, 22.8, and 82.1% of them are less than 20 mm/month. The MAE over China in four seasons is 3.8, 13.2, 33.5, and 12.7 mm/month, respectively. This dataset has the potential of broad application prospects in the evaluations of weather and climate models and satellite products.
In the study of global or regional large-scale climate change, it is necessary to grid the climate series to effectively reduce or avoid spatial sampling errors (Shen et al., 2010; Wu and Gao, 2013; Zhao et al., 2014; Zhao and Zhu, 2015; Cheng et al., 2020). Precipitation is one of the most important meteorological elements. High-resolution gridded precipitation data are important input parameters for atmospheric, climatic, hydrological, and ecological models, and they are necessary for the evaluations of numerical forecast products. However, due to the geographical conditions and the shortage of meteorological observations, it may be difficult to obtain the accurate regional area precipitation amount in certain areas. Despite the difficulties, several daily or monthly precipitation series have been developed on regional scales in China in the past 30–100 years (Xie et al., 2007; Shen et al., 2010; Li et al., 2012; Wu and Gao, 2013; Zhao et al., 2014). However, a series of problems, such as the low density of stations, the uneven distribution of stations, the quality of raw data, and the inadequacy of interpolation methods, lead to the systematic evaluation on the gridded precipitation datasets still being open to discussion, especially using higher quality observation and more state-of-the-art interpolation methods.
Generally speaking, the accuracy of spatial gridded precipitation data depends not only on the interpolation methods but also on the observation station density, the geographical location, the climatic characteristics, and the impact systems of precipitation, and varies with seasons (Dai et al., 1997; Xie et al., 2007; Yatagai et al., 2009; Peng et al., 2019). Most of the gridded precipitation datasets over China used only hundreds of stations in total due to the data access limits, which will make it difficult to further reduce the accuracy of precipitation gridding (Chen et al., 2002; Hong et al., 2005). The other high-resolution datasets emphasized the improvement of the spatial distribution of stations but did not consider the inhomogeneity due to inconsistent observational schedules in different years, relocations of stations, etc., which will cause problems in long-term climate change trend detection (Shen et al., 2010; Wu and Gao, 2013; Zhao et al., 2014). In addition, topography, geomorphology, and underlying surface characteristics are also important factors that affect the accuracy of gridded data (Daly et al., 1994; Xiong et al., 2011). Due to the large spatial variability of precipitation, the error of direct interpolation is relatively large. Therefore, a climatology field with spatial continuity and with the influences of topography and geomorphology taken into consideration is usually constructed. Furthermore, a new element, such as precipitation difference Chen et al. (2002) or ratio Daly et al. (1994), is defined based on the climatology field for the spatial interpolation. Thereby, the interpolation error caused by the spatial discontinuity of precipitation can be reduced. It has been revealed that higher interpolation accuracy can be obtained by defining a ratio (Xie et al., 2007).
Therefore, based on the precipitation observation network in the currently highest density in Mainland China, the interpolation method through defining the anomaly percentage of monthly precipitation based on the climatology field is adopted in this study to generate a new monthly gridded precipitation dataset, and the systematic and random data errors of the gridded data are assessed with the cross-validation method. The remainder of this article is arranged as follows: Data and Methods introduces the main data sources, interpolation methods, and validation methods used to develop high-resolution gridded precipitation datasets in this study. The interpolation errors and validation results of climatology and anomaly data are presented in Gridding Error Analysis. Conclusion and Discussion provides final discussion and conclusions.
The monthly precipitation data from the period of January 1961 to December 2018 from the 2,419 national meteorological stations in China (excluding Hong Kong, Macao, and Taiwan) are used in this study. This dataset has been systematically homogenized and updated by Chinese scientists Li et al. (2012), Yang and Li (2014), and the 30-year (1981–2010) climatology dataset is derived. The digital elevation model (DEM) of GTOPO30 is used for the interpolation of precipitation.
There are various gridding methods for the meteorological data, with advantages and disadvantages in each one (Gyalistras 2003; Qiang et al., 2016). In the gridding of the climatology precipitation dataset, the accuracy of the spatial distribution of precipitation on various timescales (monthly and annual) should be ensured. More importantly, the interannual trend and inter-decadal changes of precipitation in each region should be maintained. That is, the gridded series should have “climate quality” and be uniform. Therefore, the climatic mean (i.e., multiyear average value and climatic background field) and the anomalies (i.e., deviations from the climatic mean) should be gridded separately. The gridding of climatic mean is relatively more complicated, since multiple factors such as topography must be taken into account. However, the gridding of anomalies is usually simpler, in which only the relative changes of precipitation at different moments (years and months) should be accurately described. Thus, the technical methods adopted are relatively simple.
In this study, the gridding of monthly precipitation data includes the following three steps. First, the gridded climatic background field of monthly precipitation is created. Then, the monthly precipitation ratio at each station is calculated and interpolated into the gridded field. The ratio is a new element defined based on the climatic background field, namely, the monthly precipitation anomaly percentage. Finally, the gridded monthly precipitation is generated by multiplying the gridded monthly precipitation anomaly percentage with the corresponding climatic background field.
Precipitation is discontinuously distributed, but its climatic mean demonstrates spatial continuity. The analysis errors caused by spatial discontinuity can be reduced or eliminated by constructing a gridded precipitation field based on the climatic background field; thus, the spatial interpolation accuracy can be significantly improved. In addition, the influence of topography on precipitation cannot be ignored. However, there is no effective method to amend the topographic effect on precipitation in the world. In this study, the gradient plus inverse distance squared (GIDS) method is adopted to grid the climatic mean field (Nalder and Wein, 1998; Price et al., 2000; Li et al., 2019). The advantage of this method over the IDS method is the consideration of gradients of meteorological elements with elevation, longitude, and latitude. Eq. 1 is as follows:
where N is the number of samples used in the calculation, with the maximum value of 9 in this study. The distances between all the stations and the prediction point S are calculated, and the stations with distance from S beyond 4° are excluded. Then, the stations nearest to S (9 stations at most) are selected for calculation. X, Y, and Z are the coordinate values (longitude, latitude, and elevation) of the prediction point, and Xi, Yi, and Zi are the coordinate values of the meteorological station i. Cx, Cy, and Cz are the regression coefficients between the meteorological element values and X, Y, and elevation Z, respectively. The regression coefficients are calculated by using X, Y, or elevation Z at all the stations and the corresponding meteorological element values through the multiple regression equation. di is the distance from the interpolation point to the station i, and 2 is the power of the distance. The calculations of gradients with elevation, longitude, and latitude are added in this formula based on the IDS method.
Precipitation varies significantly with elevation, and the gridded data with higher resolution are more favorable for amending the topographic effect. Therefore, the 0.05 × 0.05° DEM data in China are generated by resampling GTOPO30 data (30″ × 30″ resolution). At the same time, for better terrain correction, the climatic background field is first interpolated to the grid point of 0.05 × 0.05° to obtain more accurate and high-resolution gridded values by fully using the elevation information, and then the area average method is used to obtain the final required 0.5 × 0.5° data, similar to Cheng et al. (2020).
To reduce the interpolation error caused by the spatial discontinuity of precipitation, the monthly precipitation anomaly percentage defined based on the climatology value is gridded using the IDS method, instead of direct interpolation of the precipitation data. The IDS method is a deterministic interpolation method based on the principle of close similarity; that is, the closer two objects are, the more similar their values are, and vice versa (Dai et al., 1997). Eq. 2 of IDS is as follows:
where V (s) is the predicted value at the location s, N is the number of samples used in the interpolation (i.e., the number of stations), Vi is the value at the station i (i.e., the value of meteorological elements such as temperature and precipitation), di is the distance from the interpolation point to the station i, and 2 is the power of the distance.
The resolution of 0.5 × 0.5° is adopted for the precipitation anomaly gridding and for the final precipitation dataset.
The gridded precipitation data for a certain month are the product of the gridded precipitation anomaly percentage and the corresponding climatic background field, with a spatial resolution of 0.5 × 0.5°. Finally, a gridded dataset of monthly precipitation from 1961 to 2018 is constructed.
Since the value of gridded data is averaged over the grid, it is difficult to directly observe the true value. Therefore, there is no widely recognized estimation method for the gridded data error. The cross-validation method is being widely used at present, in which the error is estimated by analyzing various cross-validation statistics. It should be noted that the commonly used cross-validation method does not apply all the observed data to estimate the error, and as a result, the error is overestimated in some degree. On the other hand, a high correlation between the observation data and the gridded data may lead to underestimation of error. Even so, cross-validation is still the primary method used to analyze the gridded data error at present (Xiong et al., 2011).
Two cross-validation methods for the dataset are adopted in this study. In the first method, about 10% of the stations are removed randomly, similar to Jones et al. (2009). Then, the GIDS method is used to grid the climatology precipitation value, and the gridded value is interpolated to the removed 10% of the stations with the same method. The interpolated values are compared with the actual climatology values at these stations to obtain the errors. The same routine is repeated ten times with different stations removed each time, and the cross-validation errors at all the stations are obtained. Since only 90% of the data are used for grid interpolation, the accuracy of grid data is underestimated to a certain extent. However, the computation of interpolation with high spatial–temporal resolution, especially the cross-validation considering elevation, is very large. The method of keeping 10% of the station data for cross-validation is to limit the number of grid data calculations to 10 times in the process of the test, so as to keep the amount of calculation within a reasonable range. In the second method, a certain station is first removed, and then, the precipitation anomaly percentage is interpolated from the surrounding stations to this station with the IDS method. The interpolated value is compared with the actual value to obtain the errors and the correlation coefficients. The precipitation value at each station is derived by compositing the climatology value and the anomaly percentage obtained through the first method and the second method, and the cross-validation errors of precipitation are obtained by comparing the composited value with the actual value. The methods for assessment of cross-validation errors include mean absolute error (MAE) and root mean square error (RMSE).
The topography in China is complex, with obvious climatic contrast among different regions. To investigate the cross-validation errors of the gridding method described above in different climatic regions in China, the entire continent of China is divided into eight climatic regions. The distribution of meteorological stations and elevation in different regions is shown in Figure 1, and the climatological monthly precipitation of each region is shown in Figure 2. The precipitation in South China, East China, Southwest China, and Central China is the most, followed by Northeast and North China, and the precipitation in the Qinghai-Tibet Plateau and Northwest China is the least. The precipitation in JJA is the largest in a year for each region.
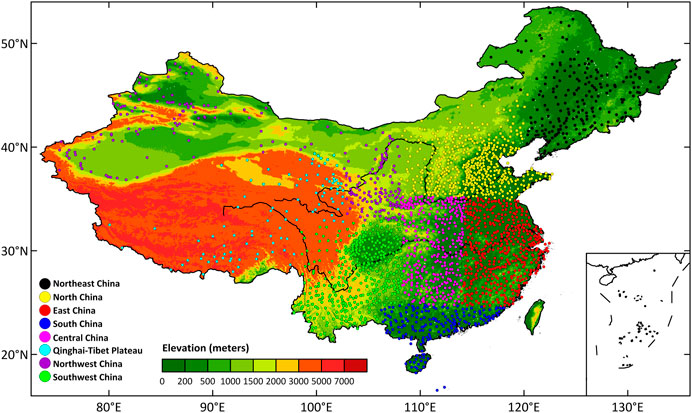
FIGURE 1. Distribution of meteorological stations and elevation in different regions of China.
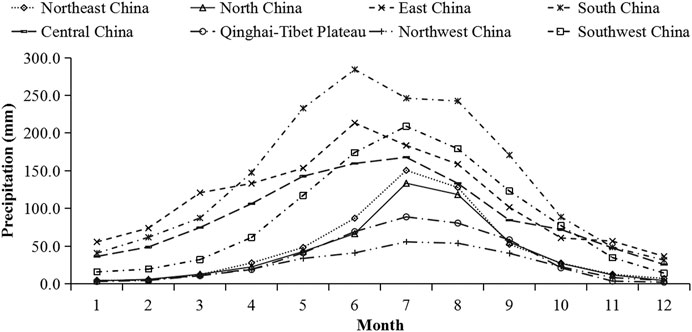
FIGURE 2. Climatological monthly precipitation of each region in China.
Tables 1,2 show the MAE and RMSE of cross-validation for the climatology precipitation value, respectively. It is indicated that the large errors are mainly distributed in South China and Southwest China, while the errors in Northeast China, North China, and Northwest China are relatively small (black marks in Tables 1,2). This is closely related to the abundance degree of precipitation in different regions, especially in South China and Southwest China, and the large undulation of topography in Southwest China. However, the precipitation amount in the Qinghai–Tibet region is low, but the error is relatively large, which can be attributed to the sparse meteorological stations in this region. According to the temporal distribution, the errors in each region from June to August are significantly higher than those in other months (black marks in Tables 1,2), which is closely related to the concentrated rainfall in this period.
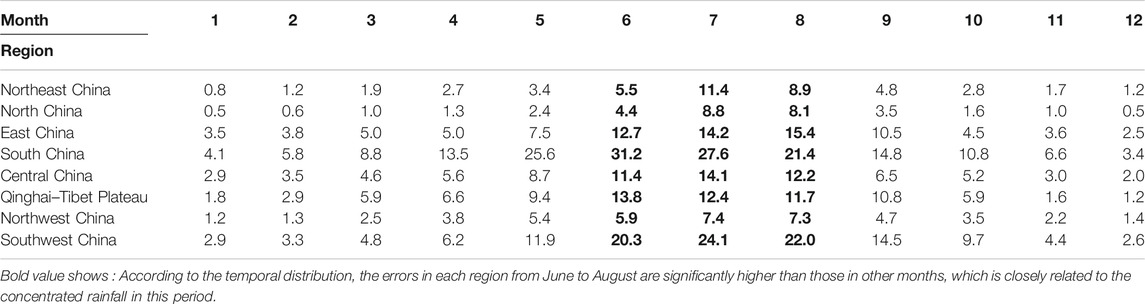
TABLE 1. MAE of cross-validation for the climatology value (unit: mm).
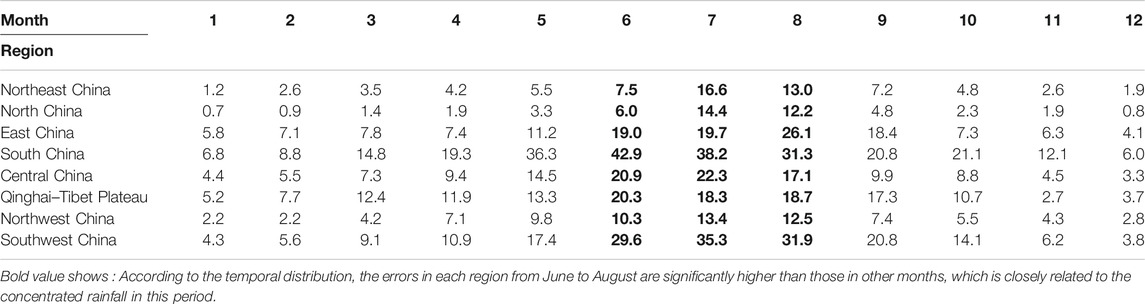
TABLE 2. RMSE of cross-validation for the climatology value (unit: mm).
Figure 3 shows the spatial distributions of the MAE in each season. It can be seen that the MAE in southern regions is generally higher than that in northern regions in each season; 79.8, 55.7, 23.6, and 54.9% of the MAE are below 3 mm/month in DJF, MAM, JJA, and SON, respectively, and 96.6, 85.4, 59.8, and 86.3% of them are less than 10 mm/month. The MAE is 2.0, 5.6, 13.2, and 5.4 mm/month in DJF, MAM, JJA, and SON, respectively, with the error being largest in JJA. Throughout the whole year, the MAE for 53.5 and 82.0% of the samples is lower than 3 and 10 mm/month, respectively (Figure 4).
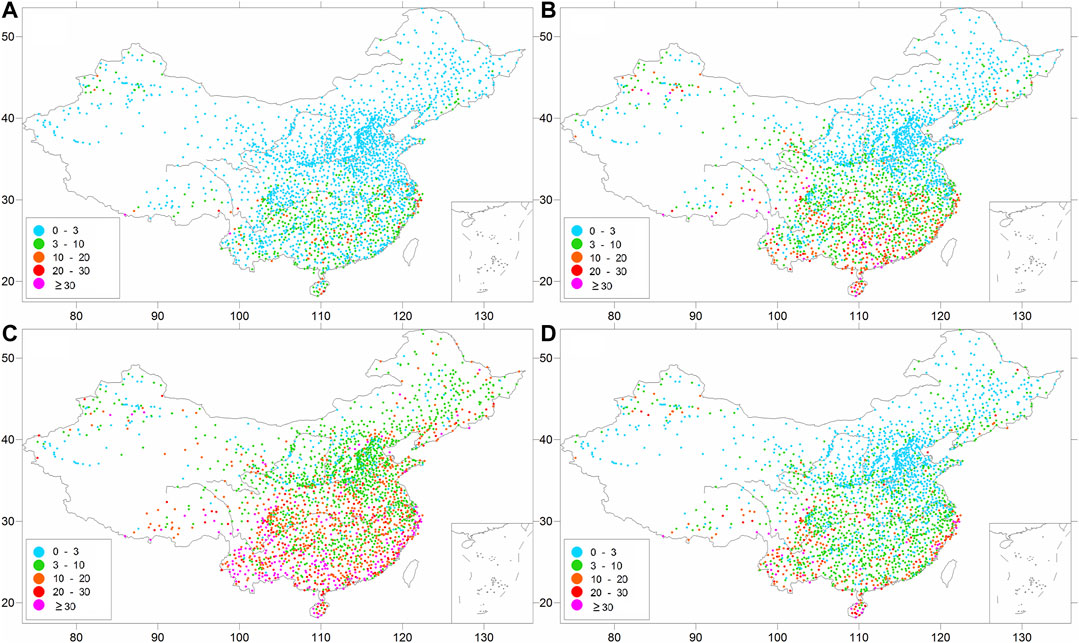
FIGURE 3. Spatial distributions of the MAE for the climatology values (unit: mm/month) in (A) DJF, (B) MAM, (C) JJA, and (D) SON.
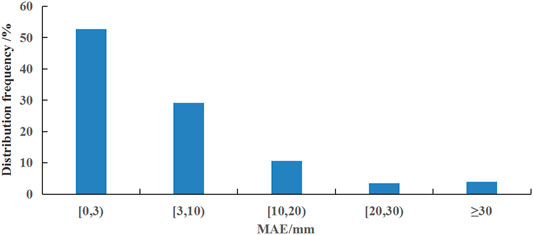
FIGURE 4. Frequency distribution of the MAE for the climatology values.
Tables 3,4 show the MAE and the RMSE for the cross-validation of precipitation anomaly percentage, respectively. They show that the large errors are mainly distributed in Qinghai–Tibet and Northwest China, while the errors in other areas are relatively small. This distribution is associated with the sparse stations in the above two regions, which leads to the increased interpolation errors. In addition, the small climatology value of precipitation and the large spatial difference of precipitation anomaly percentage can also result in large errors in these regions. The temporal distribution indicates that the monthly errors in the rainy season are higher than those in the non-rainy season in North China, Central China, and East China, which is due to the relatively intense rainfall in this period. However, in the other regions, the errors in the non-rainy months are significantly higher than those in the rainy months, which is attributed to the small climatology value of precipitation in these regions, resulting in the large spatial difference of precipitation anomaly percentage. In general, the cross-interpolated precipitation anomaly percentage sequence is well correlated with the actual one, with the correlation coefficients generally being above 0.7 (Table 5) and the minimum value being in July and August, basically (black marks in Table 5).
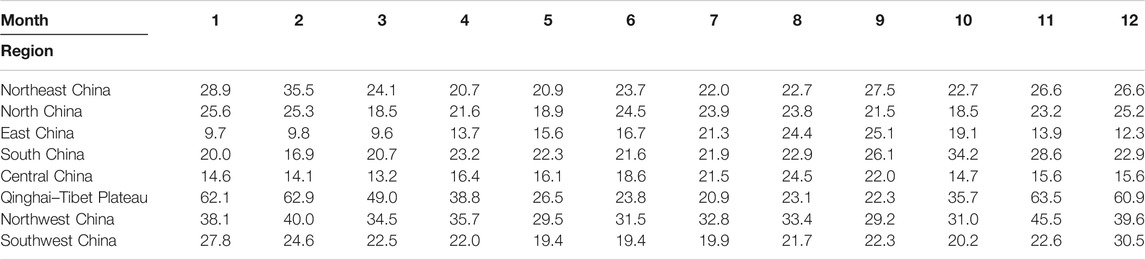
TABLE 3. MAE for cross-validation of the precipitation anomaly percentage (unit: %).
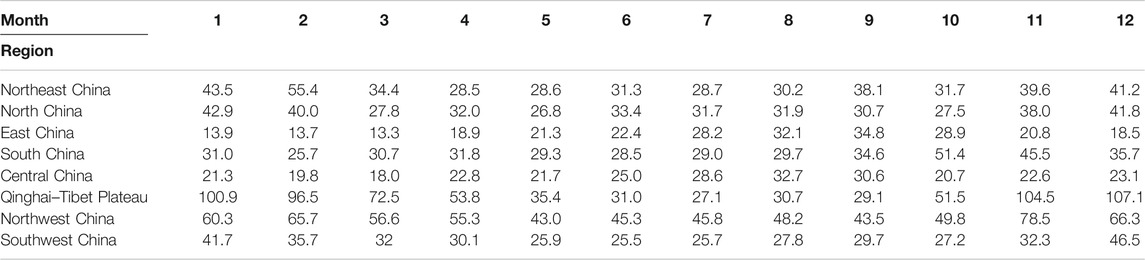
TABLE 4. RMSE for cross-validation of precipitation anomaly percentage (unit: %).
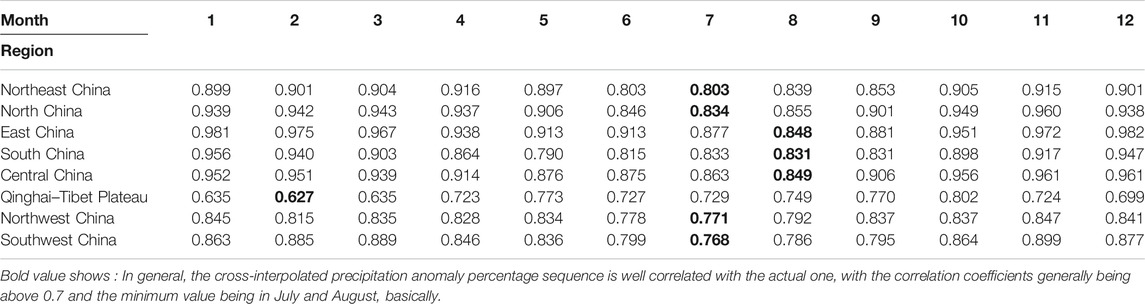
TABLE 5. Correlation coefficients for the cross-validation of precipitation anomaly percentage.
Figure 5 shows the spatial distributions of correlation coefficients for the cross-validation of precipitation anomaly percentage in January, April, July, and October. It is shown that the correlation coefficient in the eastern regions is generally higher than that in the western regions. This is due to the small climatology value of precipitation and the large spatial difference of precipitation anomaly percentage, and also the sparse stations in the western regions. The correlation coefficients at 76.8, 64.1, 19.3, and 69.5% of the stations are above 0.9 in January, April, July, and October, respectively, and those at 94.9, 96.3, 90.2, and 96.8% of the stations are above 0.7 in these four months. The mean correlation coefficients are 0.915, 0.894, 0.823, and 0.913, with the smallest value being in July. This is closely related to the abundance degree of precipitation and high frequency of convectional precipitation in this particular month. Throughout the whole year, the correlation coefficients for 55.4 and 94.8% of the samples are above 0.9 and 0.7, respectively (Figure 6).
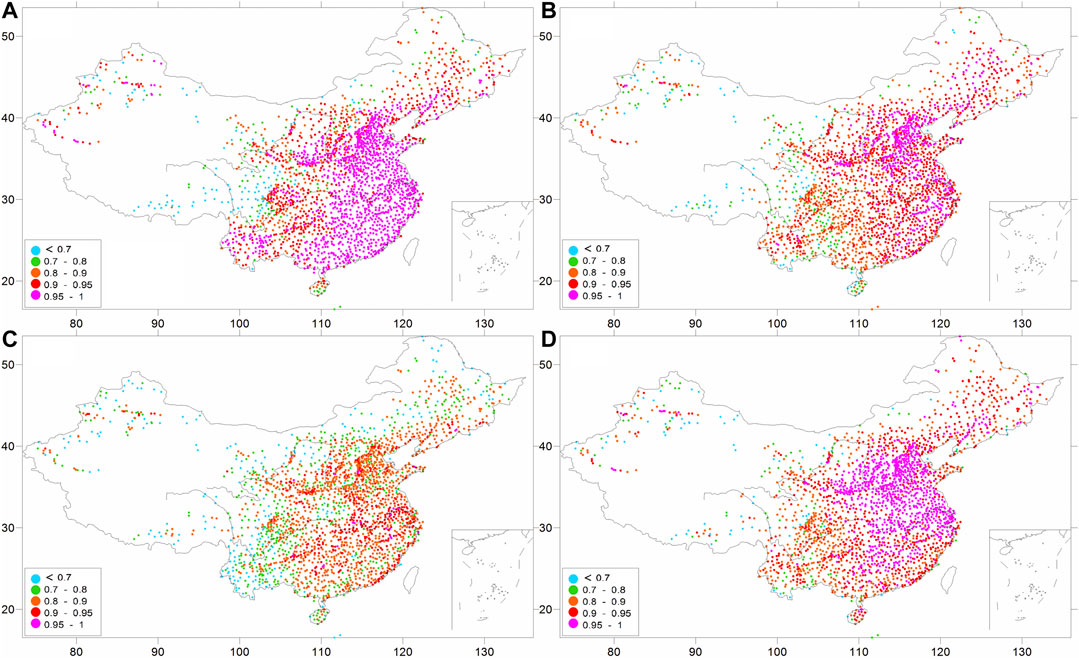
FIGURE 5. Spatial distributions of correlation coefficients for the cross-validation of precipitation anomaly percentage in (A) January, (B) April, (C) July, and (D) October.
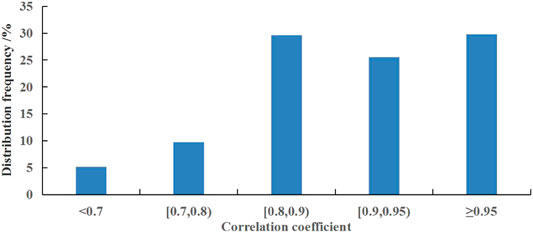
FIGURE 6. Frequency distribution of correlation coefficients for the cross-validation of precipitation anomaly percentage.
Tables 6,7 show the MAE and the RMSE for the precipitation cross-validation, respectively. It is indicated that the temporal and spatial distribution of errors for the precipitation are similar to those of climatology value, which in areas or months with high precipitation are greater than those in areas or months with low precipitation, especially South China and Southwest China in space and JJA in time (black marks in Tables 6,7).
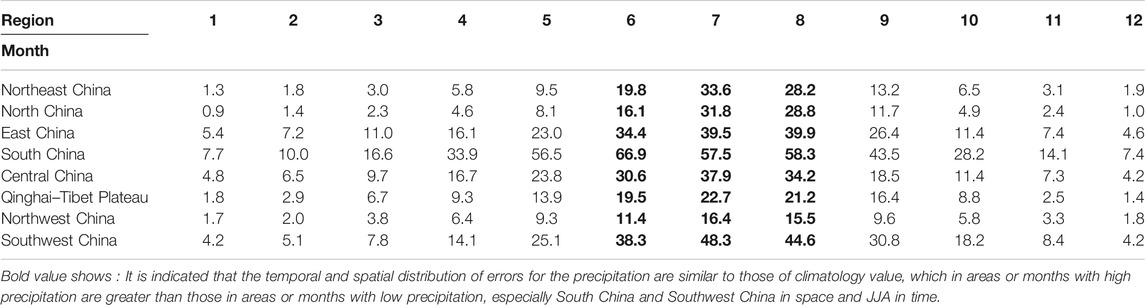
TABLE 6. MAE for the cross-validation of precipitation (unit: mm).
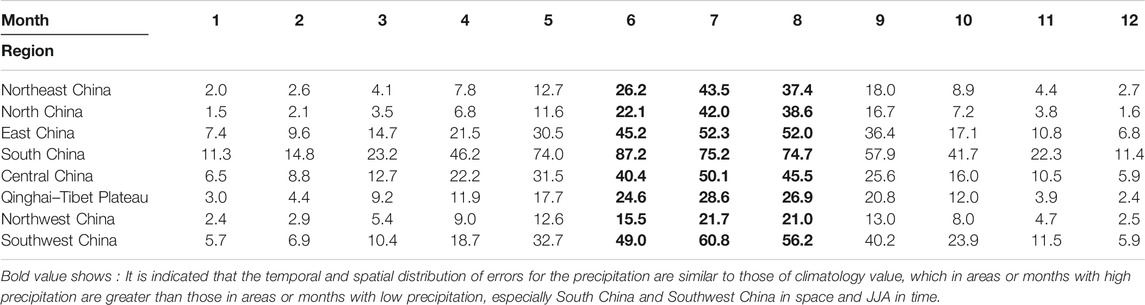
TABLE 7. RMSE for the cross-validation of precipitation (unit: mm).
Figure 7 demonstrates the spatial distributions of the MAE for the precipitation in each season. The MAE in southern regions is generally higher than that in northern regions in each season, which is closely related to the abundance degree of precipitation in southern regions compared to that in northern regions. The MAE for 94.6, 54.4, 4.6, and 53.8% of the samples in China is below 10 mm/month in DJF, MAM, JJA, and SON, respectively, and 99.5, 79.9, 22.8, and 82.1% of the samples show the MAE below 20 mm/month. The MAE is 3.8, 13.2, 33.5, and 12.7 mm/month, with the largest value being in JJA, which is also closely related to the concentrated rainfall in this period. Over the whole year, the MAE for 51.8 and 71.1% of the samples is less than 10 and 20 mm/month, respectively (Figure 8).

FIGURE 7. Spatial distributions of the MAE for the precipitation (unit: mm/month) in (A) DJF, (B) MAM, (C) JJA, and (D) SON.
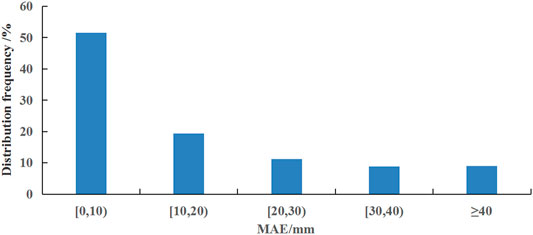
FIGURE 8. Frequency distribution of the MAE for the cross-validation of precipitation.
Based on the high-quality precipitation data from 2,419 meteorological stations in China, the climatic mean field and the anomaly percentage field are derived and gridded with the GIDS and IDS methods, respectively. The DEM data are employed to reduce the influence of elevation on the spatial interpolation accuracy of precipitation due to the unique topography in China. The 0.5 × 0.5° surface gridded dataset during 1961–2018 in China is obtained, and the accuracy evaluation is carried out. The main conclusions are as follows.
The cross-validation for the climatic precipitation shows that 79.8, 55.7, 23.6, and 54.9% of the MAE are below 3 mm/month in DJF, MAM, JJA, and SON, respectively, and 96.6, 85.4, 59.8, and 86.3% of them are below 10 mm/month. The MAE in the four seasons is 2.0, 5.6, 13.2, and 5.4 mm/month, respectively. The spatial distribution shows that the MAE in southern regions is generally higher than that in northern regions in each season, which is closely related to the abundance degree of precipitation in southern regions compared to that in northern regions. Among the four seasons, the MAE in JJA is the largest, which is closely related to the concentrated rainfall in this period.
The cross-validation for the precipitation anomaly percentage indicates that the correlation coefficients at 76.8, 64.1, 19.3, and 69.5% of the stations are above 0.9 in January, April, July, and October, respectively, and the correlation coefficients at 94.9, 96.3, 90.2, and 96.8% of the stations are above 0.7. The national mean correlation coefficients in the four months are 0.915, 0.894, 0.823, and 0.913, respectively. In the spatial distribution, the correlation coefficient in the eastern regions is generally higher than that in the western regions, which is associated with the small climatology value of precipitation and the large spatial difference of precipitation anomaly percentage, and also the sparse stations in the western regions. In terms of temporal distribution, the correlation coefficient in July is the smallest, which is closely related to the abundance degree of precipitation and high frequency of convectional precipitation in this particular month.
Regarding the cross-validation for the precipitation, the MAE for 94.6, 54.4, 4.6, and 53.8% of the samples is less than 10 mm/month in DJF, MAM, JJA, and SON, respectively, and 99.5, 79.9, 22.8, and 82.1% of the samples show the MAE below 20 mm/month. The MAE in the four seasons is 3.8, 13.2, 33.5, and 12.7 mm/month, respectively. Spatially, the MAE in southern regions is generally higher than that in northern regions in each season, which is closely related to the abundance degree of precipitation in southern regions compared to that in northern regions. The temporal distribution presents the largest MAE in JJA, which is also closely related to the concentrated rainfall in this period.
Compared with the other research in China, our precipitation grid product has a similar accuracy. For example, Zhao et al. (2014) established the monthly grid precipitation datasets in China by using the TPS (thin plate spline) method, and the MAE for 51.5 and 75.2% of the samples was less than 5 mm/month and 15 mm/month for the whole year, respectively. However, their calculation of the MAE did not involve a cross-validation method, and that may lead to underestimation of error. Xiong et al. (2011) constructed the daily grid precipitation datasets in China by using the Barnes method, and the MAE was 1.3 mm/day for the whole year, and 0.25, 1.03, 3.06, and 0.85 mm/day in DJF, MAM, JJA, and SON, respectively.
The primary purpose of this study is to meet the urgent need in agriculture, hydrological modeling, and other fields. However, it should be pointed out that the gridding of station observation data is a very complex work. Taking this study as an example, there is still a lot to be improved. These include the following:
(1) More observation data should be collected. In addition to the stations used in this study, there are a large number of rainfall stations with a relatively poor observation quality in China. In the future, we can consider using these observations in interpolation after quality control by appropriate methods and fusion of satellite and radar data, which will greatly improve the accuracy of the final grid data, especially in the regions with scarcity in observations, such as the Qinghai–Tibet Plateau.
(2) More methods or parameterization schemes should be applied to the development and assessment of grid products, similar to Cheng et al. (2020), Newlands et al. (2011). In this way, we can choose the best method or scheme to improve the accuracy of the grid.
Due to the scarcity of stations in western China, especially on the Tibetan Plateau, with few observations in present, it is difficult to evaluate the gridded precipitation dataset qualitatively and quantitatively. The users are suggested to be cautious when using the data from these regions in scientific research.
The original contributions presented in the study are included in the article/Supplementary Material, further inquiries can be directed to the corresponding author.
JP, LD, and WX analyzed the data. QL put forward the idea. JP wrote the manuscript. All authors revised the manuscript.
This study was supported by National Natural Science Foundation of China (Grant 42005058) and Natural Science Foundation of Hunan Provence (Grant 2020JJ5298)
The authors declare that the research was conducted in the absence of any commercial or financial relationships that could be construed as a potential conflict of interest.
The authors thank the editor and the reviewers for their constructive suggestions/comments in the initial reviews.
Chen, M., Xie, P., Janowiak, J. E., and Arkin, P. A (2002). Global Land Precipitation: A 50-year Monthly Analysis Based on Gauge Observations. J. Hydrometeorol. 3 (3), 249–266. doi:10.1175/1525-7541(2002)003<0249:glpaym>2.0.co;2
Cheng, J., Li, Q., Chao, L., Maity, S., Huang, B., and Jones, P. (2020). Development of High Resolution and Homogenized Gridded Land Surface Air Temperature Data: A Case Study over Pan-East Asia. Front. Environ. Sci. 8, 1–14. doi:10.3389/fenvs.2020.588570
Dai, A., Fung, I. Y., and Del Genio, A. D. (1997). Surface Observed Global Land Precipitation Variations during 1900–88. J. Clim. 10, 2943–2962. doi:10.1175/1520-0442(1997)0102.0.CO;2
Daly, C., Neilson, R. P., and Phillips, D. L. (1994). A Statistical-Topographic Model for Mapping Climatological Precipitation over Mountain Terrain. J. Appl. Meteorol. 33 (2), 140–158. doi:10.1175/1520-0450(1994)0332.0.CO;2
Gyalistras, D. (2003). Development and Validation of a High-Resolution Monthly Gridded Temperature and Precipitation Data Set for switzerland (1951-2000). Clim. Res. 25, 55–83. doi:10.3354/cr025055
Hong, Y., Nix, H. A., Hutchinson, M. F., and Booth, T. H. (2005). Spatial Interpolation of Monthly Mean Climate Data for china. Int. J. Climatol. 25, 1369–1379. doi:10.1002/joc.1187
Jones, D., Wang, W., and Fawcett, R. (2009). High-quality Spatial Climate Data-Sets for Australia. Amoj 58, 233–248. doi:10.22499/2.5804.003
Li, Q., Peng, J., and Shen, Y. (2012). Development of China Homogenized Monthly Precipitation Dataset during 1900-2009. J. Geogr. Sci. 22, 579–593. doi:10.1007/s11442-012-0948-8
Li, K. Y., Zhou, M., Chen, J. Y., Pan, M. M., Li, C. R., and Tang, L. L. (2019). An Approach of Improved Gradient Plus Inverse Distance Squared for Spatial Interpolation of Temperature (In Chinese). J. Univ. Chin. Acad. Sci. 36, 491–497.
Nalder, I. A., and Wein, R. W. (1998). Spatial Interpolation of Climatic Normals: Test of a New Method in the Canadian Boreal Forest. Agric. For. Meteorology 92, 211–225. doi:10.1016/S0168-1923(98)00102-6
Newlands, N. K., Davidson, A., Howard, A., and Hill, H. (2011). Validation and Inter-comparison of Three Methodologies for Interpolating Daily Precipitation and Temperature across Canada. Environmetrics 22, 205–223. doi:10.1002/env.1044
Peng, S., Ding, Y., Liu, W., and Li, Z. (2019). 1 Km Monthly Temperature and Precipitation Dataset for China from 1901 to 2017. Earth Syst. Sci. Data 11, 1931–1946. doi:10.5194/essd-11-1931-2019
Price, D. T., McKenney, D. W., Nalder, I. A., Hutchinson, M. F., and Kesteven, J. L. (2000). A Comparison of Two Statistical Methods for Spatial Interpolation of Canadian Monthly Mean Climate Data. Agric. For. Meteorology 101, 81–94. doi:10.1016/S0168-1923(99)00169-0
Qiang, F., Zhang, M., Wang, S., Liu, Y., Ren, Z., and Zhu, X. (2016). Estimation of Areal Precipitation in the Qilian Mountains Based on a Gridded Dataset since 1961. J. Geogr. Sci. 26, 59–69. doi:10.1007/s11442-016-1254-7
Shen, Y., Feng, M. N., Zhang, H. Z., and Gao, F. (2010). Interpolation Methods of China Daily Precipitation Data(in Chinese). J. Appl. Meteorol. Sci. 21, 279–286. doi:10.3969/j.issn.1001-7313.2010.03.003
Wu, J., and Gao, X. (2013). A Gridded Daily Observation Dataset over China Region and Comparison with the Other Datasets (In Chinese). Chin. J. Geophy 56, 1102–1111. doi:10.6038/cjg2013040610.1007/s11431-013-5390-3
Xie, P., Chen, M., Yang, S., Yatagai, A., Hayasaka, T., Fukushima, Y., et al. (2007). A Gauge-Based Analysis of Daily Precipitation over East Asia. J. Hydrometeorol. 8, 607–626. doi:10.1175/JHM583.1
Xiong, Q. F., Huang, M., Xiong, M. Q., and Hu, J. L. (2011). Cross-Validation Error Analysis of Daily Gridded Precipitation Based on China Meteorological Observations (In Chinese). Plateau Meteorology 30, 1615–1625. doi:10.1016/B978-0-444-53599-3.10005-8
Yang, S., and Li, Q. X. (2014). Improvement in Homogeneity Analysis Method and Update of China Precipitation Data (In Chinese). Clim. Change Res. 10, 276–281. doi:10.3969/j.issn.1673-1719.2014.04.008
Yatagai, A., Arakawa, O., Kamiguchi, K., Kawamoto, H., Nodzu, M. I., and Hamada, A. (2009). A 44-year Daily Gridded Precipitation Dataset for Asia Based on a Dense Network of Rain Gauges. SOLA 5, 137–140. doi:10.2151/sola.2009-035
Zhao, Y. F., and Zhu, J. (2015). Assessing Quality of Grid Daily Precipitation Datasets in China in Recent 50 years(in Chinese). Plateau Meteorology 34, 50–58.
Keywords: China, precipitation, GIDS, IDS, gridded dataset, accuracy evaluation
Citation: Peng J, Duan L, Xu W and Li Q (2021) Development and Assessment of the Monthly Grid Precipitation Datasets in China. Front. Environ. Sci. 9:656794. doi: 10.3389/fenvs.2021.656794
Received: 21 January 2021; Accepted: 09 April 2021;
Published: 29 April 2021.
Edited by:
Folco Giomi, Independent researcher, Milan, ItalyReviewed by:
Nathaniel K. Newlands, Agriculture and Agri-Food Canada (AAFC), CanadaCopyright © 2021 Peng, Duan, Xu and Li. This is an open-access article distributed under the terms of the Creative Commons Attribution License (CC BY). The use, distribution or reproduction in other forums is permitted, provided the original author(s) and the copyright owner(s) are credited and that the original publication in this journal is cited, in accordance with accepted academic practice. No use, distribution or reproduction is permitted which does not comply with these terms.
*Correspondence: Qingxiang Li, bGlxaW5neDVAbWFpbC5zeXN1LmVkdS5jbg==
†Present address: Southern Laboratory of Ocean Science and Engineering (Guangdong Zhuhai), Zhuhai, China
Disclaimer: All claims expressed in this article are solely those of the authors and do not necessarily represent those of their affiliated organizations, or those of the publisher, the editors and the reviewers. Any product that may be evaluated in this article or claim that may be made by its manufacturer is not guaranteed or endorsed by the publisher.
Research integrity at Frontiers
Learn more about the work of our research integrity team to safeguard the quality of each article we publish.