 Xuan Li
 Shibo Fang
 Yongchao Zhu3
- 1State Key Laboratory of Severe Weather, Chinese Academy of Meteorological Sciences, Beijing, China
- 2Academy of Applied Meteorology, Nanjing University of Information Science & Technology, Nanjing, China
- 3Meteorological Observation Center, China Meteorological Administration, Beijing, China
There have been few pieces of research focused on quantifying wheat yield loss risk based on high-resolution long-term historical data. What is more, the existence of the area scale effect reduces the certainty and spatial comparability of results. In this study, long-term wheat yield and planting area data at the county level from 1981 to 2010 were used. The spatial distribution of wheat yield loss risks was analyzed in the mainland of the People’s Republic of China (China for short). An improved comprehensive risk index of yield loss risk was established by integrating the reduction rate, coefficient of variation, and the probability of occurrence for different yield reduction rates after removing the effect of area scale. 874 main wheat-growing counties in the mainland of China were divided into lowest, lower, moderate, higher, and highest risk areas based on it. The high-risk areas are located in Yellow-Huai-Hai Plain, including Shandong, Henan, northern Anhui, and parts of Jiangsu Province.
Introduction
The world food production has grown rapidly over the past few decades, but there are significant regional differences (FAO 2001; Lin et al., 2006). China has 22% of the world’s population on 7% of the world’s arable land, with a per capita land area of just 0.093 ha, and its population is growing at a rate of more than 10 million people a year, China’s food demand will continue to increase (Chen and Zhou, 2002). At present, we are also faced with the continuous reduction of grain crop acreage, unit area yield growth rate slowdown, and other issues (Zhang et al., 2005).
With the development of human society in the 21st century, the global climate is different from the past and has undergone great changes, such as the increase of temperature, the increase of atmospheric CO2 concentration, and the change of precipitation distribution (He et al., 2011). Climate change will affect all economic sectors, but agricultural production will be the most sensitive and vulnerable one, in both developed and developing countries. The increase in food production is mainly due to advances in science technology, improved facilities, and increased inputs (such as the increased use of fertilizer in China, especially after 2003), but the natural climate remains a major determinant of agricultural productivity which could account for at least 30% of fluctuations/variations in food production (Lobell and Field, 2007; Li et al., 2009; Ray et al., 2015).
The frequency and intensity of agrometeorological disasters also have an obvious upward trend, with drought-affected land areas expected to increase from 15.4 to 44% in 2100 (Li et al., 2009; Wang et al., 2014). These impacts will lead to increased agricultural water demand, further widening of regional disparities in water supply (Lin et al., 2006). Then significant increase in costs and investment is needed, and the plant structure and distribution pattern of agricultural production should be adjusted (Lin et al., 2006), which aims to deal with the increased uncertainties in agricultural production and maintain the stability of grain production (Pu et al., 2007; Fang et al., 2011). It can further aggravate the contradiction of insufficient agricultural resources when people use more land to compensate for lower total food production or increase the total amount of crops grown each year when land is scarce (Litsinger, 1991). In addition, adverse weather factors caused by the decline in crop quality and other agricultural loss events are also causing concern (Tian et al., 2011).
Risk assessment of crop yield loss is one of the key components of sustainable agricultural development and answering the questions on risks and uncertainties brought by climate change (Lobell and Gourdji, 2012; Wang et al., 2015). Up to now, there have been a lot of researches on disaster risk, which mainly focus on the content of the assessment, method, index, and application of new technology (Dilley et al., 2005; Li et al., 2009; Yang et al., 2015).
China pays more attention to the risk assessment of agrometeorological disasters. At present, the study of risk assessment of agrometeorological disasters can be divided into two categories. One is to infer the risk from the causes, such as the level of disaster and crop characteristics (Lin et al., 2009). This kind of method is adopted by many evaluation models, which has the advantage of reflecting the mechanism of grain loss and giving a clear and reasonable explanation to the results. However, the assessment results are often questioned because the method often fails to take into account all hazard factors and diverse crop characteristics. For example, some scholars only focus on one or a combination of several meteorological factors (such as temperature, precipitation, and solar radiation) when analyzing the effects of meteorological factors on crop yields (Xue et al., 2003; Li et al., 2014; Yang et al., 2015), or use models to predict crops’ responses to climate change and possible disaster losses (Tollenaar and Lee, 2002; Jia et al., 2012; Rosenzweig et al., 2014; Iizumi et al., 2017). But actual crop yields are the result of a combination of natural conditions, crop characteristics, and socioeconomic factors (Lobell et al., 2006). Because of the complexity of the agricultural system and yield formation (Andrade, 1995; Arihara and Karasawa, 2000), the accuracy of the assessment will be reduced by the uncertainties on physical, biochemical, and parametric processes which are used in climate–crop models (Lobell et al., 2006). In addition, there are some uncertainties or errors in the results from climate simulation, which may be increased when the simulation output is used in crop models. Thus, only parts of the practice of model simulation have high enough credibility (Challinor et al., 2018).
The other method is to directly infer the risk of grain losses from the results of disaster, such as the grain yield and disaster affecting areas (Xue et al., 2003; Chen et al., 2009; Qian et al., 2016; Han et al., 2017; Lu et al., 2017). The coefficient of variation, the rate of meteorological yield reduction, the probability of yield reduction, and so on are all the traditional indexes that can express the fluctuation/variation of yield. Some studies use the product of comprehensive loss risk indicators, which could be the product of risk index, average yield reduction rate and variation coefficient of yield reduction, or a weighted average of several factors (Xue et al., 2005; Chen et al., 2009; Liu et al., 2013). This method can directly express the actual risk of losses because it can include all disaster-causing factors, crop characteristics, and the ultimate impact of human intervention, although it is not helpful for explaining the mechanism of yield losses.
There have been few pieces of research on the actual damage status and fluctuation characteristics based on long-term historical grain yield data. The resolution of some results is often coarse, such as at provincial scale (Wang et al., 2007), or is only high in a small research area (Ma et al., 2008; Han et al., 2017). In addition, the effects of area scale (explained in detail in the next paragraph) have not been taken into account in past studies of risk analysis. Some researches show the influence of crop area when the economic benefits are considered, and some other studies take disaster affecting area as a measure of disaster degree (Zhang, 2004; Ma et al., 2008; Hao et al., 2012; IPCC et al., 2014). Those influences of area are not the effects of area scale we call in this study.
Most of China’s farmlands are in eastern China including Heilongjiang, Hebei, Henan, and Shandong Province, and most of the counties here have a large area (Hao et al., 2012). The planting area in the county which is the basic administrative unit in China affected the result of risk assessment. The yield data collected from fields or farms were integrated into county-level data. The large planting area could lead to more yields, then the yield data show relative stability, which could cause the underestimation of yield reduction rate and coefficient of variation. By the way, the method of increasing production through increased planting area is threatening food security due to the increasing competition for land (Litsinger, 1991; Challinor et al., 2018). Therefore, we need to pay more attention to the area scale effect. The effect of planting area scale leading to underestimation/overestimation of yield loss risk is defined as the “effect of area scale” in this study. The standardized planting area was introduced as a factor to eliminate or mitigate the effect.
This study aims to provide high-resolution information on the spatial distribution of wheat yield loss risk based on a new comprehensive risk index, which was established by combining the reduction rate, coefficient of variation, and probability of yield reduction after removing the area effect. The proposed index can improve the spatial comparability of the risk. The results may be crucial for agricultural decision-support systems and climate change assessments.
Materials and Methods
Materials
The total sown area and total wheat yield data from 1981 to 2010 at the provincial level in mainland China is collected by the National Bureau of Statistics of the People’s Republic of China, while Chongqing only has statistics from 1996 to 2010 (Figure 1).
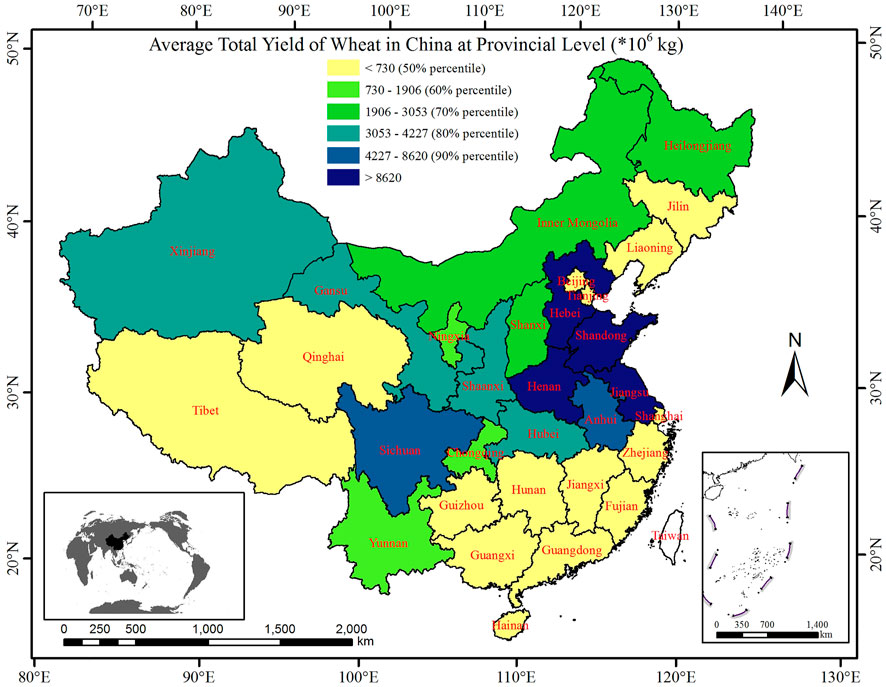
FIGURE 1. Distribution of the average total yield of wheat in mainland China at the provincial level.
The selected data in this study include planting area, total yield, and yield per unit area of wheat from 2,225 counties in mainland of China from 1981 to 2010, which was collected by the Ministry of Agriculture and Rural Affairs of the People’s Republic of China (Figure 2). The wheat is not classified into winter wheat and spring wheat in our study. The yield per unit area (kg ha−1) was calculated from the planting area and total yield data. A few counties have less than 30-year continuous data. Thus, counties with at least 15-year data were selected in the study. The range of planting area is quite large, of which the minimum value is only 2 ha in Lang County, Tibet Autonomous Region (Tibet for short), and the maximum is 199,043 ha in Nong’an County, Jilin Province.
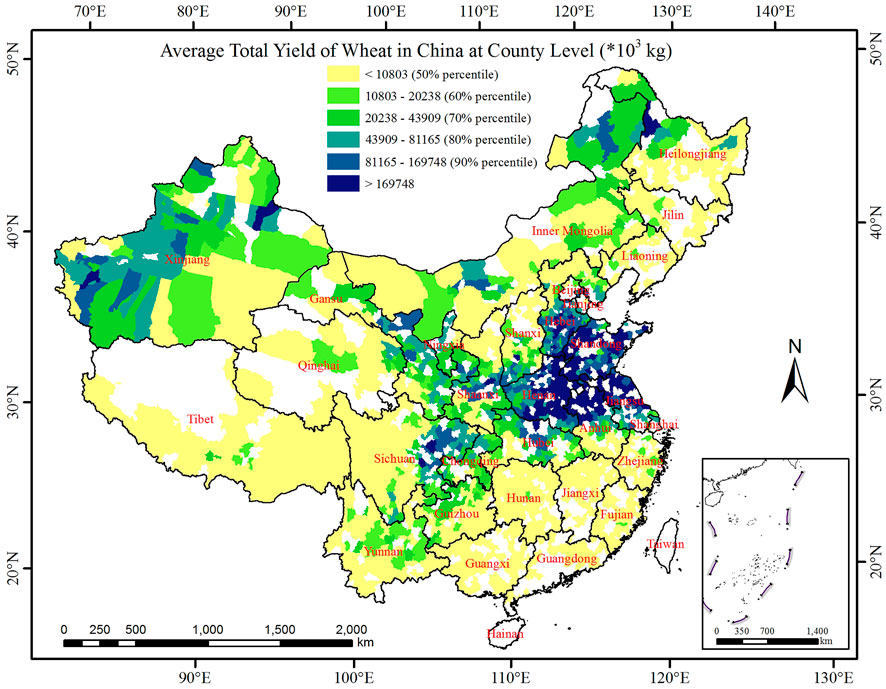
FIGURE 2. Distribution of annual average total yield of wheat in mainland of China at the county level. The main producing county is the county whose annual average total output is higher than the 50th percentile of the entire county’s annual average total output (from light green to dark blue).
Compared with Figures 1, 2, the distribution of high-yield counties is consistent with that of high-yield provinces.
The daily temperature and precipitation data for 740 stations during 1981–2000 were used, which is collected by the China Meteorological Administration.
Study Area
The study area included the mainland of China, excluding Hainan Province, Taiwan Province, and other islands because of a lack of statistics. The average annual total output of each county is the temporal average of the total output of each county from 1981 to 2010. Using the 50th percentile of the annual average total yield of all wheat-producing counties as the threshold, the wheat-growing counties whose annual average total yield exceeds this value are considered as the main ones. Finally, 874 major wheat-producing counties were selected. The study area was divided into nine agricultural areas (Hu and Zhang, 2006) (Table 1). Agricultural regionalization represents the regional similarities and differences of the conditions, peculiarities, potentials, orientation, and measures of the development of agricultural production and the integrity of county-level administrative divisions (National Agricultural Regionalization Commission, 1981). The annual average precipitation and temperature of each agricultural region are the spatial–temporal averages of daily data. The number of wheat-producing counties and major producing counties in each agricultural region is shown in Table 1.
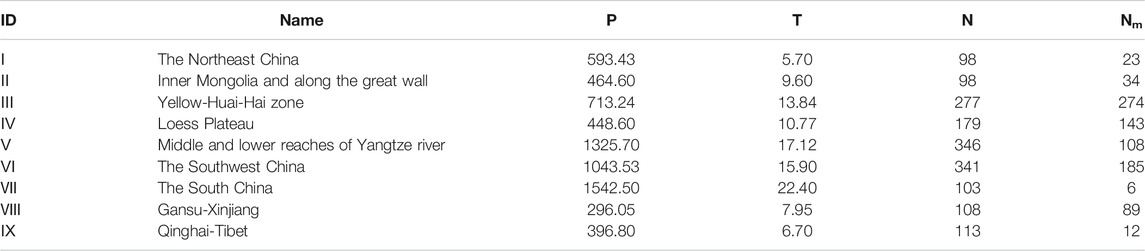
TABLE 1. Average annual precipitation (P, mm/year) and average annual temperature (T, °C/year), the number of wheat-planting counties and the number of main producing counties in the nine agricultural regions.
Methods
In this study, variation coefficients of yield were calculated using yield per unit area data. The yield per unit area data was then decomposed into trending yield and meteorological yield using a five-year linear moving-average method. Then the meteorological yield was used to calculate the relative meteorological yield, the yield reduction rate, the probability of reduction rate in different degrees of reduction, risk index, and comprehensive risk index of yield loss. The planting area data were introduced to improve the comprehensive risk index.
Coefficient of Yield Variation (CV)
The coefficient of variation (CV) of yield is the ratio of standard deviation to the average of actual yield per unit area, which reflects the degree of dispersion of yield data and represents the fluctuation of yield per unit area under the influence of natural and socioeconomic conditions. The formula is as follows:
where Yi is the ith observed yield per unit area;
Meteorological Yield (Yw) and Trending Yield (Yt)
The actual yield of crops is influenced by climatic conditions (such as temperature and precipitation) and socioeconomic conditions (such as technology and improvement of facilities). According to the factors that influence the final actual yield of crops, we can divide the yield into three parts: trending yield (or scientific yield, Yit), meteorological yield (Yiw), and random yield (Zhang et al., 2010; Ye et al., 2015). The formula is as follows:
where Y(t) is the tth annual observed wheat yield per unit area, Yt(t) is the tth trending yield, and Yw(t) is the tth meteorological yield.
Since the random yield ε is quite small, it can be ignored. Then the formula (2) is simplified as:
The method used to simulate trending yields has an assumption that the level of technology does not change significantly over the selected time step (Gommes, 1998). Considering that China has a Five-Year Plan for economic and technological development, and 1981 is the beginning of the sixth Five-Year Plan, 2010 is the end of the 11th one. In addition, the trending yields and meteorological yields calculated by the five-year linear moving-average method can meet those three principles for selecting a simulation model to determine the trending yields (Fang, 2011). The yield per unit area in each county can be divided into sequence segments (j) according to the time step (k). The total number of segments for data in each county is n−k+1. The linear regression for each j is as follows:
where Yj(t) is the tth trend yield in segment j and t is the rand index of each observed year. There was more than one simulated value at each t from the second segment to (n−k+1)th segment. Finally, the trending yield at each t was a moving average:
Relative Meteorological Yield (Yr)
Relative meteorological yield (Yr) represents the relative fluctuation of meteorological yield from the trending yield, which has comparability because it is not affected by the socioeconomic condition (Li et al., 2014). The formula is as follows:
where the negative Yr(t) indicates the tth reduction rate.
Yield Reduction Rate (R)
The formula for average reduction rate (R) during the period 1981–2010 at each county is as follows:
where Xi is the negative Yr(t).
Risk Index of Yield Loss (IR)
The IR is the product of reduction rates (Ri) and the corresponding probability of occurrence (Pi). Set Ri to four ranges:
Comprehensive Risk Index of Yield Loss (CRI)
CRI combines the CV, R, and IR. The larger CRI means the greater risk of losses. The standardization process is applied by the extreme difference method. The formula is as follows:
where X is
where
Improved Comprehensive Risk Index of Yield Loss (ICRI)
ICRI is the improved comprehensive risk index after eliminating or mitigating the effect of area scale. The main wheat-growing counties would be divided into four different levels of risk area based on the value of ICRI. The formulation is as:
where SS is the standardized planting area size using formula (11).
Results
Distribution of Coefficient of Variation (CV)
The CV can show the stability of wheat production. Figure 3 shows the spatial distribution of the CV of wheat yield at the county level from 1981 to 2010. On the national scale, the average CV was 0.19, and 39.9% of the counties were higher than the average. According to the CV of wheat, it was divided into five grades by percentile cluster method (Table 2). The lowest range is 0–0.18, the lower range is 0.18–0.24, the middle range is 0.24–0.29, the higher range is 0.29–0.34, and the highest range is 0.34–0.54. We can identify two high variable areas: 1) agricultural zone I, II, III, and IV, including parts of Heilongjiang to eastern Inner Mongolia Autonomous Region (Inner Mongolia for short), southern Ningxia Hui Autonomous Region (Ningxia for short) to eastern Gansu, and southeastern Henan to northern Anhui Province; 2) the western part of Agricultural Area VIII. As shown in Table 2, there were 68.18, 53.13, and 25.67% of the counties in agricultural zone I, II, and III were in the highest value areas, respectively. The CV of yield per unit area can reach 0.32–0.48 in regions from the east of Inner Mongolia to the western region of Northeast China, in North China Plain, from north of Henan to north of Hubei Province, and in the west of Xinjiang Uygur Autonomous Region (Xinjiang for short). The greater the CV is, the more vulnerable to the influence of meteorological and socioeconomic conditions the county is. However, 38.46% of the counties in V and 44.2% of counties in VI were the lowest value areas. In the northern part of Southwest China, the CV was small.
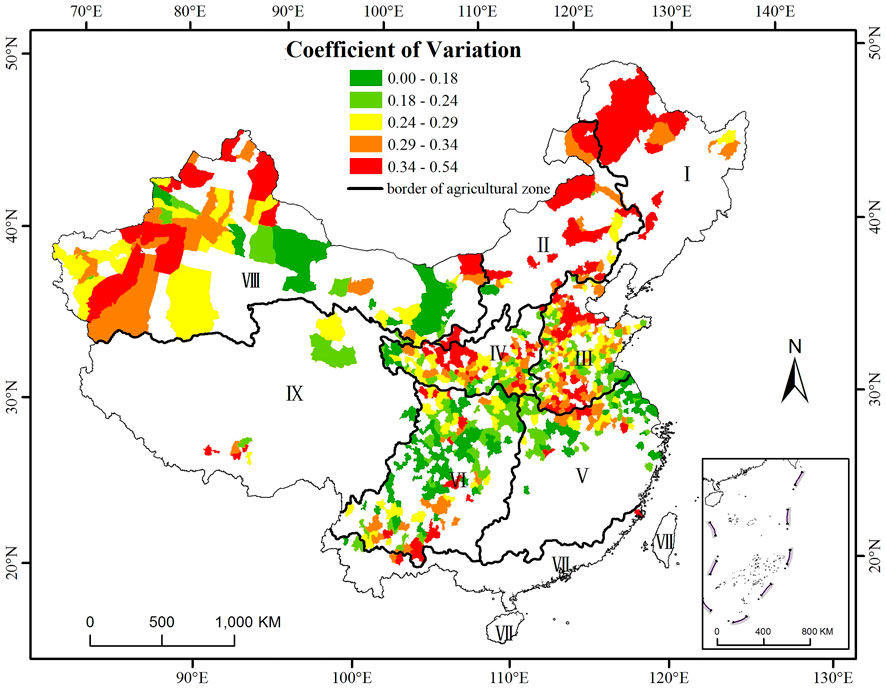
FIGURE 3. Distribution of coefficient of variation of wheat for main production area in mainland of China from 1981 to 2010.
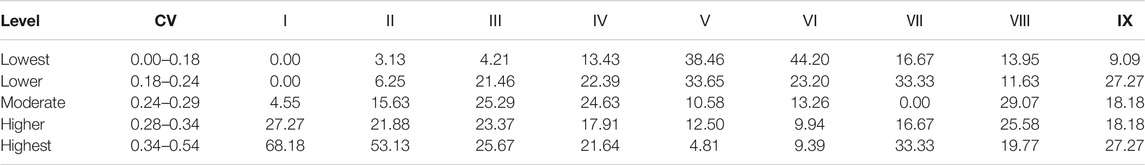
TABLE 2. Percentage of counties at each level of CV to total counties in corresponding agricultural zones.
The Probability of Occurrence for Each Level of Reduction Rate
According to the value of probability, it is divided into five levels by percentile clustering method (Figure 4), which are the lowest, the lower, the middle, the higher, and the highest value area. The eastern Inner Mongolia, Northeast China, Ningxia, eastern Gansu, Shaanxi, and Shanxi are more likely to have a yield reduction rate of more than 15%.
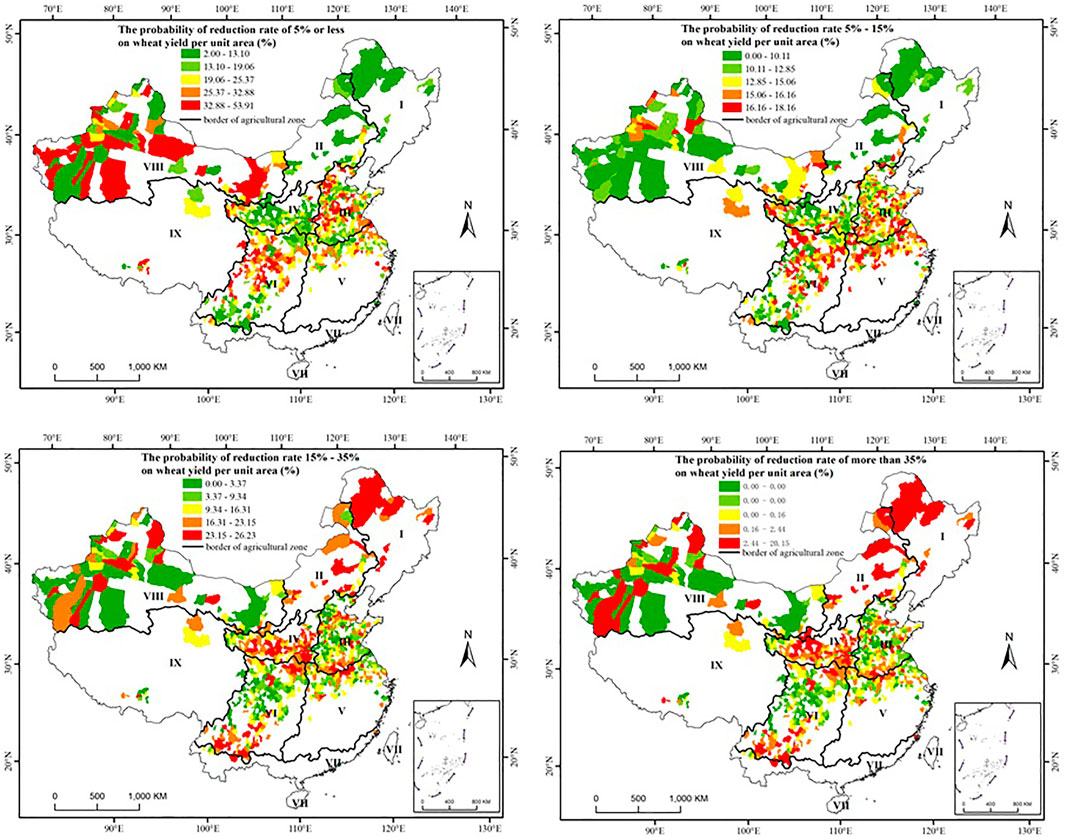
FIGURE 4. Distribution of occurrence probability for each level of reduction rate.
Distribution of Risk Index (IR)
The IR synthesizes the yield reduction rate and its occurrence probability at corresponding levels. Figure 5 shows the spatial distribution of IR for county-level wheat yield from 1981 to 2010. According to IR of wheat, it was divided into five grades by percentile clustering method (Table 3). Three high-value areas can be identified in Figure 6: 1) parts of agricultural zone I, II, and IV, including the northern part of Inner Mongolia and the western part of the Northeast China; 2) the southern part of zone VI; and 3) the western part of zone VIII. The IR in the northeast of Southwest China, part of the west of Northwest China, and part of Henan Province was lower, indicating that the yield loss risk was lower. Table 3 showed that 86.36, 51.52, and 36.57% of the counties in the zone I, II, and IV are in the highest value areas, while 25.67, 25.97, and 40.74% of the counties in zone III, VI, and VIII are in the lowest value areas, respectively.
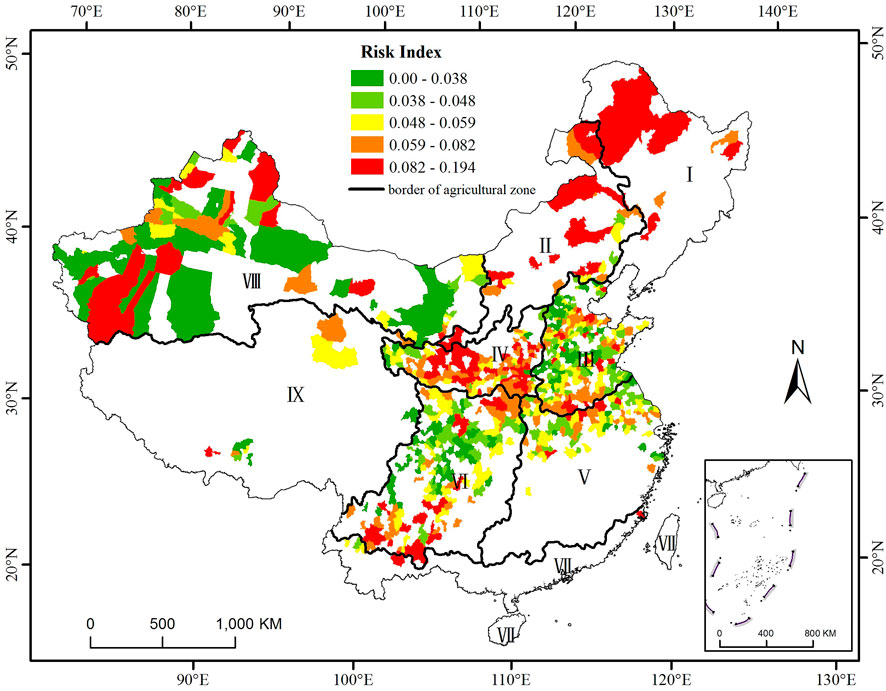
FIGURE 5. Distribution of risk index of wheat for main production regions in China from 1981 to 2010.
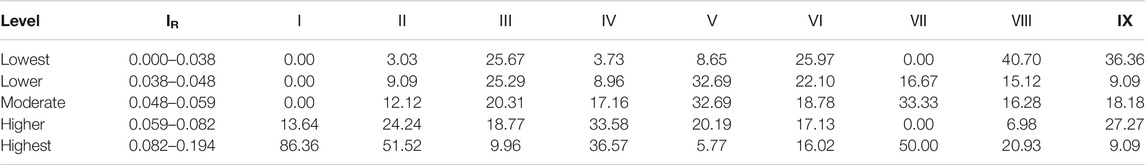
TABLE 3. Percentage of counties at each level of IR to total counties in corresponding main agricultural zones.
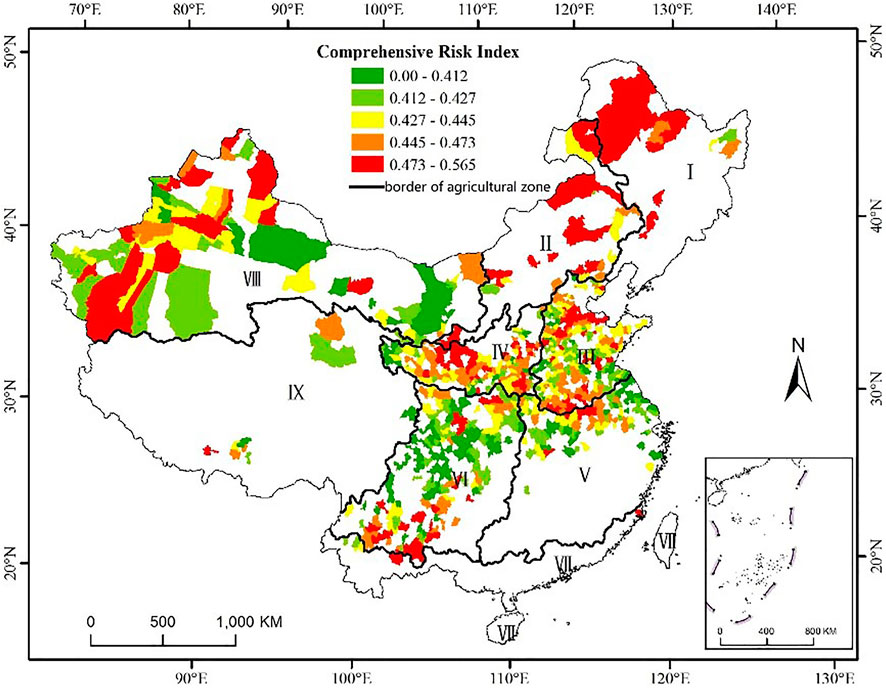
FIGURE 6. Distribution of comprehensive risk index of wheat in main production regions from 1981 to 2010 without removing area effect (CRI).
Performance of Two Comprehensive Risk Index (CRI and ICRI)
The higher value of the comprehensive risk index means that the wheat yield is more vulnerable to both climate and socioeconomic conditions. Figures 6, 7, respectively, show the distribution of the comprehensive risk index without and after removing the effect of area scale. According to the ICRI, it was divided into five levels by the percentile clustering method (Table 4). The high-value areas are concentrated in agricultural zone III which has 41.38% of the counties in the highest value areas. However, 29.1% of the counties in the IV were in the higher value areas. 43.65 and 39.53% of the counties in zone VI and VIII were in the lowest value areas, respectively. As compared with Figures 6, 7, the risk was increased in the Yellow-Huai-Hai Plain, including Shandong, Henan, northern Anhui, and parts of Jiangsu. The main disaster causing a high risk of yield loss to local wheat is drought, where precipitation cannot meet the requirement of winter wheat growth, especially at flowering time (Tuan et al., 2011).
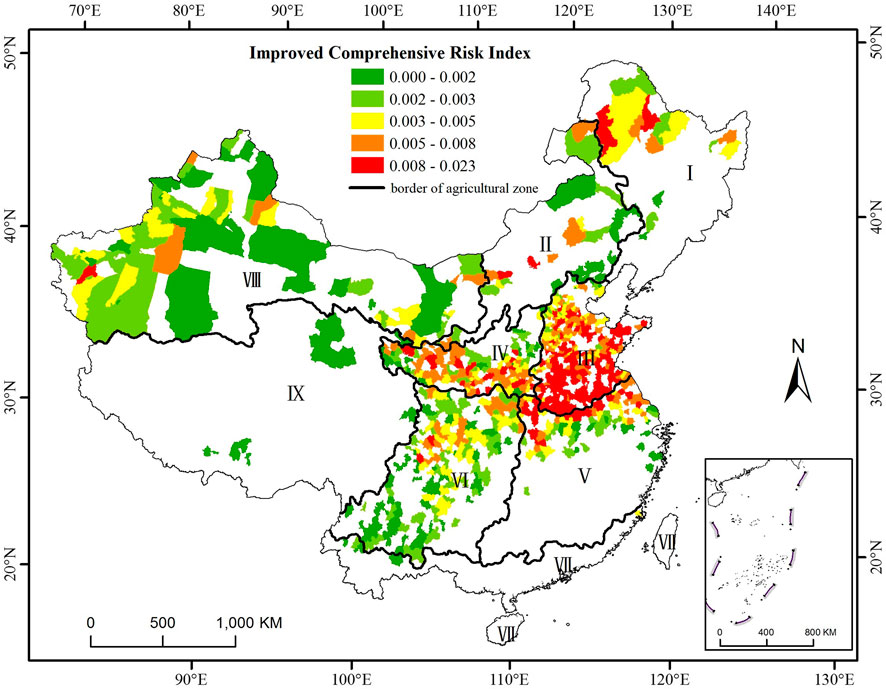
FIGURE 7. Distribution of improved comprehensive risk index of wheat in main production regions from 1981 to 2010 after removing area effect (ICRI).
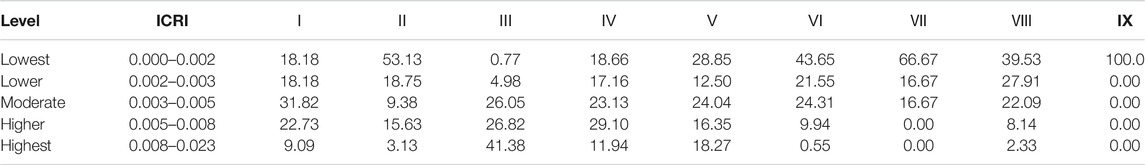
TABLE 4. Percentage of counties at each level of ICRI to total counties in corresponding main agricultural zones.
Discussion
The assessment of the risks of wheat yield losses caused by climatic and socioeconomic conditions is crucial for food security. Areas already at high risk of yield losses would be further devastated by climate change. Therefore, the need for adjusting the cropping system and management is urgent.
There have already been many methods or indicators for crop risk assessment (Jia et al., 2012; IPCC et al., 2014; Qian et al., 2016; Han et al., 2017; Lu et al., 2017). It is also a common method to quantify risk using historical time series data of production (Qian et al., 2016; Han et al., 2017; Lu et al., 2017). The coefficient of variation, rate of yield reduction, occurrence probability of different levels of yield reduction, and the comprehensive index established by using several indexes, are used to show the fluctuation of crop yield (Ma et al., 2008; Qian et al., 2016). In former researches, the comprehensive index was calculated by multiplying three indicators, such as risk index, the mean yield reduction rate, and the variation coefficient of yield reduction rate, or by weighted averaging these three indicators (Xue et al., 2005; Chen et al., 2009). However, those results lack spatial comparability because the planting area effect was not considered in the assessment. However, area scales can influence the results when we synthesize county-level yields using yield observations based on field or farm. The risk is often underestimated or overestimated. In this study, planting area was introduced as a factor to eliminate the area scale effect and improve the spatial comparability of results. Both natural and socioeconomic conditions are considered in the risk analysis. Risk index (IR) shows the impact from meteorological conditions, for example, precipitation, temperature, and solar radiation. The coefficient of variation (CV) of yield per unit area represents the annual fluctuation of yield which is relative to meteorological and socioeconomic conditions, such as technological development, facilities, and investments. The Improved Comprehensive Risk Index (ICRI) integrates the coefficient of variation, the reduction rate and risk index, and eliminates the effect of area scale.
The actual yield loss risk of wheat in agricultural zone III is higher (Figure 7). The yields of wheat from 1981 to 2010 in Huang-Huai-Hai Plain, including Henan and Shandong Province, showed a significant increase over time, which mainly depended on the use of fertilizers and the renewal of varieties (Mo et al., 2006; Liu et al., 2010). Drought is the main disaster here (Zhao et al., 2017). The amount of precipitation in the whole plain generally less than 200 mm is not suitable for the growth of winter wheat, especially in Shandong and Hebei Province, while the amount is more suitable in the southern regions of Henan, Anhui, and Jiangsu Province (Tuan et al., 2011). In addition, the temperature tends to rise during the vegetative growth stage of winter wheat, which will shorten the growth period of the crop and have a disadvantage to the yield production (Liu et al., 2010).
The yield loss risk which is indicated by ICRI decreased in most counties in agricultural zone VIII. The wheat could not be grown in these areas without water irrigation (Hu and Ding, 2008). While irrigation is used widely here to relieve water deficiency, the percentages of irrigated area to sown area accounted for more than 91 and 33% in Xinjiang and Inner Mongolia, respectively; these results are greater than the 50th percentile of the proportion of all provinces (Li et al., 2020). Thus, wheat production in zone VIII had a low yield loss risk. In addition, this suggested that the dependence on agricultural management such as water irrigation cannot be underestimated.
Conclusion
(1) The regions of high variation coefficient in main wheat-producing areas are in the part of Heilongjiang Province, the eastern Inner Mongolia, southern Ningxia, eastern Gansu, southeastern Henan, northern Anhui, and western Xinjiang.
(2) The high-risk areas of yield loss in main wheat-producing areas are recognized by the improve comprehensive risk index, which is located in Yellow-Huai-Hai Plain including Shandong, Henan, northern Anhui, and parts of Jiangsu Province.
(3) The distribution of yield loss risk is consistent with the distribution of disaster risk. The drought has been the greatest agrometeorological disaster for wheat in the Huang-Huai-Hai zone.
Data Availability Statement
The raw data supporting the conclusions of this article will be made available by the authors, without undue reservation.
Author Contributions
XL and SF designed the research. XL collected and analyzed the data with contributions from DW and XL produced the maps and tables with contributions from YZ, and SF. XL led the manuscript writing, supported by SF.
Funding
This manuscript was supported by the National Key Research and Development Programs of China (grant number: 2019YFC1510205), the National Natural Science Foundation of China (NSFC, grant number: 42075193) and the Fundamental Research Fund (grant number: 2019Z010).
Conflict of Interest
The authors declare that the research was conducted in the absence of any commercial or financial relationships that could be construed as a potential conflict of interest.
The reviewer JZ declared a shared affiliation with the authors XL, SF to the handling editor at time of review.
References
Andrade, F. H. (1995). Analysis of Growth and Yield of Maize, Sunflower and Soybean Grown at Balcarce, Argentina. Field Crops Res. 41, 1–12. doi:10.1016/0378-4290(94)00107-n
Arihara, J., and Karasawa, T. (2000). Effect of Previous Crops on Arbuscular Mycorrhizal Formation and Growth of Succeeding Maize. Soil Sci. Plant Nutr. 46, 43–51. doi:10.1080/00380768.2000.10408760
Challinor, A. J., Müller, C., Asseng, S., Deva, C., Nicklin, K. J., Wallach, D., et al. (2018). Improving the Use of Crop Models for Risk Assessment and Climate Change Adaptation. Agric. Syst. 159, 296–306. doi:10.1016/j.agsy.2017.07.010
Chen, B. M., and Zhou, X. P. (2002). Analysis of the Threshold Area of National and Regional Per Capita Arable in China. J. Nat. Resour. 17, 621–628. doi:10.11849/zrzyxb.2002.05.014
Chen, J., Zhang, C. G., Wang, J. Y., Lin, J., Li, L. C., and Yang, K (2009). Risk Evaluation of Meteorological Disaster on Grain Yield in Fujian Province. Chin. Agric. Sci. Bull. 25, 277–281. CNKI:SUN:ZNTB.0.2009-10-061
Dilley, M., Chen, R. S., Deichmann, U., Lerner-Lam, A. L., Arnold, M., Agwe, J., et al. (2005). Natural Disaster Hotspots: A Global Risk Analysis. Washington, DC: The World Bank. doi:10.1596/0-8213-5930-4
Fang, S. B. (2011). Exploration of Method for Discrimination between Trend Crop Yield and Climatic Fluctuant Yield. J. Nat. Disaster 20, 13–18. doi:10.13577/j.jnd.2011.0603
Fang, S. B., Han, G. J., Zhang, X. S., and Zhou, G. S. (2011). Climate Change Affects Crop Production and its Adaptation. Adv. Meteorol. Sci. Technol. 1, 15–19. CNKI:SUN:QXKZ.0.2011-02-009
Gommes, R. (1998). Climate-related Risk in Agriculture. Toronto: IPCC Expert Meeting on Risk Management Methods.
Han, Y., Fang, S., Liang, H., and Zhou, G. (2017). Disaster Risk Regionalization of Rice Based on its Reduction Probability in Liaoning Province. Acta Ecol. Sin. 37, 8077–8088. doi:10.5846/stxb201610182120
Hao, L., Zhang, X., and Liu, S. (2012). Risk Assessment to China's Agricultural Drought Disaster in County Unit. Nat. Hazards. 61, 785–801. doi:10.1007/s11069-011-0066-4
He, Z.-H., Xia, X.-C., Chen, X.-M., and Zhuang, Q.-S. (2011). Progress of Wheat Breeding in China and the Future Perspective. A a S 37, 202–215. doi:10.3724/sp.j.1006.2011.00202
Hu, L., and Ding, Y. (2008). Crop Cultivated Science. Editor L. Hu (Beijing: China Higher Education Press), Ch. 3, 246.
Hu, Z., and Zhang, D. (2006). Country Pasture/Forage Resource Profiles, China. Editors J. M. Suttie, and S. G. Reynolds (Rome: FAQ).
Iizumi, T., Furuya, J., Shen, Z., Kim, W., Okada, M., Fujimori, S., et al. (2017). Responses of Crop Yield Growth to Global Temperature and Socioeconomic Changes. Sci. Rep. 7, 7800. doi:10.1038/s41598-017-08214-4
Jia, H., Wang, J., Cao, C., Pan, D., and Shi, P. (2012). Maize Drought Disaster Risk Assessment of China Based on EPIC Model. Int. J. Digital Earth 5, 488–515. doi:10.1080/17538947.2011.590535
Li, H., Yao, F., Zhang, J., and Hao, C. (2014). Analysis on Climatic Maize Yield and its Sensitivity to Climate Change in Northeast China. Chin. J. Agrometeorol. 35, 423–428.
Li, X., Fang, S., Wu, D., Zhu, Y., and Wu, Y. (2020). Risk Analysis of Maize Yield Losses in Mainland China at the County Level. Sci. Rep. 10, 10684. doi:10.1038/s41598-020-67763-3
Li, Y., Ye, W., Wang, M., and Yan, X. (2009). Climate Change and Drought: a Risk Assessment of Crop-Yield Impacts. Clim. Res. 39, 31–46. doi:10.3354/cr00797
Lin, E., Xu, Y. L., Jiang, J. H., Li, Y. E., Yang, X., Zhang, J. Y., et al. (2006). National Assessment Report of Climate Change (Ⅱ): Climate Change Impacts and Adaptation. Adv. Clim. Change Res. 2, 51–56. CNKI:SUN:QHBH.0.2006-02-001
Lin, X. M., Yue, Y. J., and Su, Y. (2009). Frost Hazard Risk Assessment of Winter Wheat: Based on the Meteorological Indicator at Different Growing Stages. J. Cata Strophology 24, 45–50.
Litsinger, J. A. (1991). “Crop Loss Assessment in Rice,” in Rice Insects: Management Strategies. Editors E. A. Heinrichs, and T. A. Miller (New York, NY: Springer New York), 1–65. doi:10.1007/978-1-4612-3124-0_1
Liu, X., Shen, S., and Liu, R. (2013). Risk Regionalization of Yield Losses of Summer Maize in Henan Province. Chin. J. Agrometeorol. 34, 582–587. doi:10.3969/j.issn.1000-6362.2013.05.013
Liu, Y., Wang, E., Yang, X., and Wang, J. (2010). Contributions of Climatic and Crop Varietal Changes to Crop Production in the North China Plain, since 1980s. Glob. Change Biol. 16, 2287–2299. doi:10.1111/j.1365-2486.2009.02077.x
Lobell, D. B., Field, C. B., Cahill, K. N., and Bonfils, C. (2006). Impacts of Future Climate Change on California Perennial Crop Yields: Model Projections with Climate and Crop Uncertainties. Agric. For. Meteorology 141, 208–218. doi:10.1016/j.agrformet.2006.10.006
Lobell, D. B., and Field, C. B. (2007). Global Scale Climate-Crop Yield Relationships and the Impacts of Recent Warming. Environ. Res. Lett. 2, 014002–014007. doi:10.1088/1748-9326/2/1/014002
Lobell, D. B., and Gourdji, S. M. (2012). The Influence of Climate Change on Global Crop Productivity. Plant Physiol. 160, 1686–1697. doi:10.1104/pp.112.208298
Lu, J., Carbone, G. J., and Gao, P. (2017). Detrending Crop Yield Data for Spatial Visualization of Drought Impacts in the United States, 1895-2014. Agric. For. Meteorology 237-238, 196–208. doi:10.1016/j.agrformet.2017.02.001
Ma, S., Wang, Q., Wang, C., and Huo, Z. (2008). The Risk Division on Climate and Economic Loss of Maize Chilling Damage in Northeast China. Geogr. Res. 27, 1169–1177.
Mo, X. G., Lin, Z. H., and Liu, S. X. (2006). Spatial-temporal Evolution and Driving Forces of Winter Wheat Productivity in the Huang-Huai-Hai Region. J. Nat. Resour. 21, 449–457.
National Agricultural Regionalization Commission (1981). Comprehensive Agricultural Regionalization of China. Beijing: China Agriculture Press.
Pu, Y. Y., Yao, Y. B., Ma, P. L., Denf, Z. Y., Wang, W. T., and Zhang, M. C. (2007). [Responses of Winter Wheat Growth to Winter Warming in Gansu Province]. Ying Yong Sheng Tai Xue Bao 18, 1237–1241. doi:10.1002/jrs.1570
Qian, Y., Mao, L., and Zhou, G. (2016). Changes in Global Main Crop Yields and its Meteorological Risk Assessment. T. Chin. Soc. Agr. Eng. 32, 226–235. doi:10.11975/j.issn.1002-6819.2016.01.032
Ray, D. K., Gerber, J. S., MacDonald, G. K., and West, P. C. (2015). Climate Variation Explains a Third of Global Crop Yield Variability. Nat. Commun. 6, 5989–9. doi:10.1038/ncomms6989
IPCC; R. K. Pachauri, and L. A. Meyer (Editors) (2014). Climate Change 2014: Synthesis Report. Contribution of Working Groups I, II and III to the Fifth Assessment Report of the Intergovernmental Panel on Climate Change. Geneva, Switzerland: IPCC.
Rosenzweig, C., Elliott, J., Deryng, D., Ruane, A. C., Müller, C., Arneth, A., et al. (2014). Assessing Agricultural Risks of Climate Change in the 21st Century in a Global Gridded Crop Model Intercomparison. Proc. Natl. Acad. Sci. USA. 111, 3268–3273. doi:10.1073/pnas.1222463110
Tian, Y.-L., Chen, J., Deng, A.-X., Zheng, J.-C., and Zhang, W.-J. (2011). Effects of Asymmetric Warming on Contents and Components of Starch and Protein in Grains of Winter Wheat under FATI Facility. A a S 37, 302–308. doi:10.3724/sp.j.1006.2011.00302
Tollenaar, M., and Lee, E. A. (2002). Yield Potential, Yield Stability and Stress Tolerance in Maize. Field Crops Res. 75, 161–169. doi:10.1016/s0378-4290(02)00024-2
Tuan, N. T., Qiu, J.-j., Verdoodt, A., Li, H., and Van Ranst, E. (2011). Temperature and Precipitation Suitability Evaluation for the Winter Wheat and Summer Maize Cropping System in the Huang-Huai-Hai Plain of China. Agric. Sci. China 10, 275–288. doi:10.1016/s1671-2927(11)60005-9
Wang, C., Lou, X., and Wang, J. (2007). Influence of Agricultural Meteorological Disasters on Output of Crop in China. J. Nat. Disast. 16, 37–43. doi:10.3969/j.issn.1004-4574.2007.05.006
Wang, C., Zhang, Q., Huo, G., Guo, P., and Li, J. (2015). Prospects and Progresses in the Research of Risk Assessment of Agro-Meteorological Disasters. Acta Meteorol. Sin. 73, 1–19. CNKI:SUN:QXXB.0.2015-01-001
Wang, Q., Wu, J., Lei, T., He, B., Wu, Z., Liu, M., et al. (2014). Temporal-spatial Characteristics of Severe Drought Events and Their Impact on Agriculture on a Global Scale. Quat. Int. 349, 10–21. doi:10.1016/j.quaint.2014.06.021
Xue, C., Huo, Z., Li, S., and Ye, C. (2003). Risk Assessment of Drought and Yield Losses of Winter Wheat in the Northern Part of North China. J. Nat. Disast. 12, 131–139. doi:10.1142/S0252959903000104
Xue, C. Y., Huo, Z. G., Li, S. K., Zhuang, L. W., Wng, S. Y., Hou, T. T., et al. (2005). [Geographic Distribution of Winter Wheat Yield Loss Risk and its Classification in North China]. Ying Yong Sheng Tai Xue Bao 16, 620–625. CNKI:SUN:YYSB.0.2005-04-006
Yang, P., Zhang, L. J., Zhao, Y. X., Jiang, L. Q., Qiao, S. N., and Zhang, X. H. (2015). Risk Assessment and Zoning of Drought for Summer Maize in the Huang-Huai-Hai Region. Chin. J. Eco-Agric. 23, 110–118. doi:10.13930/j.cnki.cjea.140667
Ye, T., Nie, J., Wang, J., Shi, P., and Wang, Z. (2015). Performance of detrending models of crop yield risk assessment: evaluation on real and hypothetical yield data. Stoch. Env. Res. Risk A. 29, 109–117.
Zhao, Y. H., Peng, J. P., Mao, K. B., Xiang, Y. N., Li, Y. H., Han, J. Q., et al. (2017). Spatio-temporal distribution of typical natural disasters and grain disaster losses in China from 1949 to 2015. Acta Geogr. Sin. 72, 1261–1276. doi:10.11821/dlxb201707011
Zhang, J. (2004). Risk Assessment of Drought Disaster in the Maize-Growing Region of Songliao Plain, China. Agric. Ecosyst. Environ. 102, 133–153. doi:10.1016/j.agee.2003.08.003
Keywords: county level, wheat, risk index, sown area, yield loss
Citation: Li X, Fang S, Zhu Y and Wu D (2021) Risk Analysis of Wheat Yield Losses at the County Level in Mainland China. Front. Environ. Sci. 9:642340. doi: 10.3389/fenvs.2021.642340
Received: 05 January 2021; Accepted: 19 April 2021;
Published: 04 May 2021.
Edited by:
Bing Xue, Institute of Applied Ecology (CAS), ChinaReviewed by:
K. S. Rao, University of Delhi, IndiaJunfang Zhao, Chinese Academy of Meteorological Sciences, China
Copyright © 2021 Li, Fang, Zhu and Wu. This is an open-access article distributed under the terms of the Creative Commons Attribution License (CC BY). The use, distribution or reproduction in other forums is permitted, provided the original author(s) and the copyright owner(s) are credited and that the original publication in this journal is cited, in accordance with accepted academic practice. No use, distribution or reproduction is permitted which does not comply with these terms.
*Correspondence: Shibo Fang, ZmFuZ3NoaWJvQGNtYS5nb3YuY24=