 Jieming Chou
 Mingyang Sun
 Yuan Xu
 Fan Yang
 Jiangnan Li
 Weixing Zhao
- 1State Key Laboratory of Earth Surface Processes and Resource Ecology, Beijing Normal University, Beijing, China
- 2State Key Laboratory of Earth Surface Processes and Resource Ecology, Faculty of Geographical Science, Beijing Normal University, Beijing, China
As global warming issues become increasingly serious, grain yield and socioeconomic development have been seriously threatened. The key to ensuring grain yield is to recognize the risks caused by climate change. In this paper, the trends of temperature and precipitation over the next thirty years in China are analysed using CMIP6 under the SSP1–2.6, SSP2–4.5 and SSP 5–8.5 climate scenarios. The resilience indicators of grain yield are proposed for the first time. We find that the higher the emission concentration is, the greater the temperature increase will be and further northward the precipitation belt will move. Meanwhile, the resilience varies across different climate zones. The temperate monsoon climate zone has a stronger resilience to adapt to climate change compared to that of other areas. The resilience of the temperate continental and plateau alpine climate zones are moderate. However, the resilience of the subtropical and tropical monsoon climates zones are poor.
Introduction
Grain security is the foundation for the overall sustainable development of the economy. Climate change poses significant risks and uncertainties for the sustainable development of grain production in all countries. The Intergovernmental Panel on Climate Change (IPCC) notes that significant impacts from climate change have become widespread and widely sensed across different regions and areas of the world (IPCC et al., 2014; CMACCC, 2018). Among them, agriculture is the industry that is most directly affected by and sensitive to climate change, mainly because climate change can cause high-temperature heat waves, droughts and floods as well as increasingly severe and frequent extreme weather and climate events, resulting in fluctuations in grain yield. Climate change is the most important natural factor affecting grain yield (Holst et al., 2013; Tao et al., 2014; Belyaeva and Bokusheva, 2018; Osman et al., 2020). Climate change presents significant risks and uncertainties to the global grain yield.
Identifying the resilience of grain yield under climate change and determining the temporal and spatial scales of their impacts are key factors in coping with climate change and promoting the sustainable development of grain production. Many theoretical and numerical models have attempted to reveal the connection between changes in grain yield and global warming. There are two primary research methods in this field. First, statistical modelling methods use multiple regressions, first-order differences, deep neural networks and other methods to establish statistical models for grain to forecast the influence of climate change on grain output (Crane-Droesch, 2018; Lu et al., 2019; Wang et al., 2019). The reliability of this method can be assessed through statistical testing, but it is difficult to detect a clear intensity change trend in the observation results. The second is the crop model simulation method. By inputting parameters describing soil, sunlight, temperature, precipitation and other conditions required for crop growth, crop growth conditions under future climate change conditions can be simulated (Abraha and Savage, 2006; Devkota et al., 2013; Mishra et al., 2013; Masud et al., 2019). However, the crop model simulation does not include socioeconomic factors such as policy, management, economy, technology, etc., so the results may have more uncertainty than the actual situation.
Grain yield is the result of the interaction between climatic factors and socioeconomic factors; therefore, comprehensive multidisciplinary and multidomain cross-analysis is required (Chou et al., 2004). With continuous changes in the global climate, the risks of climate change are increasing, which seriously affects the safety and sustainable development of China’s grain yield. The importance of improving the resilience of China’s grain yield has become a consensus in response to climate change. There are different types of resilience in the context of climate. Holling, an ecologist, first proposed resilience. He defined resilience as the ability of a system to absorb disturbances and continue to exist (Holling, 1973). Later, scholars in various fields, such as engineering, society, and economics, continued to enrich the connotation of resilience. In the field of climate change, the IPCC defines resilience as the ability of a system to adapt to the adverse effects of climate change and recover and resist. The National Research Council (NRC) of the United States defines resilience as the ability to prepare, plan, absorb, recover and more successfully adapt to adverse events. In this definition, resilience is composed to capability, process, and goal (Cutter et al., 2013). Based on the theory of resilience, this article innovatively constructs an evaluation index for the resilience of grain yield under the background of climate change. This article defines "resilience" as the ability to achieve sustainable and stable production through policy, economy, and technology in the face of increasingly severe climate conditions. The lower the resilience of an area is, the higher the risk of climate change; the higher the resilience is, the lower the risk of climate change. This article takes China as an example to carry out an analysis of a grain yield and resilience assessment under different climate scenarios.
In addition, this article considers that the influence of precipitation and temperature on grain yield is a significant nonlinear relationship. To solve this problem, a comprehensive climate factor was constructed to reflect the influence of grain yield under global climate change. This article chiefly applies the economy-climate model as a bridge to connect the analysis of natural science and humanities with socioeconomic analyses. Duzheng Ye and Jieming Chou and Du, 2006 proposed an economic-climate model based on the traditional production function model (C-D) (Chou and Ye, 2006). This model was used to build an input-output model of grain yield that systematically reveals the changing trends in the future pattern of grain yield under different emissions situations; it also identifies areas of higher resilience to determine key production areas and generate breakthroughs in future grain security work. This study provides a scientific basis and policy recommendations for promoting the realization of sustainable development goals (SDGs).
Materials and Methods
Previous studies on China's grain yield have mostly examined changes in grain output on the basis of subregions such as the north and south regions (Chou et al., 2019), the three major zones, and the eight major grain-producing regions (Xu and Zhu, 2015). The North and South regions are divided with the Qinling Huai River acting as the boundary. The three major zones include the eastern coastal zone (Liaoning, Hebei, Tianjin, Beijing, Shandong, Jiangsu, Shanghai, Zhejiang, Fujian, Guangdong, Guangxi and Hainan), the central zone (Heilongjiang, Jilin, Inner Mongolia, Shanxi, Anhui, Jiangxi, Henan, Hubei and Hunan) and the western zone (Shaanxi, Gansu, Ningxia, Qinghai, Xinjiang, Sichuan, Yunnan, Guizhou and Tibet). The eight major grain-producing regions in China are the Sanjiang Plain, Songnen Plain, Jianghuai Area, Taihu Plain, Jianghan Plain, Poyang Lake Plain, Dongting Lake Plain and Chengdu Plain.
It is difficult to fully reflect the natural geographical future of all of China. As shown in Figure 1, China's north-south latitude is wide, and it is located within five major climate regions. The amount of heat received from the sun varies from place to place. Within the same climate zone, the basic characteristics of the climate are similar. This article divides the grain production areas in China into five regions by climate zone (see Table 1) and discusses the changes in temperature and precipitation in the different climate regions under SSP1–2.6, SSP2–4.5, and SSP5–8.5. It also analyses the influence of climate change on grain yield in the different climate regions and proposes a resilience evaluation for grain yield under global climate change.
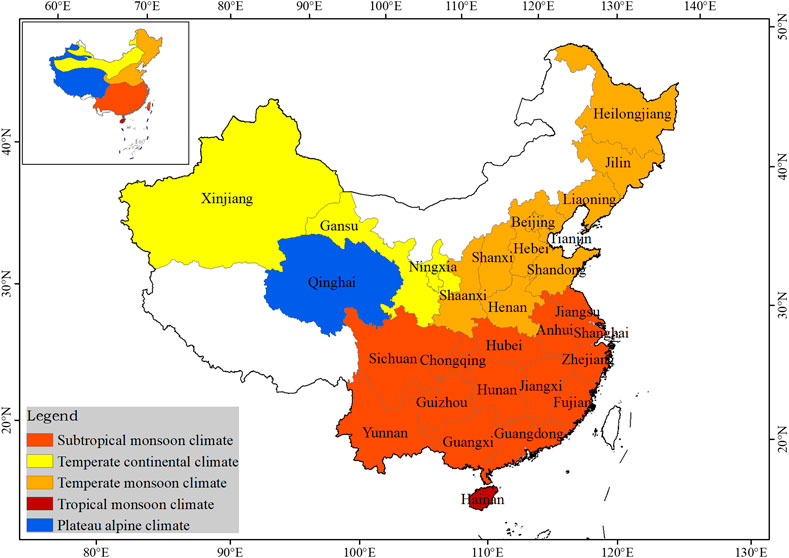
FIGURE 1. Distribution of five climatic regions for grain yield in China
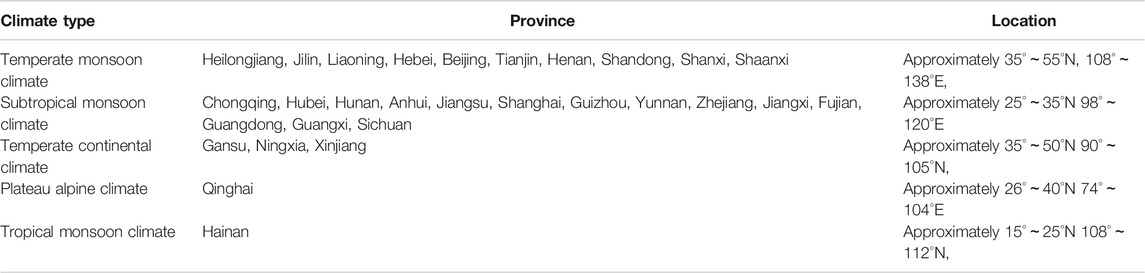
TABLE 1. The division of five climatic regions for grain yield in China.
Data and Methods
Data
Data Sources
The historical data used in this article are climate and economic data from twenty nine provinces and autonomous regions in China from 1981 to 2018. The climate data include the monthly precipitation and average temperature of each province during the growing period (April to September), which were obtained from the National Meteorological Information Center (http://data.cma.cn). The economic data include the annual data on rural labour, grain sown area, agricultural fertilizer, grain yield and population. The data were obtained from the China National Statistical Center (http://www.bjstats.gov.cn) and the China Statistical Yearbook.
Future climate data include the monthly average of the 2020–2050 growth period (April-September) output by the BCC-CSM2-MR, which is newly developed by the National Climate Center. It is a mode resolution model participating in the sixth phase of the Coupled Model Intercomparison Project (CMIP6). The ability of the BCC-CSM2-MR climate model to simulate the climate mean state and global warming trend, quasi-biennial oscillation (QBO), tropical intraseasonal oscillation (MJO) and diurnal variation in precipitation in the 20th century has significantly improved. (Wu et al., 2019). CMIP6 designed a series of new scenario prediction experiments based on the possible anthropogenic emissions and land use changes caused by the energy structure in different shared socioeconomic paths. This paper mainly focuses on the three radiative forcing scenarios shown in Table 2 (Pu et al., 2020). These three different radiative forcing scenarios represent three future emissions levels, e.g., low, moderate and high, and provide a theoretical basis for studying the impacts of different climate changes on grain yield.

TABLE 2. CMIP scenario experimental design.
Method
Economy-Climate and Grey System Model
Grain yield is affected not only by the input of socioeconomic elements such as rural labour, grain cultivation area, and agricultural fertilizer but also by meteorological elements, including climatic elements. This article is based on the Cobb-Douglas, which can map the relationship between input and output under certain technical conditions. Chou et al. presented a novel approach by introducing the comprehensive climatic factor into the Cobb-Douglas model. It is called the economy-climate model (C-D-C model) (Chou and Ye, 2006). Then, we use grey system model GM(1,1) to predict the future socioeconomic data. GM(1,1) establishes a grey differential prediction model through a small amount of incomplete information to make long-term fuzzy information. It is of higher adaptability and accuracy (Yin, 2013). We use economy-climate and grey system models to construct a comprehensive model to predict the future grain yield using the following equations:
Its logarithmic function is as follows:
where Yit represents grain yield; X1, X2, and X3 represent the rural labour, the grain cultivation area, and the agricultural fertilizer in each province, respectively; β1, β2, β3, and γ are the coefficients of each element; and µ represents the other elements.
Construct Comprehensive Climate Factor C by Principal Component Analysis
Principal component analysis (PCA) is probably the most commonly used dimensionality reduction method. To ensure that the original information is not missing or is missing as little data as possible, this method uses a few unrelated comprehensive indexes to express the majority of interrelated indexes (Brunetti et al., 2006). Let the original index temperature and precipitation be X1 and X2 and the main components be F1 and F2.
First, a sample matrix was constructed. Suppose a provincial administrative region in China has a sample size of monthly mean temperature precipitation from 1981 to 2018, and the observed climate indicator is temperature and precipitation.
Second, the principal component was determined. MATLAB was used to normalize the original climate data and calculate the relevant coefficient matrix r, principal component correlation coefficient
According to Eq. 5, the variance contribution rate
Finally, the index weight was calculated, and the coefficient of each index was calculated according to Eq. 7.
The weight vector was constructed, and Eq. 8 was used to calculate the weight of each index of the original data matrix.
PCA was used to determine the weight of the comprehensive climatic factor C (Chou et al., 2019). It can represent the relative importance of a certain indicator. If the weight is greater, it means that it has a greater influence overall.
where X1 and X2 are the temperature and precipitation, respectively,
Resilience Indicators
Resilience in physics refers to the ability of an object to resist the deformation of external forces and spring back into shape. Ecologically, resilience is defined as the stability of an ecosystem. In the field of disaster science, Patton defined resilience as the ability of the system to maintain its regular function, as well as its ability to cope with alterations and adjustments under extraneous conflict (Paton and Johnston, 2001). Bruneau believes that resilience focuses on the ability to quickly recover from disasters (Bruneau et al., 2003). Cai believes that resilience is the unique capability of an ecosystem to preserve the operation of its main functions when the system resolves a crisis (Cai et al., 2012). The United Nations defines resilience as the ability of a city to confront risks to withstand, maintain and cope with the influence of risk in a prompt and effective way. Climate change poses significant risks and uncertainties for the sustainable development of grain yield in all countries. As one of the important means of identifying grain yield status in grain yield areas, the assessment of grain yield has attracted the attention of many scholars, and there has been a lot of theoretical, methodological and applied research on this topic (Xu et al., 2013; Ji et al., 2014; Davenport et al., 2015). To quantitatively assess the resilience of future grain yield in China, this paper innovatively proposes climate change resilience indicators for grain yield. "Resilience" is used to indicate the ability of grain-producing areas to recover from the disturbance of climate change and realize stable grain production. Due to the obvious spatial heterogeneity of grain yield affected by climate change, the resilience of grain yield varies across different climate regions. Considering the negative correlation between grain yield resilience and climate change risk, previous research has developed grain yield risk indicators under global climate change (Wu et al., 2017; Sun et al., 2020). The article quantitatively assesses the sustainability of grain yield using two factors: grain output per person and grain unit yield.
We define the resilience index of grain output per person as the ratio of the 2000–2018 average annual grain output per person to the 2020–2050 grain output per person under global climate change. The index is calculated as follows:
where Gjm is the grain yield of province m in year j, Pjm is the population of province m in year j, Fjm is the grain output per person of p mrovince in year j, and Hm is the average annual grain output of province m. F’wm is the grain output per person of province m in year w, Gwm is the grain yield of province m in year w, Pwm is the population of province m in year w, and Swm is the grain output per person resilience index of province m in year w.
We define the resilience index of grain unit yield as the ratio of the 2000–2018 average grain unit yield to the 2020–2050 grain unit yield under global climate change. The index is calculated as follows:
where Gjm is the grain yield of province m in year j, Ajm is the grain sown area of province m in year j, Mjm is the grain unit yield of province m in year j, and Nm is the average annual grain unit yield of province m. M′wm is the grain unit yield of province m in year w, Gyi is the grain yield of province m in year w, Awm is the planting area of province m in year w, and Rwm is the grain unit yield resilience index of province m in year w.
Based on socioeconomic and climatic data, this paper forecasts the grain yield for SSP1–2.6, SSP2–4.5, and SSP5–8.5. Figure 2 is the flow chart of China’s grain yield resilience under global climate change.

FIGURE 2. Flow chart of China’s grain yield resilience under global climate change.
Results and Discussion
Temperature and precipitation differences under different scenarios in China.
Due to the complexity and variability of climate systems, climate models have become a powerful tool for studying future climate systems and climate change. CMIP6 simulation results are an important basis for climate predictions and climate change risk assessments. However, due to the differences in their mechanisms, structural principles, climate forcing parameters, resolutions and emissions scenario designs, different climate models predict different impacts from climate change. The simulation performance of climate change models is also quite variable. The prediction of temperature change trends in China in the 21st century show good consistency among models, but there are large differences in predictions between precipitation simulations. We selected the BCC-CSM2-MR model, which belongs to a medium resolution model. This model was developed by the National Climate Center of China. This model is closer to the actual distribution of precipitation in China and is more realistic. Therefore, the BCC-CSM2-MR model in CMIP6 was selected for this paper. The ability of the BCC-CSM2-MR climate system model to simulate quasi-biennial oscillation (QBO), tropical intraseasonal oscillation (MJO) and diurnal variation in precipitation in the 20th century has been significantly improved. (Wu et al., 2019).
Figure 3 shows the BCC-CSM2-MR model simulated the situations in temperature and precipitation differently between 2050 and 2015 under different scenarios. The temperature and precipitation in 2050 are the average values from 2046 to 2055. Compared with the historical climate data of 2015, the annual mean temperature for SSP5–8.5 is significantly higher than that for SSP2–4.5 and SSP1–2.6. In other words, the temperature changes are larger for higher emission scenarios. The areas with faster warming rates in the future are mainly concentrated in the central subtropical and northern temperate monsoon climate zones.
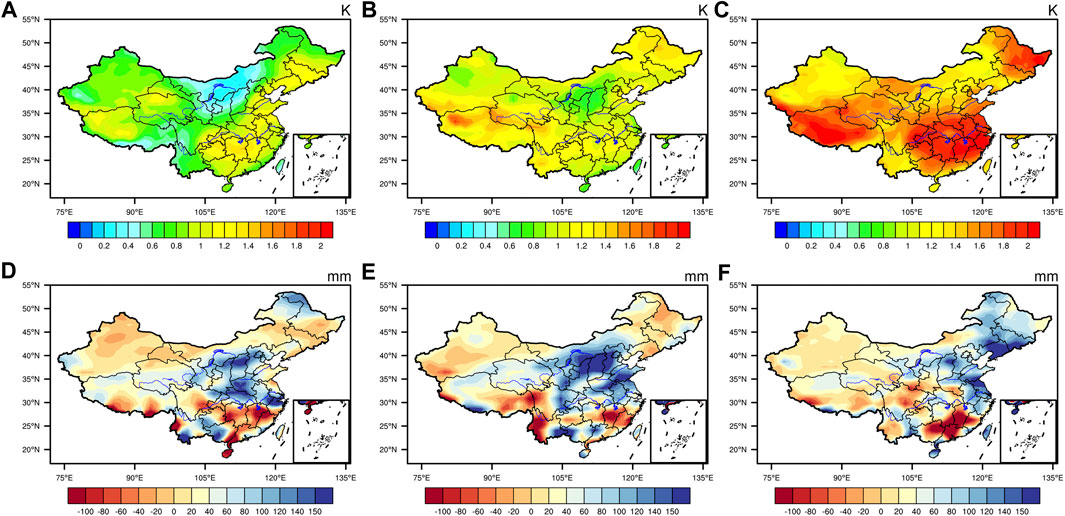
FIGURE 3. Temperature and precipitation difference between 2050 and 2015 under different scenarios; (A) SSP1–2.6 temperature, (B) SSP2–4.5 temperature, (C) SSP5–8.5 temperature, (D) SSP1–2.6 precipitation, (E) SSP2–4.5 precipitation, and (F) SSP5–8.5 precipitation.
The precipitation values in each climate region in China presents a fluctuating trend from 2015 to 2050. In the low emission scenario SSP1–2.6, the precipitation centers are mainly concentrated in the south of the temperate monsoon region; in the medium emission scenario SSP2–4.5, the precipitation center area is further expanded; in the high emission scenario SSP5–8.5, the precipitation center moves further toward the north. The driving force of the northward movement of the rain belt in China is the summer monsoon. The strength of the summer wind power depends on the thermal difference between the terrace and ocean, which is located between the Eurasian continent and Pacific Ocean. Global warming will increase the thermal difference between the terrace and ocean, which is located between Eurasia and the Pacific Ocean, strengthening the summer monsoon and moving the rain belt northward faster and wider.
Discussion and Analysis of the Future Grain Yield in China
In the process of agricultural planting development, grain yield is tightly related to diverse aspects of the external environment, such as the sowing area and temperature. They are comprehensive actions of socioeconomic elements and climate elements. The report of the 19th National Congress of the Communist Party of China points out that from 2020 to 2035, China will be built into a powerful socialist country. Therefore, we will take 2035 as our boundary. Figure 4 shows the future grain yield of provinces in China in the next fifteen years (2021–2035) and in 2036–2050 under the different emissions scenarios.
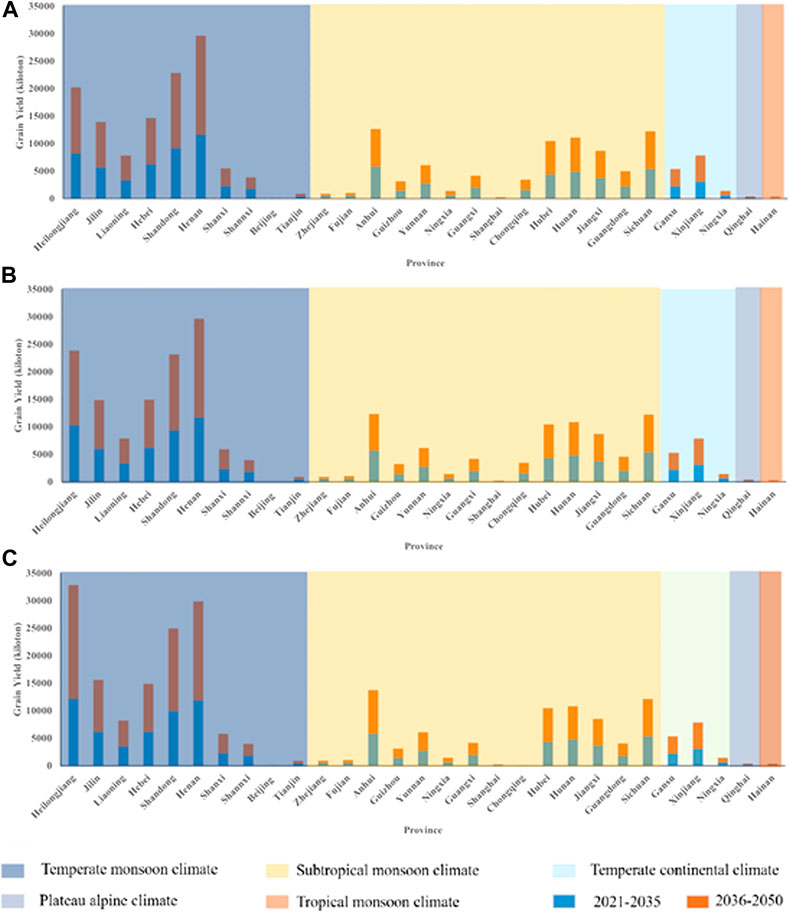
FIGURE 4. China's total grain yield in 2020–2050 under different emissions scenarios (A) SSP1–2.6, (B) SSP2–4.5, (C) SSP5–8.5.
Generally, China's grain yield is mainly concentrated in the zone of the monsoon climate (temperate and subtropical monsoon climates). The monsoon climate is a comprehensive phenomenon under the combined influence of three factors, including the thermal effects of the land-sea distribution, seasonal variations in atmospheric circulations and specific topographies. During the period of rainfall and heat in the monsoon area, water is provided at times when crops grow vigorously, i.e., when they need it most, which is very beneficial to agricultural development. The provinces with the highest future grain yield are mainly concentrated in the temperate continental climate zone to the north of the Qinling Mountains, and Heilongjiang Province is the largest producer of grain in China. In addition, Heilongjiang's grain production is most affected by global warming; it has the highest grain yield under SSP1–2.6. This is because as emissions increase, the temperature will gradually increase; thus, the crop growth period will lengthen, and the cultivation system will also change accordingly. In addition, the cold damage that affects crops will also be significantly reduced or disappear. As the climate warms, more food will be harvested at high latitudes. For subtropical and tropical monsoon climate regions at middle-low latitudes, the difference in grain yield under the different emissions scenarios is relatively small. The grain yield in the high-emissions scenario, SSP5–8.5, is slightly lower than that in the moderate-emissions scenario, SSP2–4.5, and low-emissions scenario, SSP1–2.6. Temperature warming has a negative effect on grain yield at middle and low latitudes. For the plateau alpine and the temperate continental climate regions, there is no significant difference under the different scenarios.
Resilience Assessment of Grain Yield in China From 2020 to 2050
Climate change presents great risks and uncertainties to the sustainable development of grain yield worldwide. In assessments of grain yield systems, the stability of grain production is an important focus. In this paper, "resilience" is used to indicate the ability of grain-producing areas to recover from the disturbance of climate change and realize stable grain production. This paper discusses the resilience from the aspects of grain output per person and grain unit yield to characterize the influence of climate change on China's grain yield.
Resilience Assessment for Grain Output per Person in China From 2020 to 2050
This article analyses the resilience of grain output per person from the perspective of the grain supply balance, i.e., grain yield and grain consumption. Considering the negative correlation between grain yield resilience and climate change risk, previous research has developed grain yield risk indexes (Wu et al., 2017; Sun et al., 2020). This paper defines the resilience index of grain output per person as the ratio of the 2000–2018 average grain output per person to the 2020–2050 grain output per person under different scenarios. According to the principle of dividing by the grain production risk index, the risk index for grain output per person is as follows: if the risk index value is greater than 1.20, there is no risk, and a value under 1.20 is risky. If the risk index value is higher than 1.00, there is a low risk to grain production; if the value is below 0.90, there is high risk; and values between the two indicate moderate risk (Sun et al., 2020). Therefore, "resilience" here is inversely proportional to the risk indicator, i.e., the reciprocal of the risk indicator. In this paper, we define a resilience index of grain yield per capita value of less than 0.83 as a high resilience; other values indicate fragile conditions. A value of less than one indicates moderate resilience; a value of higher than 1.11 indicates poor resilience; and values between them indicate low resilience.
In Figure 5, the regions with poor resilience for grain output per person in China are mainly concentrated in the regions of the subtropical monsoon climate and the tropical monsoon climate. At the same time, under SSP1–2.6, SSP2-4.5, and SSP5-8.5, with increased emissions, the resilience of grain output per person in the regions of the subtropical monsoon climate and the tropical monsoon climate worsens. The gradual increase in temperature exceeds the appropriate temperature required for grain yield, resulting in a reduction in grain yield. Therefore, in subtropical monsoon climate regions and tropical monsoon climate regions, energy-saving measures and emission reductions are important measures for maintaining and stabilizing local grain yield. The grain output per person depends on the grain demand and grain supply. The eastern coastal provinces are located in the tropical monsoon climate region. The cities include Jiangsu, Zhejiang, Fujian, and Guangdong. Due to reform and opening-up policies, the spatial pattern of China's grain-producing areas has changed significantly, the regional differences between grain yield and population flow have gradually increased, and the population has gradually flowed to areas with higher urbanization levels. In the eastern coastal provinces, industrialization, urbanization and internationalization activities are much higher than those in other provinces and cities, which lead to a poor resilience. However, the resilience of grain output per person in the temperate monsoon climate region remained high under the different scenarios; at the same time, with the increase in the emissions intensity under SSP1–2.6, SSP2–4.5, and SSP5–8.5, the resilience of grain output per person improved. The resilience of grain output per person in temperate continental climate regions and plateau alpine climate regions did not change significantly under SSP1–2.6, SSP2–4.5, and SSP5–8.5, and the resilience of grain output per person was maintained in these regions.
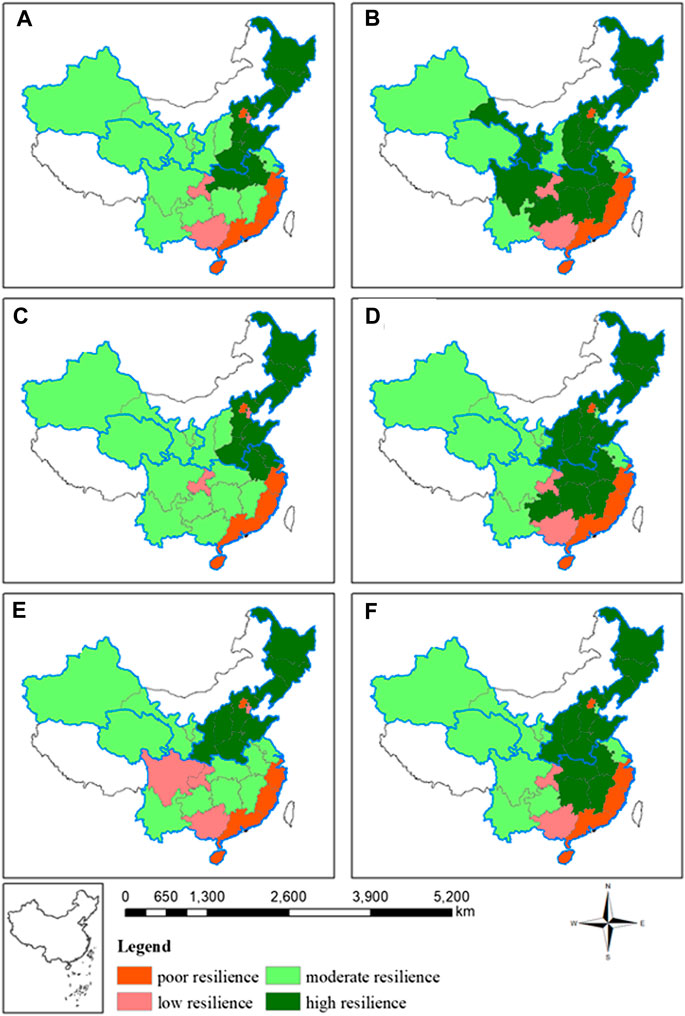
FIGURE 5. Resilience assessment for grain output per person under different scenarios; (A) 2035 SSP1–2.6, (B) 2050 SSP1–2.6, (C) 2035 SSP2–4.5, (D) 2050 SSP2–4.5, (E) 2035 SSP5–8.5, (F) 2050 SSP5–8.5.
Resilience Assessment for Grain Unit Yield in China From 2020 to 2050
Grain security is not only based on grain supply and demand but rather grain yield also reflects the land production capacity, and the agricultural production level is also an important factor in determining grain security. Considering the negative correlation between grain yield resilience and climate change risk, previous research has developed grain yield risk indexes (Wu et al., 2017; Sun et al., 2020). This paper defines the resilience index of the grain unit yield as the ratio of the 2000–2018 average grain unit yield to the 2020–2050 grain unit yield under SSP1–2.6, SSP2–4.5, and SSP5–8.5. According to the principle of dividing by the grain production risk index, the risk index for grain unit yield is as follows: if the risk index value is greater than 1.75, there is no risk; however, a value under 1.75 is risky. If the risk index value is higher than 1.50, there is a low risk to grain production; if the value is below 1.25, there is high risk; and values between the two indicate moderate risk (Sun et al., 2020). Therefore, "resilience" here is inversely proportional to the risk indicator, i.e., the reciprocal of the risk indicator. In this paper, we define a resilience index of grain unit yield value of less than 0.57 as a high resilience; other values indicate fragile conditions. A value of less than 0.67 indicates a moderate resilience; a value of higher than 0.8 indicates a poor resilience; and values in between indicate a low resilience.
Figure 6 shows that, in general, the resilience of grain unit yield in China's temperate monsoon climate regions is higher than that in the other climate zones in China. This is mainly due to the rapid growth of grain yield in temperate monsoon regions; on one hand, it is due to the development and upgrading of the industry; on the other hand, it benefits from global warming, which has led to an increase in the multiple cropping index and an increase in land production capacity. The increase in grain unit yield in the high-latitude area (Heilongjiang) is obvious. Due to the quick industrialization of subtropical and tropical monsoon climate regions, the loss of cultivated land in these regions is severe. In the process of balancing occupied and available cultivated land, the difference in the quality of occupied and available field land causes a decline in terms of grain production, resulting in a lower grain yield sustainability. In addition, the average temperatures in the subtropical and tropical monsoon climate zones are higher during the grain growth period than that in other climate zones. In the high-emissions scenario, SSP5–8.5, the higher the emissions intensity is, the greater the temperature increase. This increase would exceed the appropriate temperature for crop growth, weakening the land production capacity, which is also a key factor causing the low resilience of grain unit yield. In the SSP5–8.5 scenario, the resilience of grain unit yield in the monsoon region will gradually decrease from north to south. In the future, the resilience of grain unit yield in temperate continental climate regions and plateau alpine climate regions will not change substantially. Because the temperate continental climate zone is located inland, rainwater is not sufficient for crop growth; the increase in water discharge leads to temperature increases that further aggravate water shortages (Liu and Lin, 2007). The results show that the increase in temperature in the plateau alpine climate region aggravates the melting of ice and sown, increases the area of ice lakes, and increases the risk of glacier debris flows and ice lake breaks (Cui et al., 2014). However, the change in grain yield in these areas mainly depends on improving production efficiency, increasing investments in science and technology, strengthening farmland infrastructure conditions, increasing the promotion of water-saving irrigation technology, and adjusting the regional layout and variety structure of grains to a achieve sustainable and stable grain unit yield.
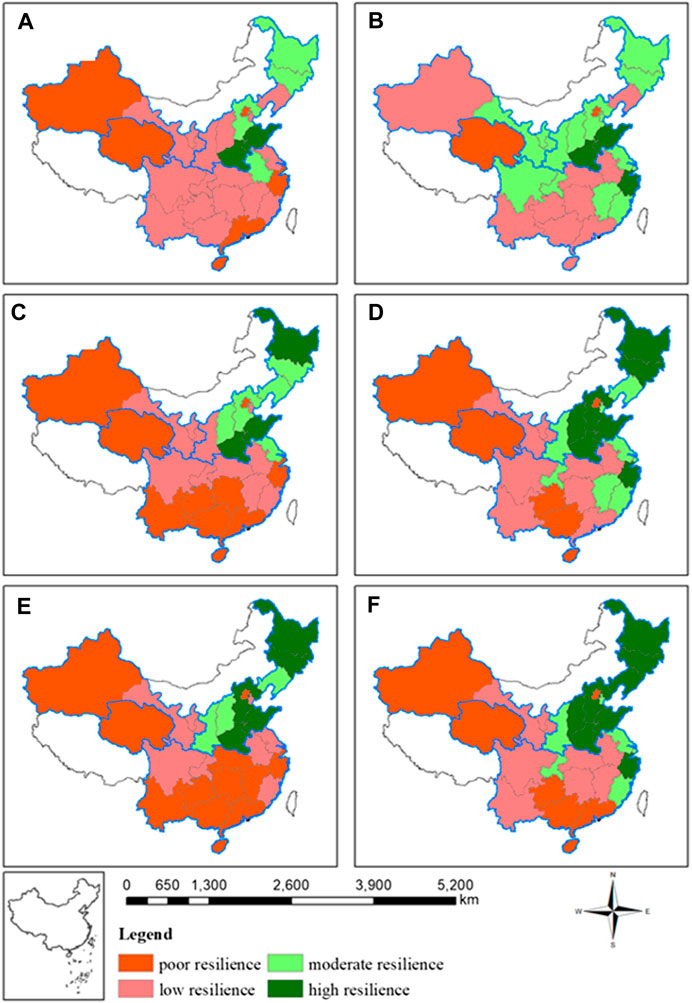
FIGURE 6. Resilience assessment for grain unit yield under different scenarios; (A) 2035 SSP1–2.6, (B) 2050 SSP1–2.6, (C) 2035 SSP2–4.5, (D) 2050 SSP2–4.5, (E) 2035 SSP5–8.5, and (F) 2050 SSP5–8.5.
Conclusion and Discussion
Based on the economy-climate and grey system models, we find that forecasts of the grain yield show obvious regional differences under different emissions scenarios (SSP1–2.6, SSP2–4.5, and SSP5–8.5). To quantify the impact of climate change on grain yield, we propose a resilience index of grain yield. Main contributions of this work are as follows:
>(1) The higher the emission concentration is the greater the temperature increase will be, and the more northward the precipitation belt moves in the future.
(2) In the future (2020–2050), China's grain yield will be mainly concentrated in the temperate and subtropical monsoon climate zones. China's grain yield in the temperate monsoon climate zone will maintain rapid growth, while that in the subtropical monsoon climate zone will grow slowly. Grain transportation from north to south will be further intensified.
(3) The resilience of grain output per person and grain unit yield in temperate monsoon climate regions is relatively high and positively affected by climate change. The high latitudes of the temperate monsoon climate region will significantly reduce or eliminate cold damage to crops.
(4) The resilience of grain output per person and grain unit yield in the regions with subtropical and tropical monsoon climates is poor. These areas are located at middle and low latitudes. Climate change will have negative impacts in these zones.
(5) The resilience of grain output per person and grain unit yield in temperate continental and plateau alpine climate regions is fair.
Overall, this paper uses a multidisciplinary approach to assess the sustainability of China's grain yield under the impacts of climate change and creatively defines a resilience index for grain yield. Future research should consider the potential effects of climate change more carefully by viewing, for example, the impact of extreme weather on grain yield. Due to space limitations, this study only used the BCC-CSM2-MR model, and the aggregate average of multiple models still needs to be further studied.
Data Availability Statement
The datasets presented in this article are not readily available because These are private and there are many relevant work which have not been published. Requests to access the datasets should be directed to MjAxODIxMDUxMTYzQG1haWwuYm51LmVkdS5jbg==.
Author Contributions
Conceptualization, MS and JC; methodology, MS; software, MS; validation, MS, JL and WZ; formal analysis, FY; investigation, YX; resources, MS; data curation, JC; writing—original draft preparation, MS; writing—review and editing, MS; visualization, JC; supervision, MS; project administration, YX; funding acquisition, JC. All authors have read and agreed to the published version of the manuscript.
Funding
This work was supported by the National Key Research and Development Program of China (2018YFC1509003; 2016YFA0602703) the National Natural Science Foundation of China (42075167).
Conflict of Interest
The authors declare that the research was conducted in the absence of any commercial or financial relationships that could be construed as a potential conflict of interest.
References
Abraha, M. G., and Savage, M. J. (2006). Potential impacts of climate change on the grain yield of maize for the midlands of KwaZulu-Natal, South Africa[J]. Agric. Ecosyst. Environ. 115, 150–160. doi:10.1016/j.agee.2005.12.020
Belyaeva, M., and Bokusheva, R. (2018). Will climate change benefit or hurt Russian grain production? A statistical evidence from a panel approach[J]. Clim. Change 149, 205–217. doi:10.1007/s10584-018-2221-3
Bruneau, M., Stephanie, E. C., and Ronald, T. E. (2003). Eguchi, et al. A Framework to Quantitatively Assess and Enhance the Seismic Resilience of Communities[J]. Earthq. spectra 19 (4), 733–752. doi:10.1193/1.1623497
Brunetti, M., Maugeri, M., Monti, F., and Teresa, R. (2006). Temperature and precipitation variability in Italy in the last two centuries from homogenised instrumental time series[J]. Int. J. Climatol. J. R. Meteorol. Soc. 26, 345–381. doi:10.1002/joc.1251
Cai, J., Guo, H., and Wang, D. (2012). Review on the resilient city research overseas[J]. Process Geogr. 31 (10), 1245–1255. doi:10.11820/dlkxjz.2012.10.001
Chou, J., and Ye, D. (2006). Assessing the effect of climate changes on grains yields with a new economy-climate model. Climatic Environ. Researc. 11, 347–353.
Chou, J., Feng, G., Dong, W., Ye, D., and Chen, H. (2004). A new approach the economy evaluation of influence on China agriculture by climate change. Climatic Environ. Res. 9, 361–368.
Chou, J., Xu, Y., Dong, W., Xian, T., Xu, H., and Wang, Z. (2019). Comprehensive climate factor characteristics and quantitative analysis of their impacts on grain yields in China's grain-producing areas[J]. Heliyon 116, 102837. doi:10.1016/j.heliyon.2019.e02846
CMACCC (2018). China blue book on climate change. Beijing, China: Climate Change Center of China Meteorological Administration.
Crane-Droesch, A. (2018). Machine learning methods for crop yield prediction and climate change impact assessment in agriculture[J]. Environ. Res. Lett. 13, 114003. doi:10.1088/1748-9326/aae159
Cui, P., Chen, R., Xiang, L., and Fenghuan, S. (2014). Risk analysis of mountain hazards in Tibetan plateau under global warming[J]. Progressus Inquisitiones De Mutatione Climatis 2, 103–109. doi:10.3969/j.issn.1673-1719.2014.02.004
Cutter, S. L., Ahearn, J. A., Amadei, B., Crawford, P., Eide, E. A., Galloway, G. E., et al. (2013). Disaster resilience: a national imperative[J]. Environ. Sci. Pol. Sust. Develop. 55 (2), 25–29. doi:10.1080/00139157.2013.768076
Davenport, F., Husak, G., and Jayanthi, H. (2015). Simulating regional grain yield distributions to support agricultural drought risk assessment[J]. Appl. Geogr. 63, 136–145. doi:10.1016/j.apgeog.2015.06.010
Devkota, K. P., Manschadi, A. M., Devkota, M., Lamers, J. P. A., Ruzibaev, E., Egamberdiev, O., et al. (2013). Simulating the impact of climate change on rice phenology and grain yield in irrigated drylands of Central Asia[J]. J. Appl. meteorol. clim. 52, 2033–2050. doi:10.1175/jamc-d-12-0182.1
Holling, C. S. (1973). Resilience and stability of ecological systems[J]. Annu. Rev. Ecol. Syst. 4 (1), 1–23. doi:10.1146/annurev.es.04.110173.000245
Holst, R., Yu, X. H., and Gruen, C. (2013). Climate change, risk and grain yields in China[J]. J. Integr. Agric. 12, 1279–1291. doi:10.1016/s2095-3119(13)60435-9
Ji, X., Liu, L., and Qi, X. (2014). Risk assessment method of grain production guarantee capacity of regional cultivated land[J]. Trans. Chin. Soc. Agric. Eng. 30, 219–226. doi:10.3969/j.issn.1002-6819.2014.07.026
Liu, Y., and Lin, E. (2007). Effects of climate change on agriculture in different regions of China[J]. Adv. Clim. Change Res. 3, 229–233. doi:10.1016/0959-3780(96)00018-0
Lu, S., Bai, X., Li, W., and Wang, N. (2019). Impacts of climate change on water resources and grain production[J]. Technol. Forecast. Soc. Change 143, 76–84. doi:10.1016/j.techfore.2019.01.015
Masud, M. B., Wada, Y., Goss, G., and Faramarzi, M. (2019). Global implications of regional grain production through virtual water trade. Sci. Total Environ. 659, 807–820. doi:10.1016/j.scitotenv.2018.12.392
Mishra, A., Singh, R., Raghuwanshi, N. S., Chatterjee, C., and Froebrich, J. (2013). Spatial variability of climate change impacts on yield of rice and wheat in the Indian Ganga Basin. Sci. Total Environ. 468-469, S132–S138. doi:10.1016/j.scitotenv.2013.05.080
Osman, R., Zhu, Y., Ma, W., Zhang, D., Ding, Z., Liu, L., et al. (2020). Comparison of wheat simulation models for impacts of extreme temperature stress on grain quality[J]. Agric. For. Meteorology 288, 107995. doi:10.1016/j.agrformet.2020.107995
Paton, D., and Johnston, D. (2001). Disasters and communities: vulnerability, resilience and preparedness[J]. Disaster Prev. Manag. 10 (4), 270–277. doi:10.1108/eum0000000005930
Pu, Y., Liu, H., Yan, R., Yang, H., Xia, K., Li, Y., et al. (2020). CAS FGOALS-g3 model datasets for the CMIP6 scenario model Intercomparison project (ScenarioMIP)[J]. Adv. Atmos. Sci. 37 (10), 1081–1092. doi:10.1007/s00376-020-2032-0
IPCC (2014). “Climate change,” in Synthesis report. Contribution of working groups I, II and III to the fifth assessment report of the intergovernmental Panel on climate change [core writing team. Editors R. K. Pachauri, and L. A. Meyer (Geneva, Switzerland: IPCC), 151 .
Sun, M., Chou, J., Xu, Y., Yang, F., and Li, J. (2020). Study on the thresholds of grain production risk from climate change in China's main grain-producing areas[J]. Phys. Chem. Earth 116. doi:10.1016/j.pce.2020.102837
Tao, F. L., Zhang, Z., Xiao, D. P., and Zhang, S. (2014). Responses of wheat growth and yield to climate change in different climate zones of China, 1981-2009. Agric. For. Meteorology 189, 91–104. doi:10.1016/j.agrformet.2014.01.013
Wang, P., Deng, X., and Jiang, S. (2019). Global warming, grain production and its efficiency: case study of major grain production region[J]. Ecol. Indicators 105, 563–570. doi:10.1016/j.ecolind.2018.05.022
Wu, S. H., Pan, T., Liu, Y. H., Deng, H., Jiao, K., Lu, Q., et al. (2017). Comprehensive climate change risk regionalization of China[J]. Acta. Geographica. Sinica. 72, 3–17. doi:10.11821/dlxb201701001
Wu, T., Lu, Y., Fang, Y., Xin, X., Li, L., Li, W., et al. (2019). The Beijing Climate Center climate system model (BCC-CSM): the main progress from CMIP5 to CMIP6[J]. Geoscientific Model Develop. 12 (4), 1573–1600. doi:10.5194/gmd-12-15573-2019
Xu, H., and Zhu, H. (2015). Spatial change of China’s grain production based on geographical division of natural factors during 1990–2010[J]. Acta. Geographica. Sinica. 70, 582–590. doi:10.11821/dlxb201504006
Xu, L., Zhang, Q., Zhou, A. L., and Ran, H. U. O. (2013). Assessment of flood catastrophe risk for grain production at the provincial scale in China based on the BMM method[J]. J. Integr. Agric. 12, 2310–2320. doi:10.1016/s2095-3119(13)60587-0
Keywords: global warming, grain yield, resilience index, risk, adoption
Citation: Chou J, Sun M, Xu Y, Yang F, Li J and Zhao W (2021) Resilience of Grain Yield in China Under Climate Change Scenarios. Front. Environ. Sci. 9:641122. doi: 10.3389/fenvs.2021.641122
Received: 13 December 2020; Accepted: 02 February 2021;
Published: 19 March 2021.
Edited by:
Qingxiang Li, Sun Yat-Sen University, ChinaReviewed by:
Zhixin Hao, Institute of Geographic Sciences and Natural Resources Research, ChinaYanling Song, Chinese Academy of Meteorological Sciences, China
Copyright © 2021 Chou, Sun, Xu, Yang, Li and Zhao. This is an open-access article distributed under the terms of the Creative Commons Attribution License (CC BY). The use, distribution or reproduction in other forums is permitted, provided the original author(s) and the copyright owner(s) are credited and that the original publication in this journal is cited, in accordance with accepted academic practice. No use, distribution or reproduction is permitted which does not comply with these terms.
*Correspondence: Mingyang Sun, MjAxODIxMDUxMTYzQG1haWwuYm51LmVkdS5jbg==