 Jianjun Yu
 Pam Berry
 Benoit P. Guillod1,2,3†
95% of researchers rate our articles as excellent or good
Learn more about the work of our research integrity team to safeguard the quality of each article we publish.
Find out more
ORIGINAL RESEARCH article
Front. Environ. Sci. , 30 April 2021
Sec. Interdisciplinary Climate Studies
Volume 9 - 2021 | https://doi.org/10.3389/fenvs.2021.640530
This article is part of the Research Topic Drought and Water Scarcity: Addressing Current and Future Challenges View all 19 articles
Forests provide important ecosystem services but are being affected by climate change, not only changes in temperature and precipitation but potentially also directly through the plant-physiological effects of increases in atmospheric CO2. We applied a tree-species-based dynamic model (LPJ-GUESS) at a high 5-km spatial resolution to project climate and CO2 impacts on tree species and thus forests in Great Britain. Climatic inputs consisted of a novel large climate scenario ensemble derived from a regional climate model (RCM) under an RCP 8.5 emission scenario. The climate change impacts were assessed using leaf area index (LAI) and net primary productivity (NPP) for the 2030s and the 2080s compared to baseline (1975–2004). The potential CO2 effects, which are highly uncertain, were examined using a constant CO2 level scenario for comparison. Also, a climate vulnerability index was developed to assess the potential drought impact on modeled tree species. In spite of substantial future reductions in rainfall, the mean projected LAI and NPP generally showed an increase over Britain, with a larger increment in Scotland, northwest England, and west Wales. The CO2 increase led to higher projected LAI and NPP, especially in northern Britain, but with little effect on overall geographical patterns. However, without accounting for plant-physiological effects of elevated CO2, NPP in Southern and Central Britain and easternmost parts of Wales showed a decrease relative to 2011, implying less ecosystem service provisioning, e.g., in terms of timber yields and carbon storage. The projected change of LAI and NPP varied from 5 to 100% of the mean change, due to the uncertainty arising from natural weather-induced variability, with Southeast England being most sensitive to this. It was also the most susceptible to climate change and drought, with reduced suitability for broad-leaved trees such as beech, small-leaved lime, and hornbeam. These could lead to important changes in woodland composition across Great Britain.
Forest ecosystems play a critical role in global carbon cycling and ecosystem service provision (Seddon et al., 2019). There is evidence of changes in the composition, structure, and functioning of forests in response to contemporary climate change and associated drought and heat stress (Ciais et al., 2005; Allen et al., 2010; Choat et al., 2018), as well as increases in CO2 (Peñuelas et al., 2017; Haverd et al., 2020; Walker et al., 2020). The projected shift of precipitation and temperature patterns in the twenty-first century (Seneviratne et al., 2012; Dai, 2013), along with increased CO2, therefore, is likely to have profound impacts on forest ecosystems (Hickler et al., 2012; Anderegg et al., 2013; Senf et al., 2018; Baumbach et al., 2019). Hence, understanding the potential impacts of climate change, especially of associated drought and CO2 on forests and their functioning, is important for policymakers and stakeholders to effectively plan appropriate adaptation measures for coping with the future.
Exploratory data analysis is one of the common approaches to studying the ecological response of plant species to recent mean climate change. Extreme events are of particular interest as they can help improve the understanding of phenological and physiological responses of tree species for better planning of management options. These studies are based on the observed stress signs of plant species, such as canopy dieback (Carnicer et al., 2011), growth condition (Van der Werf et al., 2007; Hogg et al., 2008; Pasho et al., 2011; Eilmann and Rigling, 2012), leaf coloring and decline (Leuzinger et al., 2005), and mortality (Bigler et al., 2006, 2007; Senf et al., 2018). However, the lack of agreed indicators of particular stress signs as a function of climate limits their use for climate change impact studies. In the United Kingdom, there are some observations of climate change impacts and especially drought on forests and tree species (e.g., Peterken and Mountford, 1996; Mountford et al., 1999; Green et al., 2008; Cavin et al., 2013), while a few studies have investigated impacts on tree growth, but they have been limited to a few species (Petr et al., 2014).
Bioclimatic envelope models, or others based on similar statistical approaches, are popular tools for the assessment of climate change impacts on the distribution of climate suitability for individual species (Fordham et al., 2013; Watson et al., 2013; Pacifici et al., 2015; Baumbach et al., 2019). However, when modeling forests, the fundamental mechanisms of tree species interactions and carbon and water cycling are not taken into account. Therefore, it is difficult to tackle the response of tree species and forest to changes over time, especially with respect to climate extremes like drought.
Process-based ecosystem or forest models, with their capability of simulating the ecophysiological and biogeochemical processes dynamically, are alternatives for studying terrestrial ecosystems and forest functioning under climate change. Such models have been used by many studies to investigate ecosystem properties, like net primary productivity (NPP) and net ecosystem exchange (NEE) of carbon, in order to understand the carbon uptake and release of terrestrial ecosystems in global carbon cycling; such models have been used (e.g., Morales et al., 2005; Chang et al., 2017; Fernández-Martínez et al., 2019). They have also been used to investigate transitional changes in vegetation composition (Hickler et al., 2004, 2012; Tang et al., 2012) and the physiological aspects of model outputs like drought-induced forest mortality (Steinkamp and Hickler, 2015). However, many similar models only represent broadly defined plant functional types (PFTs) instead of tree species. So, the model outputs are too coarse to be applied for regional studies and cannot be used for the ecological interpretation of individual tree species. Hickler et al. (2012) developed a tree species-based European version of the dynamic global vegetation model (DGVM) LPJ-GUESS and applied it to simulate future climate-driven changes in the potential natural vegetation. In this model version, ecophysiological process representations are adopted from the DGVM, but parameters are defined for the main tree species instead of PFTs and additional processes are included to distinguish tree species, in particular a drought limit for establishment. Note also that the LPJ-GUESS DGVM represents tree species population dynamics at a greater level of detail than most DGVMs, which is a prerequisite to define tree species. The model includes different cohorts of trees and related characteristics of canopy structure (Hickler et al., 2012). A version adopting the “average PFT” approach without cohorts (in the code referred to as “population mode”) from the LPJ DGVM (Sitch et al., 2003) within LPJ-GUESS is not used anymore.
The aim of this study was to use the tree species parameterization of LPJ-GUESS by Hickler et al. (2012) with an updated version of LPJ-GUESS to explore further the ecological responses of individual tree species to climate change and in particular to drought in Great Britain, as well as the potential effects of increasing CO2. Elevated CO2 generally increases photosynthesis and reduces stomatal conductance, at least for non-conifers (Körner et al., 2007; Hickler et al., 2015; Klein et al., 2016), but experimental effects on plant growth have shown contrasting results and are therefore highly uncertain (Hickler et al., 2015; Klein et al., 2016; Terrer et al., 2019; Jiang et al., 2020). Also, we investigated a source of uncertainty that has seldom been quantified in the context of ecological modeling: natural weather-induced variability, defined here as the internal variability of the atmosphere due to its highly nonlinear and chaotic behavior (Lorenz, 1965). Other sources of natural weather-induced variability that cannot be addressed with the climate-driving data we used include externally forced natural variability (for example due to variability in solar radiation input or volcanoes) and internally induced variability in the oceans.
The model was driven by the ensembles of climate model outputs from the MaRIUS project (Managing the Risks, Impacts and Uncertainties of drought and water Scarcity)1 with projections to the end of the twenty-first century. To our knowledge, this study is the first to apply a tree-species based dynamic ecosystem model at a regional level, driven by a potential large set of hydro-meteorological time series with unprecedented high spatial resolution. The novelty of this study lies in (i) assessment of the climate change impacts on forests using a large, high-resolution, plausible climate scenario ensemble for Great Britain; (ii) understanding the uncertainty arising from the natural weather-induced variability and the plant-physiological effects of increasing CO2 in ecosystem model projections (Hickler et al., 2015); and (iii) the assessment of the climate vulnerability of typical British tree species.
The Lund–Potsdam–Jena General Ecosystem Simulator (LPJ-GUESS) is a dynamic vegetation model that simulates vegetation dynamics and ecosystem processes in terrestrial ecosystems (Smith et al., 2001, 2014; Hickler et al., 2012). The model combines physiological, biophysical, and hydrological processes (Gerten et al., 2004) with detailed representation of plant growth, competition for resources (e.g., light, space, and water), disturbances, and canopy structure. Vegetation dynamics (establishment and mortality of individual trees) are simulated using a forest gap model approach (Bugmann, 2001; Hickler et al., 2012). The establishment, growth, and death of individual trees are simulated in a number of replicate patches for a given grid cell (defined by the spatial resolution of the model input data), also accounting for stochastic processes that influence the stand dynamics at a scale of 1,000 m2. The results are then averaged to characterize the mean vegetation and ecosystem variables (e.g., soil and total carbon storage) for a grid cell. Model input consists of daily values of temperature, rainfall and radiation, annual atmospheric CO2 concentration, and soil texture.
Model results have been evaluated against a wide range of test datasets (see publications on www.nateko.lu.se/lpj-guess), including vegetation structure and LAI, the potential natural vegetation across Europe (Hickler et al., 2012), and observed results for free-air CO2 enrichment (FACE) experiments (e.g., Hickler et al., 2015; Medlyn et al., 2015 and references therein). The framework of LPJ-GUESS is flexible and allows adoptions or parameterization for different regions and research questions. In most applications2, the model has been run based on plant functional types (PFTs) and oak and lime species, for example, being represented by a temperate broad-leaved tree. In temperate and boreal regions, however, the model structure makes it possible to parameterize main tree species, which is more relevant for foresters and stakeholders than PFTs (e.g., Hickler et al., 2004, 2012; Koca et al., 2006). In this study, we adopt version 3.1 (Smith et al., 2014) with the European parameterization of major tree species and shrub PFTs by Hickler et al. (2012) to simulate the dynamics of forests across Great Britain and to assess the potential effects of climate change. The nitrogen cycle (Smith et al., 2014) has not been enabled here because the parameters governing the population dynamics of trees (Hickler et al., 2012) would need to be re-parameterized first.
The LPJ-GUESS model was run at a 5-km spatial resolution across Great Britain, with each grid cell represented by 25 replicate patches in order to average the effect of stochastic disturbance, tree establishment and mortality, and, hence, stand development. The soil texture was determined according to the dominant soil texture class (based on a United Kingdom classification of soil texture) by aggregating the Soil Parent Material 1-km database (Lawley, 2012). The simulation was spun up for 1,000 years from bare ground forced by the annual global CO2 taken from McGuire et al. (2001) and the first 30 years of detrended climate input for 1961–1990 to reach a vegetation state in equilibrium with the climate (Sitch et al., 2003). The model was driven by historical observation data (i.e., monthly temperature, precipitation, and sunshine interpolated to get daily input) from 1961 to 2011 as a reference.
To model the carbon dynamics and vegetation patterns for the twenty-first century, the model was driven by 100 time series that represent potential climate change projections for 1961–2099 (for more details, see Guillod et al., 2018). These climate scenarios were generated using weather@home2 (Guillod et al., 2017) under the RCP 8.5 emission scenario. Weather@home consists of an atmospheric global climate model (HadAM3P) which is dynamically downscaled over Europe by the regional climate model (RCM) HadRM3P. The CO2 concentration used in LPJ-GUESS for the future was consistent with the emission level in RCM 8.5 (van Vuuren et al., 2011). The future time series, unlike some other RCM outputs, were found to represent mean climate and extreme hydro-meteorological events, like drought and flooding, relatively well (Guillod et al., 2018). The MaRIUS climate dataset (from which monthly mean temperature, bias-corrected precipitation, and solar radiation were used) covered three time slices from 1961 to 2004 (baseline), 2020 to 2049 (2030s), and 2070 to 2099 (2080s) at a spatial resolution of 25 km. We compare the two future time slices (2030s and 2080s) to a 30-year baseline period of 1975–2004 in order to capture both short-term and long-term ecological responses in LAI and NPP.
The dataset was disaggregated to a 5-km grid in order to match the LPJ-GUESS modeling grid using the following procedures: (i) multiplication of the ratio of Standard Average Annual Rainfall (SAAR) at a 25-km grid to the SAAR value at 5 km by the 25-km grid rainfall (Bell et al., 2007); (ii) application of a lapse rate to the temperature of the 25-km grid according to the elevation differences; and (iii) assigning the value of solar radiation to the 5-km grid equivalent to the 25-km grid encompassing it. Thus, the climate data input was based on a large ensemble, rather than several projections, and was at a high spatial resolution compared to many equivalent modeling studies.
LPJ-GUESS also required the continuous simulation of the ecosystem from 1961 to 2099. The gaps in the MaRIUS output for the periods 2005–2019 and 2050–2069 were filled in using the procedures proposed by Morales et al. (2007). This not only retained the interannual variability patterns associated with the existing climate data but also enabled a smooth transition of the temporal means and variances of the climate variables between two periods. Table 1 summarizes the LPJ-GUESS simulations used in this paper. In order to understand the CO2 effects, the simulations of all projection scenarios also were run with a constant CO2 level for 2011 for comparison.
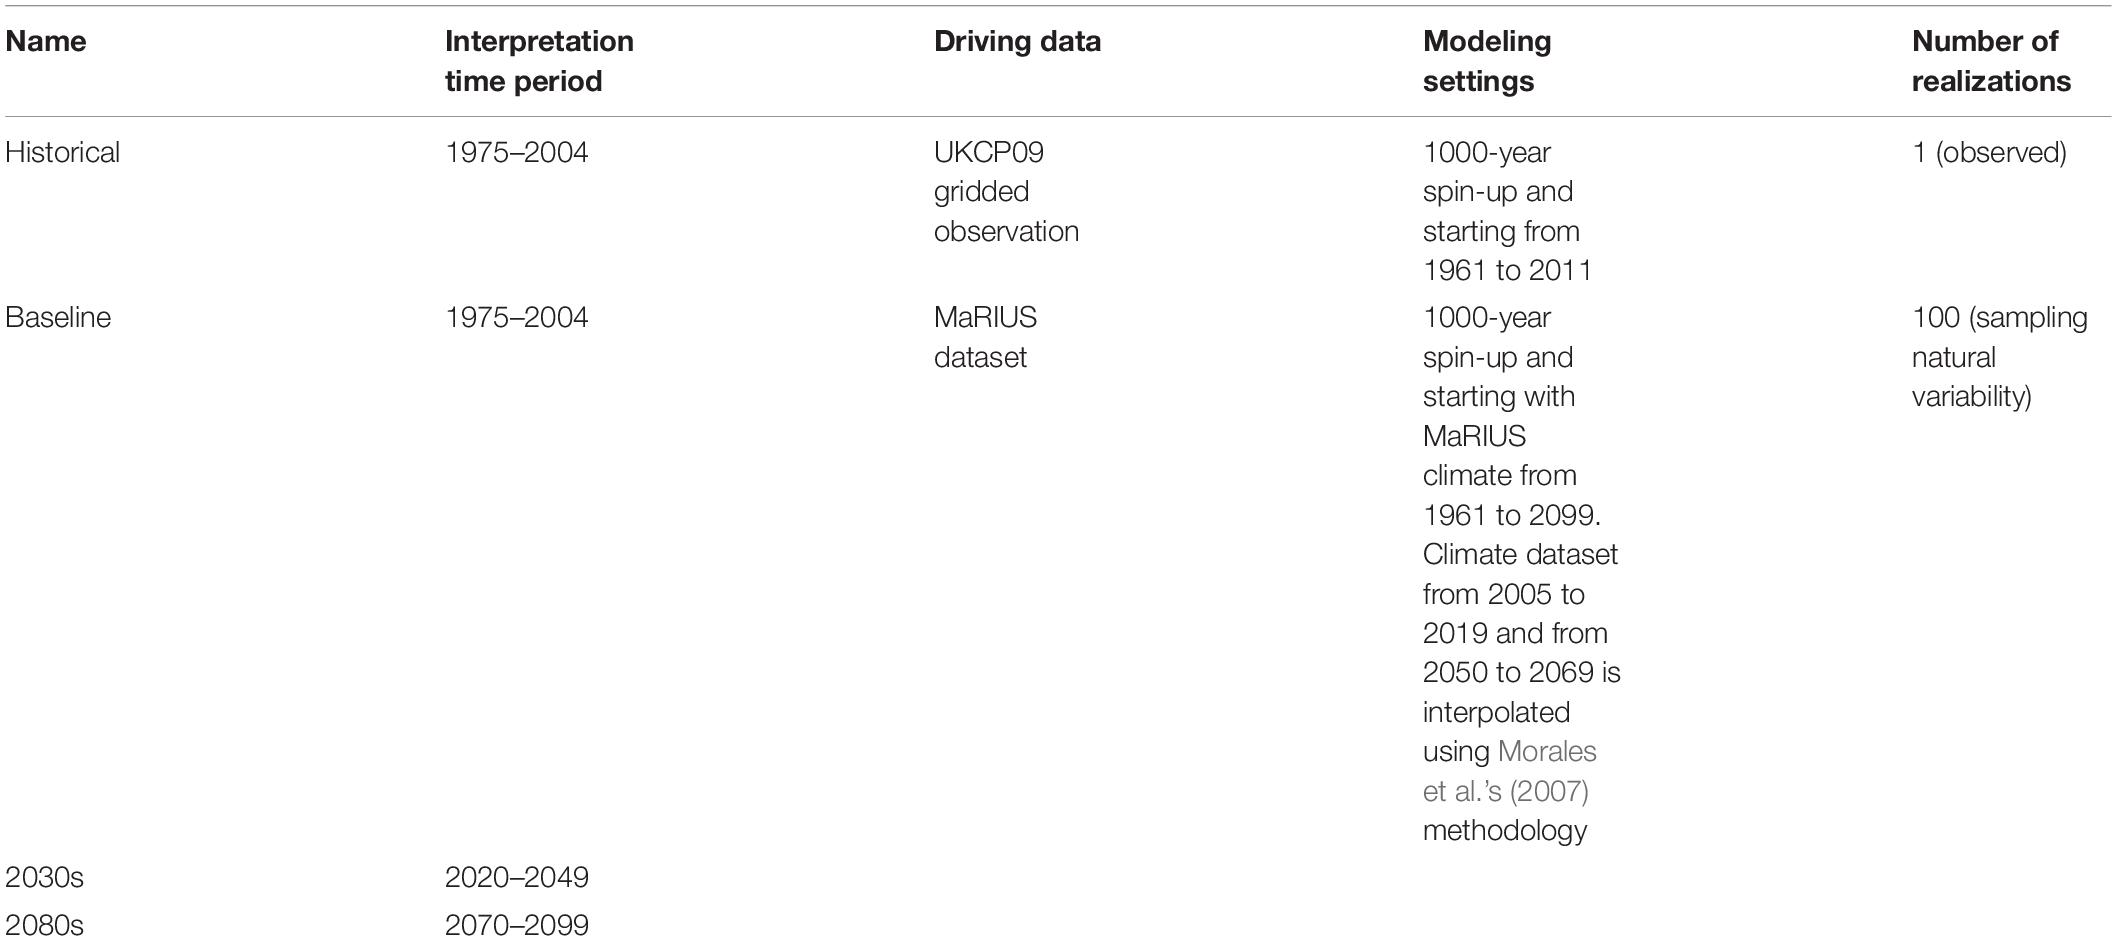
Table 1. Overview of the LPJ-GUESS simulations.
The tree mortality function was adapted from forest gap models (e.g., FORSKA). It affected plant successional dynamics and community structures (Keane et al., 2001). The tree’s death was a complex process commonly caused by interactions of different biotic and abiotic factors, such as age, drought, poor growing conditions exhausting carbon reserves, wind storms, insect outbreak, fire, and anthropogenic harvest. Here, we only considered the growth-dependent mortality, which was strongly driven by climatic variations and characterized the quality of growing conditions for a given tree species or PFT. The mortality was modeled as a stochastic function at a stand level (Steinkamp and Hickler, 2015):
where greffmean was the growth efficiency, defined as annual NPP divided by LA based on a 5-year running average. greffmin was set to 0.04, 0.06, and 0.08, respectively, according to whether the tree species or PFT was classified as shade-tolerant, intermediate-shade-tolerant, or shade-intolerant (Hickler et al., 2012). Water stress was modeled as the difference between water demand for optimal non-water-limited photosynthesis and water supply from root-distribution-weighted soil water content. It would result in reduced CO2 uptake, photosynthesis, and eventually slowed growth for several years leading to tree death. Hence, higher growth-dependent tree mortality partially reflected the degree of drought impact. For the water supply function, we used a species-specific formulation (Schurgers et al., 2011; Appendix B), which better reflected species-specific drought responses than the more general model applied in Hickler et al. (2012).
We developed the climate vulnerability index (CVI) which related future climate-induced mortality to a baseline period (1975–2004). Firstly, based on the simulated mortality in baseline, the zero-mean normalization was applied separately to the 2030s and the 2080s to obtain the time series of z-score in each period. This transformation provided a standard measure (i.e., z-score) allowing for comparison of the degree of climate impact on tree species at different time periods ignoring the temporal trend and spatial variability of the background mortality. Secondly, a threshold needed to be determined to identify the mortality of concern. The CVI was obtained by the summation of simulated mortality above the threshold (S) in the future divided by that of baseline, represented as:
where n is the number of years of the simulated mortality time series; zi is the z-score of the ith year in the simulation period; zt is the specified threshold; d is equal to 1 to indicate a concerned drought impact and set to 0 otherwise; and S is the summation of the mortality of concern indicating the severity of the potential climate impact during the corresponding simulation period. Although the CVI was not an indicator for assessing tree mortality in reality and the threshold was usually determined subjectively, a higher CVI would indicate a higher degree of climate change and drought vulnerability. It could be used to compare the differences in potential climate impacts between the geographical regions and species. A CVI of <1 meant that the potential impact was lower in the future compared to the baseline.
The MaRIUS 100 RCM outputs show that the projected mean annual temperature change over Britain increased from between 0.8 and 1.4°C in the 2030s and between 2 and 3.8°C in the 2080s (Figures 1A,C). Figures 1B,D show the range of projected mean annual temperature change varying from 0.15 to 0.4°C in both the 2030s and the 2080s. Greater warming appeared in southern Britain and in summer, with an increase of 4 to 4.5°C in the 2080s. This greater warming is consistent with other recent climate scenario outputs for the United Kingdom, such as UKCP18 (Lowe et al., 2018). Annual precipitation was projected to decrease across Britain except for the northwest coast of Scotland. The greatest reduction of precipitation was projected to occur in Wales, southwest and northwest England, and west Scotland, with an annual decrease of 50–100 mm in the 2030s and 100–150 mm in the 2080s (Figures 1E,G). The precipitation reduction in southeast England was around 0–50 mm in the 2030s rising to 50–100 mm in the 2080s. The range of the projected annual precipitation change showed a similar pattern for both the 2030s and the 2080s, with more than 300 mm on the northwest coast; 100–200 mm in Scotland, Wales, and northwest and southwest England; and 0–100 mm in southeast England (Figures 1F,H). Thus, the MaRIUS climate datasets could be considered as an appropriate test bed for dry conditions, although it may overestimate the dryness in southeast England.
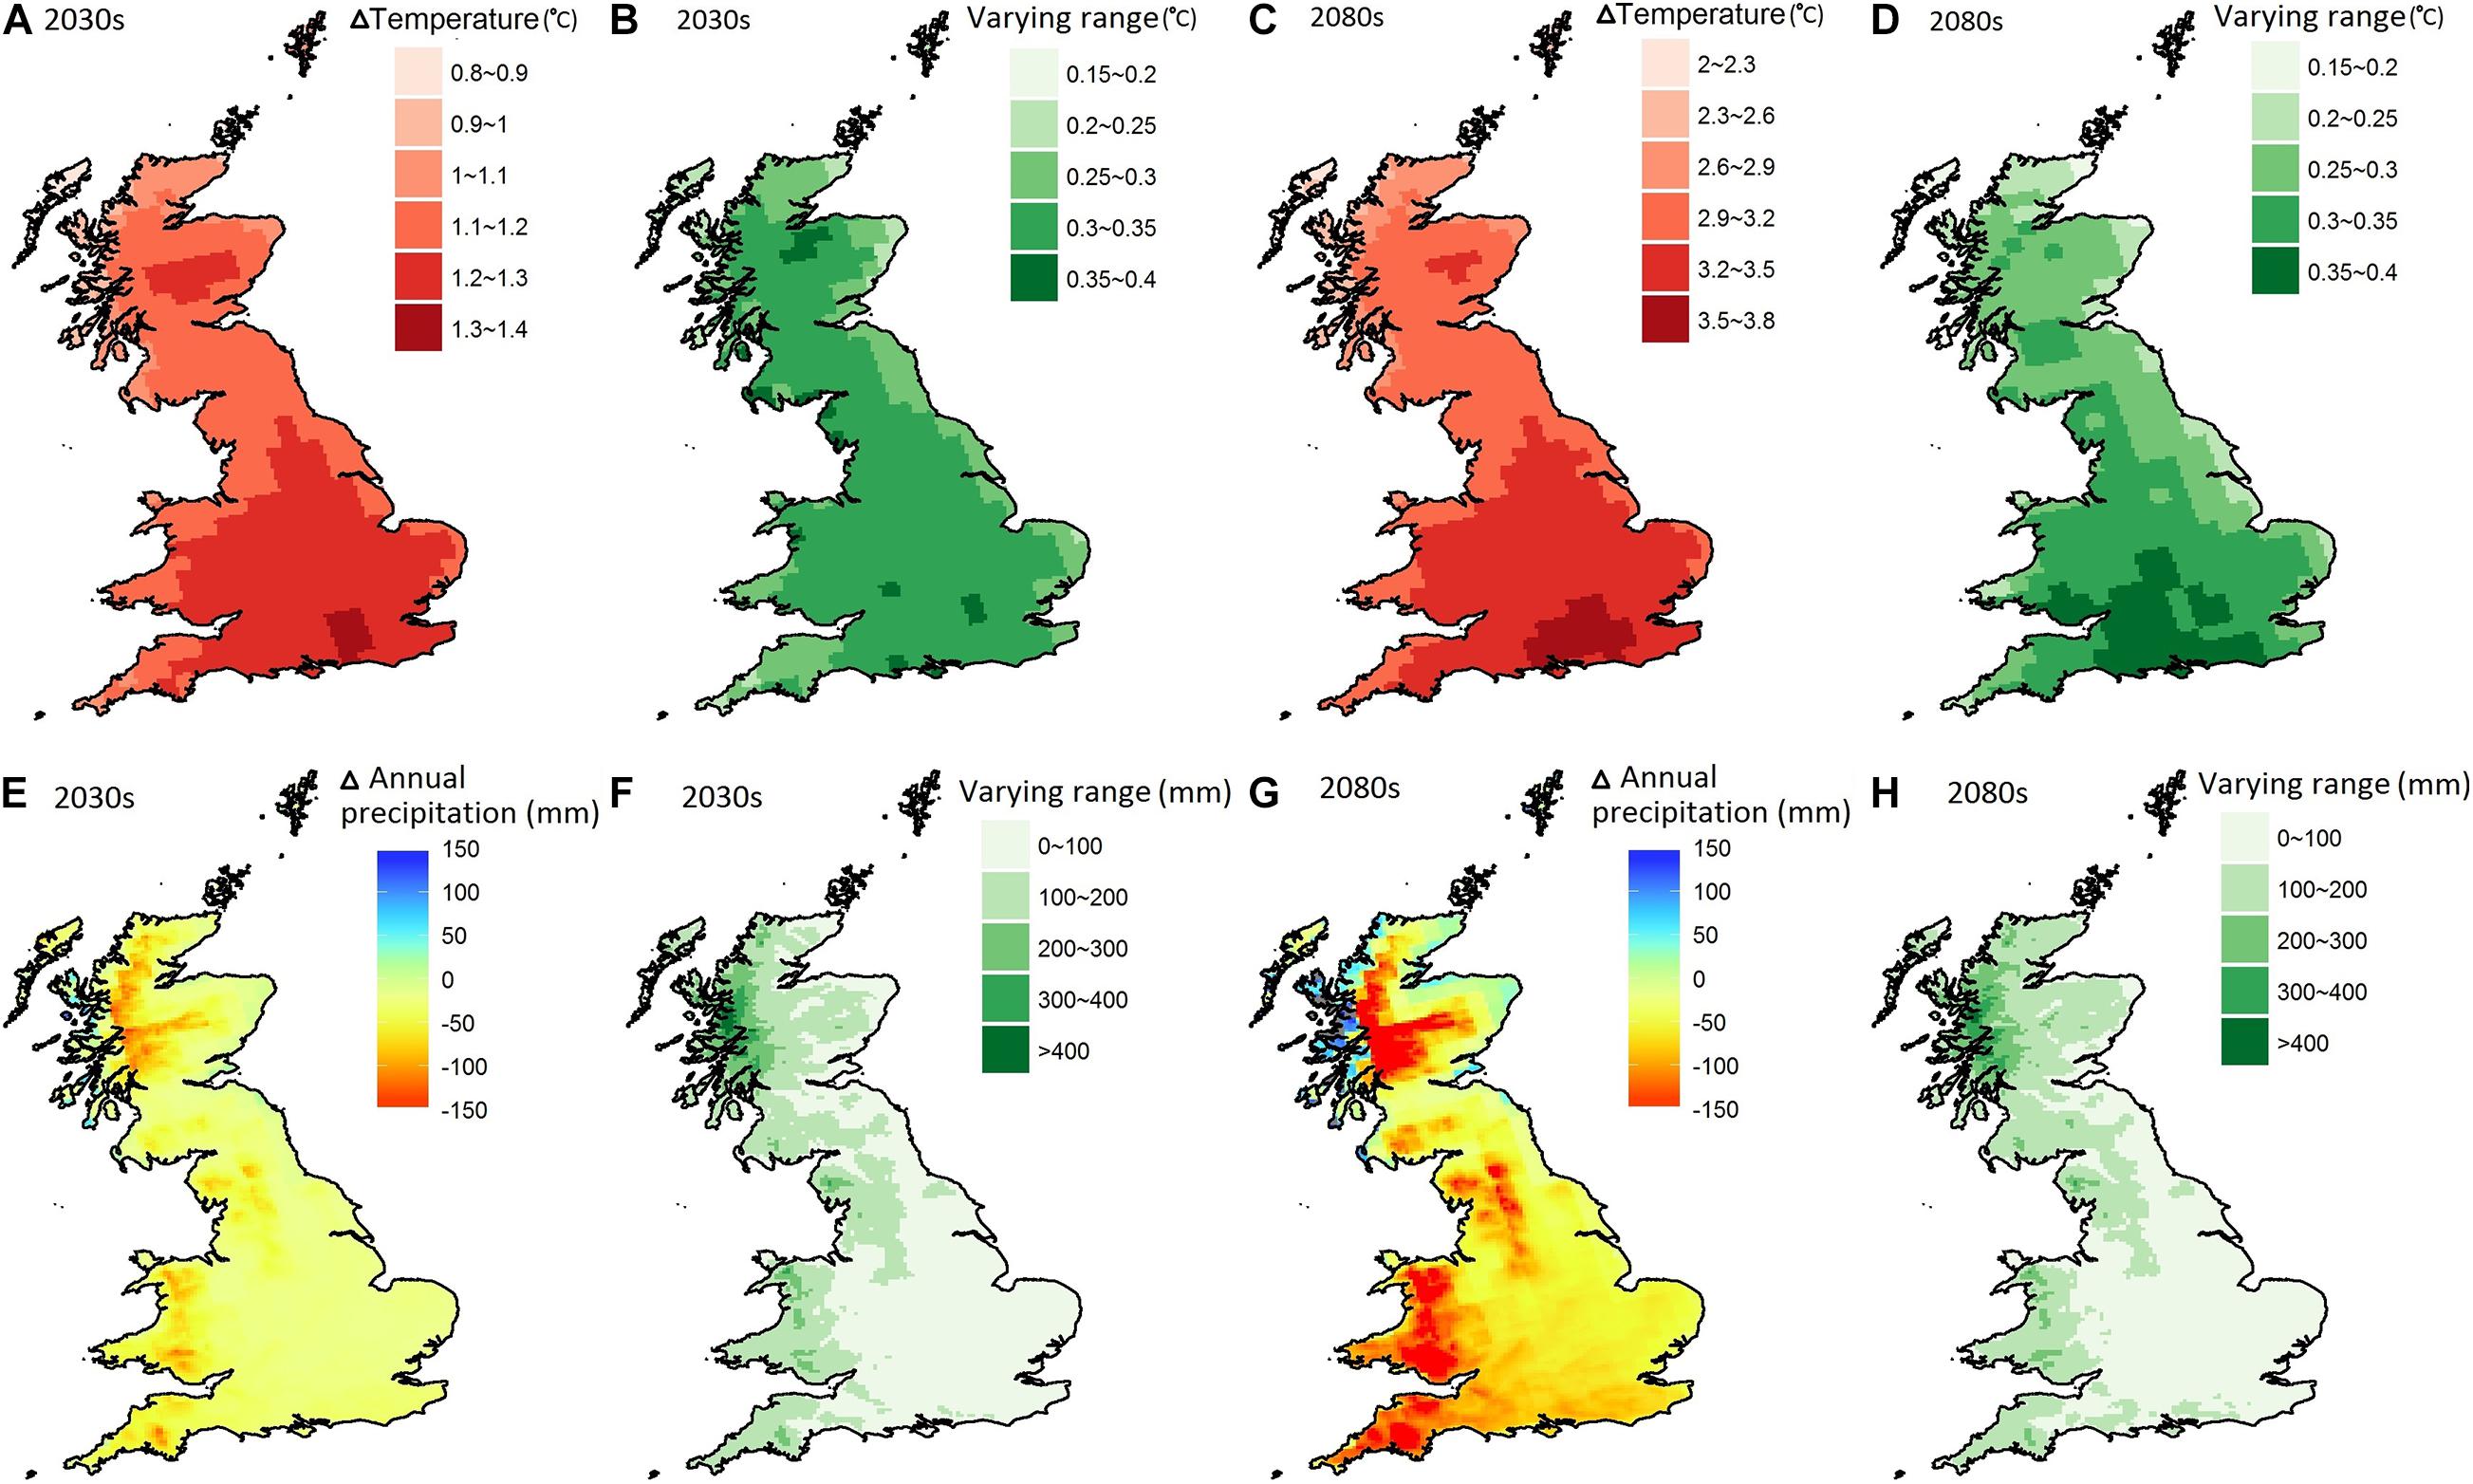
Figure 1. The mean change of the projected annual temperature (A,C) and precipitation (E,G) averaged over the 2030s and the 2080s relative to the baseline (1975–2004); the range of the projected change of temperature (B,D) and precipitation (F,H) between the 10 and 90th percentiles in the 2030s and the 2080s.
The potential impacts of climate change were analyzed by comparing the modeled average LAI (i.e., representing vegetation structure) and NPP in the 2030s and the 2080s to the baseline (i.e., 1975–2004). With 100 modeling runs available, mean changes in modeled ecosystem properties are shown, complemented by the range of the 10–90th percentiles to indicate the uncertainty arising from natural weather-induced variability. The climate vulnerability of selected tree species was assessed using the CVI based on comparing the simulated growth-dependent mortality in the future to that of the baseline.
The projected mean change in LAI summed across all tree species and PFTs over Britain ranged from 0.25 to 2.24 in the 2030s and from 0.9 to 4.2 in the 2080s (Figures 2A,B). Without a change in CO2, the mean LAI change was slightly less with ranges from 0.2 to 2.2 in the 2030s and from 0.6 to 3.7 in the 2080s (Figures 2C,D). As expected, the CO2 level only affects the degree of modeled LAI change but has no impact on the geographical patterns. In both CO2 settings, the simulated areas of greatest LAI change occur in Scotland and northern England, as conditions become more suitable for deciduous tree species to grow under the warming climate. This also implies that a greater change in tree composition may occur in these regions.
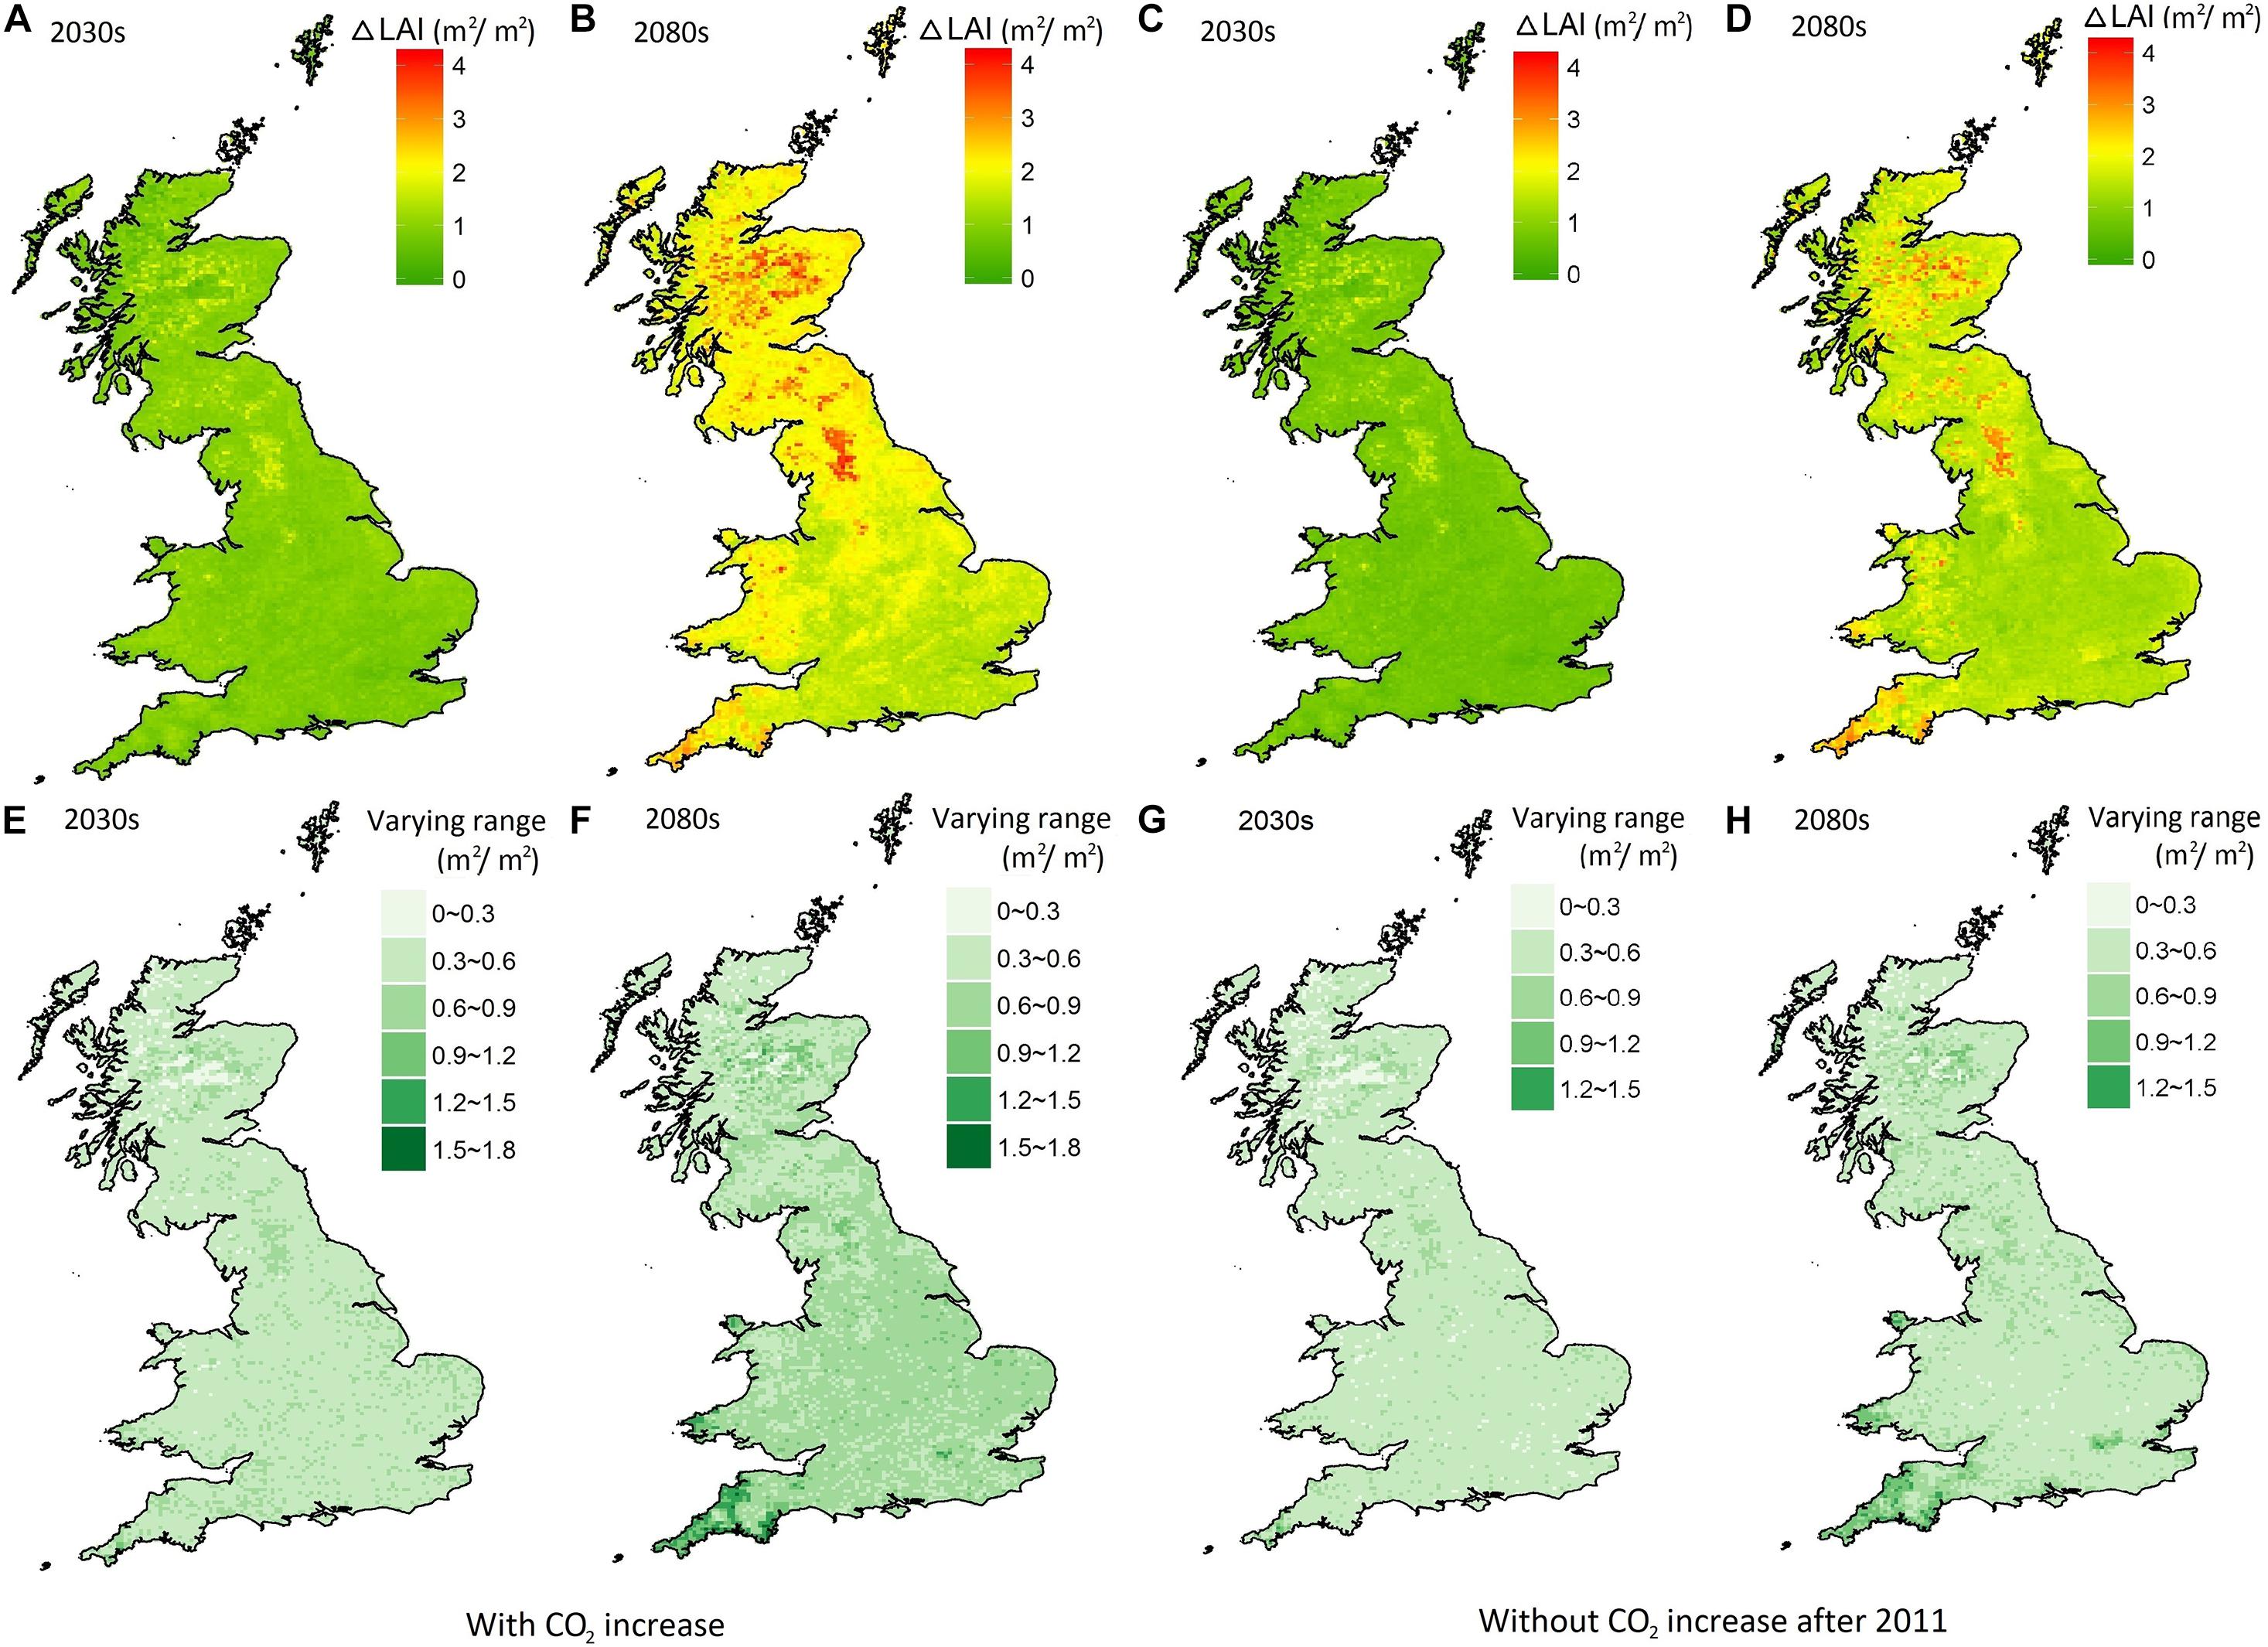
Figure 2. The projected mean change of LAI in the 2030s (A,C) and the 2080s (B,D) relative to the baseline from 1975 to 2004; the range of the LAI change between the 10 and 90th percentiles in the 2030s (E,G) and the 2080s (F,H).
The range of projected LAI change due to the natural weather-induced variability is slightly lower (0.1–1.3) in the 2030s (Figure 2E), than the 2080s range of 0.1–1.8 (Figure 2F). According to the ratio of the projected range of LAI change to the mean value, the degree of uncertainty (in terms of model results with different climate ensembles members) was slightly larger in the 2030s (with the ratio from 0.14 to 1.1) compared to that in the 2080s (from 0.08 to 0.92). Geographically, the climate-related uncertainty is slightly larger in southern Britain. A similar pattern, but with a slightly lower degree of natural weather-induced uncertainty, can be found in the modeling results without CO2 increase (Figures 2G,H), with a range of 0–1.5 for both the 2030s and the 2080s. The results revealed that the CO2 increase has limited impact on the degree of uncertainty caused by climate variability.
The simulated net LAI change was in a range of –0.2–0.98 and –0.95–1.93 in the 2030s and the 2080s, respectively, under the stable CO2 scenarios (Figures 3A,B). In the 2080s, the net LAI change increased from 0 to 1.93 in Britain, except for SE and SW England, where the net LAI change decreased by 0–0.95. The difference of projected net LAI change between stable and increased CO2 showed that the increase of CO2 led to an increase of net LAI change of 0–0.3 in the 2030s with the same climate conditions (Figure 3C). In the 2080s especially, the increase in CO2 had a greater effect on the increase of net LAI in England and Wales with an increase of 0.8–1.2, compared to most areas in Scotland with an increase of less than 0.8 (Figure 3D). This indicated that the CO2 increase had a relatively greater effect on tree species composition in these regions (Figure 3D) in comparison to temperature and precipitation.
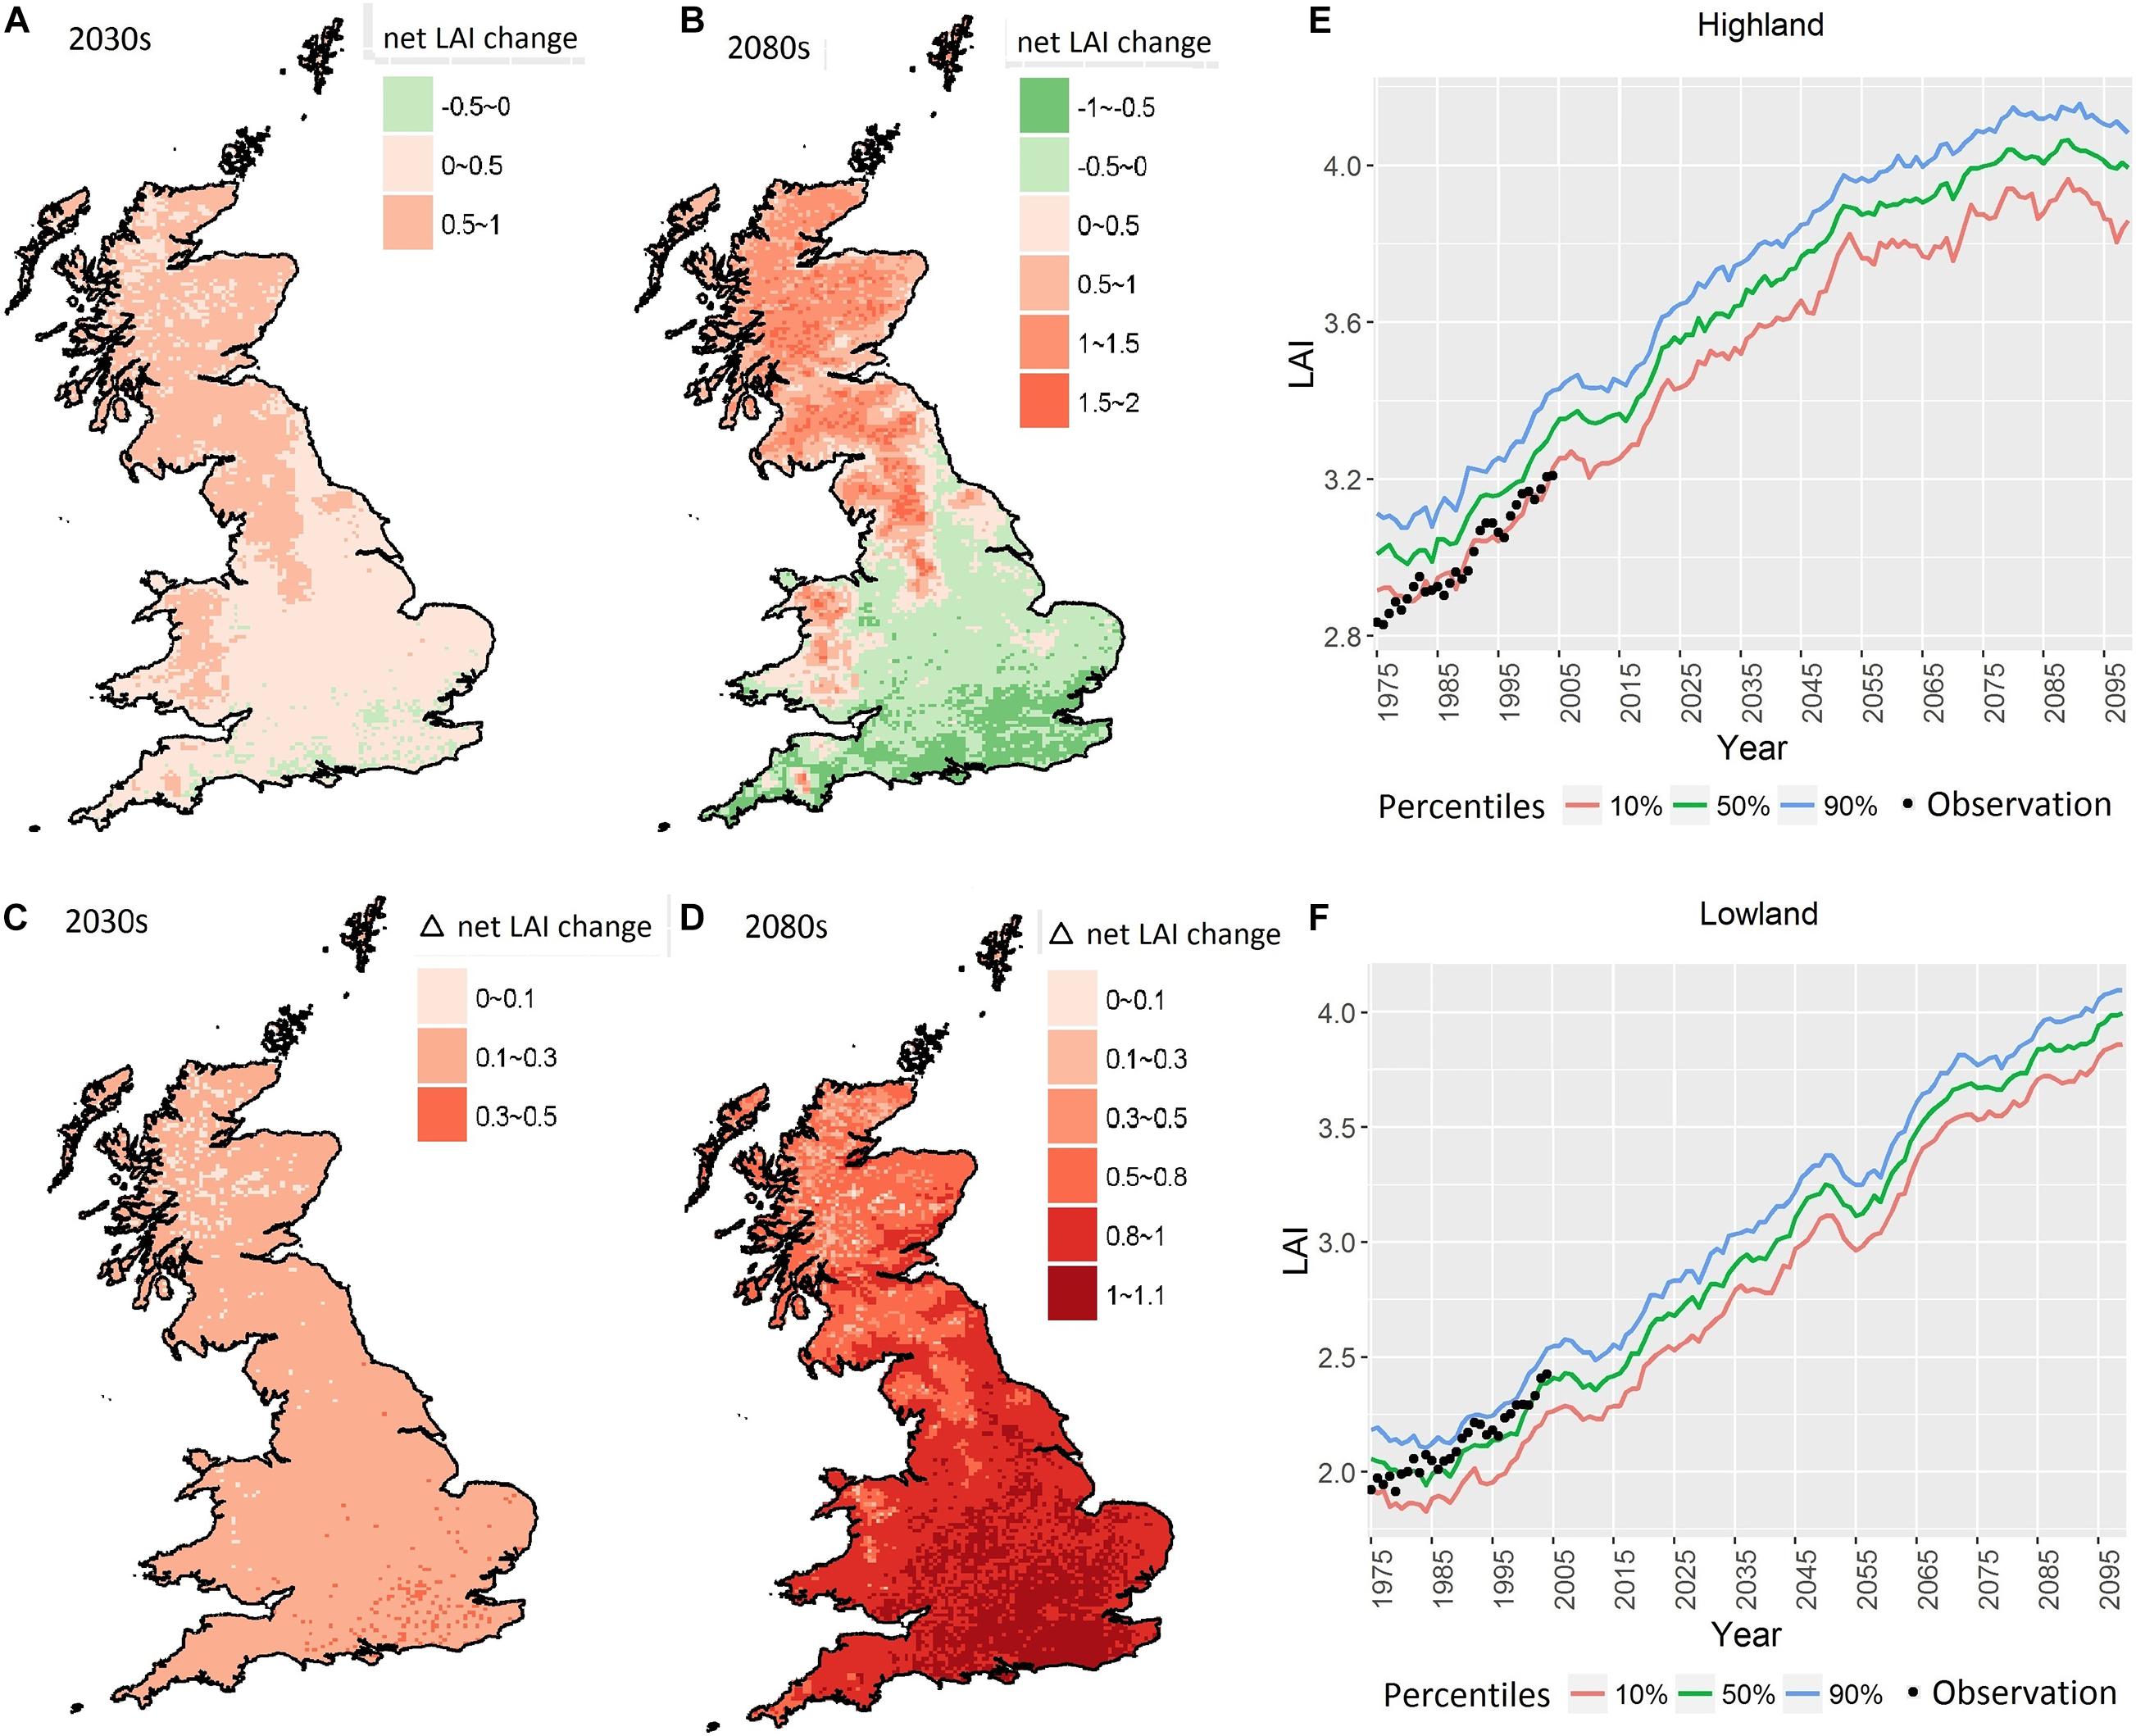
Figure 3. The projected net LAI change in the 2030s (A) and 2080s (B); the difference of projected net LAI change when CO2 increase was enabled compared to its absence in 2030s (C) and 2080s (D) relative to (A,B); the time series of net LAI in highland (E) and lowland (F) simulated using observations and MaRIUS climate.
The time series of simulated net LAI (Figures 3E,F) showed that for the 50th percentiles, the LAI across Britain was projected to increase gradually by around 30% for the uplands and 100% for lowlands from 1975 to the late twenty-first century. The associated uncertainty remains stable for all the years, with the range between 5 and 10% of the 50th percentiles. Compared to the modeling results for 1975–2004, simulated by the observation climate dataset (black dots), the dynamic ecosystem model driven by the ensemble RCM scenarios tended to overestimate the LAI of the 50th percentiles in the uplands. Therefore, it should be noted that the future physiological response of trees in reality is most probably in the lower range of the MaRIUS scenarios in the uplands.
Plotting the ratio of LAI change of individual tree species relative to baseline for the 19 river basin regions used in UKCP09 (Murphy et al., 2009) helped understand more regional potential tree species composition change (Figure 4). The LAI generally increased for all the tree species in the 2030s. Despite the overall LAI increment in the 2080s, downy birch (Betula pubescens), hornbeam (Carpinus betulus), beech (Fagus sylvatica), and small-leaved lime (Tilia cordata) showed lower increments in England and Wales. The LAI increase for hazel (Corylus avellana), silver birch (Betula pendula), ash (Fraxinus excelsior), aspen (Populus tremula), oak (Quercus spp.), and elm (Ulmus glabra) in southern Britain (i.e., Anglian, Thames, SE England, SW England, Severn, and W Wales basins) remained at a similar level to that in the 2030s. The magnitude of LAI increment for these species increased gradually from southern to northern Britain. This indicated the increased future suitability of conditions in northern Britain for most deciduous tree species. Without an increase of CO2 (Figure 5), the degree of relative LAI change for each species mostly decreased, especially in southern Britain river basins. A decrease of LAI can have mixed effects, decreasing water and nutrient use but also NPP and carbon uptake. In terms of relative LAI change, the nondominant species (i.e., silver birch, hornbeam, hazel, aspen, and small-leaved lime) had larger uncertainty than other species, especially in the 2080s and in southern Britain.
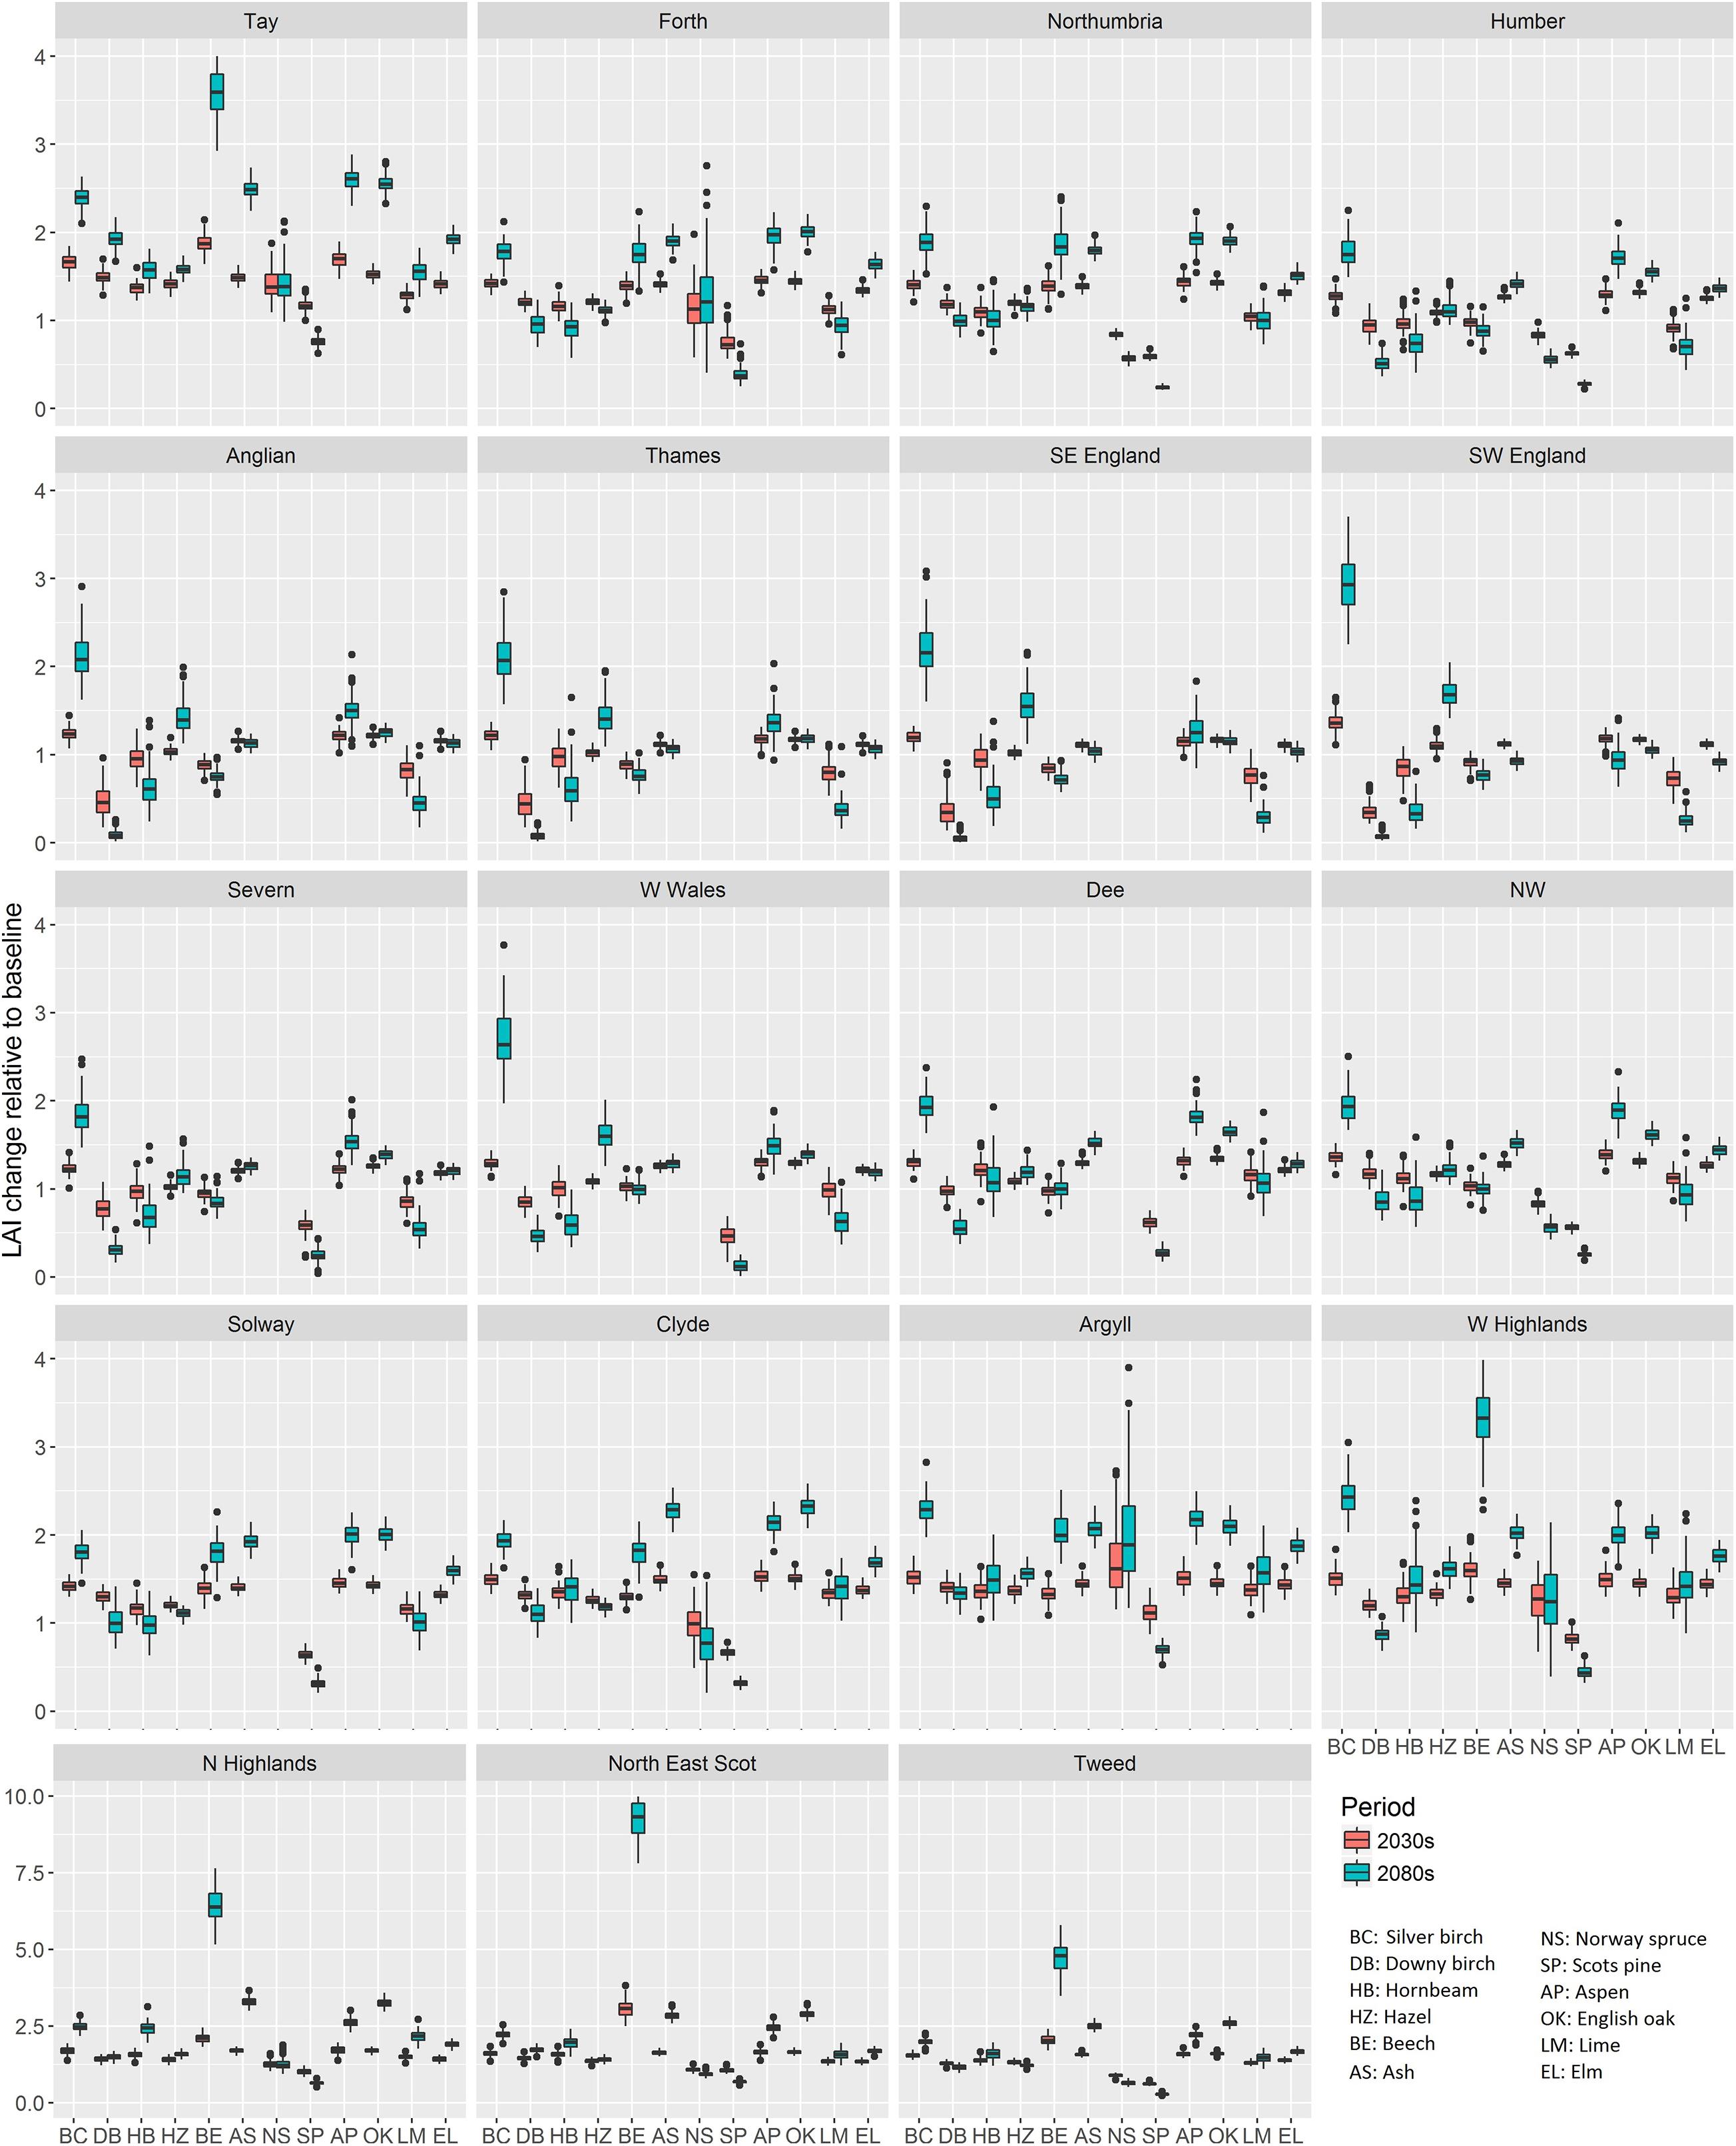
Figure 4. The boxplot of simulated LAI change with CO2 increase enabled in the 2030s and the 2080s relative to baseline (1975–2004) for 12 modeled tree species and 19 river basin regions.
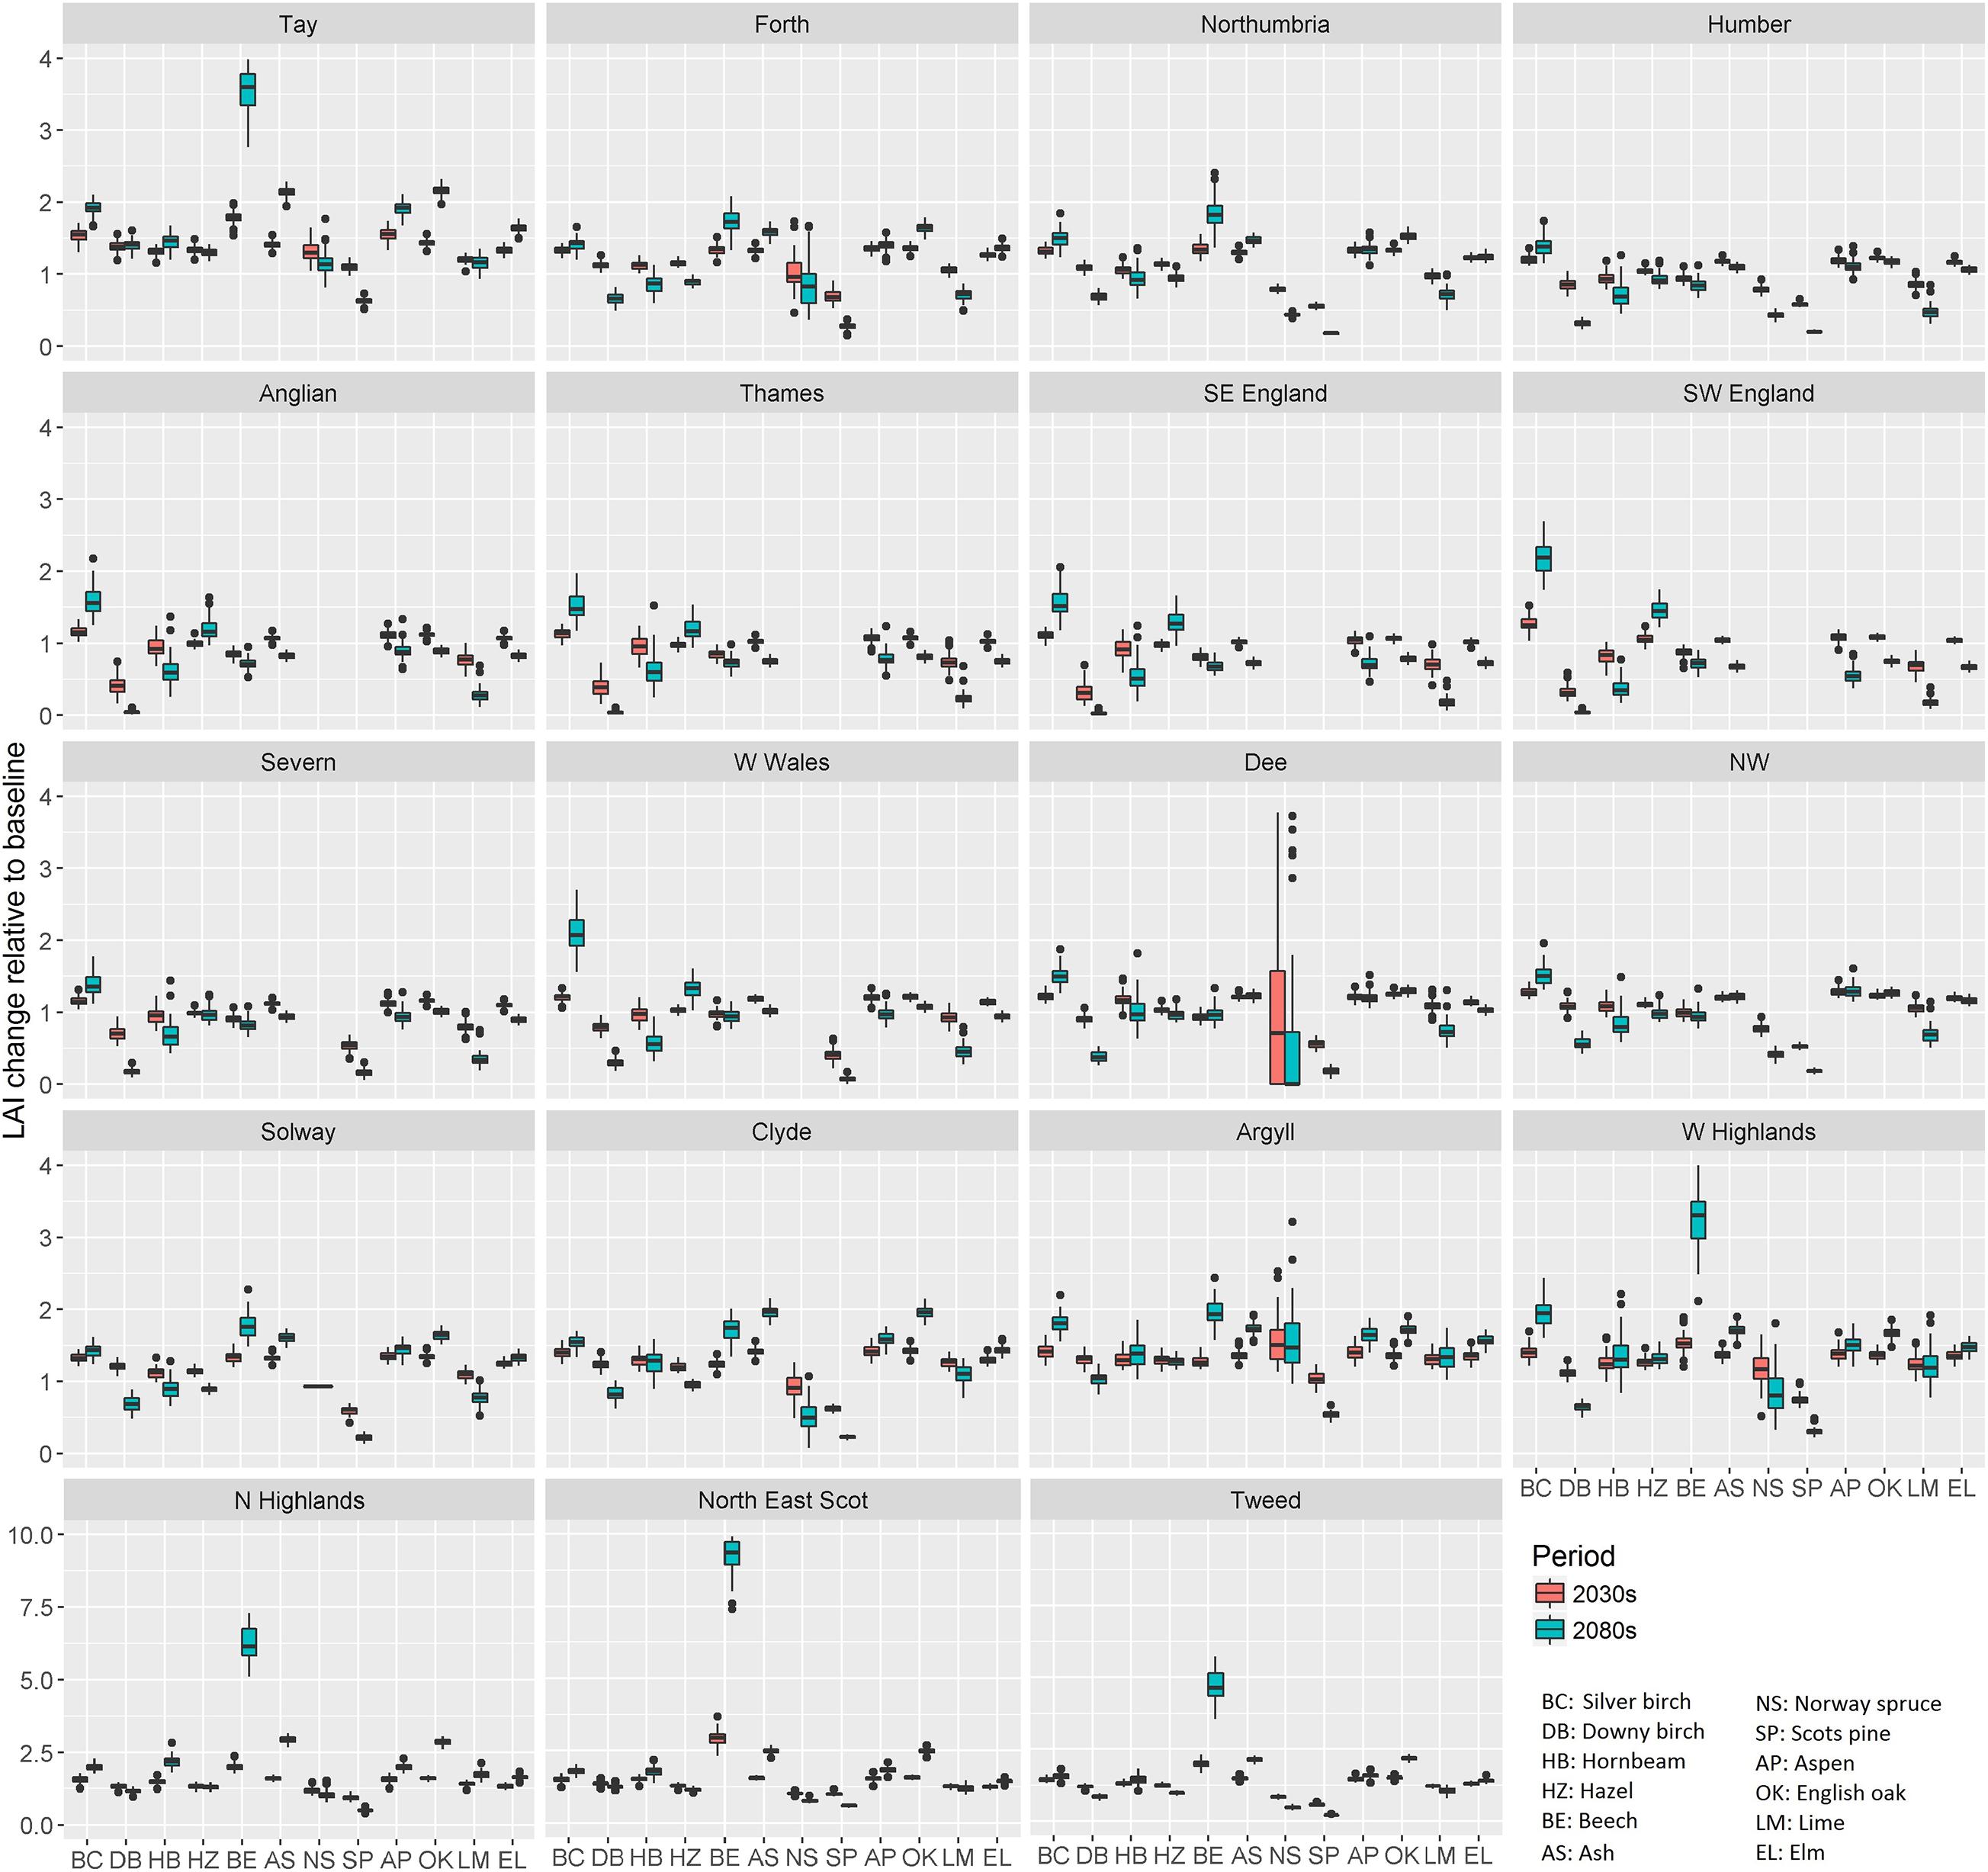
Figure 5. The boxplot of simulated LAI change without CO2 increase in the 2030s and the 2080s relative to baseline (1975–2004) for 12 modeled tree species and 19 river basin regions.
The geographical distribution of NPP averaged over 1975–2004, simulated by using the observation climate dataset varied from around 0.1 to 0.5 kgC/m2/year over Britain, with an average of 0.36 kgC/m2/year (Figure 6A). The dynamic global vegetation model, JULES, which has been applied to Britain and is based on five plant functional types, only two of which are woodland, had baseline (1998–2008) NPP values of 0.2 to 1.0 kgC/m2/year (Ritchie et al., 2019). However, it is acknowledged that it possibly overpredicts productivity and it has a shorter, more recent baseline. It showed a good agreement, not surprisingly, with the average estimate for Europe (i.e., 0.38 kgC/m2/year) from an earlier version of LPJ-GUESS based on PFTs, driven with results from a range of RCMs at 0.5° resolution (about 50 km) from CORDEX (Morales et al., 2007). It also was within the range of measurements of NPP at a seminatural woodland, Wytham Woods, Oxfordshire, United Kingdom, which recorded NPP as 0.13 kg/m2/annum over a 2-year period (Thomas et al., 2011), while an earlier study, including soil productivity, recorded 0.7 kg/m2/annum (Fenn et al., 2010).
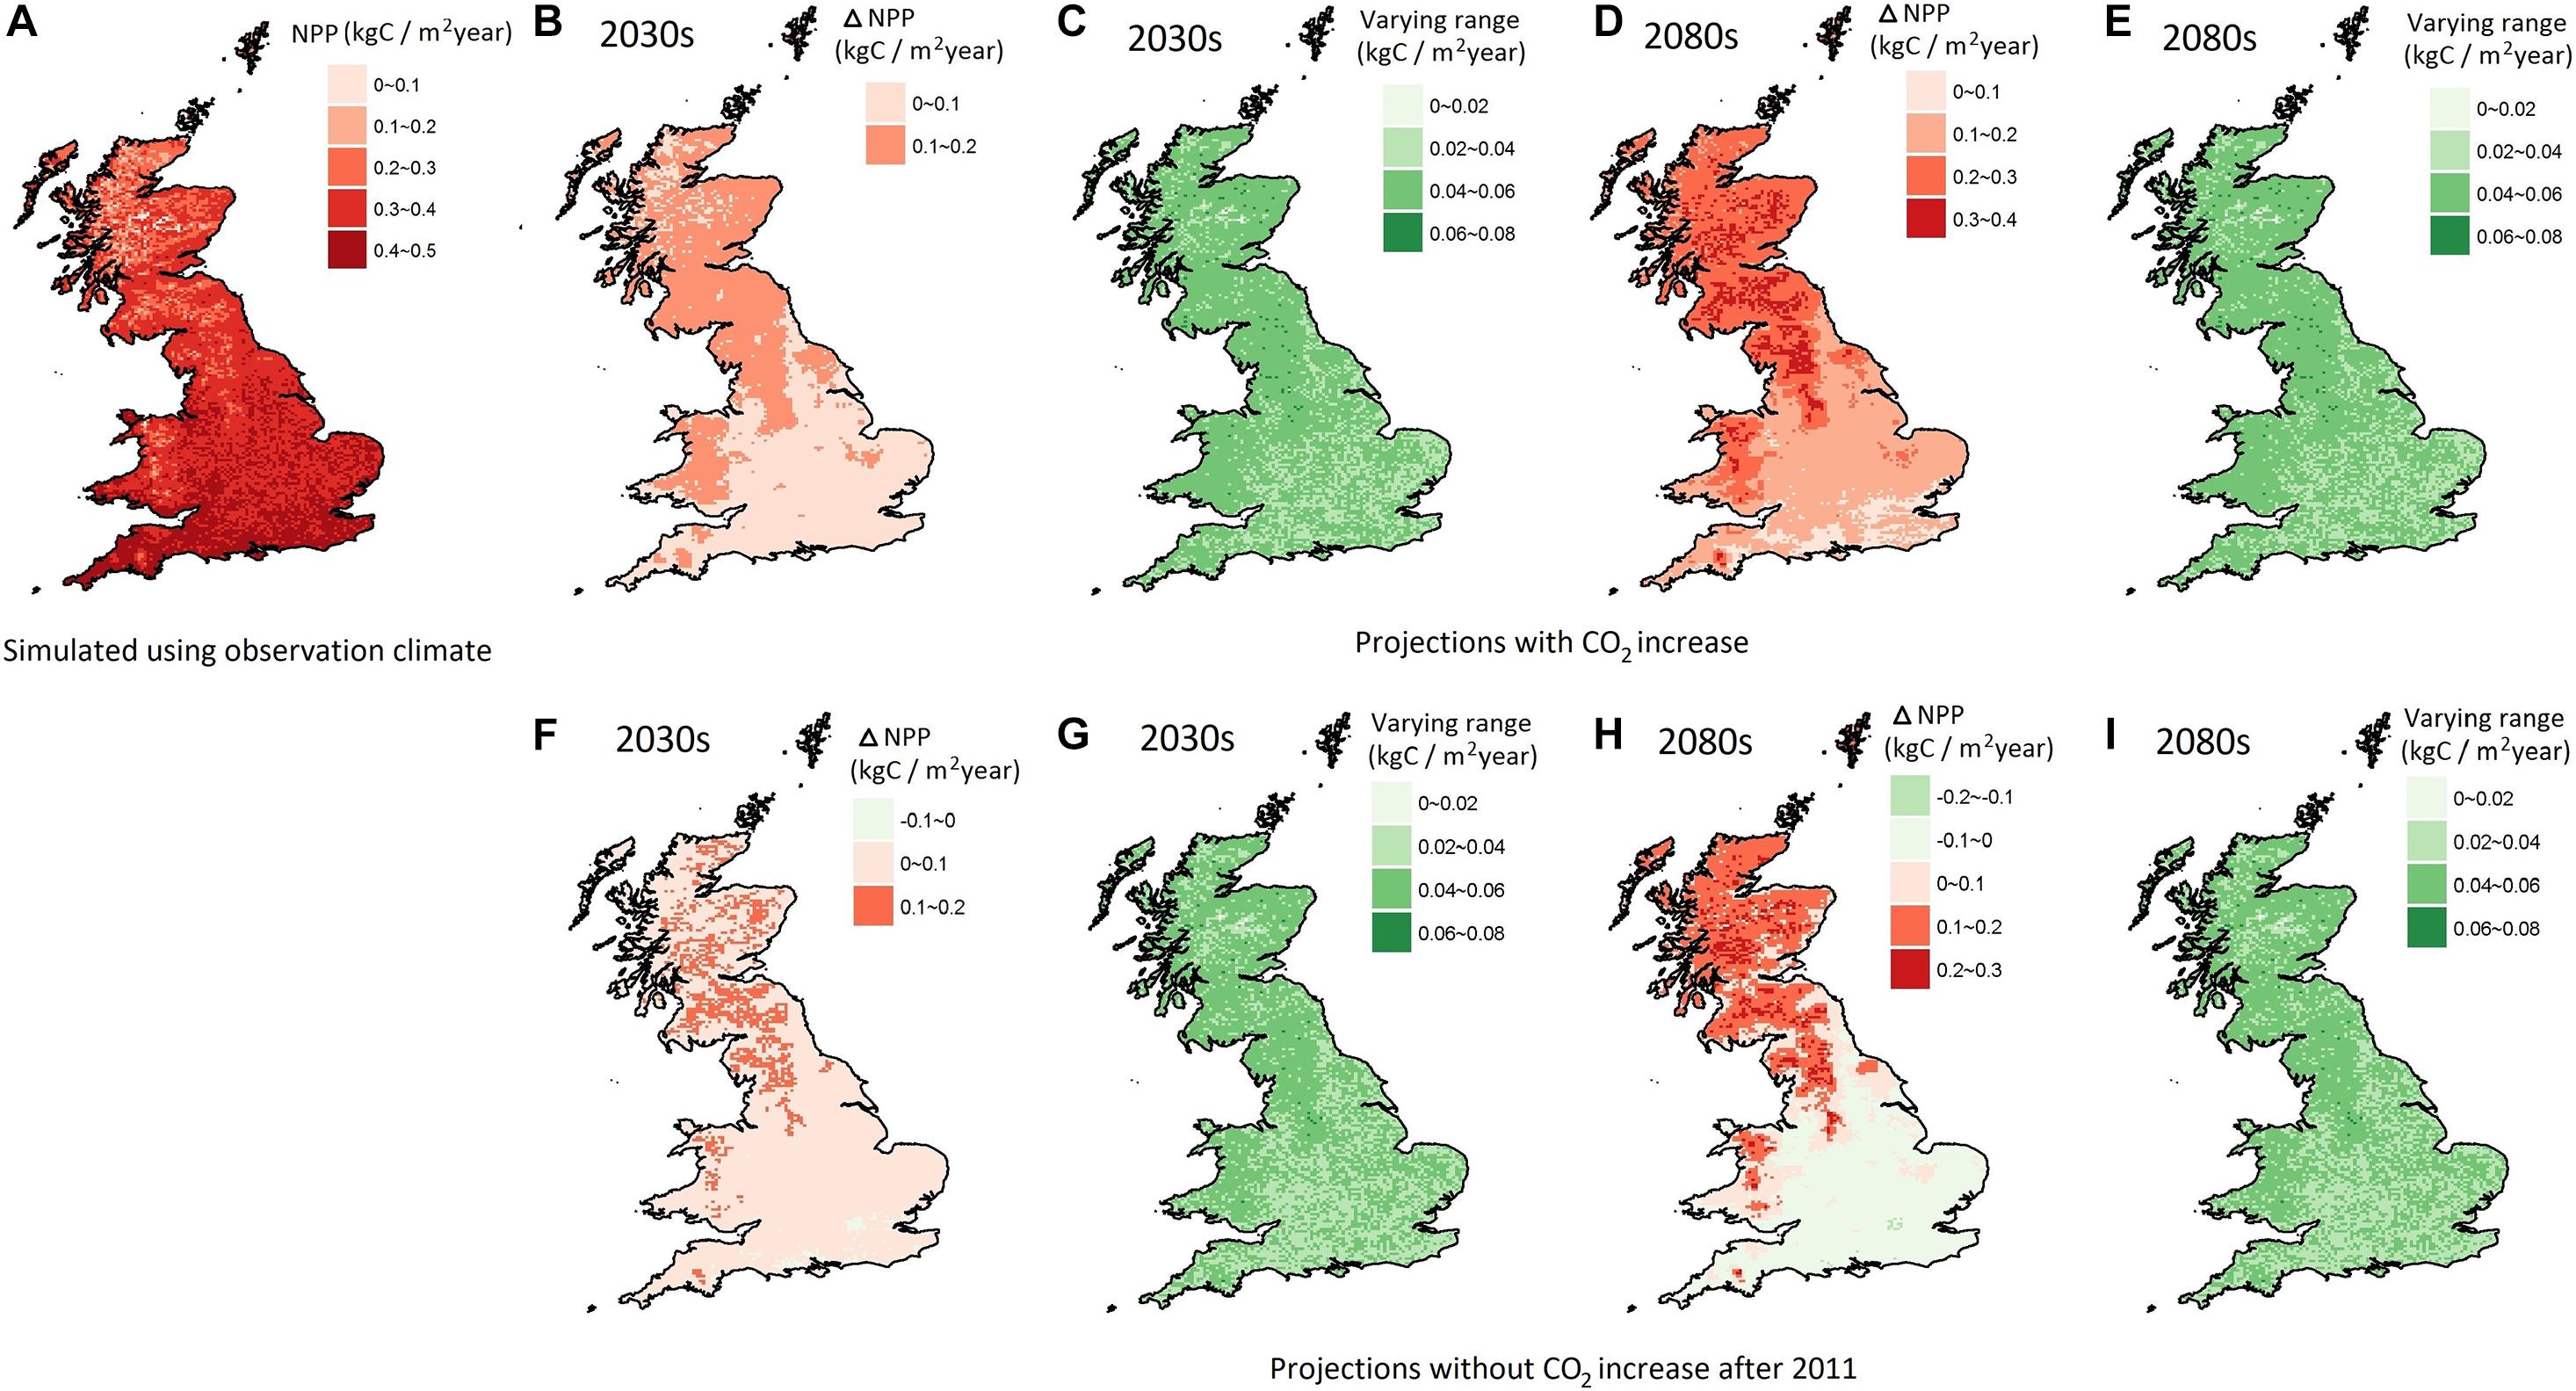
Figure 6. The modeled present-day NPP (A) averaged over the period from 1975 to 2004 driven by observation climate dataset; the mean (B,D,F,H) and range (C,E,G,I) of the NPP change in the 2030s and the 2080s with and without a CO2 increase, respectively.
NPP was projected to increase by 0.03–0.18 kgC/m2/year in the 2030s and 0.05–0.39 kgC/m2/year in the 2080s (Figures 6B,D). Without a CO2 increase, a relative smaller NPP increase, and even a very slight decline, was projected of –0.02–0.15 kgC/m2/year in the 2030s, and –0.12–0.28 kgC/m2/year in the 2080s (Figures 6F,H). These figures are lower than Ritchie et al. (2019), who modeled changes for 2,100 without CO2 ranging from –0.5 kgC/m2/year in southern Britain to +0.5 kgC/m2/year in the north and from 0.1 to 0.5 kgC/m2/year with CO2.
The CO2 effect had greater impacts on southern Britain with a modeled decrease of NPP change without CO2 increase. The geographical patterns of the NPP change projections in the 2080s were similar to those of Ritchie et al. (2019). Morales et al. (2007) also showed larger increases in the northern half of Britain and west Wales. According to the LPJ-GUESS model, the higher temperatures are likely to increase the suitable conditions for most deciduous trees growing in northern Britain, with the potential to replace the non-woody vegetation and coniferous species. The relatively lower increment of NPP in south and southeast Britain might be due to the offset effects of increased evapotranspiration and soil water depletion caused by the increased temperature. These results are consistent with the conclusions of Broadmeadow et al. (2005), based on the Ecological Site Classification model (which does not include potential plant-physiological effects of increasing atmospheric CO2), that water limitation in southern England is likely to lead to an overall reduction in growth for the majority of native broadleaf species. Thus, this paper, using a process-based model, demonstrates the vulnerability of woodlands in southern Britain to climate change, especially without further increases in CO2.
The range of the projected NPP change across Britain (Figures 6C,E) was from 0.01 to 0.067 in the 2030s, which is greater in the 2080s (0.01–0.076). It showed a similar level to the modeled range under scenarios without CO2 increase (Figures 6G,I). Relative to the mean change of NPP, the degree of uncertainty in NPP change was slightly larger in the 2030s. The absence of the CO2 increase added to the degree of uncertainty originating from natural weather-induced variability.
Figure 7 shows the statistical distribution of the mortality z-values simulated using the observation climate dataset. We selected the z-value of 1.18 as the threshold to derive the CVI because the temporal pattern (i.e., inset figure in Figure 7) of the climate-induced mortality above this threshold showed the peaks of climate impacts in 1977/79, 1985–87, 1996, 2002, and 2004. These are consistent (with slight lags in some) with the reported historical drought events in 1975/76, 1984, 1989/90, 1991/92, 1995–97, 2003, and 2004–06 in the United Kingdom. The time lags were expected because mortality is often increased some years after drought events (e.g., Peterken and Mountford, 1996) and also the model formulations are based on a 5-year running average growth efficiency. With 100 ensemble projections available, we interpreted the CVI at the 50th percentiles under the scenarios with CO2 increase enabled. The choice of percentile and CO2 modeling scenario will lead to variations in the CVI value; however, it will not affect the geographical patterns of climate vulnerability among the tree species and across river basin regions. Hence, it could guide the government or stakeholders in investing resources strategically to more vulnerable species and regions. Overall, climate-driven mortality was projected to decrease in the future (Figure 7), but with large spatial and species-specific variation (Figure 8) as discussed below.
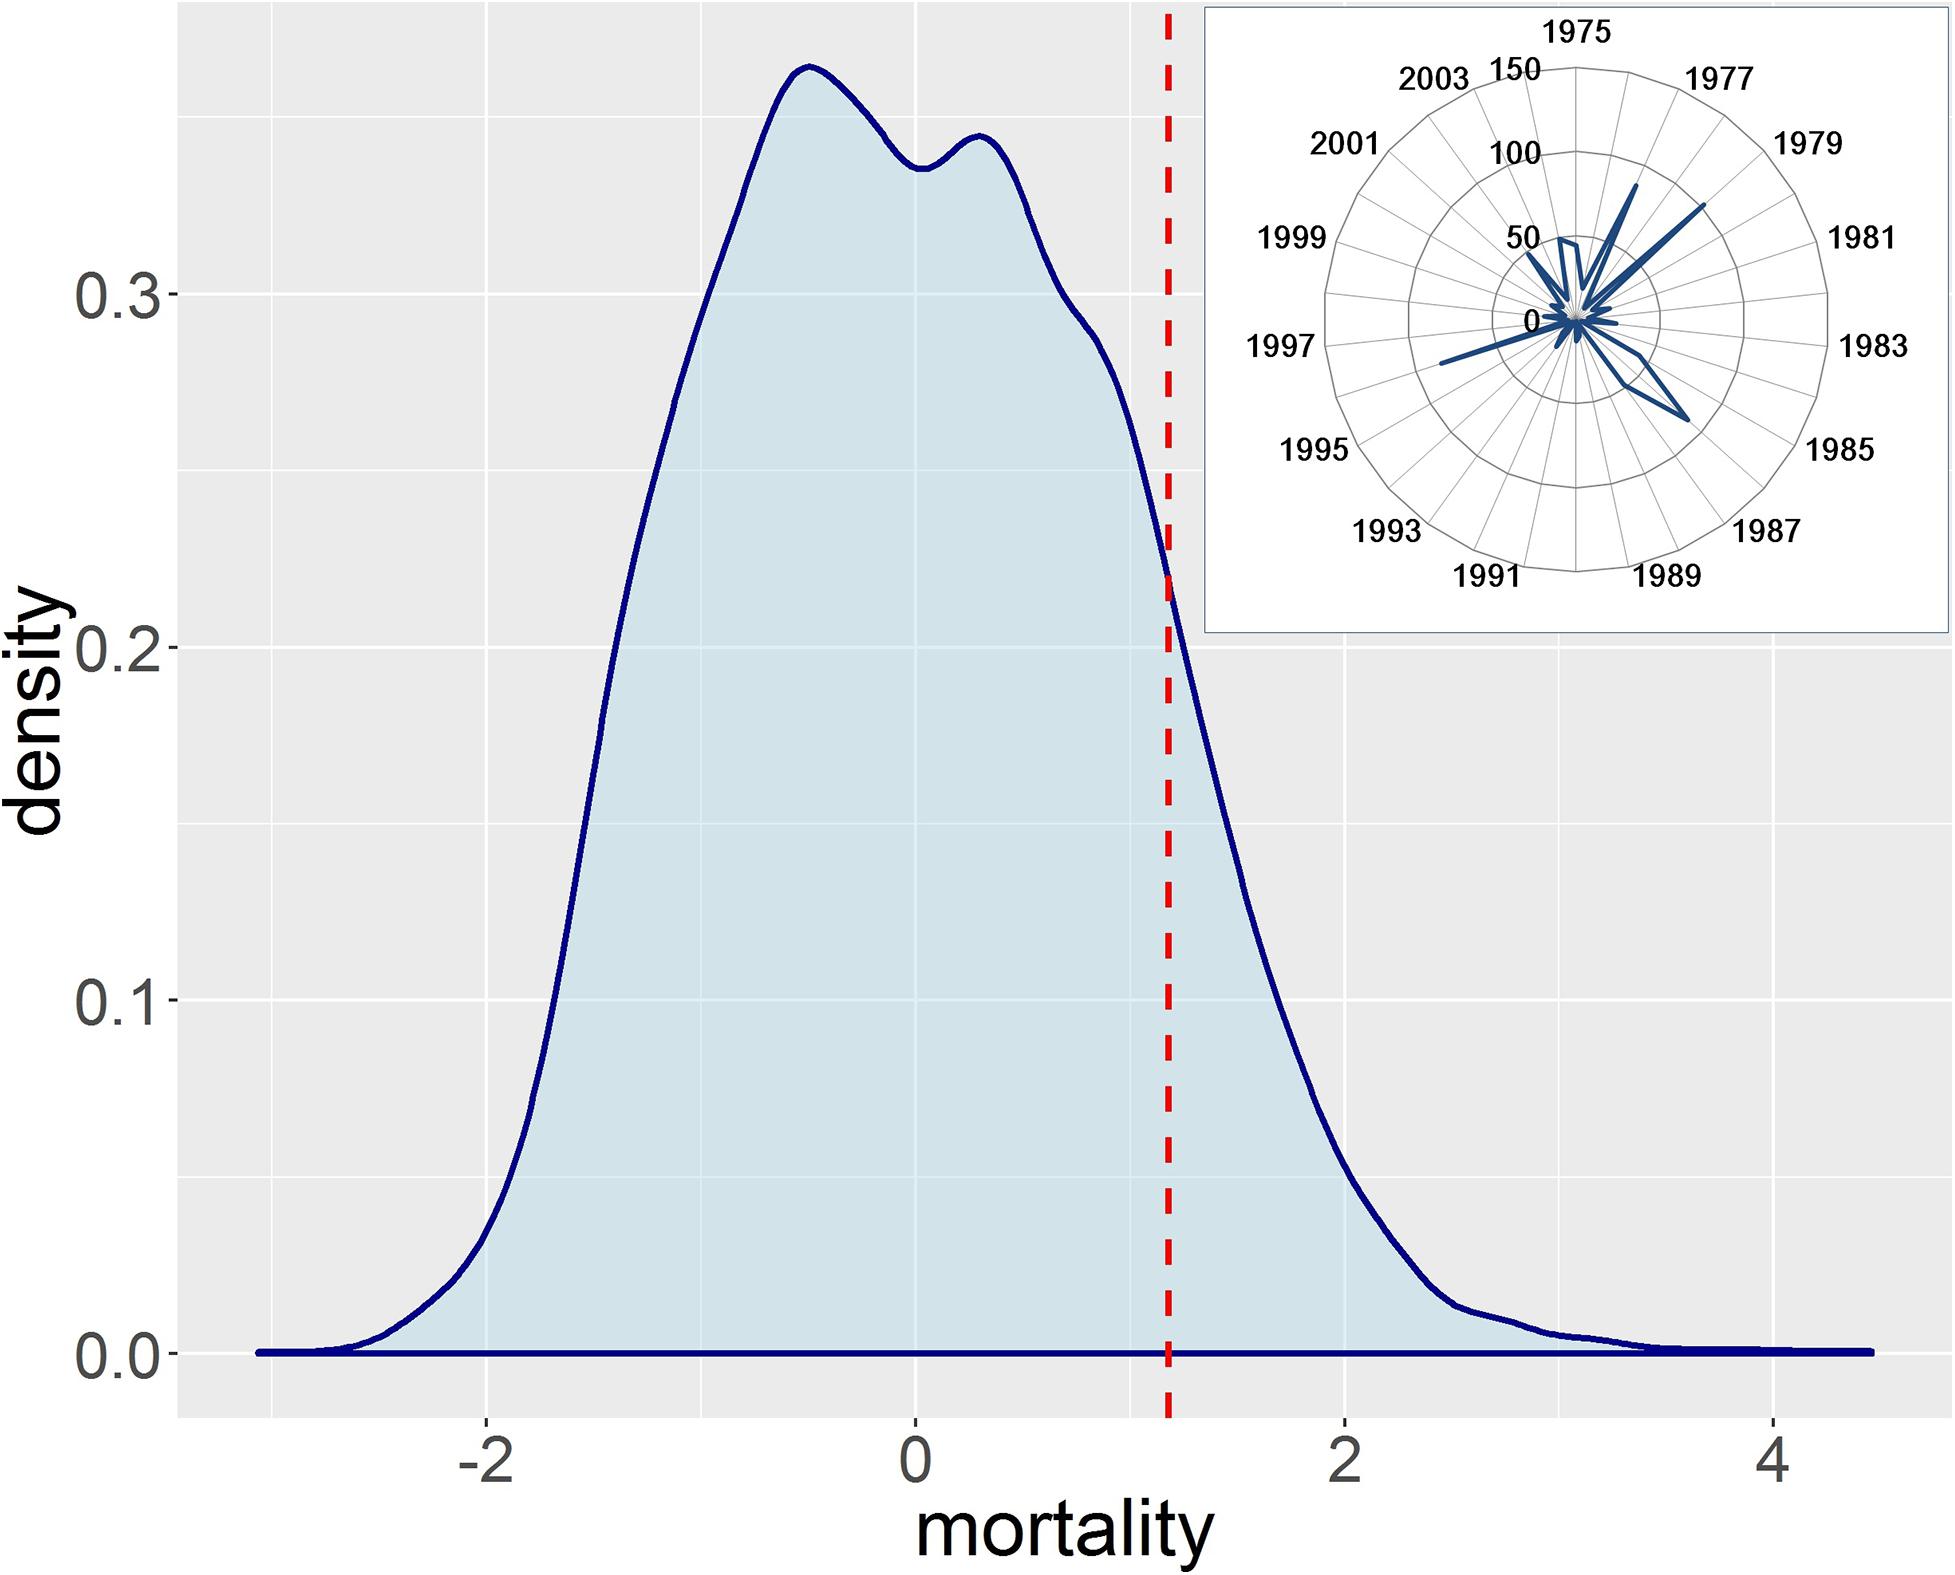
Figure 7. Statistical distribution of simulated mortality z-values using observation climate dataset and temporal pattern (i.e., percentiles) of mortality z-values above the threshold for different years (inset figure).
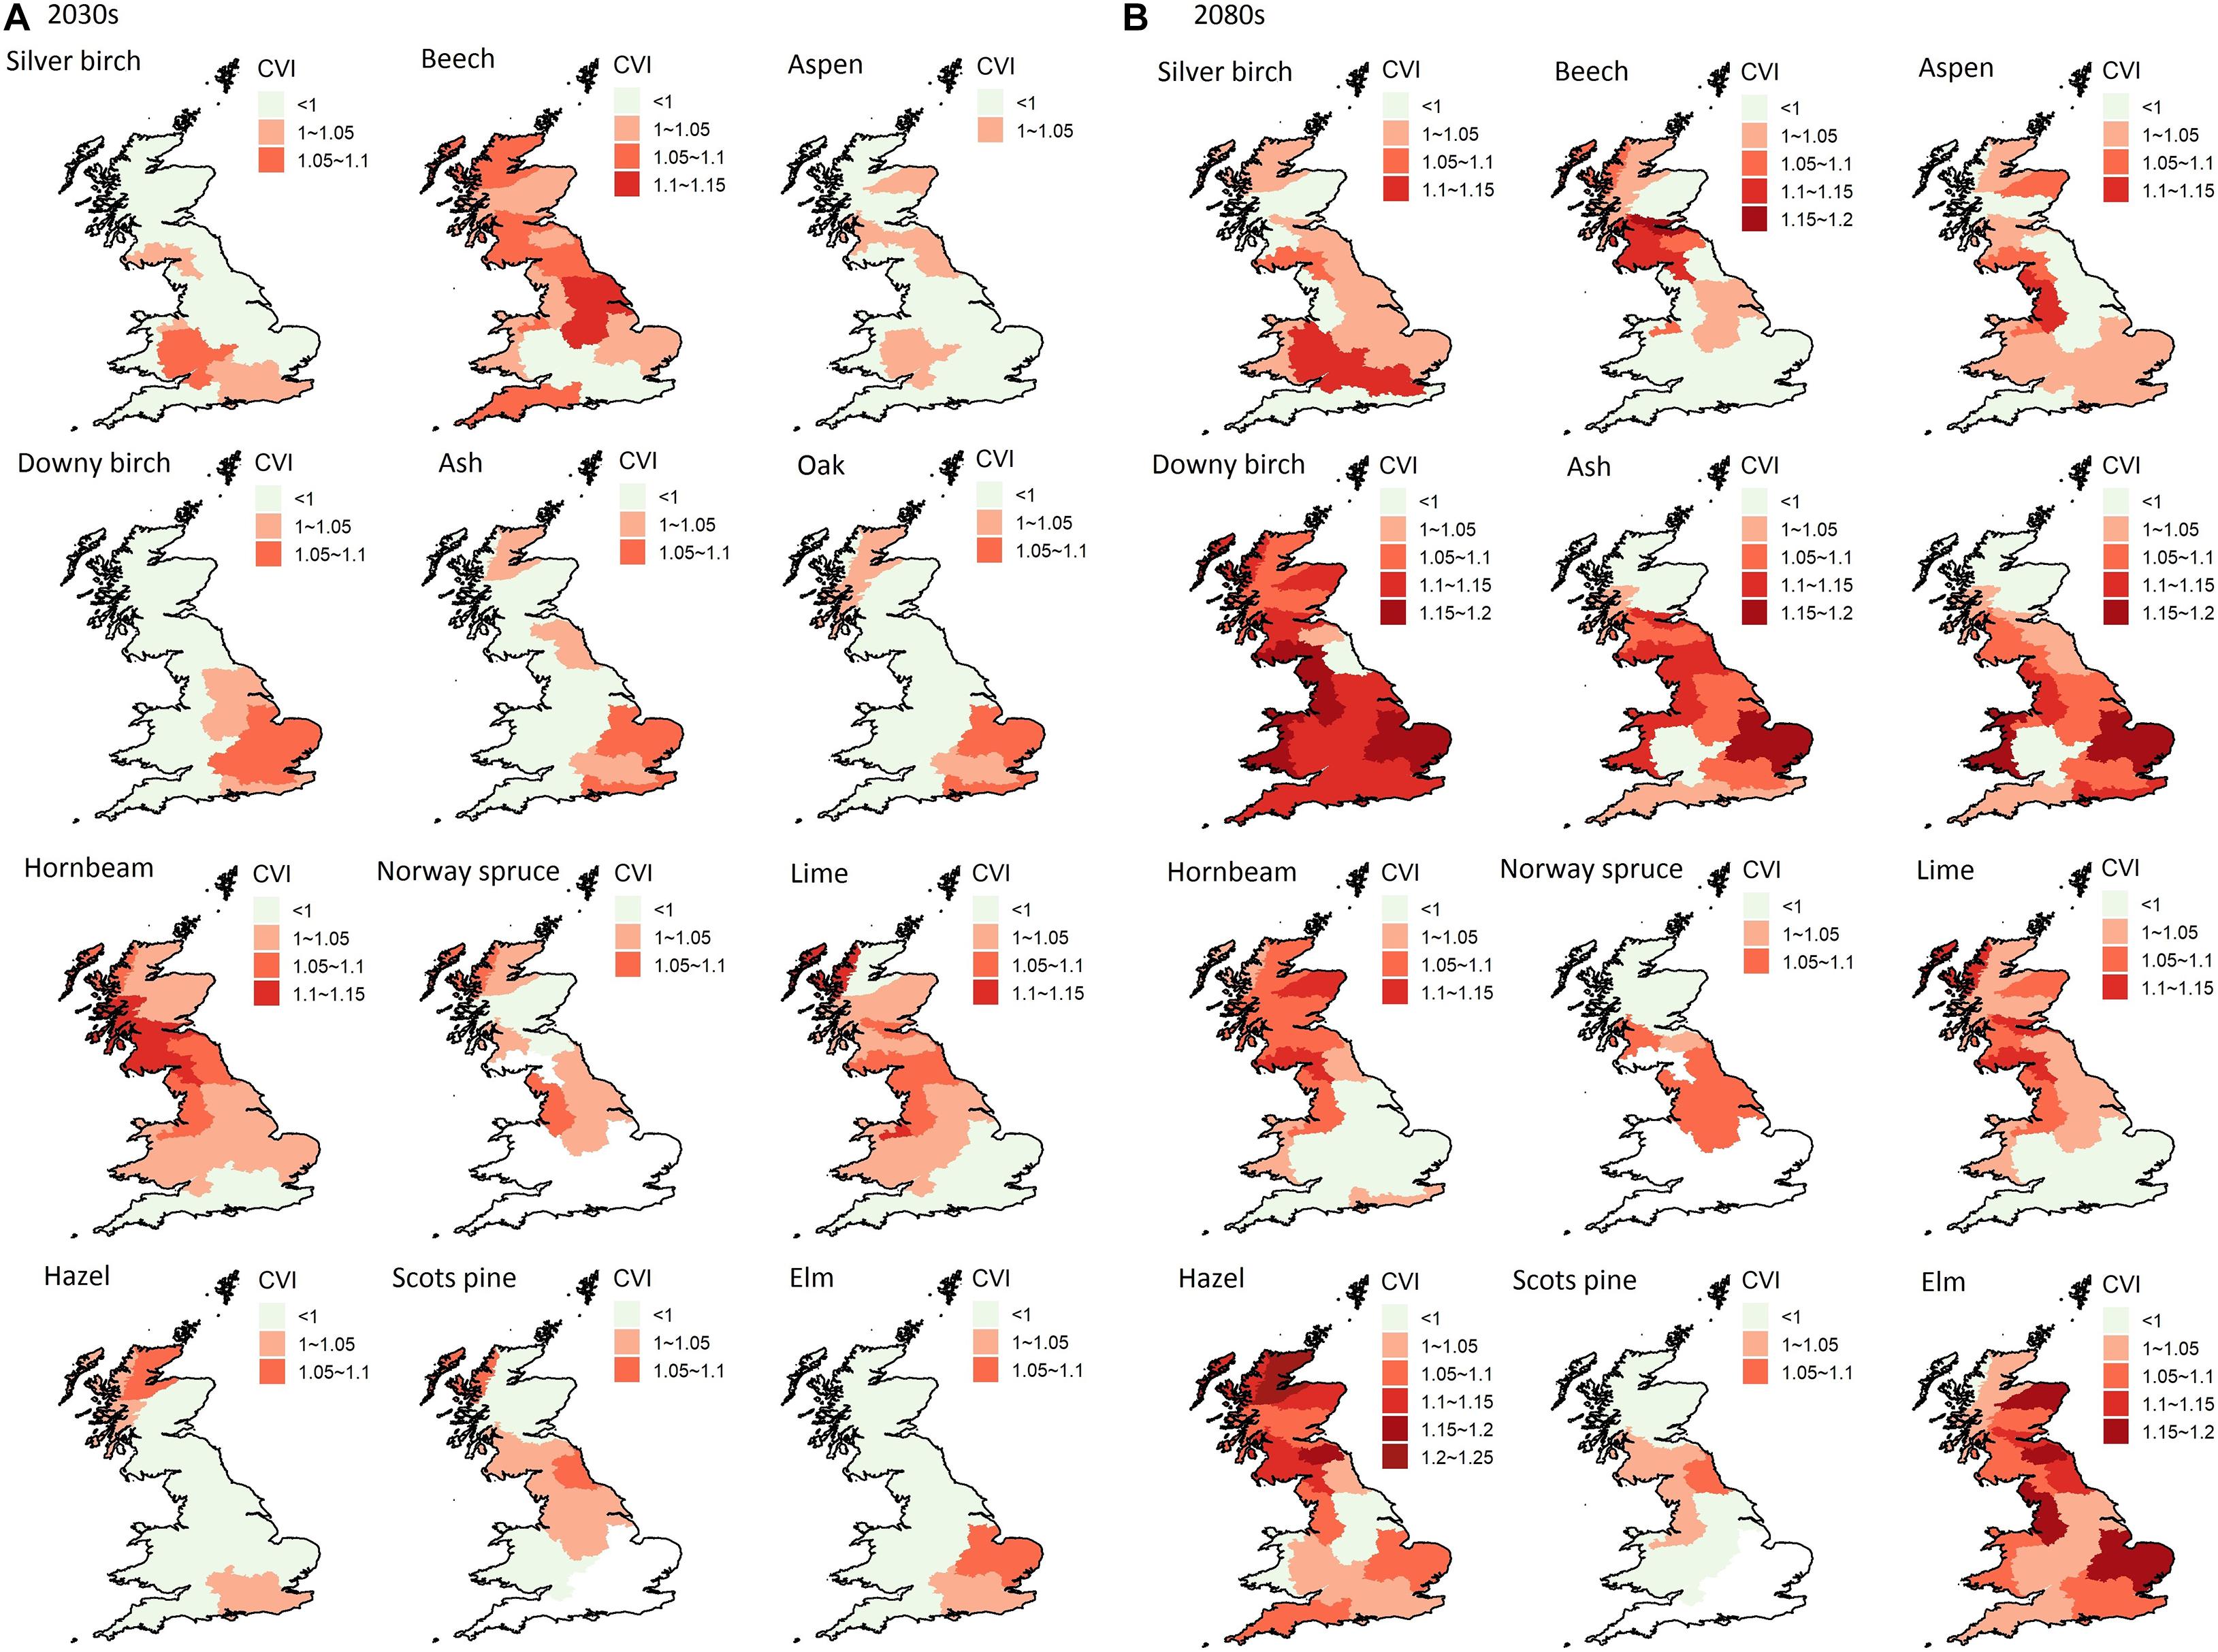
Figure 8. The climate vulnerability of 12 tree species in the 19 river basin regions in the 2030s (A) and the 2080s (B), with the threshold set at the median level.
Figure 8 shows the geographical patterns of climate vulnerability for the 12 modeled tree species in the 19 river basin regions. The degree of climate vulnerability of all the tree species increased slightly in most regions in the 2080s compared to the 2030s. This suggests that the temperature increase and precipitation reduction are likely to lead to more potential drought stress for tree growth. However, the LAI and NPP were still projected to increase in the longer term, which is likely to be due to the ecological recovery capability of tree species, together with increased ecosystem productivity in the non-drought period due to warmer climate and rising CO2. Downy birch, ash, oak, and elm were projected to be more vulnerable in southeast England (i.e., Anglian, Thames, and SE England) in the 2030s, with vulnerable regions spreading across Britain in the 2080s. The climate vulnerable regions for silver birch and hazel were the Thames and Severn basins, and northern Scotland, respectively. Those for hornbeam, aspen, and lime were more in the northern England and southern Scotland. Beech showed stress across almost the whole Britain in the 2030s, the most vulnerable regions being the Forth, Clyde, Tweed, and Solway basins in the 2080s. In addition, the increment of the threshold to consider more severe climate-induced mortality generally resulted in a reduced CVI in the 2030s and in northern Britain. In the 2080s, southeast Britain (i.e., Anglian, Thames, SE England, Severn, Humber, etc.) was the stress region for most of the deciduous tree species. Several actions are possible to reduce these impacts making forests more resilient to these stresses, including planting more drought-tolerant provenances and species and planting a greater variety of species (Broadmeadow et al., 2005).
The projected climate-vulnerable regions for Norway spruce and Scots pine were in W Highland and Clyde, but the degree of vulnerability for Scots pine was lower under the higher threshold. This is consistent with the pattern of drought impact in terms of stand yield projected in these regions by Petr et al. (2014). In addition, they projected their decline in south and southeast Britain, which should also be considered. Overall, taking both the degree of vulnerability and the number of affected tree species into consideration, the river basin regions of Anglian, Thames, and SE England were most vulnerable to climate change and drought impacts. The vulnerability could affect the whole England and Wales (in the 2080s) if the severe climate-induced mortality is considered.
The application of a tree-species based dynamic ecosystem model driven by a novel large, fine spatial resolution hydro-meteorological time series for the United Kingdom enabled the assessment of the potential ecological responses of forests and trees in Britain to both climate change (including drought) and potential physiological CO2 effects. While the dynamic global vegetation model, JULES, has been applied at a finer resolution to Britain, it is based on only five plant functional types and does not include specific tree parameterization, although outputs include changes in NPP in broad-leaved woodland, both with and without CO2 (Ritchie et al., 2019).
In our work, the projected spatial pattern of ecological responses showed an increase of LAI across Britain both with and without CO2, with larger increments when CO2 effects were included. There were also regional differences, with greater increases in Scotland, northwest England, and west Wales. Stronger increases in more temperature-limited areas are expected, and positive effects of temperature increases have also been observed in central European and northern ecosystems (Lucht et al., 2002; Pretzsch et al., 2014; Zhu et al., 2016) and other modeling studies (e.g., Mankin et al., 2017; Ritchie et al., 2019). The reduction in NPP in southern Britain under the no CO2 increase scenario, especially in the 2080s, supports the proposed role of CO2 in alleviating drought stress (Swann et al., 2016; Ault, 2020). Also, less carbon could be sequestered in southern and central England and easternmost parts of Wales in 2080s with the no CO2 increase scenario, as NPP decreased in these regions relative to the baseline.
Precipitation reduction was a secondary factor influencing the NPP. The NPP increase in southeast Britain was insignificant when including CO2 effects, most likely through a balance of negative impacts of more drought stress and positive impacts of elevated CO2 on photosynthesis and water use efficiency. Thus, this paper, using a process-based model, endorsed the vulnerability of woodlands in southern Britain to climate change, especially without further increases in CO2. Also, it demonstrated the potential increases in productivity, especially in the 2080s, in the higher parts of England and throughout Scotland both with and without changes in CO2, as a consequence of the improving climate.
Secondly, it could be expected that the climate scenarios were the major uncertainty sources in climate impact studies leading to different spatial patterns of ecosystem responses (Morales et al., 2007). However, the natural weather-induced variability was shown to influence the projected changes of LAI and NPP (at a level of 5–100% of the projected mean change), but not their geographical patterns. According to the model, southeast England is most sensitive to climate variability; in particular, the nondominant species (e.g., silver birch, hornbeam, hazel, and aspen) were strongly affected and potentially this could lead to changes in woodland composition. Therefore, the effectiveness of adaptation measures adopted in southeast England might be inappropriate in other regions in Britain. Finally, this region was also the most susceptible to climate change and drought, which is consistent with previous studies (Broadmeadow et al., 2005; Petr et al., 2014) and western Britain was projected to be more resilient to drought and climate change.
Some current key woodland-forming species, such as oak, elm, beech, and ash, showed little change or a slight decrease in LAI in the SE and SW England, Anglia, and Thames basins, and three (ash, oak and elm) were projected to be particularly more vulnerable in the 2080s in the SE England, Anglia, and Thames basins. In these areas, current and future species planting plans will need to be reevaluated to ensure they are robust, not just to mean climate change, but also, as shown by this paper, to natural weather variability and drought. In contrast to these canopy-forming species, some characteristic understorey or earlier successional tree species, such as hazel, aspen, and silver birch, could be less vulnerable to climate change.
However, in the West and North Highland and NE Scotland basins, ash, oak, and elm showed not only an increase in LAI but also a decreased vulnerability. Currently, however, they form a small percentage of the composition of native broad-leaved woodland, with birch (silver and downy) being the most important species depending on region (Price and Macdonald, 2012). While silver birch had increased LAI in the future, this was not true for downy birch and although both showed lower vulnerability in the 2030s, downy birch is vulnerable almost throughout Britain in the 2080s. These two contrasting examples demonstrate the potential for significant future changes in the species composition of broad-leaved woodland in Britain.
The main limitations of this study were that the tree species had been parameterized for Europe and their values for Britain might be more constrained. Also, we only modeled a selection of the tree species that were widely distributed in Britain without considering the human derived land use patterns (i.e., agricultural and urban areas) and we excluded waterlogged vegetation classes that are topographically affected. Hence, the projected ecological responses (i.e., LAI and NPP) were interpreted as the potential change determined by climate and soil conditions alone. Human management could modify the outcomes, thus introducing a new source of uncertainty, as could changes in atmospheric composition. Decreases in the deposition of nitrogen and sulfur may also affect NPP, although a study of their impact on temperate forests in Europe and United States (1995–2011) suggested that their effects may cancel each other out (Fernández-Martínez et al., 2017) and that CO2 is the dominant influence on net ecosystem productivity and gross primary productivity increases.
Related to this, the model only projected the presence of coniferous species (i.e., Norway spruce and Scots pine) in northern Britain (i.e., W Highland, N Highland, North East Scot, Argyll, Tay, etc.), as it was considering the potential vegetation, whereas in reality conifers are widely planted for forestry purposes across Britain. Norway spruce is not considered a natural species and has only been cultivated in low densities, partly as Sitka spruce performs much better in Britain (Savill, 2002; Caudullo et al., 2016). Thus, the parameterization of the model could be refined for further applications to the study area and other modeling tools (e.g., species distribution models and ecological site classification model) would be needed to assess their response to climate change. However, such models do not incorporate the dynamic ecological processes and thus are not so appropriate for informing climate adaptation for woodland conservation.
Heat- and drought-stressed-related tree mortality has become increasingly important in Europe, in particular since the dry summer of 2018 (Schuldt et al., 2020). Therefore, it is important that the model appears to capture mortality events related to main drought events in the past, but it is difficult to evaluate these results quantitatively. Furthermore, trees often die because of secondary stressors such as insect pests, which were not explicitly included here (but see Jönsson et al., 2012 for a version of LPJ-GUESS with bark beetles for Sweden). Nevertheless, evaluating simulated drought impacts should be a research priority for the future (Steinkamp and Hickler, 2015).
Given the various commitments to tree planting to address the United Kingdom’s legally binding target of net zero emissions by 2050, many have argued that the planting needs to be the right tree in the right place (e.g., Natural Capital Committee, 2020; Seddon et al., 2020), including ensuring that they are resilient to climate change. Thus, understanding the future impacts of climate change, natural variability, and CO2 on forests and the growth of different species is important. This study has shown that climate change could particularly affect the carbon storage potential of forests and the appropriate choice of tree in southern Britain, with many current woodland-forming species potentially being unsuitable in the future. However, in the north a wider range of tree species could be suitable, thus increasing options. In both regions, there could be significant changes in woodland composition.
This study has provided an indication of which species may be appropriate when tree planting for climate mitigation and adaptation. However, one should keep in mind that the vegetation model does not cover all aspects of the ecology of the tree species (Hickler et al., 2012). For example, specific responses to water logging and soil pH are not covered. These shortcomings and the uncertainties related to the climatic inputs and potential CO2 effects, therefore, call for risk spreading as an important component of any climate adaptation strategy, i.e., promoting species-rich mixed stands or mosaic with stands dominated by different species.
Therefore, this study was the first to apply a fine-scale process-based ecosystem model to the issue of the potential impacts of climate change, natural weather-induced variability, including drought, and direct CO2 effects on trees in Great Britain. The modeling showed that the net change in LAI and NPP could increase with CO2 and more so in the 2080s than the 2030s. However, there were smaller changes projected for southern Britain, where NPP could decrease without the effects of increasing CO2. Also, its potential for future carbon sequestration is less. The greater apparent vulnerability of southern England was reflected in the potential responses of many of the tree species, for example, downy birch, ash, oak, and elm. Southeast England was the most sensitive to climate change, natural weather-induced climate variability, and drought, so in this region particular consideration needs to be given to adaptation measures for existing forests and to future plantings. In contrast, there were greater increases in LAI and NPP in parts of northern England, west Wales, and Scotland, with trees such as ash, oak, and elm becoming less vulnerable. As these are not currently an abundant component of forests, this would require different adaptation strategies. Therefore, this study has shown how climate change could differentially affect the future of forests in Great Britain in terms of their vulnerability, composition and need for adaptive management.
Publicly available datasets were analyzed in this study. The climate data used as model input are freely available from https://catalogue.ceda.ac.uk/uuid/0cea8d7aca57427fae92241348ae9b03. LPJ-GUESS is available from http://web.nateko.lu.se/lpj-guess/.
TH supplied the LPJ-GUESS model. BG supplied the Marius climate data set and commented on scenario outputs. JY downscaled the climate scenarios and ran the LPJ-GUESS model. PB directed the research, helped in the ecological interpretation of the results. All authors have contributed to writing the manuscript, but JY led the draft of the manuscript, and PB its revision.
This work was undertaken within the MaRIUS project: Managing the Risks, Impacts and Uncertainties of droughts and water Scarcity, funded by the Natural Environment Research Council (NERC), and undertaken by a project team spanning the University of Oxford (NE/L010364/1), University of Bristol (NE/L010399/1), Cranfield University (NE/L010186/1), the Met Office, and the Centre for Ecology and Hydrology (NE/L010208/1).
The authors declare that the research was conducted in the absence of any commercial or financial relationships that could be construed as a potential conflict of interest.
We would like to thank Dr. Mike Morecroft, Natural England, for his insightful comments and two reviewers whose comments helped improve the manuscript.
Allen, C. D., Macalady, A. K., Chenchouni, H., Bachelet, D., McDowell, N., Vennetier, M., et al. (2010). A global overview of drought and heat-induced tree mortality reveals emerging climate change risks for forests. For. Ecol. Man. 259, 660–684. doi: 10.1016/j.foreco.2009.09.001
Anderegg, W. R., Kane, J. M., and Anderegg, L. D. (2013). Consequences of widespread tree mortality triggered by drought and temperature stress. Nat. Clim. Chang. 3, 30–36. doi: 10.1038/nclimate1635
Ault, T. R. (2020). On the essentials of drought in a changing climate. Science 368, 256–260. doi: 10.1126/science.aaz5492
Baumbach, L., Niamir, A., Hickler, T., and Yousefpour, R. (2019). Regional adaptation of European beech (Fagus sylvatica) to drought in central European conditions considering environmental suitability and economic implications. Reg. Environ. Change 1–16. doi: 10.1007/s10113-019-01472-0
Bell, V. A., Kay, A. L., Jones, R. G., and Moore, R. J. (2007). Development of a high resolution grid-based river flow model for use with regional climate model output. Hydrol. Earth Sys. Soc. 11, 532–549. doi: 10.5194/hess-11-532-2007
Bigler, C., Bräker, O. U., Bugmann, H., Dobbertin, M., and Rigling, A. (2006). Drought as an inciting mortality factor in Scots pine stands of the Valais. Switzerland. Ecosyst. 9, 330–343. doi: 10.1007/s10021-005-0126-2
Bigler, C., Gavin, D. G., Gunning, C., and Veblen, T. T. (2007). Drought induces lagged tree mortality in a subalpine forest in the Rocky Mountains. Oikos 116, 1983–1994. doi: 10.1111/j.2007.0030-1299.16034.x
Broadmeadow, M. S. J., Ray, D., and Samuel, C. J. A. (2005). Climate change and the future for broadleaved tree species in Britain. Forestry 78, 145–161. doi: 10.1093/forestry/cpi014
Carnicer, J., Coll, M., Ninyerola, M., Pons, X., Sánchez, G., and Peñuelas, J. (2011). Widespread crown condition decline, food web disruption, and amplified tree mortality with increased climate change-type drought. Proc. Natl. Acad. Sic.U.S.A. 108, 1474–1478. doi: 10.1073/pnas.1010070108
Caudullo, G., Tinner, W., and de Rigo, D. (2016). “Picea abies in Europe: distribution, habitat, usage and threats,” in European Atlas of Forest Tree Species, eds J. San-Miguel-Ayanz, D. de Rigo, G. Caudullo, T. Houston Durrant, and A. Mauri (Luxembourg: Publ. Off. EU), e012300.
Cavin, L., Mountford, E. P., Peterken, G. F., and Jump, A. S. (2013). Extreme drought alters competitive dominance within and between tree species in a mixed forest stand. Funct. Ecol. 27, 1424–1435. doi: 10.1111/1365-2435.12126
Chang, J., Ciais. J., Wang, X., Piao, S., Asrar, G., Betts, R., et al. (2017). Benchmarking carbon fluxes of the ISIMIP2a biome models
Choat, B., Brodribb, T. J., Brodersen, C. R., Duursma, R. A., López, R., and Medlyn, B. (2018). Triggers of tree mortality under drought. Nature 558, 531–539. doi: 10.1038/s41586-018-0240-x
Ciais, P., Reichstein, M., Viovy, N., Granier, A., Ogée, J., and Allard, V. (2005). Europe-wide reduction in primary productivity caused by the heat and drought in 2003. Nature 437, 529–533. doi: 10.1038/nature03972
Dai, A. (2013). Increasing drought under global warming in observations and models. Nat. Clim. Chang. 3, 52–58. doi: 10.1038/nclimate1633
Eilmann, B., and Rigling, A. (2012). Tree-growth analyses to estimate tree species’ drought tolerance. Tree Physiol. 32, 178–187. doi: 10.1093/treephys/tps004
Fenn, K., Malhi, Y., Morecroft, M., Lloyd, C., and Thomas, M. (2010). Comprehensive description of the carbon cycle of an ancient temperate broadleaved woodland. Biogeosc. Dis. 7, 3735–3763. doi: 10.5194/bgd-7-3735-2010
Fernández-Martínez, M., Sardans, J., Chevallier, F., Ciais, P., Obersteiner, M., Vicca, S., et al. (2019). Global trends in carbon sinks and their relationships with CO2 and temperature. Nat. Clim. Chang. 9, 73–79. doi: 10.1038/s41558-018-0367-7
Fernández-Martínez, M., Vicca, S., Janssens, I. A., Espelta, J. M., and Peñuelas, J. (2017). The role of nutrients, productivity and climate in determining tree fruit production in European forests. New. Phytol. 213, 669–679. doi: 10.1111/nph.14193
Fordham, D. A., Akçakaya, H. R., Araújo, M. B., Keith, D. A., and Brook, B. W. (2013). Tools for integrating range change, extinction risk and climate change information into conservation management. Ecography 36, 956–964. doi: 10.1111/j.1600-0587.2013.00147.x
Gerten, D., Schaphoff, S., Haberlandt, U., Lucht, W., and Sitch, S. (2004). Terrestrial vegetation and water balance–hydrological evaluation of a dynamic global vegetation model. J. Hydrol. 286, 249–270. doi: 10.1016/j.jhydrol.2003.09.029
Green, S., Hendry, S. J., and Redfern, D. B. (2008). Drought damage to pole-stage sitka spruce and other conifers in north-east Scotland. Scot. For. 62, 10–18.
Guillod, B. P., Jones, R. G., Bowery, A., Haustein, K., Massey, N. R., Mitchell, D. M., et al. (2017). weather@home 2: validation of an improved global–regional climate modelling system. Geosc. Model. Devel. 10, 1849–1872. doi: 10.5194/gmd-10-1849-2017
Guillod, B. P., Jones, R. G., Dadson, S. J., Coxon, G., Bussi, G., Freer, J., et al. (2018). A large set of potential past, present and future hydro-meteorological time series for the UK, Hydrol. Earth Syst. Sci. 22, 611–634, doi: 10.5194/hess-22-611-2018
Haverd, V., Smith, B., Canadell, J. G., Cuntz, M., Mikaloff-Fletcher, S., Farquhar, G., et al. (2020). Higher than expected CO2 fertilization inferred from leaf to global observations. Glob. Chang. Biol. 26, 2390–2402. doi: 10.1111/gcb.14950
Hickler, T., Rammig, A., and Werner, C. (2015). Modelling CO2 impacts on forest productivity. Curr. Rep. 1, 69–80. doi: 10.1007/s40725-015-0014-8
Hickler, T., Smith, B., Sykes, M. T., Davis, M. B., Sugita, S., and Walker, K. (2004). Using a generalized vegetation model to simulate vegetation dynamics in the western great lakes region, USA, under alternative disturbance regimes. Ecology 85, 519–530. doi: 10.1890/02-0344
Hickler, T., Vohland, K., Feehan, J., Miller, P. A., Smith, B., Costa, L., et al. (2012). Projecting the future distribution of European potential natural vegetation zones with a generalized, tree species-based dynamic vegetation model. Glob. Ecol. Biogeog. 21, 50–63. doi: 10.1111/j.1466-8238.2010.00613.x
Hogg, E. H., Brandt, J. P., and Michaelian, M. (2008). Impacts of a regional drought on the productivity, dieback, and biomass of western Canadian aspen forests. Can. J. For. Res. 38, 1373–1384. doi: 10.1139/x08-001
Jiang, M. K., Medlyn, B. E., Drake, J. E., Duursma, R. A., Anderson, I. C., Barton, C. V. M., et al. (2020). The fate of carbon in a mature forest under carbon dioxide enrichment. Nature 580, 227–231. doi: 10.1038/s41586-020-2128-9
Joönsson, A. M., Schroeder, L. M., Lagergren, F., Anderbrant, O., and Smith, B. (2012). Guess the impact of Ips typographus—an ecosystem modelling approach for simulating spruce bark beetle outbreaks. Ag. For. Met. 166-167, 188–200. doi: 10.1016/j.agrformet.2012.07.012
Keane, R. E., Austin, M., Field, C., Huth, A., Lexer, M. J., Peters, D., et al. (2001). Tree mortality in gap models: application to climate change. Clim. Chang. 51, 509–540.
Klein, T., Bader, M. K. F., Leuzinger, S., Mildner, M., Schleppi, P., Siegwolf, R. T., et al. (2016). Growth and carbon relations of mature picea abies trees under five years of free air CO2 enrichment. J. Ecol. 104, 1720–1733. doi: 10.1111/1365-2745.12621
Koca, D., Smith, B., and Sykes, M. T. (2006). Modelling regional climate change effects on potential natural ecosystems in Sweden. Clim. Chang. 78, 381–406. doi: 10.1007/s10584-005-9030-1
Körner, C., Morgan, J. A., and Norby, R. (2007). “CO2 fertilisation: when, where, how much?,” in Terrestrial Ecosystems in a Changing World, eds S. G. Canadell, D. E. Pataki, and L. F. Pitelka (Berlin: Springer).
Lawley, R. (2012). User Guide: Soil Parent Material 1km dataset. British Geological Survey Internal Report. OR/14/025.20pp.
Leuzinger, S., Zotz, G., Asshoff, R., and Körner, C. (2005). Responses of deciduous forest trees to severe drought in central Europe. Tree physiol. 25, 641–650. doi: 10.1093/treephys/25.6.641
Lorenz, E. N. (1965). A study of the predictability of a 28-variable atmospheric model. Tellus 17, 321–333. doi: 10.1111/j.2153-3490.1965.tb01424.x
Lowe, J. A., Bernie, D., Bett, P., Bricheno, L., Brown, S., Calvert, D., et al. (2018). UKCP18 Science Overview Report. Exeter: Met Office Hadley Centre.
Lucht, W., Prentice, I. C., Myneni, R. B., Sitch, S., Friedlingstein, P., Cramer, W., et al. (2002). Climatic control of the high-latitude vegetation greening trend and Pinatubo effect. Science 296, 1687–1689. doi: 10.1126/science.1071828
Mankin, J. S., Smerdon, J. E., Cook, B. I., Williams, A. P., and Seager, R. (2017). The curious case of projected twenty-first-century drying but greening in the American West. J. Clim. 30, 8689–8710. doi: 10.1175/JCLI-D-17-0213.1
McGuire, A. D., Sitch, S., Clein, J. S., Dargaville, R., Esser, G., Foley, J., et al. (2001). Carbon balance of the terrestrial biosphere in the twentieth century: analyses of CO2, climate and land use effects with four process-based ecosystem models. Glob. Biogeochem. Cycles 15, 183–206. doi: 10.1029/2000gb001298
Medlyn, B. E., Zaehle, S., De Kauwe, M. G., Walker, A. P., Dietze, M. C., Hanson, P. J., et al. (2015). Using ecosystem experiments to improve vegetation models. Nat. Clim. Chang. 5, 528–534. doi: 10.1038/nclimate2621
Morales, P., Hickler, T., Rowell, D. P., Smith, B., and Sykes, M. T. (2007). Changes in European ecosystem productivity and carbon balance driven by regional climate model output. Glob. Chang. Biol. 13, 108–122. doi: 10.1111/j.1365-2486.2006.01289.x
Morales, P., Sykes, M. T., Prentice, I. C., Smith, P., Smith, B., Bugmann, H., et al. (2005). Comparing and evaluating process-based ecosystem model predictions of carbon and water fluxes in major European forest biomes. Glob. Chang. Biol. 11, 2211–2233. doi: 10.1111/j.1365-2486.2005.01036.x
Mountford, E. P., Peterken, G. F., Edwards, P. J., and Manners, J. G. (1999). Long-term change in growth, mortality and regeneration of trees in denny wood, an old-growth wood-pasture in the New Forest (UK). Perspect. Plant Ecol. Evol. Systemat. 2, 223–272. doi: 10.1078/1433-8319-00072
Murphy, J. M., Sexton, D. M. H., Jenkins, G. J., Booth, B. B. B., Brown, C. C., Clark, R. T., et al. (2009). UK Climate Projections Science Report: Climate Change Projections. Exeter: Met Office Hadley Centre.
Natural Capital Committee (2020). Advice on Using Nature Based Interventions to Reach net Zero Greenhouse Gas Emissions by 2050. Available online at: https://assets.publishing.service.gov.uk/government/uploads/system/uploads/attachment_data/file/879797/ncc-nature-based-interventions.pdf
Pacifici, M., Foden, W. B., Visconti, P., Watson, J. E., Butchart, S. H., Kovacs, K. M., et al. (2015). Assessing species vulnerability to climate change. Nat. Clim. Chang. 5, 215–224.
Pasho, E., Camarero, J. J., de Luis, M., and Vicente-Serrano, S. M. (2011). Impacts of drought at different time scales on forest growth across a wide climatic gradient in north-eastern Spain. Ag. For. Met. 151, 1800–1811. doi: 10.1016/j.agrformet.2011.07.018
Peñuelas, J., Ciais, P., Canadell, J. G., Janssens, I. A., Fernández-Martínez, M., Carnicer, J., et al. (2017). Shifting from a fertilization-dominated to a warming dominated period. Nat. Ecol. Evol. 1, 1438–1445. doi: 10.1038/s41559-017-0274-8
Peterken, G. F., and Mountford, E. P. (1996). Effects of drought on beech in Lady Park Wood, an unmanaged mixed deciduous woodland. Int. J. For. Res. 69, 125–136. doi: 10.1093/forestry/69.2.125
Petr, M., Boerboom, L. G., van der Veen, A., and Ray, D. (2014). A spatial and temporal drought risk assessment of three major tree species in Britain using probabilistic climate change projections. Clim. Change 124, 791–803. doi: 10.1007/s10584-014-1122-3
Pretzsch, H., Biber, P., Schutze, G., Uhl, E., and Rotzer, T. (2014). Forest stand growth dynamics in Central Europe have accelerated since 1870. Nat. Comm. 5:10.
Price, A., and Macdonald, E. (2012). Growing Birch in Scotland for Higher Quality Timber. Forest Research. Available online at: https://forestry.gov.scot/images/corporate/pdf/growing-birch-for-high-quality-timber.pdf
Ritchie, P. D. L., Harper., A. B., Smith, G. S., Kahana, R., Kendon, E. J., Lewis, H., et al. (2019). Large changes in Great Britain’s vegetation and agricultural land-use predicted under unmitigated climate change. Environ. Res. Lett. 14:114012. doi: 10.1088/1748-9326/ab492b
Savill, P. S. (2002). The Silviculture of Trees Used in British Forestry. Eynsham: Information Press.
Schuldt, B., Buras, A., Arend, M., Vitasse, Y., Beierkuhnlein, C., Damm, A., et al. (2020). A first assessment of the impact of the extreme 2018 summer drought on Central European forests. Basic Appl. Ecol. 45, 86–103. doi: 10.1016/j.baae.2020.04.003
Schurgers, G., Arneth, A., and Hickler, T. (2011). Effect of climate-driven changes in species composition on regional emission capacities of biogenic compounds. J. Geophys. Res. 116:D22304. doi: 10.1029/2011JD016278
Seddon, N., Chausson, A., Berry, P. M., Girardin, C., Smith, A. C., and Turner, B. (2020). Understanding the value and limits of nature-based solutions to climate change and other global challenges. Philos. Trans. R. Soc. B 375:20190120. doi: 10.1098/rstb.2019.0120
Seddon, N., Turner, B., Berry, P., Chausson, A., and Girardin, C. A. J. (2019). Grounding nature-based climate solutions in sound biodiversity science. Nat. Clim. Chang. 9, 82–87. doi: 10.1038/s41558-019-0405-0
Seneviratne, S. I., Nicholls, N., Easterling, D., Goodess, C. M., Kanae, S., Kossin, J., et al. (2012). “Changes in climate extremes and their impacts on the natural physical environment,” in Managing the Risks of Extreme Events and Disasters to Advance Climate Change Adaptation, eds C. B. Field, V. Barros, T. F. Stocker, D. Qin, D. J. Dokken, K. L. Ebi, et al. (New York, NY: Cambridge University Press), 109–230.
Senf, C., Pflugmacher, D., Zhiqiang, Y., Siebald, J., Knorn, J. Neumann, M., et al. (2018). Canopy mortality has doubled in Europe’s temperate forests over the last three decades. Nat. Commun. 9:4978. doi: 10.1038/s41467-018-07539-6
Sitch, S., Smith, B., Prentice, I. C., Arneth, A., Bondeau, A., Cramer, W., et al. (2003). Evaluation of ecosystem dynamics, plant geography and terrestrial carbon cycling in the LPJ dynamic global vegetation model. Glob. Change Biol. 9, 161–185. doi: 10.1046/j.1365-2486.2003.00569.x
Smith, B., Prentice, I. C., and Sykes, M. T. (2001). Representation of vegetation dynamics in the modelling of terrestrial ecosystems: comparing two contrasting approaches within European climate space. Glob. Ecol. Biogeog. 10, 621–637. doi: 10.1046/j.1466-822x.2001.t01-1-00256.x
Smith, B., Warlind, D., Arneth, A., Hickler, T., Leadley, P., Siltberg, J., et al. (2014). Implications of incorporating N cycling and N limitations on primary production in an individual-based dynamic vegetation model. Biogeosc 11, 2027–2054. doi: 10.5194/bg-11-2027-2014
Steinkamp, J., and Hickler, T. (2015). Is drought-induced forest dieback globally increasing? J. Ecol. 103, 31–43. doi: 10.1111/1365-2745.12335
Swann, A. L., Hoffman, M., Koven, C. D., and Randerson, J. T. (2016). Plant responses to increasing CO2 reduce estimates of climate impacts on drought severity. Proc. Nat. Acad. Sci.U.S.A. 113, 10019–10024. doi: 10.1073/pnas.1604581113
Tang, G., Beckage, B., and Smith, B. (2012). The potential transient dynamics of forests in New England under historical and projected future climate change. Clim. change 114, 357–377. doi: 10.1007/s10584-012-0404-x
Terrer, C., Jackson, R. B., Prentice, I. C., Keenan, T. F., Kaiser, C., Vicca, S., et al. (2019). Nitrogen and phosphorus constrain the CO2 fertilization of global plant biomass. Nat. Clim. Change 9, 684–689. doi: 10.1038/s41558-019-0545-2
Thomas, M. V., Malhi, Y., Fenn, K. M., Fisher, J. B., Morecroft, M. D., Lloyd, C. R., et al. (2011). Carbon dioxide fluxes over an ancient broadleaved deciduous woodland in southern England. Biogeosc 8, 1595–1613. doi: 10.5194/bg-8-1595-2011
Van der Werf, W., Sass-Klaassen, U. G., and Mohren, G. M. J. (2007). The impact of the 2003 summer drought on the intra-annual growth pattern of beech (Fagus sylvatica L.) and oak (Quercus robur L.) on a dry site in the Netherlands. Dendrochronologia 25, 103–112. doi: 10.1016/j.dendro.2007.03.004
van Vuuren, D. P., Edmonds, J., Kainuma, M., Riahi, K., Thomson, A., Hibbard, K., et al. (2011). The representative concentration pathways: an overview. Clim. Change. 109, 5–31. doi: 10.1007/s10584-011-0148-z
Walker, A. P., De Kauwe, M. G., Bastos, A., Belmecheri, S., Georgiou, K., Keeling, R. F., et al. (2020). Integrating the evidence for a terrestrial carbon sink caused by increasing atmospheric CO2. New Phytol. 229, 2413–2445. doi: 10.1111/nph.16866
Watson, J. E., Iwamura, T., and Butt, N. (2013). Mapping vulnerability and conservation adaptation strategies under climate change. Nat. Clim. Change 3, 989–994. doi: 10.1038/nclimate2007
Keywords: LPJ-GUESS, drought, vulnerability, leaf area index, net primary productivity, CO2
Citation: Yu J, Berry P, Guillod BP and Hickler T (2021) Climate Change Impacts on the Future of Forests in Great Britain. Front. Environ. Sci. 9:640530. doi: 10.3389/fenvs.2021.640530
Received: 11 December 2020; Accepted: 03 March 2021;
Published: 30 April 2021.
Edited by:
Jamie Hannaford, UK Centre for Ecology and Hydrology (UKCEH), United KingdomReviewed by:
Xander Wang, University of Prince Edward Island, CanadaCopyright © 2021 Yu, Berry, Guillod and Hickler. This is an open-access article distributed under the terms of the Creative Commons Attribution License (CC BY). The use, distribution or reproduction in other forums is permitted, provided the original author(s) and the copyright owner(s) are credited and that the original publication in this journal is cited, in accordance with accepted academic practice. No use, distribution or reproduction is permitted which does not comply with these terms.
*Correspondence: Pam Berry, cGFtLmJlcnJ5QGVjaS5veC5hY3gudWs=
†Present address: Benoit P. Guillod, R&D, CelsiusPro AG, Zurich, Switzerland
Disclaimer: All claims expressed in this article are solely those of the authors and do not necessarily represent those of their affiliated organizations, or those of the publisher, the editors and the reviewers. Any product that may be evaluated in this article or claim that may be made by its manufacturer is not guaranteed or endorsed by the publisher.
Research integrity at Frontiers
Learn more about the work of our research integrity team to safeguard the quality of each article we publish.