- 1Foreign Language Department, Hunan University of Finance and Economics, Changsha, China
- 2Center for Economics, Finance and Management Studies, Hunan University, Changsha, China
- 3College of Finance and Statistics, Hunan University, Changsha, China
This paper investigates whether the macroeconomic uncertainty factors can explain and forecast China’s INE crude oil futures market volatility. We use the GARCH-MIDAS model to investigate the explaining and predicting power of the macroeconomic uncertainties. We considered various geopolitical risk (GPR) indices, economic policy uncertainty (EPU) indices, and infectious disease pandemic (IDEMV) indices in our model. The empirical results suggest that the geopolitical risk, the geopolitical act risk, the global economic policy uncertainty, the economic policy uncertainty from the United Kingdom, and the economic policy uncertainty from Japan comprehensively integrate the information contained in the rest factors, and have superior predictive powers for INE crude oil future volatility. These findings highlight the importance of the impact of macroeconomic uncertainty factors has on the crude oil futures market, and indicate that the macroeconomic uncertainties need to be considered when explaining and forecasting crude oil futures market volatility.
Introduction
China is the world’s largest importer and the second largest consumer of crude oil and established its own crude oil futures market in the Shanghai International Energy Exchange Center (INE) on March 26, 2018. Over the past two years since its listing, the INE crude oil futures market has experienced various extreme events at home and abroad, and now playing a positive role in promoting the formation of crude oil benchmark prices in Asia. The establishment of the INE crude oil futures market has the following significance. Firstly, like the petrodollar system, the internationalization of a country’s sovereign currency must begin with the function of pricing and settlement of commodity trade. Since the INE crude oil futures price was denominated in RMB, the internationalization of the INE crude oil futures market has put the process of RMB internationalization at a new historical starting point. Secondly, it is necessary to use the crude oil futures market for risk management in China. In the current international environment of deglobalization and anti-free trade, the probability of extreme events will increase, which will lead to huge fluctuations in crude oil prices, and the crude oil futures markets can hedge this kind of risk. Thirdly, although Asia is the world’s largest market for crude oil demand, it does not have its crude oil pricing system, and thus causes the well-known “Asian Premium.” The development of the INE crude oil market can shed lights on the formation of benchmark prices in the Asia-Pacific region.
Along with the establishment of the crude oil futures market in 2018, global macro uncertainty events have generally shown an upward trend (Sheng et al., 2020), especially for the economic policy uncertainty (EPU) and the geopolitical risk (GPR). These two macroeconomic uncertainty factors have long been regarded by investors as the key factors affecting investment decisions in the crude oil futures market (Aloui et al., 2016; Antonakakis et al., 2017; Balcilar et al., 2017; Dees et al., 2017; Escribano and Valdes, 2017; Wei et al., 2017; Cunado et al., 2019; Plakandaras et al., 2019; Brandt and Gao, 2019; Geng et al., 2020; Hu et al., 2020). The rising geopolitical risk and economic policy uncertainty greatly increase panic among investors (Tsai, 2017; Ji et al., 2018; Ji et al., 2020; Li and Zhong, 2020), and the rapid transfer of international capital among countries leads to severe fluctuations in the crude oil futures market. Furthermore, since crude oil has long been regarded as a political weapon for many governments (Escribano and Valdes, 2017), it has a geopolitical nature that distinguishes itself from other commodities and financial assets (Hu et al., 2020). Numerous studies have shown that geopolitical risk leads to oil market uncertainty and price fluctuations (Miao et al., 2017; Caldara and Iacoviello, 2018; Gkillas et al., 2018; Brandt and Gao, 2019). During our sample period, the Middle East, as one of China’s largest oil importers, witnessed several geopolitical events such as the Syrian tensions on April 01, 2018, the United States-Iran tensions on July 01, 2018 and the United States—Iran tensions on June 01, 2019. On the one hand, these geopolitical events might affect China’s crude oil importers and cause crude oil supply uncertainty and price volatility. On the other hand, the geopolitical risk would affect economic activity to a certain extent and thus cause oil demand uncertainty (Liu j. et al., 2019). Since geopolitical risk could result in expectation differences about the INE crude oil futures prices, it is reasonable to consider the role of geopolitical risk in explaining and forecasting the INE crude oil futures market volatility. Furthermore, the recent Coronavirus (COVID-19) outbreak pandemic has further magnified the complexity of the global economic and political environment (Bai et al., 2020), at the same time, the surge in Chinese buying also highlighted China’s importance as a global crude oil price-setter. Thus, accurately understanding and forecasting the INE crude oil future volatility is crucial to effectively reduce the impact of macroeconomic uncertainties on excessive volatility in the INE crude oil market and promote the steady and healthy development of the global economy, which is important to market participants as well as the government policymakers.
Based on the discussion above, we will focus on the following questions from the perspective of quantitative analysis. Do these uncertainties matter in explaining crude oil price volatility? If so, how can we use them to accurately forecast the oil price volatility? Answering these questions can help investors and decision makers better understand China INE crude oil futures market and provide some inspiration for different market participants.
We address the above issues as follows. First, we analyze the impact of economic policy uncertainty, geopolitical, and public infectious disease pandemic on the crude oil volatility by constructing the GARCH-MIDAS model that incorporates several macroeconomic uncertainty factors, respectively. Concerning the economic policy uncertainty, we use two GEPU indices and six country-specific EPU indices. These countries are three major crude oil consumers, United States, China and Japan, and three major crude oil exporters, United Kingdom, Canada and Russia. Concerning the geopolitical risk, we use the GPR index and its variation, the GPT index, and the GPA index. In addition, Liu J. et al. (2019) found that the effect of common geopolitical risk on crude oil price volatility is limited because it does not constantly attract investors’ attention. However, the serious geopolitical risk may cause oil supply disruptions and result in serious oil price fluctuation. Thus, we also construct a serious geopolitical risk (GPRS) index by filtering the GPR index for values larger than the average. Concerning the public infectious disease pandemic, we use the IDEMV index. We also consider the serious public infectious disease pandemic factor and construct the IDEMVS index as mentioned in Section GARCH-MIDAS Models with Macroeconomic Uncertainty. Second, in the out-of-sample analysis, we forecast the crude oil futures volatility based on these extended GARCH-MIDAS models and then evaluate the model’s predictive ability by employing the approved model confidence set (MCS) (Hansen et al., 2005). The MCS allows us to examine these macroeconomy uncertainties’ predicting ability of crude oil future volatility and makes a comparison with each other.
We make the following contributions. First, although Asia is the world’s largest market for crude oil demand, it has not established its own crude oil pricing system yet (Shi and Sun, 2017). This causes the well-known “Asian Premium” (Zhang et al., 2018). Therefore, the quantitative analyses on the macroeconomic uncertainty contributions on the INE crude oil futures volatility process can help provide important reference information for establishing the pricing system for Asia crude oil market. Second, as an important way to help different market participants understand the China crude oil futures market, the influence of macroeconomic uncertainties have on INE crude oil futures market has not been studied by scholars. By using the currently available information of the INE crude oil futures market, we conduct a first ever analysis on the uncertainty determinants of INE crude oil futures volatility. The results, yet to be improved with more data though, hope to shed light on the effects of macroeconomic uncertainties have on China’s new crude oil futures for investors, regulators, and academia. Third, to the best of our knowledge, we are the first to consider various GPR indices, and we analyze the different impacts of GPT and GPA have on the China crude oil futures volatility. In addition, we also consider various EPU indices, such as the two version GEPU indices (
The empirical results of this paper present solid evidence of the influence and predictability of macroeconomic uncertainty factors on crude oil volatility. The in-sample estimation results show that the economic policy uncertainty, the geopolitical risk, and the public infectious disease pandemic factors have a different impact on the crude oil volatility. First, the EPU from China has a significantly negative impact on the long-term volatility, whereas the EPUs from United States, United Kingdom, Japan, Canada, and Russia have a significantly positive effect on the long-term volatility. In addition, the EPU from the United Kingdom. has the largest average effect on the long-term volatility of oil futures prices among all of the EPU indices, whereas EPUs in the United States and Russia are less informative in determining oil futures volatility. Second, with regard to the geopolitical factors, the GPRS and the GPT indices have a significant negative impact on the long-run component of INE crude oil futures volatility, whereas the GPA’s impact is significantly positive. Third, the public infectious disease pandemic factors IDEMV and IDMMVS indices also have a positive effect on long-term volatility. The out of sample evaluation results suggest that the GARCH-MIDAS models with macroeconomy uncertainty factors can provide a more accurate prediction. Specifically, the models with the GPR index, the GPA index, the global EPU index, the EPU index from the United Kingdom, and the EPU index from Japan pass the MCS test under MSFE and MASE criterion with both statistics. This implies that these macro-level uncertainty factors contain useful information that the government decision makers and investors need to pay attention to, and have superior ability to predict the crude oil futures volatility.
The rest of this paper is structured as follows. Section Literature Review presents a brief literature review.Section Econometric Methodology describes the GARCH-MIDAS model and its extensions, as well as the forecast evaluation. Section Data discusses the data. Section Empirical Results analyzes the empirical results. Section Robustness Check reports a series of robustness tests. Section Conclusion concludes this study.
Literature Review
In this section, we will review the literature on the subject and laid the foundation for analyzing the determinants of INE crude oil volatility. From the perspective of economic relations between commodity supply and demand and the oil prices, previous literature have shown that demand, supply, and speculation are the driving forces of oil price volatility (Narayan and Narayan, 2007; Mu and Ye, 2011; Kilian and Murphy, 2014; Pan et al., 2017; Yi et al., 2018; Liao et al., 2019). However, as a commodity that is traded globally, the crude oil market faces a much more complicated economic environment and might be driven by other macroeconomic factors beyond its supply and demand. After the economic policy uncertainty (EPU) index was constructed by Baker et al. (2016), many studies have turned their attention to the EPU’s explanatory power and forecasting power on the crude oil market when modeling oil market volatilities. Existing literature provides some arguments explaining the possible relation between EPU and oil price volatility, and states that the uncertainty of economic policy affects the economic conditions, and then causes oil price volatility as well (Aloui et al., 2016; Hailemariam et al., 2019). Balcilar et al. (2017) show that EPU has significant predictive power for oil price volatility, Wei et al. (2017) also confirm the EPU’s predictive power on crude oil volatility and argue that EPU may be a comprehensive reflection of various economic information such as global oil demand and supply shocks, financial crisis, and political events.
Since crude oil has long been regarded as a political weapon for many governments (Escribano and Valdes, 2017), it has a geopolitical nature that distinguishes itself from other commodities and financial assets. After the geopolitical risk (GPR) index and its variation, geopolitical threat risk index (GPT) and geopolitical act index (GPA) was proposed by Caldara and Iacoviello (2018), various studies have found that the changes in GPR index generally have a significant impact on oil returns (Antonakakis et al., 2017; Demirer et al., 2018b; Cunado et al., 2019; Plakandaras et al., 2019). Existing literature found that GPR indices also have a significant impact on other aspects of crude oil price movement. Brandt and Gao (2019) found that geopolitical events can strongly affect the oil prices in a short period, Liu J. et al. (2020) found that the serious geopolitical risk can improve the model fitting and forecasting performance concerning crude oil volatility.
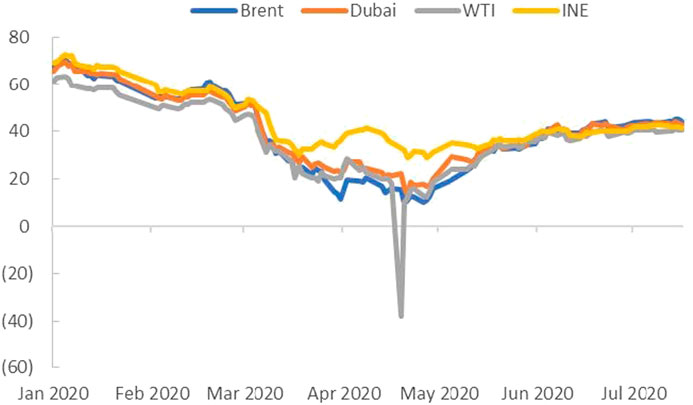
In addition to the uncertainty caused by the above macroeconomic policy environment and geopolitical risk, public health events can also cause uncertainty to the macroeconomy. Notably, the COVID-19 outbreak in December 2019 has brought shock to global financial markets. Intuitively, the crude oil market may also react to the shock of such a public health event (Demirer et al., 2018a). The COVID-19 pandemic did cause server distortions and fluctuations in the crude oil markets. In April 2020, the benchmark price for crude oil of the May futures in the United States even fell to negative $37.63. In this context, Baker et al. (2020) constructed the Infectious Disease Equity Market Volatility Tracker index (IDEMV) index to quantitatively measure the magnitude of an infectious disease pandemic, which is available from January 1985 to the present. This helps investors and academia better understand the impact of the epidemic panic on economic fundamentals. Based on the IDEMV index, recent literature confirms that the eruption of COVID-19 causes greater price fluctuations in commodities and financial assets such as stock, gold, and cryptocurrency, than in days before that (Corbet et al., 2020; Haroon and Rizvi, 2020; Ji et al., 2020; Zhang et al., 2020). Therefore, this paper also considers the uncertainty brought from the public health events, and to observe how the INE crude oil futures market reacts to this uncertainty.
Previous efforts have been made to predict the volatility of oil prices by employing GARCH-class models (Sadorsky, 2006; Nomikos and Pouliasis, 2011; Wang and Wu, 2012; Chan and Grant, 2016) and realized GARCH-class models (Haugom et al., 2014; Sévi, 2014). However, the imputing data of both GARCH-class models and realized GARCH-class models are strictly restricted at the same frequency. They are all failed to explaining the macroeconomic determinants at different sampling frequencies, which is crucial for investors and government policymakers to understand the market (Engle and Rangel, 2008). Ghysels et al. (2004) proposed mixed data sampling (MIDAS) regression models, and Colacito et al. (2011) and Engle et al. (2013) applied the MIDAS technique into the GARCH model and constructed the GARCH-MIDAS model, and the GRACH-MIDAS model successfully addresses the problem of mismatching data frequency. After that, many macroeconomic factors have been applied to investigate underlying economic factors of asset volatility (Conrad et al., 2014; Liu J. et al., 2020; Sheng et al., 2020), and verified the superiority of predictive ability of GARCH-MIDAS model (Ghysels et al., 2019). Therefore, we construct the benchmark GARCH-MIDAS model with realized volatility (RV) and 15 individual GARCH-MIDAS models with various macroeconomy uncertainty determinants.
To compare the forecast performance of different models, we use the MCS test proposed by Hansen et al. (2005) to identify the most informativeness factor among our macro uncertainties. The current research has not yet considered the relation between macro uncertainty factors and INE crude oil market, to the best of our knowledge, we are the first to consider the effect of various macro uncertainty factors on the INE crude oil market. With the rising international status of China and the expanding scale of its crude oil market, it is necessary to understand and forecast the movement of INE crude oil futures price.
Econometric Methodology
The GARCH-MIDAS Model
Since the MIDAS technique allows using macroeconomic fundamental data at lower frequencies, the GARCH-MIDAS model is widely used to predict daily crude oil futures volatility. Therefore, this paper uses the benchmark GARCH-MIDAS model (Liu J. et al., 2019) and extends it by incorporating macroeconomic uncertainty factors as our explanatory variable.
The GARCH-MIDAS model is composed of two parts: one is to model the short-term component of volatility, and the other is to model the long-term component of volatility. The short-term component is a GARCH (1,1) process, while the latter is determined by the history of the realized volatility or macroeconomic variables weighted by the MIDAS polynomials. The GARCH-MIDAS model is constructed as follows. Suppose the return of the crude oil future is written as
where
The long-term component
where m is the intercept, and
We define the benchmark model when lagged variable
Where RV is the realized volatility calculated by intraday high-frequency data using Eq.6, k is the lagged value of the RV, the lags of the RV are set to 224,466 in Section Out-of-Sample Evaluation and Section Robustness Check following Engle et al. 2013 and Liu J. et al. (2019). The weighting scheme (Ghysels et al., 2004; Engle et al., 2013) used in Eq. 4 and Eq. 5 are the unrestricted Beta function defined as below:
where the parameter
GARCH-MIDAS Models With Macroeconomic Uncertainty
To investigate the effect of macroeconomic uncertainty have on oil future market volatility, we add the macroeconomic uncertainty factors (MU) we mentioned above into Eq. 5. Therefore, we get the GARCH-MIDAS-MU model. The long-term component,
Where the MU we choose the geopolitical risk indices (Antonakakis et al., 2017; Plakandaras et al., 2019), economic policy uncertainty indices (Balcilar et al., 2017), and infectious disease pandemic indices as the determinants.
To further examine whether serious geopolitical risk and infectious disease pandemic is informative to improve the predictive accuracy for oil futures volatility, we define the GPRS and IDEMVS as follows:
Forecast Evaluation
To make a comparison of forecasting performance with the different GARCH-MIDAS-MU models, we use MCS test with two popular loss functions as our evaluation criteria. The loss functions are the mean squared forecast error function (MSFE) and the mean absolute forecast error function (MAFE), and are defined as follow:
where
Data
The sample data used in this paper are as follows: the intraday INE crude oil high-frequency data, the daily INE crude oil futures prices, and the monthly macroeconomic uncertainty factors of oil futures price volatility. Following Sévi (2014), we use the 5-minute data as our sample data to calculate the RV, and get the intraday 5-min high-frequency data from the Shanghai International Energy Exchange. The monthly dataset consists of three GPR indices, two GEPU indices, six country-specific EPU indices and the IDEMV and IDEMVS indices. The monthly GPR1 indices were proposed by Caldara and Iacoviello (2018), and are the key indicators that demonstrate risk from geopolitical events such as wars and terrorism. To isolate the effects of pure geopolitical risk, we also consider the two related indexes: the geopolitical threats index (GPT) and the geopolitical acts (GPA) index. The GPT index depicts the geopolitical threat, while the GPA index depicts the geopolitical adverse events. With regard to the economic policy uncertainty factors, we use the EPU2 indices constructed by Baker et al. (2016). The GEPU indices have two versions with different calculations: one is calculated by current-price GDP measures (denoted as
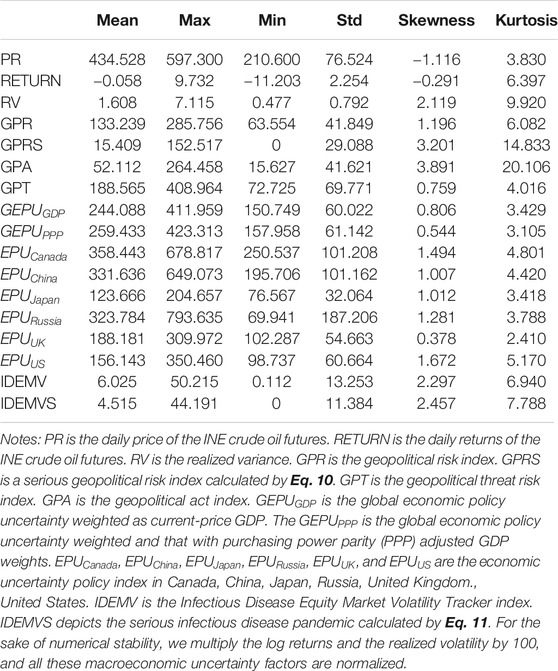
Table 1 shows the descriptive statistics of the variables. First, compared with the standard deviation, the sample mean of the INE crude oil futures return is relatively small, suggesting that we can use a constant when we modeling the volatility of crude oil futures prices (Sadorsky, 2006; Narayan and Narayan, 2007). The RV of the crude oil futures price is skewed to the right and exhibit high kurtosis. Second, among the GPR indices, the standard deviation of GPT and the GPA is either larger and smaller than the GPR index, indicating that the GPT changes more frequently and violently and GPA is relatively stable. Third, the mean of IDEMV and IDEMVS is relatively small compared with their standard deviation, indicating that they are both volatile.
Figures 1–3 show the time series of INE crude oil futures and the GPR, EPU, and IDEMV factors. Due to the impact of the epidemic and the international political and economic situation, the overnight trading of INE futures in China was suspended on February 3, 2020, and resumed on May 6, 2020, the shade is the period that the oil futures are suspended from overnight trading.
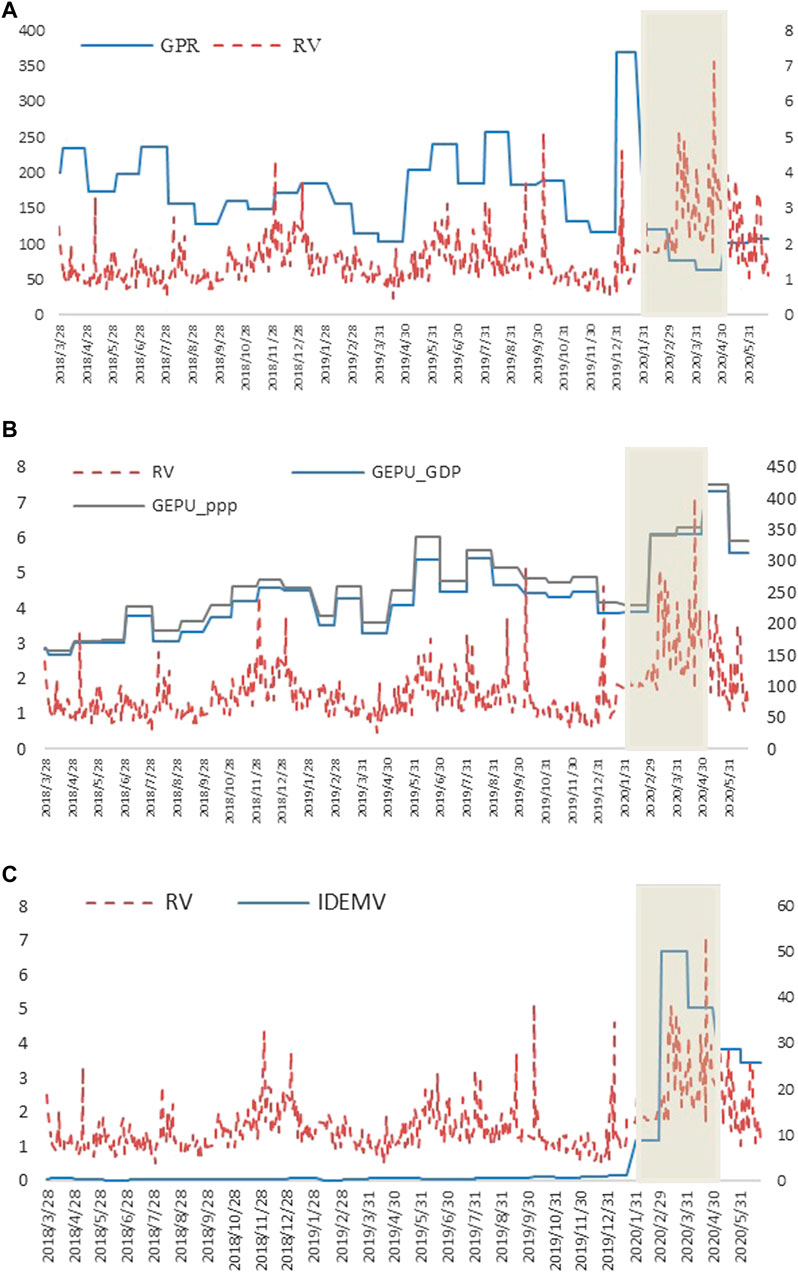
FIGURE 2. The trends of INE crude oil futures volatility, the GPR index, the GEPU index and the IDEMV index. Panel (A) The trends of INE crude oil futures volatility and the GPR index. Panel (B) The trends of INE crude oil futures volatility and the GEPU index. Panel (C) The trends of INE crude oil futures volatility and the IDEMV index.
Figure 2 shows the general relationship among the crude oil futures volatility, the GPR index, the GEPU index, and the IDEMV index. As can be seen from panel (A), before the COVID-19 broke out, changes in GPR index and RV tend to be consistent, presenting potential co-movements there. However, during the COVID-19 broke out periods, the GPR index is relatively stable, and the investors are shocked by the wild swings of the crude oil futures market. With regard to the GEPU indices, there are obvious co-movements between the crude oil future RV and the two GEPU indices. With regard to the IDEMV index, the crude oil future volatility is co-movement with the IDEMV index only during the COVID-19 broke out periods. This indicates that when GEPU and IDEMV would increase the volatility of the crude oil futures market, the GPR index might decrease the volatility of the crude oil futures market.
Empirical Results
In-Sample Estimation Results
Before estimating the impact of macro uncertainty indicators on crude oil futures volatility, the variations of the benchmark GARCH-MIDAS model with long-run RVs were estimated as a comparative reference for the extended models and then we further apply the macro uncertainty indicators in our extended models.
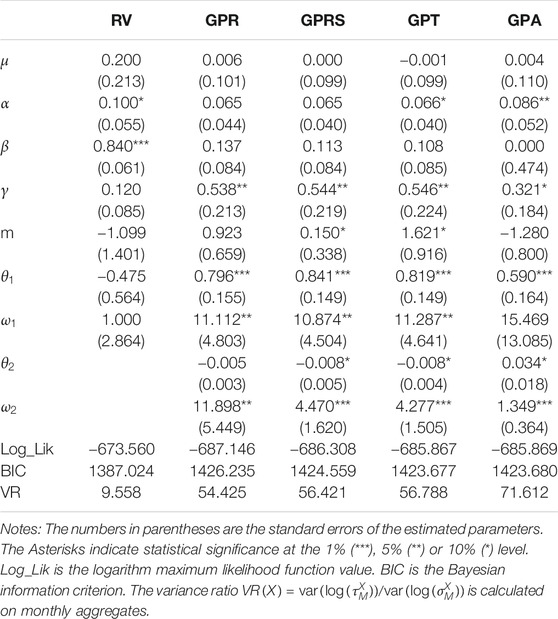
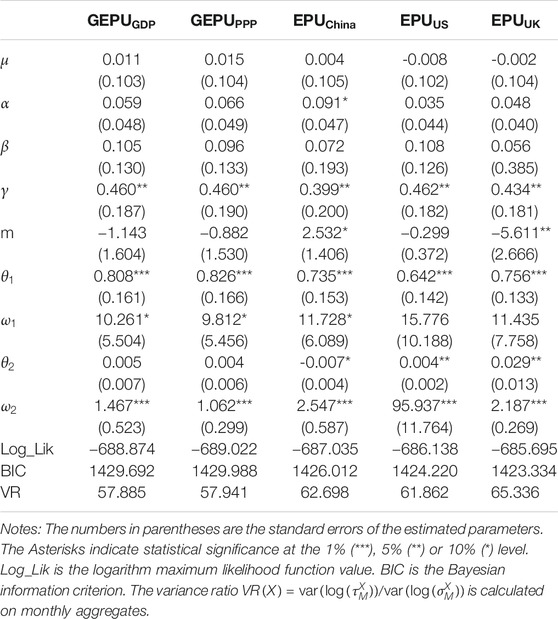
Tables 2–4 show the benchmark GARCH-MIDAS model and the extensions with geopolitical risk (Antonakakis et al., 2017; Plakandaras et al., 2019), economic policy uncertainty (Balcilar et al., 2017), and infectious disease pandemic factors (Baker et al., 2020) as the determinants. We use the maximum likelihood estimation method to obtain the parameters of the GARCH-MIDAS model. The lag length k = 22 for long run RVs, and k = 12 for monthly macro factors and are following Conrad et al. (2014) and Gkillas et al. (2018). Interestingly, concerning the parameter estimates among all these models, the GARCH-MIDAS models with monthly macroeconomic factors have lower estimates
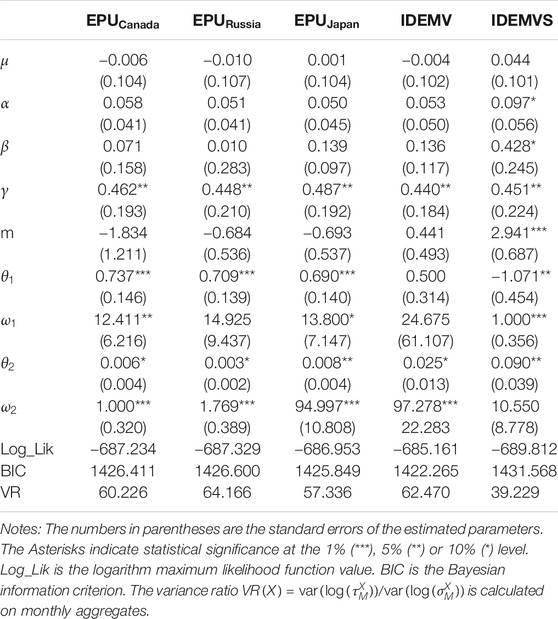
TABLE 4. Estimation GARCH-MIDAS models with economic policy uncertainty and infectious disease pandemic.
Consistent with previous literature (Conrad and Kleen, 2020), the
Since the main focus of our paper is to investigate whether the macroeconomic uncertainties have an impact on the long-term volatility of the crude oil futures, we pay more attention to the value of parameters
Table 2 reveals the empirical results of the geopolitical risk factors. First, the results show that geopolitical risk contributes to the crude oil futures volatility in different ways. In column (2)-column (3), both the GPR and the GPRS have a negative impact on the long-run component of INE crude oil futures volatility, which is consistent with Antonakakis et al. (2017) and Mei et al. (2020). This indicates that when a geopolitical risk shock occurs, the crude oil futures market participants synchronize their trading activity in the same direction by reducing the volatility. However, the impact of the GPR is not significant, whereas the impact of GPRS is significant. This can be explained by Liu J. et al. (2019), that although the government policymakers and the oil market participants concern about the geopolitical risk, they are used to common geopolitical risk and are only sensitive to the serious geopolitical risk. Second, we further investigate the categorical GPR index. In column (4)–(7), both the threat related index and the act related index have a significant impact on the crude oil futures volatility. The GPT is significantly negative whereas the GPA is significantly positive. This indicates that although the geopolitical threat makes market participants synchronize their trading behavior, the geopolitical act causes divergence in the expectations of oil futures market participants and increases the crude oil futures volatility.
Tables 3, 4 reveal the empirical results of the EPU indices and the infectious disease pandemic factors. As shown in Tables 3, 4, two GEPU indices do not have statistically significant impacts on long-term volatility, whereas the country-specific EPU indices do have impacts on the long-term volatility in different ways. The EPU in China has a significantly negative impact on the long-term volatility, whereas the EPUs in Unted States United Kingdom, Japan, Canada, and Russia have a significantly positive effect on the long-term volatility. Specifically, the EPUs from the United Kingdom. with a
Figure 3 plots the fitting value of total daily volatility and long-term volatility of the 12 GARCH-MIDAS models. Since the trend of GPRS and IDEMV is similar to that of GPR and IDMEVS, so this paper will not show the figures for them. The orange dashed line represents the total daily volatility and the blue line represents the long-term volatility calculated by the GARCH-MIDAS model with different macroeconomic uncertainty factors. It is clear that the daily total volatility in all 12 subfigures of Figure 3 are similar, but the long-term volatilities with different monthly macroeconomic uncertainty factors are quite different. Figure 3 suggests that GPR indices, EPU indices, and infectious disease pandemic have different influences on long-term oil volatility. In the next section, we mainly discuss which macroeconomic uncertainty factors are most informative in forecasting the daily volatility of crude oil futures prices.
Out-of-Sample Evaluation
In this section, we employed the out-of-sample rolling method to evaluate the predictability of the above models. Considering the sample sized of our data and to ensure that our conclusions are reliable, we set out window size as 430 days3, and we get 115 out of sample predicted values. This paper compared the models’ out-of-sample predictability by using the MCS test.
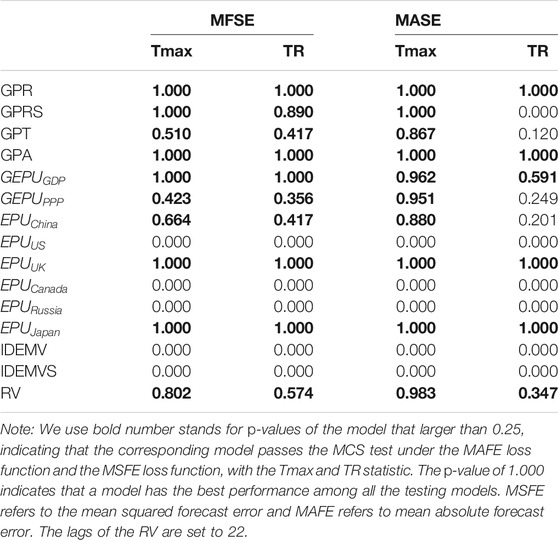
The p-values of loss functions in the MCS test are the indicator of the models’ forecasting performance. If the p-values greater than a specific threshold, which is also called MCS alpha, the corresponding model is supposed to have better predictability than the others (Hansen et al., 2005). However, there is no consensus on the specific value of the threshold p-value in MCS tests, and different literatures set the different MCS alpha values (Tian and Hamori, 2015; Pu et al., 2016). Table 5 reports the p-values of the MCS tests for GARCH-MIDAS-MU models. To clearly distinguish the most informative macroeconomic uncertainty factor contributing the long-term volatility, we follow the most related studies of Liu J. et al. (2019), which investigate the oil market volatility and set the threshold p-value to be 0.25 in Tables 5–7.
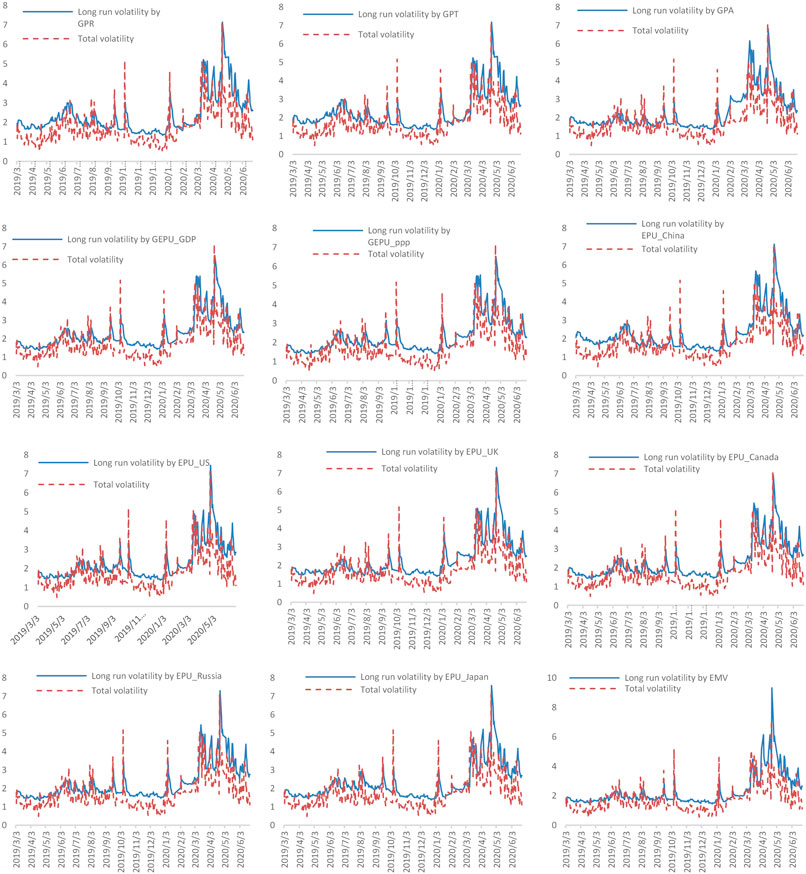
FIGURE 3. The fitting value of total volatility and long-term volatility by different GARCH-MIDAS models.
First, Table 5 shows the results of out-of-sample forecasting performance with the monthly RVs. Under the MSFE criterion, the model with GPR, GPRS, GPT, GPA,
Interestingly, whereas the GARCH-MIDAS-GPRS model fails to predict more accurately in our sample, the GARCH-MIDAS-GPRS model’s predictability is proved to be superior in forecasting oil prices (Liu J. et al., 2019). After including the GPR and GPA indices, the forecast accuracy of GARCH-MIDAS model is significantly improved. This indicates that government policymakers and INE crude oil futures market participants pay attention to geopolitical risk and the geopolitical adverse events, which cause increased oil price volatility. However, our results show that the GPRS index is not informative in predicting the volatility.
The results in Table 5 also show that EPU indices, in general, are more informative than the rest of the macroeconomic uncertainties when predicting the volatility of crude oil futures. Furthermore, among all kinds of EPU in our sample, the
Robustness Check
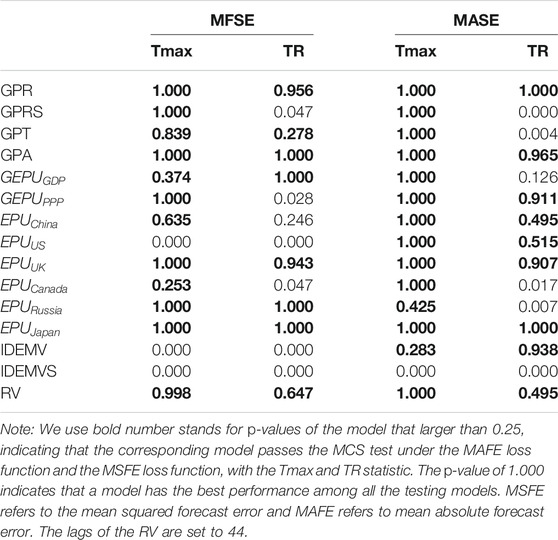
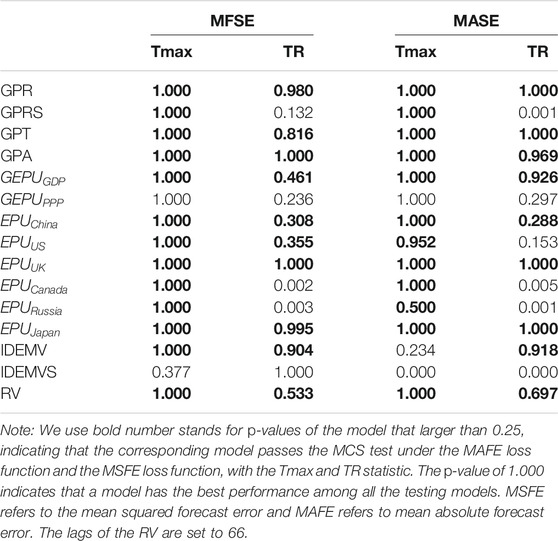
Since different lags of RV (
Conclusion
As a political commodity, crude oil is closely bound up with the national strategy, global politics, and national economic strength and China’s rise is playing an increasingly important role in the global crude oil market. Therefore, it is important for policymakers and investors to accurately understand and predict China crude oil futures volatility. Recent literature have found that many macroeconomic uncertainty indicators have great effects on crude oil volatility. Among the various uncertainty factors, the geopolitical risk and the economic policy uncertainty have traditionally been considered the most powerful. In addition, the Coronavirus (COVID-19) outbreak in December 2019 has brought great pains to the global economy and financial markets. Thus, we analyze the impact of uncertainty factors have on the futures volatility such as traditional uncertainty factors GPR and EPU, and also consider the IDEMV, that the uncertainty comes from the public health event. We use the GARCH-MIDAS model with these macroeconomic uncertainties respectively, and we identified which macroeconomic uncertainty factor is more informative when predicting the crude oil futures volatility.
With regard to the model fitting results, first, we find that geopolitical risk significantly influences the crude oil futures market prices. Especially, the GPR and the GPRS have a significant negative impact on the long-run component of INE crude oil futures volatility, and the GPT is significantly negative whereas the GPA is significantly positive. Second, the EPU in China has a significantly negative impact on the long-term volatility, whereas the EPUs in United States, United Kingdom, Japan, Canada, and Russia have a significantly positive effect on the long-term volatility. Specifically, the EPU from the United Kingdom. makes the largest contribution to the long-term volatility of oil futures prices among all of the EPU indices, whereas EPUs in the U.S. and Russia are less informative in determining oil volatility. Third, the infectious disease pandemic factor also has a positive effect on long-term volatility.
With regard to the model forecasting results, the model with GPR, GPA,
Data Availability Statement
The datasets generated for this study are available on request to the corresponding author.
Author Contributions
AY made substantial contributions to the conception of the work. YL acquired the data. MY analyzed and interpreted the data for the work, and drafted and revised the work it critically for important intellectual content.
Funding
This research was funded by the National Natural Science Foundation of China (NSFC) and Economic and Social Research Council of UK (ESRC) (71661137006), National Social Science Foundation of China (SSFC) (19ZDA159).
Conflict of Interest:
The authors declare that the research was conducted in the absence of any commercial or financial relationships that could be construed as a potential conflict of interest.
Acknowledgments
The authors sincerely thank the editor and the reviewers of this paper.
Footnotes
1The GPR index can be downloaded from http://www.policyuncertainty.com/gpr.html.
2The EPU index can be found at http://www.policyuncertainty.com/global_monthly.html.
3The data covered from 27th March 2018 to 31st December 2019.
4In 2008, the National Development and Reform Commission issued “Administrative Measures for Oil Prices (For Trial Implementation),” the program rules that China domestic crude oil prices are base on the price in Brent, Dubai and Minas, coupled with the domestic cost of import tariffs, refining, distribution of costs and profits.
References
Ahmadi, M., Bashiri Behmiri, N., and Manera, M. (2020). The theory of storage in the crude oil futures market, the role of financial conditions. J. Fut. Mark. 40 (7), 1160–1175. doi:10.1002/fut.22113
Aloui, R., Gupta, R., and Miller, S. M. (2016). Uncertainty and crude oil returns. Energy Econ. 55, 92–100. doi:10.1016/j.eneco.2016.01.012
Antonakakis, N., Chatziantoniou, I., and Filis, G. (2014). Dynamic spillovers of oil price shocks and economic policy uncertainty. Energy Econ. 44, 433–447. doi:10.1016/j.eneco.2014.05.007
Antonakakis, N., Gupta, R., and Kollias, C. S. (2017). Geopolitical risks and the oil-stock nexus over 1899–2016. Finance Res. Lett. 23, 165–173. doi:10.1016/j.frl.2017.07.017
Bai, L., Wei, Y., Wei, G., Li, X., and Zhang, S. (2020). Infectious disease pandemic and permanent volatility of international stock markets: a long-term perspective. Finance Res Lett. 2020, 101709. doi:10.1016/j.frl.2020.101709
Baker, S. R., Bloom, N., and Davis, S. J. (2016). Measuring economic policy uncertainty. Q. J. Econ. 131 (4), 1593–1636. doi:10.1093/qje/qjw024
Baker, S. R., Bloom, N., Davis, S. J., et al. (2020). The unprecedented stock market reaction to COVID-19. Rev. Asset. Pricing. Stud. 10, 742, doi:10.1093/rapstu/raaa008
Balcilar, M., Bekiros, S., and Gupta, R. (2017). The role of news-based uncertainty indices in predicting oil markets: a hybrid nonparametric quantile causality method. Empir. Econ. 53 (3), 879–889. doi:10.1007/s00181-016-1150-0
Brandt, M. W., and Gao, L. (2019). Macro fundamentals or geopolitical events? a textual analysis of news events for crude oil. Empir. Financ. 51, 64–94. doi:10.1016/j.jempfin.2019.01.007
Caldara, D., and Iacoviello, M (2018). Measuring geopolitical risk. Int. Finance Discuss. Pap. 1222, 1. doi:10.17016/IFDP.2018.1222
Chan, J. C. C., and Grant, A. L. (2016). Modeling energy price dynamics: GARCH versus stochastic volatility. Energy. Econ. 54, 182–189. doi:10.1016/j.eneco.2015.12.003
Chen, L., Du, Z., and Hu, Z. (2020). Impact of economic policy uncertainty on exchange rate volatility of China. Finance Res. Lett. 32, 101266. doi:10.1016/j.frl.2019.08.014
Colacito, R., Engle, R. F., and Ghysels, E. (2011). A component model for dynamic correlations. J. Econometrics. 164 (1), 45–59. doi:10.1016/j.jeconom.2011.02.013
Conrad, C., and Kleen, O. (2020). Two are better than one: volatility forecasting using multiplicative component GARCH‐MIDAS models. J. Appl. Econ. 35 (1), 19–45. doi:10.1002/jae.2742
Conrad, C., Loch, K., and Rittler, D. (2014). On the macroeconomic determinants of long-term volatilities and correlations in U.S. stock and crude oil markets. J. Empir. Finance. 29, 26–40. doi:10.1016/j.jempfin.2014.03.009
Corbet, S., Larkin, C., and Lucey, B. (2020). The contagion effects of the COVID-19 pandemic: evidence from gold and cryptocurrencies. Finance Res. Lett. 35, 101554. doi:10.1016/j.frl.2020.101554
Cunado, J., Gupta, R., Lau, C. K. M., and Sheng, X. (2019). Time-varying impact of geopolitical risks on oil prices. Defence. Peace. Econ. 31, 692–706. doi:10.1080/10242694.2018.1563854
Dees, S., Karadeloglou, P., Kaufmann, R. K., and Sánchez, M. (2007). Modelling the world oil market: assessment of a quarterly econometric model. Energ. Policy. 35 (1), 178–191. doi:10.1016/j.enpol.2005.10.017
Demirer, R, Gupta, R., Suleman, T., and Wohar, M. E. (2018a). Time-varying rare disaster risks, oil returns and volatility. Energy Econ. 75, 239–248. doi:10.1016/j.eneco.2018.08.021
Demirer, R., Gupta, R., Ji, Q., and Tiwari, A. K. (2018b). Geopolitical risks and the predictability of regional oil returns and volatility. OPEC Energ. Rev 43 (3), 342–361. doi:10.1111/opec.12160
Engle, R. F., Ghysels, E., and Sohn, B. (2013). Stock market volatility and macroeconomic fundamentals. Rev. Econ. Stat. 95 (3), 776–797. doi:10.1162/REST_a_00300
Engle, R. F., and Rangel, J. G. (2008). The spline-GARCH model for low-frequency volatility and its global macroeconomic causes. Rev. Financ. Stud. 21 (3), 1187–1222. doi:10.1093/rfs/hhn004
Escribano, G., and Valdés, J. (2017). Oil prices: governance failures and geopolitical consequences. Geopolitics 22 (3), 693–718. doi:10.1080/14650045.2016.1254621
Geng, J. B., Chen, F. R., Ji, Q., and Liu, B. Y. (2020). Network connectedness between natural gas markets, uncertainty and stock markets. Energ. Econ. 2020, 105001. doi:10.1016/j.eneco.2020.105001
Ghysels, E., Santa-Clara, P., and Valkanov, R. (2004). The MIDAS touch: mixed data sampling regression models. Available at: https://EconPapers.repec.org/RePEc:cir:cirwor:2004s-20. (Accessed May 01, 2004)
Ghysels, E., Plazzi, A., Valkanov, R., Rubia, A., and Dossani, A. (2019). Direct versus iterated multiperiod volatility forecasts. Annu. Rev. Financ. Econ. 11, 173–195. doi:10.1146/annurev-financial-110217-022808
Gkillas, K., Gupta, R., and Wohar, M. E. (2018). Volatility jumps: the role of geopolitical risks. Financ. Res. Lett. 27, 247–258. doi:10.1016/j.frl.2018.03.014
Glosten, L. R., Jagannathan, R., and Runkle, D. E. (1993). On the relation between the expected value and the volatility of the nominal excess return on stocks. J. Finance. 48 (5), 1779–1801. doi:10.1111/j.1540-6261.1993.tb05128.x
Hailemariam, A., Smyth, R., and Zhang, X. (2019). Oil prices and economic policy uncertainty: evidence from a nonparametric panel data model. Energy. Econ. 83, 40–51. doi:10.1016/j.eneco.2019.06.010
Han, L., Qi, M., and Yin, L. (2016). Macroeconomic policy uncertainty shocks on the Chinese economy: a GVAR analysis. Appl. Econ. 48 (51), 4907–4921. doi:10.1080/00036846.2016.1167828
Hansen, P. R. (2005). A test for superior predictive ability. J. Bus. Econ. Stat. 23 (4), 365–380. doi:10.1198/073500105000000063
Haroon, O., and Rizvi, S. A. R. (2020). COVID-19: media coverage and financial markets behavior-a sectoral inquiry. J. Behav. Exp. Finance. 27, 100343. doi:10.1016/j.jbef.2020.100343
Haugom, E., Langeland, H., Molnár, P., et al. (2014). Forecasting volatility of the U.S. oil market. J. Bank. Financ. 47, 1–14. doi:10.1016/j.jbankfin.2014.05.026
Hu, M., Zhang, D., Ji, Q., and Wei, L. (2020). Macro factors and the realized volatility of commodities: a dynamic network analysis. Resour. Pol. 68, 101813. doi:10.1016/j.resourpol.2020.101813
Ji, Q., Liu, B.-Y., Nehler, H., and Uddin, G. S. (2018). Uncertainties and extreme risk spillover in the energy markets: a time-varying copula-based CoVaR approach. Energ. Econ. 76, 115–126. doi:10.1016/j.eneco.2018.10.010
Ji, Q., Bahloul, W., Geng, J.-B., and Gupta, R. (2020). Trading behaviour connectedness across commodity markets: evidence from the hedgers’ sentiment perspective. Resear. Int. Bus. Financ. 52, 101114. doi:10.1016/j.ribaf.2019.101114
Ji, Q., Zhang, D., and Zhao, Y. (2020). Searching for safe-haven assets during the COVID-19 pandemic. Int. Rev. Financ. Anal. 71, 101526. doi:10.1016/j.irfa.2020.101526
Kilian, L., and Murphy, D. P. (2014). The role of inventories and speculative trading in the global market for crude oil. J. Appl. Econ. 29 (3), 454–478. doi:10.1002/jae.2322
Li, Z., and Zhong, J. (2020). Impact of economic policy uncertainty shocks on ’China’s financial conditions. Financ. Res. Lett. 35, 101303. doi:10.1016/j.frl.2019.101303
Liao, G., Li, Z., Du, Z., and Liu, Y. (2019). The heterogeneous interconnections between supply or demand side and oil risks. Energies 12 (11), 2226. doi:10.3390/en12112226
Liu, J., Ma, F., Tang, Y., and Zhang, Y. (2019). Geopolitical risk and oil volatility: a new insight. Energy. Econ. 84, 104548. doi:10.1016/j.eneco.2019.104548
Liu, L., Wang, Y., Wu, C., and Wu, W. (2016). Disentangling the determinants of real oil prices. Energy. Econ. 56, 363–373. doi:10.1016/j.eneco.2016.04.003
Liu, Z., Ding, Z., Zhai, P., Lv, T., Wu, J. S., and Zhang, K. (2019). Revisiting the integration of China into the world crude oil market: the role of structural breaks. Front. Energy Res. 7, 146. doi:10.3389/fenrg.2019.00146
Ma, R., Zhou, C., Cai, H., and Deng, C. (2019). The forecasting power of EPU for crude oil return volatility. Energ. Rep. 5, 866–873. doi:10.1016/j.egyr.2019.07.002
Mei, D., Ma, F., Liao, Y, and Wang, L. (2020). Geopolitical risk uncertainty and oil future volatility: evidence from MIDAS models. Energy. Econ. 86, 104624. doi:10.1016/j.eneco.2019.104624
Miao, H., Ramchander, S., Wang, T., and Yang, D. (2017). Influential factors in crude oil price forecasting. Energy Econ. 68, 77–88. doi:10.1016/j.eneco.2017.09.010
Mu, X., and Ye, H. (2011). Understanding the crude oil price: how important is the China factor? Energ. J. 32 (4), 69–91. doi:10.5547/ISSN0195-6574-EJ-Vol32-No4-5
Narayan, P. K., and Narayan, S. (2007). Modelling oil price volatility. Energ. Policy. 35 (12), 6549–6553. doi:10.1016/j.enpol.2007.07.020
Nomikos, N. K., and Pouliasis, P. K. (2011). Forecasting petroleum futures markets volatility: the role of regimes and market conditions. Energy Econ. 33 (2), 321–337. doi:10.1016/j.eneco.2010.11.013
Pan, Z., Wang, Y., Wu, C., and Yin, L. (2017). Oil price volatility and macroeconomic fundamentals: a regime switching GARCH-MIDAS model. J. Empir. Financ. 43, 130–142. doi:10.1016/j.jempfin.2017.06.005
Plakandaras, V., Gupta, R., and Wong, W. K. (2019). Point and density forecasts of oil returns: the role of geopolitical risks. Resour. Policy. 62, 580–587. doi:10.1016/j.resourpol.2018.11.006
Pu, W., Chen, Y., and Ma, F. (2016). Forecasting the realized volatility in the Chinese stock market: further evidence. Appl. Econom. 48 (33), 3116–3130.
Ratti, R. A., and Vespignani, J. L. (2013). Crude oil prices and liquidity, the BRIC and G3 countries. Energ. Econo. 39, 28–38. doi:10.1016/j.eneco.2013.04.003
Rehman, M. U. (2018). Do oil shocks predict economic policy uncertainty? Physica A: Stat. Mech. App. 498, 123–136. doi:10.1016/j.physa.2017.12.133
Sadorsky, P. (2006). Modeling and forecasting petroleum futures volatility. Energy. Econ. 28 (4), 467–488. doi:10.1016/j.eneco.2006.04.005
Sévi, B. (2014). Forecasting the volatility of crude oil futures using intraday data. Eur. J. Oper. Res. 235 (3), 643–659. doi:10.1016/j.ejor.2014.01.019
Sheng, X., Gupta, R., and Ji, Q. (2020). The impacts of structural oil shocks on macroeconomic uncertainty: evidence from a large panel of 45 countries. Energy Econ. 91, 104940. doi:10.1016/j.eneco.2020.104940
Shi, X., and Sun, S. (2017). Energy price, regulatory price distortion and economic growth: a case study of China. Energy. Econ. 63, 261–271. doi:10.1016/j.eneco.2017.02.006
Smales, L. A. (2020). Examining the relationship between policy uncertainty and market uncertainty across the G7. Int. Rev. Financ. Anal. 71, 101540. doi:10.1016/j.irfa.2020.101540
Tian, S., and Hamori, S. (2015). Modeling interest rate volatility: a realized GARCH approach. J. Bank. Financ. 61, 158–171. doi:10.1016/j.jbankfin.2015.09.008
Tsai, I. C. (2017). The source of global stock market risk: a viewpoint of economic policy uncertainty. Econ. Model. 60, 122–131. doi:10.1016/j.econmod.2016.09.002
Wang, Y., and Wu, C. (2012). Forecasting energy market volatility using GARCH models: can multivariate models beat univariate models? Energ. Econ. 34 (6), 2167–2181. doi:10.1016/j.eneco.2012.03.010
Wei, Y., Liu, J., Lai, X., and Hu, Y. (2017). Which determinant is the most informative in forecasting crude oil market volatility: fundamental, speculation, or uncertainty? Energy. Econ. 68, 141–150. doi:10.1016/j.eneco.2017.09.01610.1016/j.eneco.2017.09.016
Yang, C., Lv, F., Fang, L., and Shang, X. (2020). The pricing efficiency of crude oil futures in the Shanghai international exchange. Finance Res. Let. 36, 101329. doi:10.1016/j.frl.2019.101329
Yi, Y., Ma, F., Zhang, Y., and Huang, D. (2018). Forecasting the prices of crude oil using the predictor, economic and combined constraints. Econ. Model. 75, 237–245. doi:10.1016/j.econmod.2018.06.020
Yousefi, A., and Wirjanto, T. S. (2004). The empirical role of the exchange rate on the crude-oil price formation. Energy. Econ. 26 (5), 783–799. doi:10.1016/j.eneco.2004.06.001
Yuan, J. H., Kang, J. G., Zhao, C. H., and Hu, Z. G. (2008). Energy consumption and economic growth: evidence from China at both aggregated and disaggregated levels. Energy. Econ. 30 (6), 3077–3094. doi:10.1016/j.eneco.2008.03.007
Zhang, D., Hu, M., and Ji, Q. (2020). Financial markets under the global pandemic of COVID-19. Financ. Res. Lett. 36, 101528. doi:10.1016/j.frl.2020.101528
Zhang, D., Shi, M., and Shi, X. (2018). Oil indexation, market fundamentals, and natural gas prices: an investigation of the Asian premium in natural gas trade. Energy. Econ. 69, 33–41. doi:10.1016/j.eneco.2017.11.001
Zhang, Y. J., and Ma, S. J. (2020). Exploring the dynamic price discovery, risk transfer and spillover among INE, WTI and Brent crude oil futures markets: evidence from the high-frequency data. Int. J. Finance. Econ. 2020, 1914. doi:10.1002/ijfe.1914
Keywords: crude oil price, realized measures, GRACH-MIDAS models, macroeconomic uncertainty, volatility forecast
Citation: Yi A, Yang M and Li Y (2021) Macroeconomic Uncertainty and Crude Oil Futures Volatility–Evidence from China Crude Oil Futures Market. Front. Environ. Sci. 9:636903. doi: 10.3389/fenvs.2021.636903
Received: 02 December 2020; Accepted: 19 January 2021;
Published: 17 March 2021.
Edited by:
Qiang Ji, Chinese Academy of Sciences, ChinaReviewed by:
Bing-Yue Liu, Beihang University, ChinaJiangbo Geng, Zhongnan University of Economics and Law, China
Copyright © 2021 Yi, Yang and Li. This is an open-access article distributed under the terms of the Creative Commons Attribution License (CC BY). The use, distribution or reproduction in other forums is permitted, provided the original author(s) and the copyright owner(s) are credited and that the original publication in this journal is cited, in accordance with accepted academic practice. No use, distribution or reproduction is permitted which does not comply with these terms.
*Correspondence: Menglong Yang, bWVuZ2xvbmd5YW5nQGhudS5lZHUuY29t
 Adan Yi1
 Menglong Yang