 Ganbaatar Khurelbaatar
 Bishara Al Marzuqi2
 Jan Friesen
- 1Centre for Environmental Biotechnology, Helmholtz Centre for Environmental Research GmbH–UFZ, Leipzig, Germany
- 2The Research Council, Muscat, Oman
- 3Department of Catchment Hydrology, Helmholtz Centre for Environmental Research GmbH–UFZ, Leipzig, Germany
Safe access to sanitation is at the core of the United Nations Sustainable Development Goal (SDG) #6. Currently, it is estimated that this goal cannot be met by 2030. Despite all kinds of administrational hurdles, meeting SDG#6 depends on considerable investment. In order to get a chance at fulfilling SGD#6, the most cost-effective wastewater management has to be identified. Wastewater can be managed in different ways ranging from central treatment plants connected to individual households through sewer networks down to tanker fleets servicing each household. Depending on the geographical setting, investment costs, operation and maintenance as well as social acceptance there is no single best solution. Instead, identifying the optimal wastewater management is highly localized and country-specific or even settlement-specific. Within this study we present a data-reduced scenario generation and assessment for wastewater management based on the ALLOWS method that can be applied to individual settlements. Results provide cost-ranked wastewater management scenarios that enable decision makers to select the most cost-effective and feasible scenario. Our study starts with a detailed step-by-step methodology of a data-reduced ALLOWS approach. The approach is applied to two small settlements in Jordan and Oman with comparable population size for which a set of five scenarios along a decentralization gradient is defined and generated: centralized, semi-centralized, decentralized, and on-site/tanker. Considering spatial specificities and country-specific cost data, the five scenarios are cost-ranked and discussed in view of the two settlement settings. For Jordan specific treatment costs range from 3.8 to 6.9 USD/m3 of treated water and for Oman from 2.3 to 10.1 USD/m3. Although the scenario ranking differs, for both settlements the decentralized scenario is identified as the most cost effective, where wastewater is treated on-site for less-populated parts and by small cluster treatment plants for higher density parts. Further, potential extensions providing users with more functionality depending upon data availability for the data-reduced ALLOWS method are discussed. Using globally available data, the data-reduced can be applied worldwide. In view of SDG#6, we present a methodology that closes the gap between country-scale investment estimates and the most cost-effective wastewater management scenarios at settlement level.
GRAPHICAL ABSTRACT. Data reduced method for cost comparison of wastewater management scenarios.
Introduction
The sustainable management of water and sanitation has been defined as one of the UN’s sustainable development goals UN (2015), SDG 6. As of 2019, SDG 6 UN (2018) might not be reached in 2030 despite the progress made, which means that more than half of the population still lacks safely managed sanitation (UN, 2019). In order to reach the SDG 6, considerable investment is needed in a short period of time. The connection of all households to sewer networks and wastewater treatment plants is costly and differs between rural and urban regions. With regard to wastewater management, investment decisions should be made according to local conditions and needs in order to identify the most cost-effective sanitation solutions. The aim of this study is to develop and assess different wastewater management scenarios along a decentralization gradient and identify the most cost-effective solution.
Wastewater can be managed through both, central and decentralized systems. Traditionally urban wastewater management relies on a centrally organized infrastructure, whereas in rural wastewater management more decentralized solutions are applied that can range from small village networks to individual household treatment units or septic tanks serviced by tanker trucks.
Centralized wastewater management systems Wilderer and Schreff (2000) are defined as systems that collect the wastewater from all producers (e.g., households, industry, administrative buildings, and public utilities) via sewer networks to large treatment plants. Centralized systems, designed for densely populated areas, are meant to connect each point of wastewater generation to a central treatment plant.
Decentralized wastewater management systems, on the other hand, collect, treat, and reuse or dispose the wastewater at or near its point of generation (Crites and Tchobanoglous, 1998). The maximum size, generally expressed in population equivalent (PE), of the decentralized wastewater systems is inconsistent across sources van Afferden et al. (2015) and can range from individual houses to several thousand PE in smaller settlements or isolated suburbs.
Both, centralized and decentralized systems, can use a multitude of treatment technologies that determine the quality standard of effluent and the degree of complexity, as well as energetic and spatial requirements. Most treatment technologies are scalable and can be used in both approaches.
In classical centralized systems, however, more than 80% of the investment costs are spent on sewer infrastructure (Maurer et al., 2006). The high costs associated with the maintenance and restoration of centralized systems illustrate the ineffectiveness of the system, as it is not able to react flexibly to changes such as growing or shrinking populations (Maurer and Herlyn, 2006). Furthermore, technological advance in decentralized systems are necessary to convince planners and decision makers that these systems might substitute centralized infrastructure (Libralato et al., 2012). Therefore, a number of studies have been conducted to demonstrate the effectiveness of an approach that allows for a shift from centralized solution to decentralized solution (Sitzenfrei et al., 2013).
Yet, whereas centralized systems with large sewer networks are somewhat inflexible, they are often the most cost-effective solution in densely populated urban settings (Gijzen and Bijlsma, 2000). Rural areas with low population densities, however, have to contend with much longer sewer networks per inhabitant and can therefore be serviced more cost-effective with decentralized systems (Clark, 1997). Although the bulk of the investment is linked to the sewer infrastructure, there are also operation and maintenance as well as life time considerations that determine the overall cost and feasibility of different wastewater management systems (Roefs et al., 2017).
Van Afferden et al. (2015) developed a decision support and preliminary planning approach for the Assessment of Local Lowest Cost Wastewater Solutions (ALLOWS), which enables stakeholders and decision makers to develop a variety of alternative solutions for wastewater collection, treatment, and disposal. Within ALLOWS, several wastewater management scenarios are developed along a decentralization gradient. These scenarios can include classical centralized and decentralized scenarios as well as combinations. Using both spatial and economic analyses, the cost of the different scenarios is calculated in order to identify the most cost-effective solution for a given settlement. The existing study provided a case study for the Jordanian villages Ira and Yarqa including considerations for groundwater protection and effluent reuse.
Global estimates of the costs that are required to meet SDG 6 by 2030 at national scales are provided by Hutton and Varughese (2016). Whereas those estimates are essential, more targeted cost assessments and practical tools are required at local scales. The data reduced application of ALLOWS closes the gap between the national and the local scale by providing more detailed cost assessments and by providing a cost-based ranking between different wastewater management scenarios. By focusing on a data reduced approach we provide a methodology that can be applied globally, yet at the relevant local scale.
This study provides a detailed methodology of the basic steps of the ALLOWS methodology for countries with scarce data. Based on this data-reduced approach, wastewater management scenarios were developed for two different settlements with a similar population size in Jordan and in Oman. The settlements differ in terms of structure, location, and spatial and social settings. ALLOWS can be extended to a wide variety of wastewater management scenarios and can be linked to environmental protection such as groundwater or to the availability or effluent reuse options. We include an extensive discussion on optional extensions and use cases depending on environmental settings and data availability.
Methodology
The method ALLOWS was first presented by van Afferden et al. (2015). ALLOWS compares different wastewater management scenarios to enable stakeholders to select the most appropriate and cost-effective scenario. Firstly, wastewater management scenarios are defined, usually along a decentralization gradient from central to on-site systems. Based on the defined scenarios, data collection and data preprocessing are performed. Secondly, the scenarios are spatially developed to derive cost components such as sewer length or number and size of wastewater treatment plants. Thirdly, the spatial cost components are used in combination with additional cost data, e.g., regarding maintenance and system lifetime, for a dynamic cost comparison. In the following the different steps as well as the study sites and required data are described in detail.
Scenario Definition
The wastewater management scenarios are designed to depict the status quo, as well as the most common scenarios, i.e., centralized connection or disposal via tanker. In addition, decentralized and mixed scenarios can be added. For this study five scenarios were selected:
Centralized scenario (S1): All buildings are connected to the sewer network. The wastewater is conveyed to the closest existing wastewater treatment plant (WWTP) via trunk line and a combination of pumping station and pressure mains.
Semi-centralized scenario (S2): All buildings are connected to the sewer network. The wastewater is treated locally at a new settlement treatment plant.
Decentralized scenario (S3): The sewer network is optimized according to the geographical and the demographical characteristics (such as location of the individual buildings and population density) considering that some of the buildings will rely on on-site treatment systems rather than being connected to the sewer network.
On-site solution scenario (S4): All buildings rely on on-site wastewater treatment systems. No sewer network and wastewater treatment plant is considered.
Tanker scenario (S5): All buildings rely on collection tanks that are serviced by trucks, that transport the wastewater to the nearest existing wastewater treatment plant. This scenario is a common practice in many rural regions, including the two case study regions, Oman and Jordan.
Study Area
In this study two settlements that are similar in number of inhabitants were selected in Jordan (Al-Yazidiyah) and in Oman (Al Mazarih). Despite the similar inhabitant’s number, the selected settlements do not share other similarities in terms of structure, location, and other spatial and social settings.
The settlement of Al-Yazidiyah (32° 3′26.49″N, 35°46′40.31″E) is located in the north-western part of Jordan. The total number of inhabitants is about 2,000 (as of 2017; DOS Jordan, 2017). There are 228 buildings that have been digitized for the settlement. The average inhabitants per building is estimated at 8.8, which is in accordance with local statistical figures. The settlement is located in a hilly area and the administrative unit covers 265 ha. The nearest existing wastewater treatment plant in Al-Salt is located 5 km south of the settlement. According to USAID (2013), the average water consumption in the region is around 100 Lpcd (liter per capita per day). Current wastewater management relies on collection tanks emptied by tanker trucks (Clemens et al., 2020).
The settlement Oman, Al-Mazarih (23° 5′22.58″N; 58°51′21.25″E) is located close to the Gulf of Oman and has around 2,000 inhabitants (as of 2017 NCSI Oman, 2017). The visual analysis showed that there are 451 buildings in the area. The average number of inhabitants per building is estimated at 4.5, which in turn is in line with local statistical numbers (Haya-Water, 2016). The settlement is located along a Wadi, divided by a dry river and covers an area of 960 ha. The closest central WWTP is located in Quriyat, 30 km to the north. The average water consumption is reported to be around 170 Lpcd according to Haya-Water (2016a). The current wastewater management relies on septic tanks emptied by tanker trucks (Haya-Water, 2016a).
Data Requirements
The current study focusses on the most plausible scenarios that could be modeled with minimal data requirements. The data used for both study sites is shown in Table 1–in addition to local data used for the case studies open-access global data sources are mentioned as well. In the discussion, options for further scenarios as well as for additional components are presented.
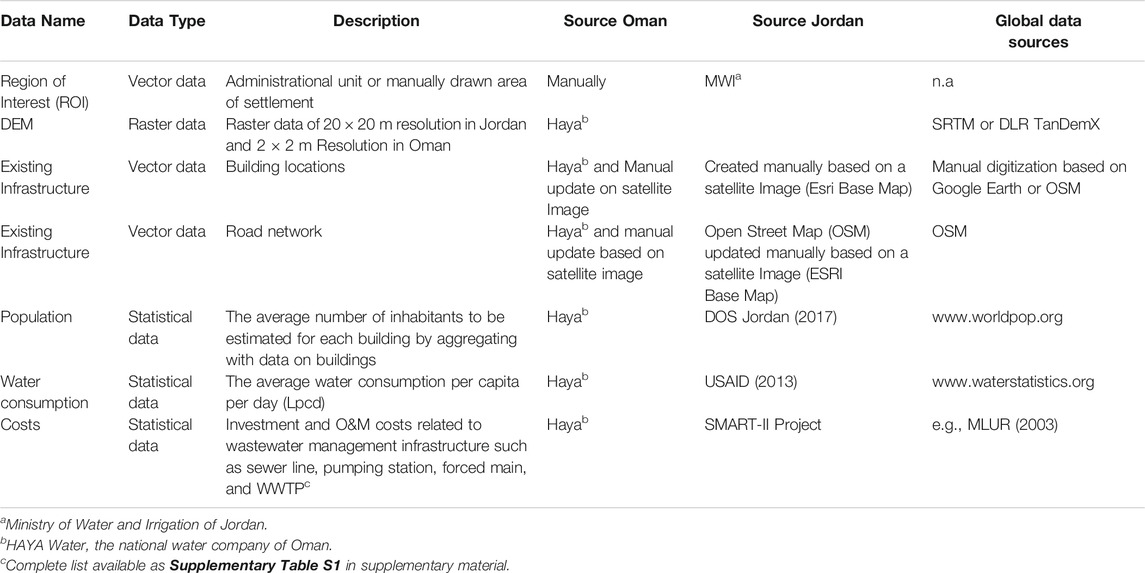
TABLE 1. Summary of spatial and statistical data used in the study.
Data Preprocessing
Prior to developing the individual spatial representations for each scenario, some data require pre-processing.
The definition of the region of interest (ROI) is relevant for the spatial analysis and the scenario development as it delineates the boundary of the study area. The ROI can be set as the boundary of the administrative unit or be manually defined by including the relevant infrastructure (e.g., buildings and roads) if no data is available. For Jordan, the administrative boundary for Al-Yazidiyah was taken; for Al-Mazarih, Oman, the ROI was manually defined as the administrational boundary was too large. For the ROIs polygon shapefiles are used.
Terrain Analysis
Elevation data based on a Digital Elevation Model (DEM) are used for the sewer network design and optimization. The ROI polygon is used to subset the DEM and hydrological analyses are performed to extract contour lines and a flow accumulation grid (showing the surface water run-off pattern) within the ROI. The contour lines and the flow-accumulation grid are derived using the ArcGIS spatial analysis package (Version 10.6 ESRI, Redlands, CA, United States). Required steps are the identification of sinks, flow direction, flow accumulation and micro-catchment delineation.
Building Data
The existing infrastructure data are then integrated into the geographical information system (GIS). Building and road networks are visually compared with satellite data (e.g., Google Earth or Esri Maps) and can be manually updated (or digitized).
Calculate Building Densities and Inhabitants per Building
Based on the building locations a building density map is calculated (e.g., ArcGIS package Kernel Density, Version 10.6 ESRI, Redlands, CA, United States). From the population data and the number of buildings, the average number of inhabitants per building and consequently the population density is derived. Furthermore, data on specific water consumption are used to estimate the size of the planned wastewater treatment plants, pumping stations, and sewer line diameters in accordance with the sewer planning guideline (see specific scenario development).
Model Spatial Scenarios
Sewer Design
Based on the calculated contour lines and flow accumulation a complete sewer network is designed for both settlements. Existing roads and the natural topography of the terrain were selected as main criteria to define potential routes for the sewer system and to achieve maximum gravity flow and minimum pumping capacity (Bizier, 2007). Flow accumulation pattern and contour lines are used for defining the gravity flow direction of each segment of the sewer network. Manholes are located at intersections and every 80 m along the sewer lines. The longest sewer line to the lowest elevation point of the ROI was selected for the main collector. The location for the main wastewater collection point for a potential WWTP (S2) or a transfer pumping station (S1) has been selected at or close to the lowest elevation point of the ROI.
Calculation of wastewater flow was based on population number converted to population equivalent (PE) according to (Gujer, 2007). PE is usually calculated using water consumption, and biochemical oxygen demand (BOD). As BOD is not always available population and PE can be assumed equal for municipal wastewater. The specific wastewater volume was calculated using the water consumption multiplied by factor 0.8 (Gujer, 2007).
While the technical specification of the sewer network for Jordan are determined according to a German standard on design and construction of sewers (DWA-A 139, DWA, 2009), in Oman it was defined in accordance with the Wastewater Design Manual of the national water company HAYA (Haya-Water, 2016b). Considering the semi-arid climatic conditions of the settlements, the sewer pipes are designed to be sufficient for Dry Weather Flow (DWF) in accordance with Bizier (2007). Specifically, peak flow was calculated as hourly flow multiplied by a Manning coefficient of 2.3 in accordance with (Bizier, 2007). The derived peak flow was used to determine the diameter of the sewer lines and the capacity of the pumping stations. The pumping stations are placed either at a point where the difference in height between surface level and invert level exceeds 5 m or in case no gravity flow was possible between the sections of the sewer system.
Specific Scenario Development
Once the design of the sewer system is completed, the individual scenarios are developed. Based on the sewer design that was used for the centralized (S1) and the semi-centralized (S2) scenario, the sewer network is modified (optimized) for the decentralized scenario S3 by reducing the sewer lines. The reduction of sewer lines in done through 1) separating remote households to be supplied with individual treatment units and 2) replacing individual pumping stations by small WWTPs. The on-site scenario (S4) is based on the concept of individual treatment units for each building, involving no sewer network. The tanker-based scenario S5 considered collection tanks for each building serviced by tankers. From each scenario the infrastructure details are then provided as input for the economic analysis.
S1: Centralized Scenario: All buildings are considered to be connected to the sewer network. The wastewater is collected in the designed sewer network and transported to the main collection point. From there, the wastewater is conveyed to the nearest existing wastewater treatment plant via a combination of trunk lines, pumping stations and pressure pipes.
S2: Semi-centralized scenario: All buildings are considered to be connected to the sewer network. The wastewater is collected in the designed sewer network and transported to the main collection point. The wastewater is considered to be treated at a local WWTP at this point. The dimensioning of the WWTP was based on the PE.
S3: Decentralized scenario: The sewer network is optimized according to geographical and demographic characteristics such as location of the individual buildings and the population density, considering that some of the buildings will not be connected to the sewer network, but will rely on on-site treatment systems to reduce the overall length of the sewer network. Therefore, the buildings density (buildings per hectar) was estimated and the ROI divided into different density zones. Then the sewer network (in m) and the buildings were intersected (ArcGIS, Version 10.6 ESRI, Redlands, CA, United States) with the different density zones to determine the total length of sewer lines and the number of buildings for each density zones. Based on the already estimated average population per building and the length of sewer lines for each density zone, the specific sewer lengths (m per capita) were estimated. A simplified cost estimate was carried out for a WWTP in three different sizes (500 PE, 1,000 PE, and 2,000 PE) connected to sewer networks with three different specific lengths (2, 5 and 10 m/PE). In parallel, the cost of an on-site wastewater treatment unit was estimated. Both costs were then converted into specific treatment costs (US$ per m³ wastewater treated) using the total costs and the specific water consumption per PE. The specific treatment cost of the household treatment unit was then compared to the specific treatment costs of the decentralized WWTPs, each including three different sewer lengths (Figure 1A; Supplementary Figure S1A in supplementary material). The specific treatment costs of the WWTPs, which are lower than that of the household treatment unit identified the density zones and thus the clusters of the decentralized scenario (Figure 1B). These high-density clusters are then considered to be connected to the sewer network and decentralized WWTPs, dimensioned to the cluster PE. High-density clusters below a threshold of 100 PE are considered for on-site treatment, to avoid large numbers of clusters with only few connected houses. Once the central sewer network is divided into individual clusters, the pumping stations were excluded from the network, making it gravity sewer only and the decentralized WWTPs replaced the pumping stations at or near their locations. For buildings outside the clusters, it was assumed that the construction of on-site treatment units is economically more feasible than a connection to the sewer network.
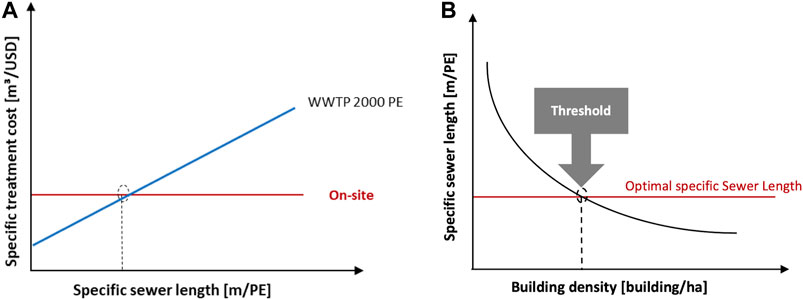
FIGURE 1. Optimization of sewer network. Determining the optimal length of sewer requirement (left) and the selection of clusters (right).
S4: On-site scenario: All buildings rely on on-site wastewater treatment systems. No sewer network and central wastewater treatment plant is considered.
S5: Tanker scenario: This scenario considers the current practices of the specific settlement for wastewater disposal and treatment to be applied or continued in an environmentally sound way. The current practices of both locations rely on collection tanks of which the content is collected by trucks and transported to the nearest wastewater treatment plant. Reports suggested that the existing collection tanks often do not meet the standard requirements by leaking the contents, therefore posing a significant risk of groundwater contamination and therefore need to be upgraded (JICA, 2015). The average volume of the collection tanks is reported to be 8–15 m³ for Jordan van Afferden et al. (2015) and 20–30 m³ for Oman (personal communication with HAYA) resulting in an emptying frequency of 10–20 days, respectively.
Technology Selection
The main criteria for the technology selection was the data availability in both countries regarding the investment, re-investment and O&M costs. Therefore, conventional (Activated Sludge) WWTP was selected for S1 to expand the existing WWTPs. For S2 and S3, Sequencing Batch Reactor (SBR) technology was selected. For S4, constructed wetland technology was selected.
Summarize Data for Economic Assessment
Following the development of scenarios, the numerical characteristics for the spatial data, which are created in GIS, are then transferred to the economic assessment. Specifically, the length of the sewer lines of different diameters, number of manholes, pumping stations, and the size of the WWTPs (Table 2) for each scenario.
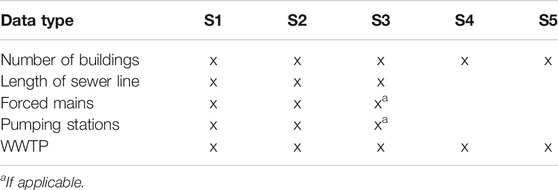
TABLE 2. Summary of the spatial data per scenario.
Economic Assessment
Infrastructure costs are estimated in terms of investment, reinvestment and operation and maintenance (O&M) using the local and international benchmark cost items (cf. Supplementary Table S1 supplmentary material). The Net Present Value (NPV) or each scenario was calculated according to the DWA (2011).
The present value of an individual (investment and reinvestment) cost item made at the nth year was calculated by using the Discounting Factor for Individual Cost Items (DFACIC):
Where i is the discount rate (e.g., 3% = 0.03), n the year of the occurrence for cost (e.g, 10 years after the start of the analysis period), ICnPV is the present value of the investment cost, ICn is the investment cost occurring in the year n, RICnPV is the present value of the reinvestment cost, and RICn is the reinvestment cost occurring in the year n.
The present value for all costs recurring annually (O&M cost) over the analysis period (60 years) was calculated by using the Discounting Factor for Uniform Series of Costs (DFACS):
Where OMCnPV is the present value of the accumulated O&M cost up to the year n and OMC is the annual O&M cost.
The accumulation of the present values (Eqs. 2, 3, 5) of each cost item over the analysis period gives the NPV of the calculated scenario. Discount rate over the project period (Eqs. 1, 4) was assumed to be 3% as reported by Haya Water (personal communication) and the same rate was selected for Jordan.
The lifetime of the sewer lines was considered to be 60 years in accordance with Haya Water (personal communication) and thus the analysis period for the economic assessment is set at 60 years. The lifetimes are considered to be 30 years for decentralized and centralized WWTPs and 20 years for on-site treatment units. This means that re-installation of new on-site treatment units is considered after 20 years from the start of the analysis period. The reinvestment costs for mechanical equipment for the WWTPs and pumping stations are considered to occur every 10 years (cf. Table 3). For the WWTPs it was considered that the reinvestment costs are 40% of the initial construction cost (Plapally and Lienhard 2012). The O&M costs for the sewer lines were assumed as 1% of the construction cost for both countries. The other costs include: planning and design costs, overhead and profit, and contingency. Other costs are calculated at 10, 10, and 15% of the construction cost, respectively. The investment cost is estimated as the sum of the other costs and construction cost. Despite the use of local cost data for the economic assessment (in Jordanian Dinar and Omani Rial), the results were presented in United States $ for the comparison purpose. Ranges for the categorized unit costs are available in Supplementary Table S1 in supplementary material.
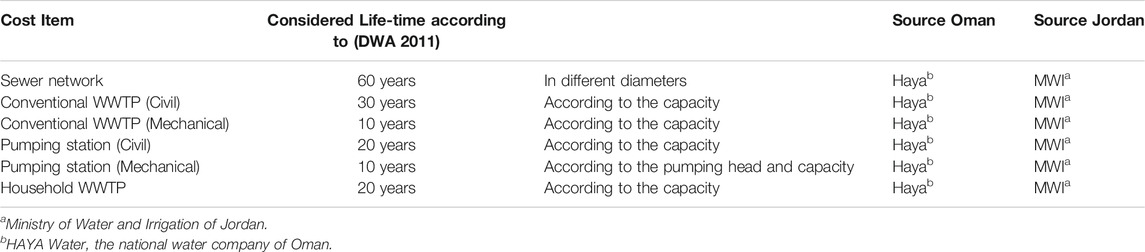
TABLE 3. Summary of cost data with the associated life time of each component.
Results
The results are presented for the individual scenarios using figures for the Oman study location. Tabular overviews then present the results of the scenario costs and the scenario rankings for both locations.
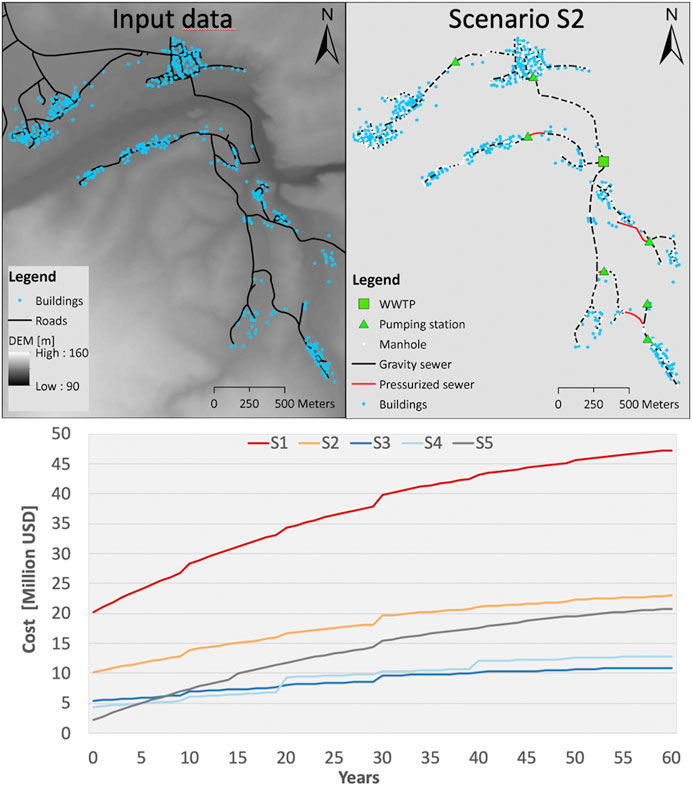
For the centralized (S1) and the semi-centralized (S2) scenario all households were connected to the sewer network and the collected wastewater is pumped to the nearest existing WWTP (S1) or treated in a new WWTP (S2). Exemplary for Al-Mazarih, Oman, Figure 2A shows the spatial input data and in Figure 2B the wastewater infrastructure, including manholes, both gravity and pressurized sewers, pumping stations and WWTP corresponding to S2 are shown. In case of S1 the distance to the closest existing WWTP was 5 km for Al-Yazidiyah and 30 km for Al-Mazarih.
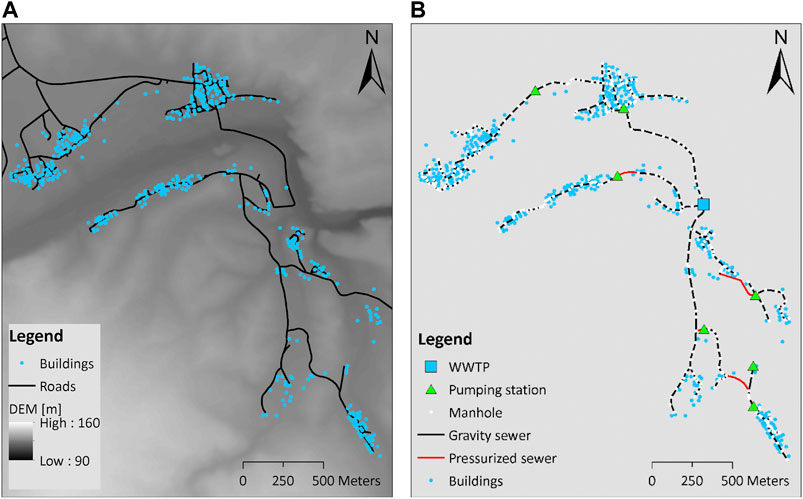
FIGURE 2. (A) Input data (buildings, roads, elevation) for Al Mazarih and (B) scenarios S1 and S2 representation for Al Mazarih. For S1 the WWTP would be replaced by a pumping station connected to the WWTP in Quriyat.
For the decentralized scenario (S3) the aim was to reduce the sewer network. Figure 3A shows the comparison of a 500 PE WWTP over different specific sewer lengths against an on-site treatment plant. Figure 3B shows the building density threshold below which on-site treatments systems are economically more feasible than a sewer network. The derived thresholds are about 4 (buildings/ha) for Al-Mazarih and 2 (buildings/ha) for Al-Yazidiyah. Figure 4 shows the S3 clusters results using the building density thresholds, exemplary for Al-Mazarih. In comparison to scenarios S1 and S2 individual buildings have been disconnected from the sewer network to be serviced by on-site treatments systems and individual pumping stations have been replaced by small WWTPs. Figure 4 also shows a singular high-density cluster (red boundary) that has been identified using the threshold (Figure 3B), yet is below 100 PE and is therefore not considered for a WWTP. The remaining high-density building clusters, 5 for Al-Mazarih and 1 for Al-Yazidiyah were then connected to small WWTPs.
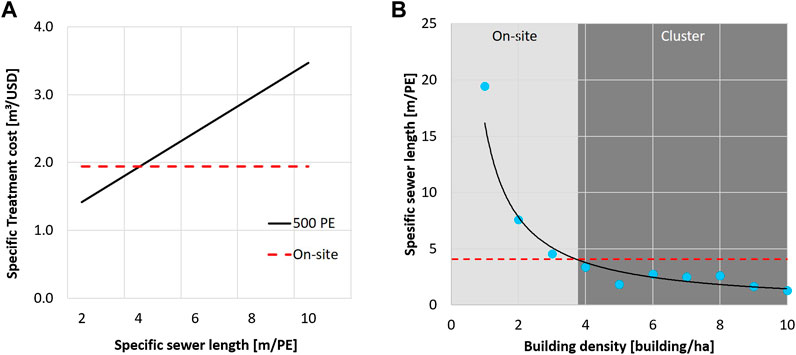
FIGURE 3. (A) Specific treatment cost vs. specific sewer length for on-site treatment and for a 500 PE WWTP incl. sewer lines and (B) sewer length vs. building density plot with on-site threshold for Al Mazarih.
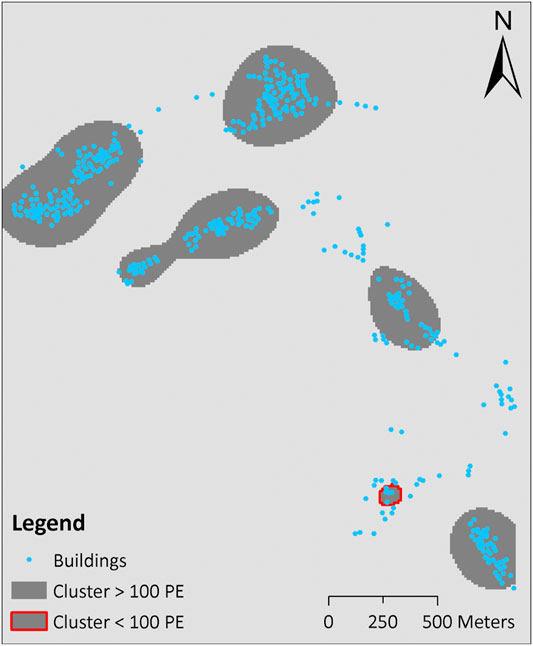
FIGURE 4. Cluster map for S3 (Al Mazarih). All buildings outside the clusters use on-site treatment and buildings within the five clusters are connected to a local sewer network and small WWTPs. The red-outlined cluster is below 100 PE and is therefore considered for on-site treatment.
For the on-site (S4) and tanker (S5) scenarios, all households are serviced individually. For Al-Mazarih 442 and for Al-Yazidiyah 228 buildings were considered for S4 and S5. Due to the different local conditions, the capacity of the on-site treatment unit for Al-Mazarih was 6 PE per building and Al-Yazidiyah 10 PE per building. The frequency of the tanker service was 15 days for Jordan and 30 days for Oman.
The results from the spatial representation of the scenarios as well as the specific treatment costs and rankings based on the cost assessment are detailed in Tables 4 (Al-Yazidiyah) and 5 (Al-Mazarih).
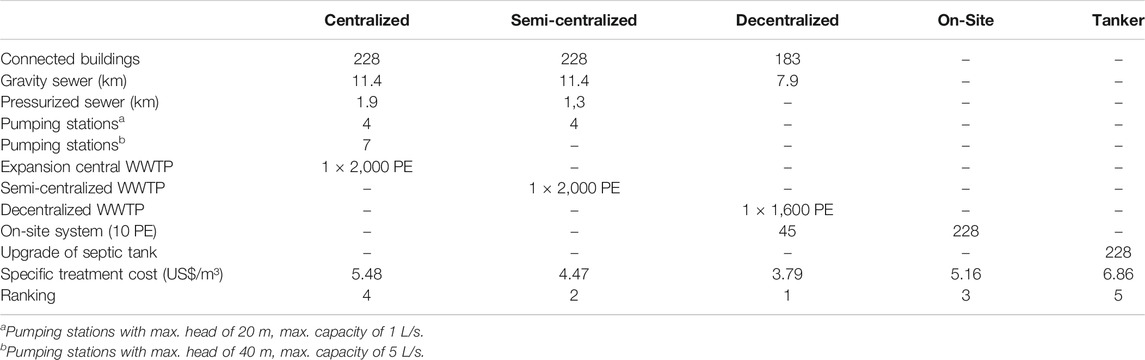
TABLE 4. Wastewater management scenario in Al-Yazidiyah, Jordan including the Specific treatment cost and the ranking from the lowest cost (1) to highest cost (5).
S1: The results show that the centralized scenario was one of the most expensive solutions for the two settlements. This was mainly due to the high requirements of sewer pipes and pumping stations for extensive distances (especially in case of Oman).
S2: While the semi-centralized scenario in Al-Yazidiyah, Jordan was the second most favorable option, it was presented as the second most expensive option in Al-Mazarih, Oman. This might be attributed to the settlement structure. Al-Yazidiyah is located on a hill, which made it possible to connect most of the buildings into one large gravity-based sewer network, so that only a fraction of the buildings were dependent on 4 small pumping stations (See Supplementary Figure S1B in supplementary material), while the sewer network of Al-Mazarih consisted of a number of pumping stations distributed throughout the settlement (see Figure 2A).
S3: It was shown that the decentralized solution was the most cost-effective scenario for both settlements despite the demographic, structural and spatial differences between. The optimization of the sewer network led to the identification of the clusters to be connected to small WWTPs and the buildings that depend on on-site treatments systems (see Figures 3, 4; Supplementary Figures S2, S3 for Al-Yazidiyah in supplementary material). As a result, the average sewer requirement per person decreased from 6.35 to 4.9 m/PE in Jordan and from 6.4 to 4.5 m/PE in Oman, reducing the associated costs. The settlement Al-Yazidiyah, Jordan presented a simple infrastructure requirement, which consisted of a gravity-based sewer network connected to only one decentralized WWTP. Although the settlement Al-Mazarih, Oman presented more complicated infrastructure consisting of 5 smaller clusters each connected to a small WWTP (design capacity up to 500 PE), the cost of the decentralized scenario was still lower compared to other solutions.
S4: The 228 and 442 buildings in Jordan and in Oman are considered to be equipped with on-site wastewater treatment units. Depending on the average population per building wastewater treatment unit with a design capacity of 10 PE was selected for Jordan and 6 PE for Oman. This scenario was ranked number 3 for Al-Yazidiyah and number 2 in Al-Mazarih. This slight differences in the ranking might be mainly the fact that the sewer network in Al-Mazarih was rather complicated, making the other scenarios more costly and thus favoring more individual solution such as on-site treatment systems.
S5: While the tanker-based scenario was the most expensive scenario for Al-Yazidiyah, Jordan, it ranked third in Al-Mazarih, Oman. However, this does not mean that the costs involved in this solution in Oman were less. This ranking might be attributed to the higher costs related to centralized (S1) and semi-centralized (S2) scenarios in Oman, caused by the nature of the terrain. Furthermore, the costs associated with the centralized scenario (S1) for Al-Yazidiyah, Jordan, which are lower than those of the tanker Scenario (S1) might be explained by the fact that the settlement is located 5 km from the nearest centralized WWTP, making the need for infrastructure much smaller.
The economic assessment includes the lifetime of the individual components (cf. Table 3) and the associated re-investments, so that the scenario ranking can also be shown over time. Figure 5 shows the net present value (NPV) evolution over the maximum lifetime (sewer network) of 60 years exemplary for Al-Mazarih (see Supplementary Figure S4 for Al-Yazidiyah). Whereas most scenarios show a constant offset, the tanker solution starts with the lowest costs but increases substantially due to the high O&M costs for the tanker fleet.
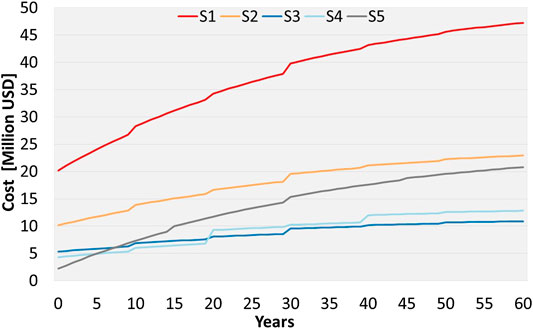
FIGURE 5. Total cost of the scenarios in net present value (NPV) per year for the maximum lifetime.
Discussion
The results for both settlements have shown that the cost of the scenarios strongly depends on the complexity of the sewer network, i.e., the length of sewer network and the number of pumping stations. This can be confirmed by the fact that the S3, which involves a combination of decentralized WWTPs with optimized sewer network and on-site wastewater treatment units, was the most cost-effective scenario for both settlements. Furthermore, the distance to the closest centralized WWTP is the main factor for the overall cost for the centralized scenarios (S1), reflecting the high costs associated with the sewer network (cf. Tables 4, 5). Similar conclusions have been reported (Shapiro and Rogers 1978; Maurer et al., 2010). While Maurer et al. (2010) pointed out the strong dependency of the sewer network on terrain; Shapiro and Rogers (1978) confirmed that the cost of their scenarios was highly responsive to the sewer costs.
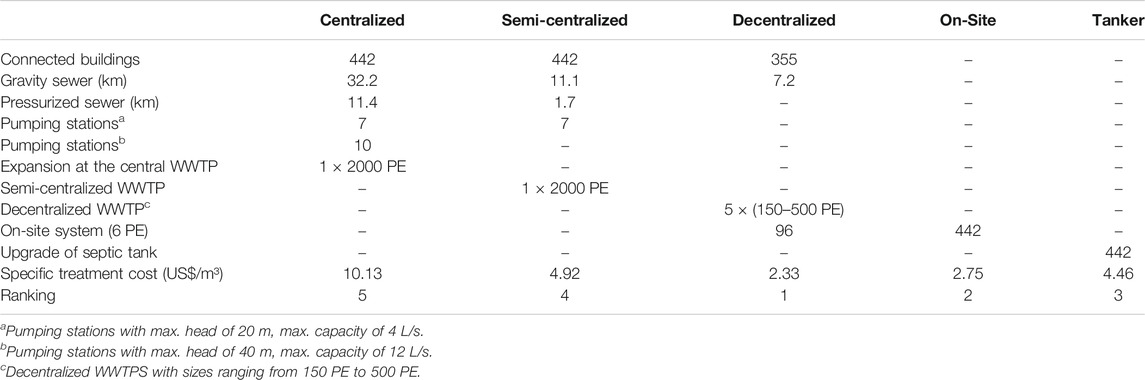
TABLE 5. Wastewater management scenario in Al-Mazarih, Oman including the Specific treatment cost and the ranking from the lowest cost (1) to highest cost (5).
Despite the fact that differences in topography and population or building density were reflected in the rankings of the semi-decentralized scenario S2, the optimized sewer network showed overall very similar figures for both settlements (i.e: specific sewer length).
The on-site scenario (S4) showed cost-effectiveness over (S3) for both settlements for the first 20 years of the analysis period. However, due to the high reinvestment cost after 20 years and the higher O&M costs, the total cost of this scenario overtakes that of S3. This might indicate the flexibility of such system over relative short period of time (Wang 2014).
The tanker-based scenario (S5) was one of the most expensive scenarios, which shows the high O&M costs related to the tanker trucks over the long run. The low investment cost of this scenario might be the main reason that this scenario is the most common practice in Oman and Jordan.
Figure 6 shows the distribution of the costs related to the wastewater infrastructure involved in each scenario for both AL-Mazarih and Al-Yazidiyah. The general distribution of costs depict:
(a) site specific characteristics such as the increase cost for pumping stations between S1 and S2 for Jordan, due to the higher pumping requirements involved in the pipe line connection to the closest existing centralized WWTP.
(b) and differences between the scenarios such as S1/S2 and S3 where the pumping costs are eliminated and replaced as decentralized WWTPs as well as between S1/S2/S3 and S4/S5 the exclusion of the all sewer and pumping related costs.
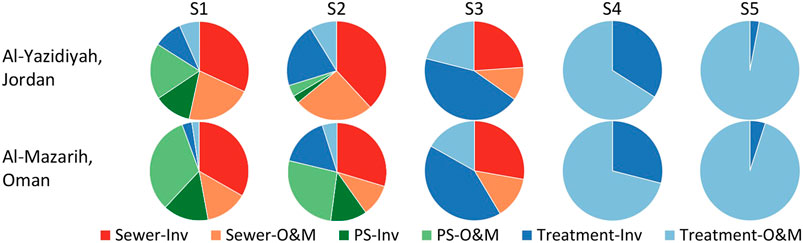
FIGURE 6. Distribution of sewer, pumping station, and treatment-related costs per scenario and case study (Inv: investment and reinvestment cost, O&M: operation and maintenance cost, PS: pumping station).
Looking at the cost distributions of the two countries strong similarities can be observed for S3, S4, and S5, while S1 and S2 show substantial differences e.g., caused by O&M costs. These differences might be attributed to both site specific characteristics and country specific cost structures. The ranking might be influenced by factors such as different discount rates and cost assumptions such as increased O&M costs, for a performance of a WWTP. In addition to percentile distribution of the costs in Figure 6; Supplementary Table S2 shows the individual net present value costs.
The ALLOWS methodology is rather unique and similar tools only focus on single elements or scenarios (Eggimann et al., 2015; Langergraber et al., 2015). Eggimann et al. (2015) developed a tool that provides the optimal degree of centralization for settlements which is similar to the S3 scenario provided in this study. Despite some methodological differences in identifying the most cost-effective scenario, Eggimann et al. (2015) do not provide a comparison to other plausible scenarios. The different scenarios and associated costs lay basis for further selection analysis, since the economy is not the only selection criteria for many communities. Langergraber et al. (2015) developed the CLARA tool which compares wastewater management scenarios, that are somewhat similar to that of the current study. However, the spatial analysis, the development and optimization of the sewer network is not included in the CLARA tool and the scenarios are based on indicators and assumptions. Hutton and Varughese (2016) provide a global overview of costs associated with SDG 6. Using the global WASH database they provide country-level cost estimates, required to meet SDG 6. Our study aims to provide a methodology that can help to downscale these country-level estimates to the local level and at the same time offer guidance to select the most appropriate wastewater management scenario.
The wastewater management scenario ranking for both settlements has been conducted with the least possible amount of input data (see Table 1) in order to demonstrate the wide applicability of the ALLOWS tool to settlements in data scarce regions worldwide. In our view such a data limited application is necessary in order to estimate the costs of plausible wastewater management scenarios in view of the UN SDG 6. However, depending on available data ALLOWS can be extended to incorporate further applications such as environmental protection, local guidelines, as well as reuse scenarios. The following discussion aims to provide potential modifications:
• Scenario development
In the presented approach five scenarios were developed from central (S1) to on-site (S4 and S5) wastewater management scenarios. Depending on the local conditions these scenarios can be re-defined in order to include different management scenarios. For instance, for a region with homogeneous low density of population a micro-clustering scenario can be developed. This scenario could include 2–3 buildings that are connected to a common small WWTP.
• Inclusion of spatial restrictions
Depending on available input data, the spatial analysis enables users to include spatial restrictions. Such restrictions can be applied, for example, to the placement of WWTPs in the form of minimum distance to buildings, land ownership or protection zones.
• Existing infrastructure
The underlying assumption for the two study settlements was that no prior sewer network or infrastructure existed. Existing infrastructure such as sewer networks can be included and extended within ALLOWS.
• Additional technologies
Numerous wastewater treatment technologies exist Crites and Tchobanoglous (1998) for a variety of treated effluent qualities and space requirements (e.g., wetland or SBR). For the present study only one technology set was used for large WWTPs, cluster WWTPs and on-site treatment depending on the data availability in Jordan and Oman. Given that the cost data is available further technologies can be included and even be compared in different technology scenarios. Different technologies also can be included in order to fulfill to the country requirements for the treated effluent quality.
• Social acceptance studies
Depending on the cultural and social acceptance of individual treatment technologies and WWTP placements, not all scenarios may be accepted by the local population (e.g., on-site treatment in close vicinity of the buildings). Although this does not affect the overall scenario costs, results of social acceptance studies can be combined with the ranking results in order to not only identify the most cost-effective scenario but also highlight which scenarios are plausible. In addition, the scenarios can be utilized as part of a planning and participation process.
Conclusion
This study presents a clear and concise step-by-step methodology for a data-reduced scenario generation and assessment of wastewater management scenarios based on the ALLOWS method. We have applied the data-reduced ALLOWS method to two settlements in Jordan and Oman with comparable population size. For both settlements five wastewater management scenarios along a decentralization gradient have been developed: Centralized scenario (S1), Semi-centralized scenario (S2), Decentralized scenario (S3), On-site/tanker scenario (S4/5).
Both settlements showed slightly different scenario rankings based on specific treatment costs, yet the decentralized scenario (S3) was the most cost-effective for both settings. Rankings differed with regard to the centralized scenario (S1) which was mostly caused by the different distances to the closest existing WWTP and with the semi-centralized scenario (S2) due to differences in topography and population density.
Our study focused on a data-reduced ALLOWS method in order to provide a wide applicability in data scarce regions. However, the methodology has the potential to be extended depending upon available data. To this end a detailed discussion was included that provides modification options to include further wastewater management scenario options. The presented methodology aims to close the gap between country-scale and detailed wastewater management planning and is therefore an important tool to estimate the cost required to fulfill the UN SDG 6 and reach a world where more people have access to safe sanitation.
Data Availability Statement
The raw data supporting the conclusions of this article will be made available by the authors, without undue reservation. Data on detailed unit costs from Jordan and Oman are confidential and therefore cannot be disclosed. Further enquiries should be directed to the corresponding author GK, Z2FuYmFhdGFyLmtodXJlbGJhYXRhckB1ZnouZGU=.
Author Contributions
GK and JF contributed conception and design of the study, performed the analysis, and wrote the first draft of the manuscript. BAM contributed to the methodology and the analysis of the Al-Mazarih case study. MVA contributed to further developing the ALLOWS tool. RM read and commented the manuscript. All authors contributed, read, and approved the submitted version.
Funding
The research leading to these results has received funding from the Institute for Advanced Technology Integration (IATI) under The Research Council (TRC) of the Sultanate of Oman. TRC Research Contract No. TRC/RCP/15/002. The German Federal Ministry of Education and Research (BMBF) is acknowledged for funding this research through the SALAM2-project (grant 02WM1533C).
Conflict of Interest
The authors declare that the research was conducted in the absence of any commercial or financial relationships that could be construed as a potential conflict of interest.
Acknowledgments
We would like to extend our thanks to the national water company of Oman, Haya Water, the Ministry of Water and Irrigation, Jordan, and the BDZ for supplying us with data for Oman, Jordan, as well as cost and technology data.
Supplementary Material
The Supplementary Material for this article can be found online at: https://www.frontiersin.org/articles/10.3389/fenvs.2021.626634/full#supplementary-material
References
Bizier, P. (2007). “Chapter 6 Design of Sanitary Sewer Systems,” in Gravity Sanitary Sewer Design and Construction. Editor D. H. Evans (Reston, Va: American Society of Civil Engineers), 165–189.
Clark, R. (1997). Optimum Scale for Urban Water Systems, Tech. Rep. 5 in the Water Sustainability in Urban Areas Series, Water Resources Group. SA, Texas: Department of Environment and Natural Resources.
Clemens, M., Khurelbaatar, G., Merz, R., Siebert, C., van Afferden, M., and Rödiger, T. (2020). Groundwater Protection under Water Scarcity; from Regional Risk Assessment to Local Wastewater Treatment Solutions in Jordan. Sci. Total Environ. 706. doi:10.1016/j.scitotenv.2019.136066
Crites, R. W., and Tchobanoglous, G. (1998). Small and Decentralized Wastewater Management Systems. New York: McGraw-Hill.
DWA (2009). DWA-A 139 Einbau und Prüfung von Abwasserleitungen und –kanälen, (12/2009), DWA Deutsche Vereinigung für Wasserwirtschaft, Hennef: Abwasser und Abfall.
DWA (2011). Dynamic Cost Comparison Calculations for Selecting Least-Cost Projects in Water Supply and Wastewater Disposal – DCCC – Appraisal Manual for Project Designers. Hennef: German Association for Water, Wastewater and Waste (DWA).
Eggimann, S., Truffer, B., and Maurer, M. (2015). To Connect or Not to Connect? Modelling the Optimal Degree of Centralisation for Wastewater Infrastructures. Water Res. 84, 218–231. doi:10.1016/j.watres.2015.07.004
Gijzen, H. J., and Bijlsma, M. (2000). Technical Measures. In: Strategy Options for Sewage Management to Protect the Marine Environment. UNEP/GPA, The Hague, December, pp 33–58.
Haya-Water (2016b). “Section 03 – Sewerage Systems,” in WASTEWATER DESIGN MANUAL (MuscatOman: Haya Water Company), 22–23.
Hutton, G., and Varughese, M. (2016). The Costs of Meeting the 2030 Sustainable Development Goal Targets on Drinking Water, Sanitation, and Hygiene. Washington, DC: World Bank Group, Water and Sanitation Program. doi:10.1596/k8543
JICA (2015). The Project for the Study on Water Sector for the Host Communities of Syrian Refugees in Northern Governorates in the Hashemite Kingdom of Jordan – Final Report. Tokyo: Japan International Cooperation Agency (JICA).
Jordan, D. O. S. (2017). Department of Statistics Jordan. Population Count. Available online at: http://dosweb.dos.gov.jo/ (Accessed May, 2020)
Langergraber, G., Ketema, A. A., Casielles Restoy, R., and Lechner, M. (2015). CLARA Simplified Planning Tool v1.6 User Manual. Available online at: http://www.ecosan.at/ssp/issue-19-the-clara-project/CLARA%20SPT_v1-6_User%20Manual.pdf (Accessed August, 2020)
Libralato, G., Volpi Ghirardini, A., and Avezzù, F. (2012). To Centralise or to Decentralise: An Overview of the Most Recent Trends in Wastewater Treatment Management. J. Environ. Manage. 94 (1), 61–68. doi:10.1016/j.jenvman.2011.07.010
Maurer, M., and Herlyn, A. (2006). Zustand, Kosten und Investitionsbedarf der schweizerischen Abwasserentsorgung. Düdendorf: Eawag.
Maurer, M., Rothenberger, D., and Larsen, T. A. (2006). Decentralised Wastewater Treatment Technologies from a National Perspective: At what Cost Are They Competitive? Water Sci. Technol. Water Supply 5 (6), 145–154. doi:10.2166/ws.2005.0059
Maurer, M., Wolfram, M., and Anja, H. (2010). Factors Affecting Economies of Scale in Combined Sewer Systems. Water Sci. Technol. 62 (1), 36–41. doi:10.2166/wst.2010.241
MLUR (2003). Abwasserentsorgung in Brandenburg - Orientierungswerte Jahr 2003 - Aufwand für die Abwasserableitung und AbwasserbehandlungMinisterium für Landwirtschaft, Umweltschutz und Raumordnung des Landes Brandenburg (MLUR). Potsdam, Germany.
Oman, N. C. S. I. (2017). National Centre for Statistics & Information, Oman. Available online at: http://data.gov.om/ (Accessed May, 2020)
Plappally, A. K., and Lienhard, J. H. (2012). Costs for Water Supply, Treatment, End-Use and Reclamation. Desalination Water Treat. 51, 200–232. doi:10.1080/19443994.2012.708996
Roefs, I., Meulman, B., Vreeburg, J. H. G., and Spiller, M. (2017). Centralised, Decentralised or Hybrid Sanitation Systems? Economic Evaluation under Urban Development Uncertainty and Phased Expansion. Water Res. 109, 274–286. doi:10.1016/j.watres.2016.11.051
Shapiro, M., and Rogers, P. (1978). Analyzing the Impact of Land Use on Sewer Service Area Planning. J. Am. Water Resour. Assoc. 14 (6), 1340–1356. doi:10.1111/j.1752-1688.1978.tb02286.x
Sitzenfrei, R., Möderl, M., and Rauch, W. (2013). Assessing the Impact of Transitions from Centralised to Decentralised Water Solutions on Existing Infrastructures - Integrated City-Scale Analysis with VIBe. Water Res. 47 (20), 7251–7263. doi:10.1016/j.watres.2013.10.038
UN (2018). SDG 6 Synthesis Report 2018 on Water and Sanitation. New York: UN. doi:10.18356/e8fc060b-en
UN (2019). Sustainable Development Development Indicators 39 p. UN, Submitted pursuant to General Assembly resolution 70/1. Available at: https://unstats.un.org/sdgs/indicators/database/.(Accessed May, 2020)
UN (2015). Transforming Our World: The 2030 Agenda for Sustainable Development, United Nations, 2015. Available at: https://undocs.org/A/70/L.1.(Accessed May, 2020)
USAID (2013). USAID Institutional Support & Strengthening Program (ISSP), National Strategic Wastewater Master Plan. Washington DC: Final Draft Report.
van Afferden, M., Cardona, J. A., Lee, M.-Y., Subah, A., and Müller, R. A. (2015). A New Approach to Implementing Decentralized Wastewater Treatment Concepts. Water Sci. Technol. 72 (11), 1923–1930. doi:10.2166/wst.2015.393
Wang, S. (2014). Values of Decentralized Systems that Avoid Investments in Idle Capacity within the Wastewater Sector: A Theoretical Justification. J. Environ. Manage. 136, 68–75. doi:10.1016/j.jenvman.2014.01.038
Keywords: wastewater, central, decentral, rural, cost-effective, data scarcity
Citation: Khurelbaatar G, Al Marzuqi B, Van Afferden M, Müller RA and Friesen J (2021) Data Reduced Method for Cost Comparison of Wastewater Management Scenarios–Case Study for Two Settlements in Jordan and Oman. Front. Environ. Sci. 9:626634. doi: 10.3389/fenvs.2021.626634
Received: 06 November 2020; Accepted: 15 April 2021;
Published: 05 May 2021.
Edited by:
Anik Bhaduri, Griffith University, AustraliaReviewed by:
Van Thi Thanh NGO, Thuyloi University, VietnamMd Sayed Iftekhar, Griffith University, Australia
Copyright © 2021 Khurelbaatar, Al Marzuqi, Van Afferden, Müller and Friesen. This is an open-access article distributed under the terms of the Creative Commons Attribution License (CC BY). The use, distribution or reproduction in other forums is permitted, provided the original author(s) and the copyright owner(s) are credited and that the original publication in this journal is cited, in accordance with accepted academic practice. No use, distribution or reproduction is permitted which does not comply with these terms.
*Correspondence: Ganbaatar Khurelbaatar, Z2FuYmFhdGFyLmtodXJlbGJhYXRhckB1ZnouZGU=