 Yinjun Zhou
 Jinyou Lu1*
 Zhongwu Jin
95% of researchers rate our articles as excellent or good
Learn more about the work of our research integrity team to safeguard the quality of each article we publish.
Find out more
ORIGINAL RESEARCH article
Front. Environ. Sci. , 29 September 2021
Sec. Conservation and Restoration Ecology
Volume 9 - 2021 | https://doi.org/10.3389/fenvs.2021.611668
This article is part of the Research Topic Dams and Wetland Biodiversity: Impacts and Mitigating Measures View all 8 articles
Following the construction of a reservoir, sediment is intercepted, which greatly reduces the sediment concentration in the discharged flow. This reduction causes riverbed scouring and flow structure adjustments downstream, thereby impacting the river habitat. This study used the generalized flume test with different bed sand compositions and discharge rates to simulate the scouring adjustment process of a sand pebble riverbed channel downstream of a reservoir. The results show that the bed sediment composition affects the water surface gradient, scour depth, turbulence intensity, and sand resistance directly after final scouring. Coarse-grained bed sediment demonstrated the greatest final turbulence intensity and sand resistance, while bed sediments with reduced coarseness exhibited a greater scouring degree; the resistance for sand grains of moderate coarseness showed the greatest change. Sand resistance was exponentially and positively correlated with the median grain size and the fractal dimension of bed sediment mass. The mass fractal dimension expression was suitable for the analysis of bed sand grain-size distribution; it contributed to the calculation of grain resistance with fewer hydraulic parameters. The relationship between the mass fractal dimension and the adjusted grain resistance was also established, which can aid the calculation of the resistance changes in sandy gravel-bed river reaches downstream of reservoirs, enabling the prediction of their effects on aquatic habitats.
Reservoirs are built for a range of benefits such as flood control and runoff storage; however, they also inevitably alter the natural sediment transport equilibrium of rivers (Zhou et al., 2020). The construction of reservoirs often causes riverbed scouring adjustments due to a drastic reduction in incoming sand. This is especially true downstream of large reservoirs; this, in turn, affects the riverbed microtopography, riverbed resistance, and flow structure. These changes have a significant impact on economic production and aquatic habitats, wherein the key factor for riverbed deformation and flow structure is the change in riverbed resistance. For this reason, research on channel resistance downstream of dams has become an area of interest to predict habitat changes.
Resistance studies can be divided into three areas depending on the riverbed composition downstream of a reservoir: grain resistance, riverbed form resistance, and integrated resistance. Integrated resistance comprises grain resistance and riverbed form resistance (Einstein, 1950), where riverbed form resistance was calculated by Vanoni and Hwang (1967), Alam and Kennedy (1969), Van Rijn (1984), and Wu and Wang (1999). Zhou et al. (2018) used fractal dimensions to measure riverbed deformation downstream of a reservoir and analyzed the relationship between the fractal dimension of the riverbed surface and the riverbed form resistance. Determining riverbed form resistance is mainly applicable to sandy riverbeds with stable bed load gradation and a high degree of riverbed deformation. For sandy gravel riverbeds experiencing a significant coarsening of bed load gradation, changes in grain resistance need to be specifically studied.
There are many studies on grain resistance (Chien and Wan, 1999), most of which first require a relationship to be established between the selected characteristic grain size and roughness. These studies differ in terms of the characteristic grain size or mathematical expression of the characteristic grain size selected and are generally suitable for gravel riverbeds. However, the calculation of grain resistance and change in resistance during riverbed coarsening for sandy gravel riverbeds with wider gradation is problematic. Many researchers have explored the coarsening process and the water flow responses of the sandy gravel riverbed as a result of this process. Lee and Odgaard (1986) tracked the time for the development of coarsening and applied the mixed layer model to establish a numerical model of change in moving sediment and their corresponding composition over time. Borah (1989) proposed the use of the water depth, energy gradient, and friction velocity to calculate the minimum coarse grain size, obtaining an equation to determine the scour depth. Nicola and Massimo (2003) found that bed sediment does not need to be covered by a layer of coarse grains to evaluate roughness through physical tests. Ferro and Giordano (1991) conducted experiments to determine Manning’s roughness coefficient of a sandy gravel riverbed and proposed a calculation method. Afzalimehr and Anctil (1998) postulated that factors affecting the resistance coefficient included roughness, Froude number (Fr), bed load activity parameters, and cross-sectional morphology. Based on the quantitative indicators of these factors, a semilogarithmic formula for the integrated resistance coefficient (f) was established for a gravel riverbed.
Evidently, the bed load coarsening process and its accurate measurement must be considered in research on the resistance of sandy gravel riverbed downstream of reservoirs that are experiencing coarsening. In these instances, the use a single characteristic grain size is insufficient; the complexity of the entire grading curve needs to be measured. Fractal dimensions are widely used to quantify the complexity of curves (Hyslip and Vallejo, 1997). Tyler and Wheatcraft (1992) found that compared with the number distribution of different particle sizes, the mass-based approach to estimate the fractal dimension of the particle-size distribution is less sensitive to the assumed grain density and characteristic size. Therefore, the mass fractal dimension (Dm) is more applicable for analyzing the soil particle-size distribution. Liu et al. (2015) applied the fractal scaling theory to establish a relationship between the fractal dimension and total soil phosphorous. Based on the observed data, Ni et al. (2013) analyzed the fractal dimension for a river. Tian et al. (2013) compared the use of traditional methods and the fractal dimension method for river pattern discrimination in the lower Yellow River. Wang et al. (2018) used the fractal dimension to analyze the spatial and temporal variability of runoff in the Weihe River basin.
This study utilized the generalized flume test to investigate the scouring and coarsening process and the subsequent water flow changes of sandy gravel riverbeds. The degree of riverbed coarsening was quantified using the fractal dimension and characteristic grain size. Based on the characteristics of a coarsened riverbed, a suitable fractal dimension expression to analyze the bed sand grain-size distribution was identified. The relationship between it and the adjusted grain resistance was established; this can greatly assist in calculating resistance changes in sandy gravel-bed river reaches downstream of a reservoir, enabling the prediction of their effects on aquatic habitat.
A straight flume was used to simulate riverbed scouring and coarsening. The flume dimensions were 40 m (length) by 2.4 m (width) by 1 m (height), with a 1.5‰ slope at the bottom, as shown in Figure 1. Alternate bars are the main features in the straight channel due to the large-scale turbulent structure of the natural river (Matthes, 1947; Ikeda and Parker, 2013). Based on the morphology of straight rivers, the experiment was designed as a straight model with a single bar and two alternate bars. The shape of the bars was generalized according to the bars in the Yichang–Yunchi Reach, the straight channel downstream of the Three Gorges Dam. Table 1 provides the size of the bars in the Yichang–Yunchi Reach. The maximum length and width at the top were 2.72 and 0.35 m, respectively. The experimental section length was 20 m, and the flume width was 2.4 m. Then, the relative width and length of the bars were 0.15 and 0.14, which were equal to the average value of the bars in the Yichang–Yunchi Reach. The bars were 13 cm in height, with a slope of 1:2.5 (underwater repose angle of sediment). The maximum length and width at the bottom of the bars were 3.81 and 0.7 m, respectively.
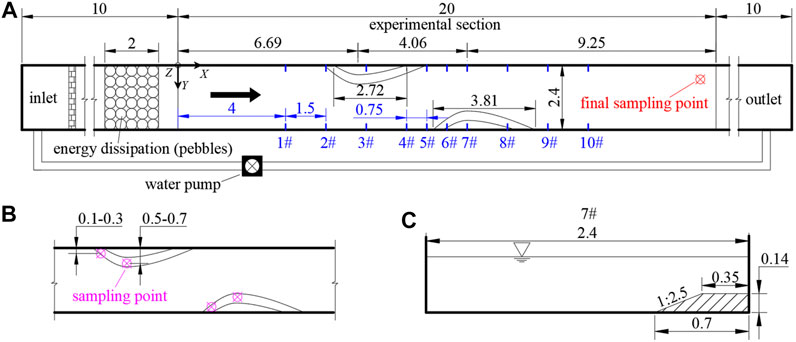
FIGURE 1. Plane morphology and arrangement of cross sections to measure the test flume. (A) Plan view of the experimental setup. (B) Bed load sampling points around the bars. (C) Geometry of 7# cross section (unit: m).
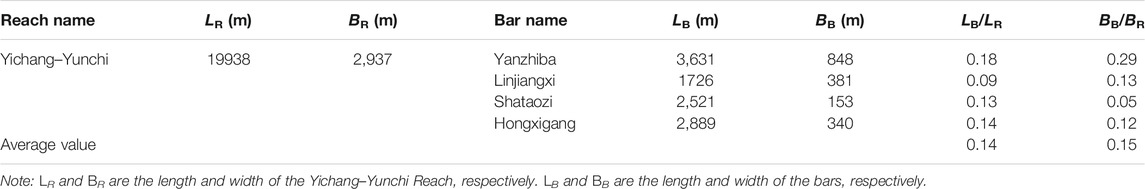
TABLE 1. Size of the bars in the Yichang–Yunchi Reach.
The alternate-bar wavelength is crudely proportional to the channel width, and the relation is written as follows (Ikeda, 1984):
in which
The spacing between the widest position of 2 bars was 4.06 m in the flow direction. Then, the alternate-bar wavelength was 8.12 m. According to Eq. 1,
The bed load used in the experimental design had grain sizes of 0.1–22 mm. This was based on bed load measurements from a sandy gravel-bed downstream of the Three Gorges Dam on the Yangtze River. This bed load was composed of natural yellow sand and gravel, which were mixed to form three sets of sandy gravel with a continuous and wide range of gradation. Figure 2 illustrates the initial bed load gradation used in the test. Based on the different sand proportions (<1 mm) in the sandy gravel, three sets of gravel were prepared: grain size set A, grain size set B, and grain size set C, with sand contents of 30, 42, and 55%, respectively. The characteristic grain size parameters of the bed load used in the experiment are shown in Table 2. The median grain size of the bed load ranged from 0.9 to 6 mm. The heterogeneous coefficient of bed load grain sizes ranged from 2.09 to 4.32, where the maximum kurtosis coefficient of the bed load in set A was 0.38, and the minimum kurtosis coefficient of the bed load in set C was 0.07.
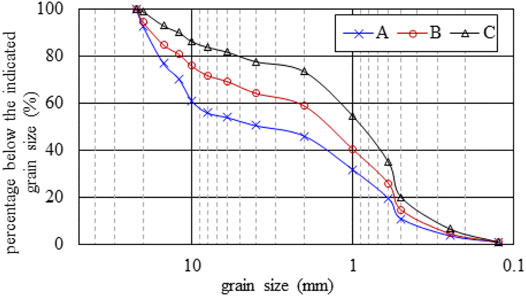
FIGURE 2. Grading curves of the sediment samples from the flume tests.
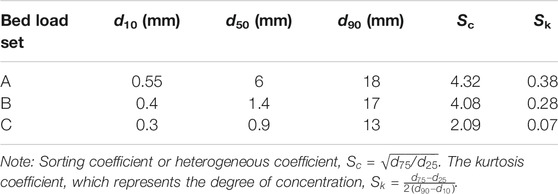
TABLE 2. Parameters related to the sediment grain size characteristics used in the test.
The flume test was mainly used to evaluate the flow structure and riverbed evolution of different bed load compositions in straight river reaches under scouring conditions. The same working conditions were used for the bar arrangement and flow-depth conditions. These conditions were used to conduct the flow characteristic test with a clear-water scouring test for comparison; details are provided in Table 3.
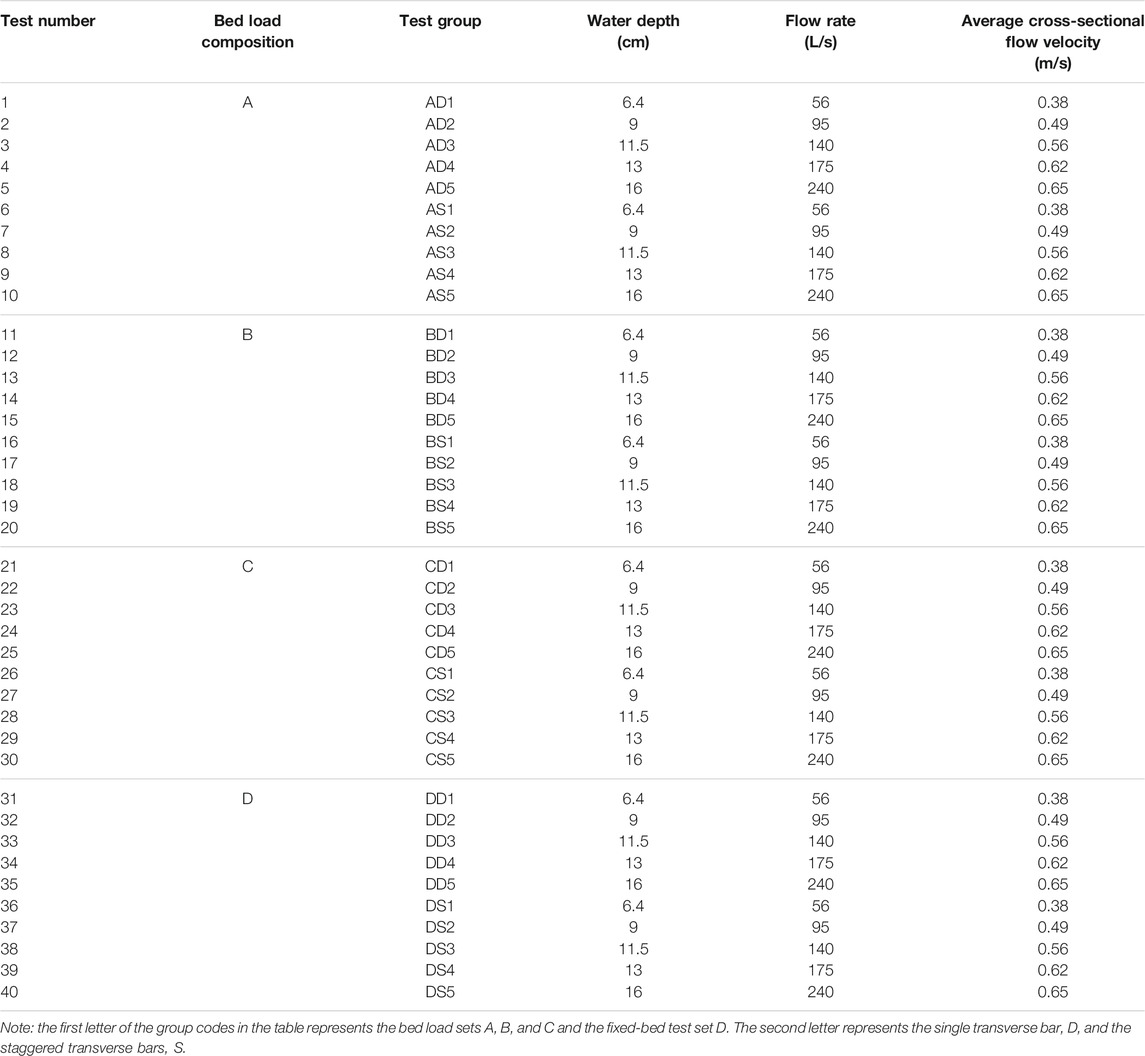
TABLE 3. Conditions used in the flume test.
Following the commencement of the test, clear-water scouring was carried out for 8–30 h, during which the water level and topography changes were measured; the bed load was evaluated at a fixed point to measure the gradation every 2 h.
During the coarsening of the sandy gravel riverbed, grain resistance is the most important factor for studying the flow resistance. This refers to the resistance when the bed surface remains flat when flow is not influenced by the channel borders and is closely related to the size and gradation of bed load grains.
Einstein’s logarithmic velocity distribution formula is based on reasonable theoretical derivation and suitable to the smooth region, transition region, and roughness region of turbulent flow (Einstein and EI-Samni, 1949). The formula was widely used to describe the flow velocity distribution in open channels and to calculate the grain resistance (Qian and Wan, 1983; Wright and Parker, 2003; Chen and Huang, 2007). Thus, grain resistance was calculated using Einstein’s logarithmic formula:
where U is the average cross-sectional flow velocity; U*b is the friction velocity of the grain; Rb is the hydraulic radius;
By converting Eqs. 3 and 4, the resistance equation may be obtained as the ratio of the average cross-sectional flow velocity to the friction velocity of a grain. This may be converted into an expression related to nb:
Combining Eq. 2 with Eq. 5, it yields
This test consisted of the clear-water scouring of sandy gravel, wherein flow with a low sand content was used. Based on the outcomes from Meyer-peter and Miller (1948), the equivalent roughness of the grains was determined as
Fractal theory provides an effective tool for describing complex structures and irregular spatial and morphological features in nature. Fractal scaling shows that, across a wide range of scales, the soil exhibits self-similarity. Dm is one of the fractal concepts to particle-size distributions based on the fragmentation model of Turcotte (1986). The fragmentation model does not lead to a geometrical fractal with the fractal dimensions confined between Euclidian dimensions. The sorting of particles by size in the fragmentation model results in fractal dimensions ranging theoretically between the limits of 0 and 3 (Bittelli et al., 1999). Tyler and Wheatcraft (1992) developed Eq. 7, relating mass with the fractal dimension:
where
Thus, the total mass of each grain size (
Eq. 7 can be normalized by Eq. 8 to yield
The surface of a sandy gravel riverbed is also a system with fractal features. Dm was used to describe the bed load gradation. This was based on the coarsened riverbed surface morphology of waves and patterns that appear after the scouring and coarsening of the sandy gravel riverbed and the similarity between the coarsened sand gradation and the grain size distribution of soil particles.
According to Eq. 9, Dm was calculated using three steps:
1) The upper and lower limits of intervals between each grain-size fraction were calculated to obtain the average grain size
2) The cumulative mass of grains with grain sizes smaller than that of the representative grain sizes of each grain-size fraction interval was counted and converted to logarithmic form.
3) The slope of the fitted correlation line was obtained (i.e.,
During this test, a fixed sampling point was set at the end of the gravel-covered section (Figure 1A). Bed load samples were collected from this point at regular intervals during the scouring process to obtain the grading curves; these were represented by test groups AD5, BD5, and CD5, as shown in Figure 3.
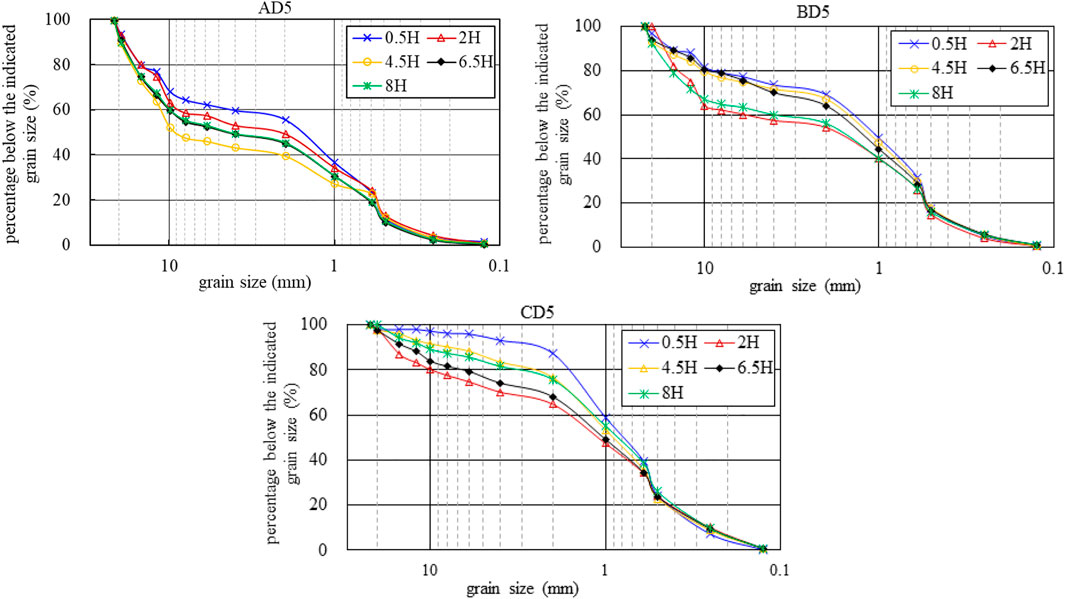
FIGURE 3. Grading curves of the fixed-point bed load for AD5, BD5, and CD5 for different scouring durations.
Figure 3 shows that the grading curves of the three bed load sets with different scouring durations were similar in shape. As scouring duration increased, the continuous grading curve developed a discontinuous gradation. During scouring, the adjusted and concentrated grain size range of the bed load was 0.6–10 mm. In the first 2 h, there was a severe loss of medium-sized grains; this was then slightly replenished after 4.5 h. With an increase in scouring duration, 0.5 → 2 → 4.5 → 6.5 → 8 h, there were variations in the range of bed load adjustment for the three bed load sets at the end of the gravel-covered section. These variations occurred due to differences between the scouring volume and upstream supply of sediments. The largest change in the grain size of the set A bed load with a sand content of 30% (with 1 mm as the boundary) was d50, and it changed as follows: 1.7 → 2 → 9 → 5 → 5 mm. The greatest change in the grain size of the set B bed load with a sand content of 42% was d60, and it changed as follows: 1.5 → 7 → 1.6 → 1.8 → 5 mm. The greatest change in the grain size of the set C bed load with a sand content of 55% was d90, and it changed as follows: 2.4 → 17 → 10 → 15 → 12 mm. This indicates that a greater initial sand content during scouring leads to greater adjustments in bed load gradation and a higher final grain size. There was also a tendency for the grain size to first increase and then decrease.
During the test, scouring and coarsening were significant at the beginning and central parts of the bars. Bed load samples were collected at 10–30 cm and 50–70 cm from the starting point (Figure 1B), respectively, after scouring was completed. As the gradation curves obtained for the beginning and central parts of the bar of each test group were similar, the cross-section of the upstream bar was selected to ananlyse; the three sets of gradation curves are shown in Figure 4.
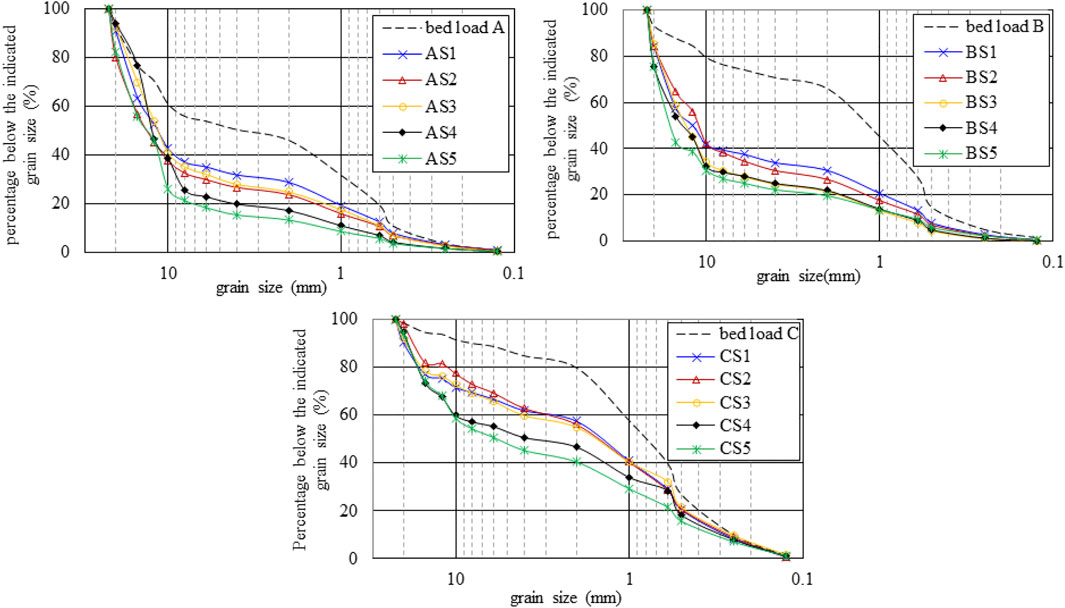
FIGURE 4. Grading curves of the bed load for sets (A), (B), and (C) from the beginning part of the bars.
Figure 4 shows that the bed load coarsening effect in the beginning part of the bar was significant, with a considerable increase in the median grain size. With an increase in scouring flow velocity, the coarsening effect became more evident, and the characteristic grain size (e.g., d50) increased significantly. The sand content of the set A bed load with a grain size of 0.5–10 mm reduced from 50 to 20%, that of the set B bed load reduced from 65 to 25%, and that of the set C bed load reduced from 62 to 42%. This sand content reduction was the greatest in the set B bed load, which had a moderate sand content in this grain size range. Correspondingly, the degree of coarsening was the greatest in set B, followed by that in set C; it was the lowest in set A.
Using Eq. 9 and the raw data of the more representative grading curves of the bed load at the depth of the 10# cross section in Figure 1 after the completion of scouring of various groups, line fitting was conducted with AD1, BD1, and CD1 as representatives, as shown in Figure 5, where the horizontal coordinate x is
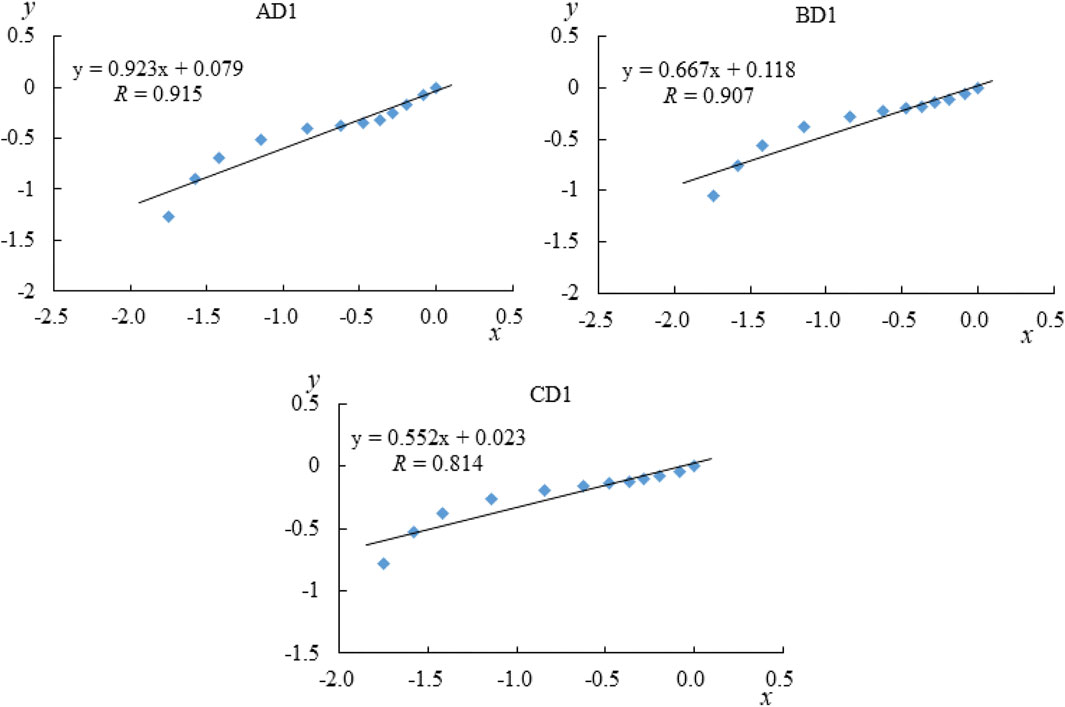
FIGURE 5. Mass fractal dimension of AD1, BD1, and CD1.
The heterogeneous coefficients Sc, correlation coefficients R and 3-Dm, and Dm were calculated for each test group and the original bed load, as shown in Tables 4–6. From Tables 4–6, we can see that sets A, B, and C have a good linear fit, with the correlation coefficients of sets A and B above 0.9 and the average value of the correlation coefficient of set C above 0.85. This indicates that Dm has statistical and fractal characteristics and can better express the distribution of the bed load grain size. Dm, of the three groups of the original bed load, was larger than that of the test groups. This indicated that the content of bed load of medium grain size decreased after bed load coarsening. The bed load transitioned from continuous gradation to discontinuous gradation, resulting in a decrease in Dm. There were significant differences in the Dm of the three sets of bed load. From the slope of the fitted line, it was found that Dm of set A ranged from 1.762 to 2.292, that of set B ranged from 1.940 to 2.487, and that of set C ranged from 2.105 to 2.647. Dm tended to decrease with increasing flow velocity when a single factor was taken into consideration. Dm was positively correlated with the sand content of set C with an initial sand content of 55% which had the largest Dm, followed by set B with 42% sand content, and the smallest was set A with 30% sand content. Dm of the alternate bars was smaller than that of the single bar.
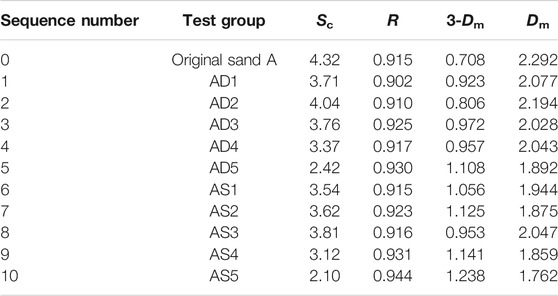
TABLE 4. Mass fractal dimensions for bed load set A.
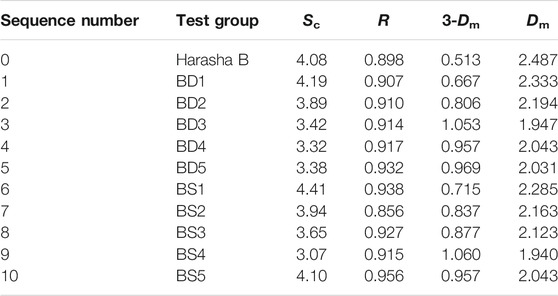
TABLE 5. Mass fractal dimensions for bed load set B.
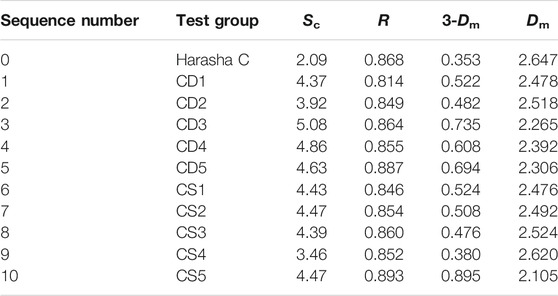
TABLE 6. Mass fractal dimensions for bed load set C.
The water level was analyzed after the scouring experiment was completed; it yielded the overall water-surface slopes, reflecting the entire river section where water level measurements were conducted, as shown in Table 7.
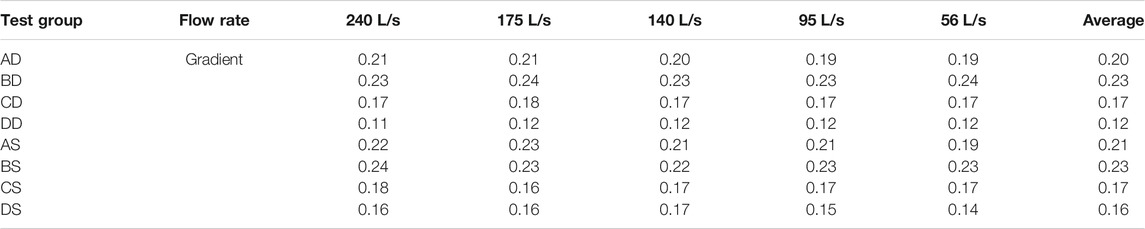
TABLE 7. Overall water-surface slope of various test groups (%).
Table 7 demonstrates that, due to the uneven bed scouring upstream and downstream, set B with the uniform bed load gradation had the greatest water-surface slope as the scouring degree was higher downstream than that upstream. The slope of set A with the smallest proportion of sand in the bed load was slightly lower than that of set B, followed by that of set C; the slope of the fixed bed of set D was the lowest. In summary, the bed load uniformity was positively correlated with water level slope and head loss. This also means that the total water-surface slopes of the same riverbed after final coarsening under different conditions are similar. The water-surface slope of the channel with alternate bars was higher than that of the channel with a single bar under the same riverbed conditions.
The change in the variation of water turbulence intensity with different bed load compositions was analyzed. Based on this, the relationship between turbulence intensity in the x direction (water flow direction), y direction (horizontal), and z direction (vertical), and the relative water depths could be plotted. This was carried out with a line 1.2 m from the starting point and perpendicular to the 10# cross section in AD5, BD5, CD5, and DD5, as shown in Figure 6.
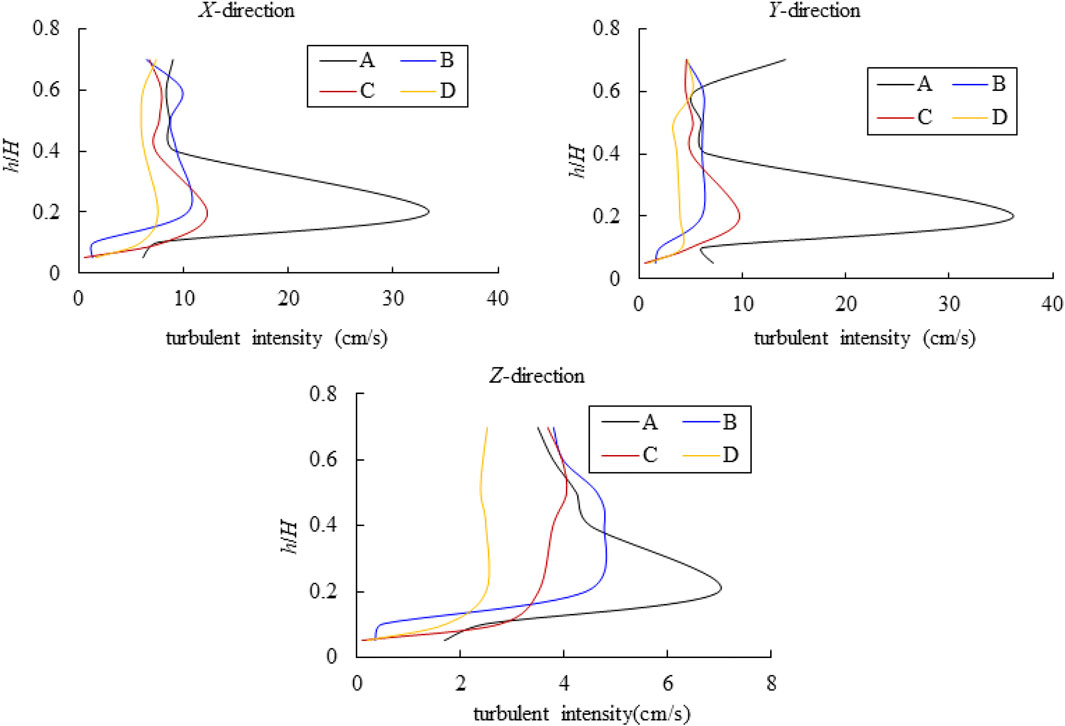
FIGURE 6. Variation in turbulence intensity with water depth for different bed load compositions in X, Y, and Z directions.
Figure 6 shows that the turbulence intensity distribution at different water depths in the x direction, y direction, and z direction were similar; the maximum occurred at a relative water depth of 0.2. The average turbulence intensity on the same perpendicular line was the highest for set A, followed by that of set C and set B; set D, with a fixed bed, had the lowest turbulence intensity. Bed load continuity and uniformity differed after scouring. Set A became discontinuous after bed load coarsening. The uniformity of the bed load for set C was lower than that of set B after coarsening; this indicates that the turbulence intensity after scouring was closely related to bed roughness and bed load composition.
Based on Eqs. 3 and 4, Rb and nb, which correspond to the grain resistance of each test group, were calculated iteratively; the grain resistance calculations of various test groups are shown in Table 8. Here, J is the ratio of the water level of probes at the upstream and downstream ends to the distance between them. d50 is a representative median grain size for the grading curve of the bed load at the depth of the 10# cross section after scouring in each group.
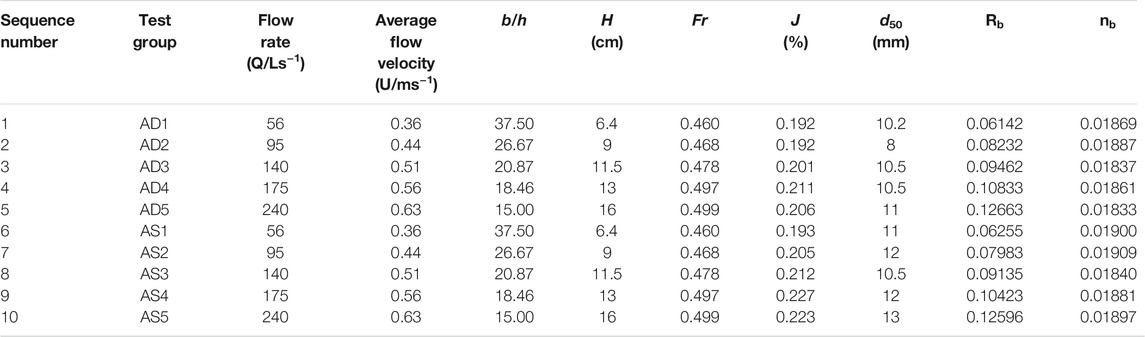
TABLE 8. Grain resistance calculations for set A.
Tables 8–10 show the presence of a pattern in terms of the resistance coefficient corresponding to the grain resistance of sandy gravel: nb interval of set A was 0.01754–0.01897, that of set B was 0.01332–0.01849, and that of set C was 0.01267–0.01778; this reflects the negative correlation between the grain resistance of each bed load set and the sand content. Due to the difference in the grain size adjustment range of bed load scouring, the main influencing factor of grain resistance, there were differences in d50 after bed load coarsening. The lower the sand content, the higher the d50 after scouring. With the same bed morphology and bed load composition, the average cross-sectional flow velocity increased, along with the grain resistance. With the same flow conditions and bed load composition, the grain resistance of the alternate bars was greater than that of the single bar.
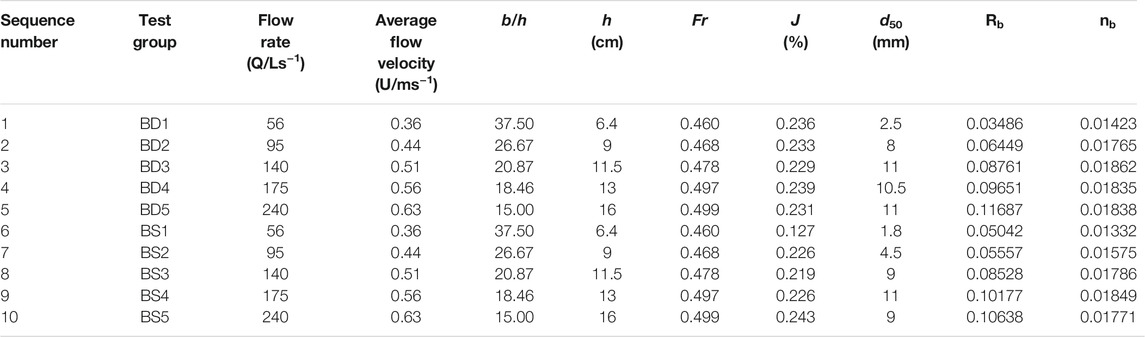
TABLE 9. Grain resistance calculations for set B.
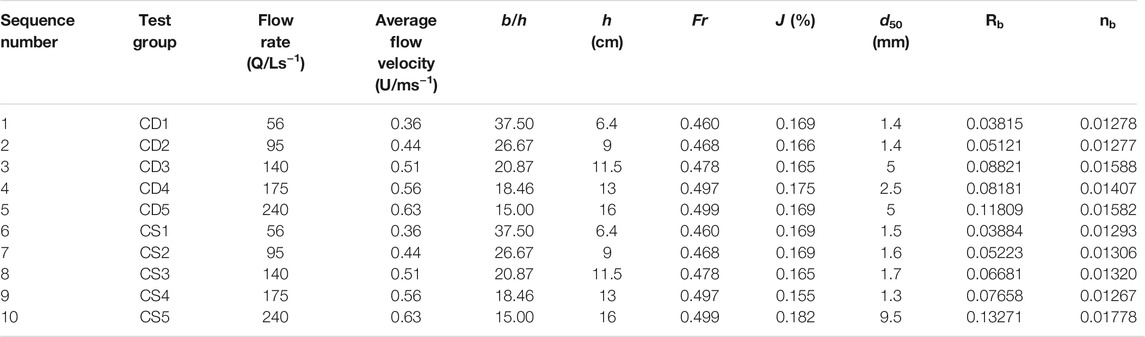
TABLE 10. Grain resistance calculations for set C.
The relationship between grain resistance and Dm is explored in Figure 7; grain resistance was negatively correlated with Dm. To explore the relationship between
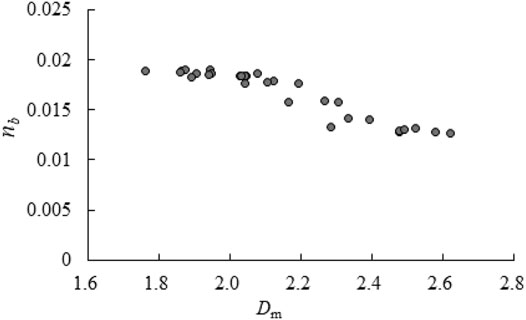
FIGURE 7. Relationship between Dm and nb.
Coefficient K in the equation was determined using the experimental data, and its value fluctuated at approximately 0.034. Using Eq. 10,
where
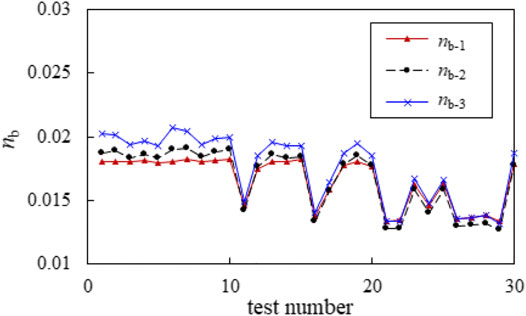
FIGURE 8. Comparison of grain resistance with different equations.
Calculating the grain resistance using Dm is advantageous for two key reasons: 1) the entire bed load gradation data is used, as opposed to just a single representative grain size (such as d50); and 2) the determination of grain resistance from bed load composition is considered to be closer to the actual conditions. The proposed expression to calculate grain resistance is
With known bed load gradation, the grain resistance can be directly derived from Fr, which is simpler and clearer compared to previous methods of calculating grain resistance.
Calculation using Eq. 10 still requires Fr and calibration by model tests. As such, the above parameters need to be converted from known parameters when calculating the value of change. As the initial grain resistance, nb–0 is already known and may be directly calculated by Einstein’s formula if flow data is known; the ratio of grain resistance after bed load scouring to the initial grain resistance (i.e., the rate of change) is
The corresponding adjusted grain resistance is
where
By contrasting the scouring and coarsening of different riverbed compositions, the coarsening degree and the change in integrated resistance were observed to be the greatest for the bed load with a moderate sand content. The degree of coarsening in set A was low because it contained more gravel and had a coarser bed load and greater resistance, while that of set C was less than that of set B. This may be due to the shielding effect of gravel on the larger proportion of finer sand. However, sediments with sizes of 0.5–10 mm, particularly those of 0.5–2 mm, were the easiest to wash away in the tests of all groups; these were easy to move and difficult to preserve.
The heterogeneous degree of sediment coarsening was expressed by the change in a particular characteristic grain size, which was clearly insufficient. The overall gradation change is essential for determining the change in grain resistance. The use of the mass fractal dimension to measure the gradation change was effective for this calculation. The mass fractal dimension is related to the heterogeneous coefficient and covered more information than the heterogeneous coefficient. As such, the use of the mass fractal dimension to measure gradation change represented an advancement of grading analysis. Using the proposed formula,
The formula for adjusted grain resistance may be used to determine the new grain resistance following bed surface evolution; this can inform the selection of roughness for model simulations.
The original contributions presented in the study are included in the article/Supplementary Material. Further inquiries can be directed to the corresponding authors.
YZ wrote the original draft (lead); JL took part in formal analysis (lead) and supervision (lead); ZJ, YL, YG, and PC reviewed and edited the manuscript (equal).
This study was supported by the National Key Research and Development of China (Grant no. 2019YFC1510704) and the National Natural Science Foundation of China (Grant nos. 51579014 and 91647117) and the Central Public-interest Scientific Institution Basal Research Fund (Grant nos. CKSF2021743/HL and CKSF2021485/HL) and the Scientific Research Project of China Three Gorges Corporation (Grant no. 0704167).
The authors declare that the research was conducted in the absence of any commercial or financial relationships that could be construed as a potential conflict of interest.
All claims expressed in this article are solely those of the authors and do not necessarily represent those of their affiliated organizations, or those of the publisher, the editors, and the reviewers. Any product that may be evaluated in this article, or claim that may be made by its manufacturer, is not guaranteed or endorsed by the publisher.
YZ would like to thank Dr. Ren and other referees for their constructive comments on the earlier version of this paper.
Afzalimehr, H., and Anctil, F. (1998). Estimation of Gravel-Bed River Flow Resistance. J. Hydraulic Eng. 124 (10), 1054–1058. doi:10.1061/(asce)0733-9429(1998)124:10(1054)
Alam, A. M. Z., and Kennedy, J. F. (1969). Friction Factors for Flow in Sand-Bed Channels. J. Hydr. Div. 95 (6), 1973–1992. doi:10.1061/jyceaj.0002200
Bittelli, M., Campbell, G. S., and Flury, M. (1999). Characterization of Particle-Size Distribution in Soils With a Fragmentation Model. Soil Sci. Soc. Am. J. 63 (4), 782–788. doi:10.2136/sssaj1999.634782x
Borah, D. K. (1989). Scour‐Depth Prediction Under Armoring Conditions. J. Hydraulic Eng. 115 (10), 1421–1425. doi:10.1061/(asce)0733-9429(1989)115:10(1421)
Chen, X. Q., and Huang, C. A. (2007). A Study on the Sand-Grain Resistance in Movable Bed. J. Suzhou Univ. 27 (6), 53–57. doi:10.3969/j.issn.1003-1243.2008.01.015
Einstein, H. A., and El-Samni, E.-S. A. (1949). Hydrodynamic Forces on a Rough wall. Rev. Mod. Phys. 21 (3), 520–524. doi:10.1103/revmodphys.21.520
Einstein, H. A. (1950). The Bed Load Function for Sediment Transport in Open Channel Flows. Tech. Bull. 1026, 7–13. doi:10.22004/ag.econ.156389
Ferguson, R. (2007). Flow Resistance Equations for Gravel- and Boulder-bed Streams[J]. Water Resour. Res. 43, W05427. doi:10.1029/2006wr005422
Ferro, V., and Giordano, G. (1991). Experimental Study of Flow Resistance in Gravel‐Bed Rivers. J. Hydraulic Eng. 117 (10), 1239–1246. doi:10.1061/(asce)0733-9429(1991)117:10(1239)
Hyslip, J. P., and Vallejo, L. E. (1997). Fractal Analysis of the Roughness and Size Distribution of Granular Materials. Eng. Geology. 48 (4), 231–244. doi:10.1016/s0013-7952(97)00046-x
Ikeda, S. (1984). Prediction of Alternate Bar Wavelength and Height. J. Hydraulic Eng. 110 (4), 371–386. doi:10.1061/(asce)0733-9429(1984)110:4(371)
Lee, H. Y., and Odgaard, A. J. (1986). Simulation of Bed Armoring in Alluvial Channels. J. Hydraulic Eng. 112 (9), 794–801. doi:10.1061/(asce)0733-9429(1986)112:9(794)
Liu, X., Li, Z., and Li, P. (2015). Particle Fractal Dimension and Total Phosphorus of Soil in a Typical Watershed of Yangtze River, China. Environ. Earth Sci. 73 (10), 6091–6099. doi:10.1007/s12665-014-3833-1
Matthes, G. H. (1947). Macroturbulence in Natural Stream Flow. Trans. AGU. 28 (2), 255–265. doi:10.1029/tr028i002p00255
Meyer-Peter, E., and Müller, R. (1948). Formulas for Bed-Load transport in IAHSR 2nd Meeting. Int. Assoc. Hydro-environment Eng. Res., 39–64. Available at: https://repository.tudelft.nl/islandora/object/uuid:4fda9b61-be28-4703-ab06-43cdc2a21bd7?collection=re-search.
Ni, Z., Wu, L., and Wang, M. H. (2013). The Fractal Dimension of River Length Based on the Observed Data. J. Appl. Mathematics., 1–9. doi:10.1155/2013/327297
Nicola, S., and Massimo, R. (2003). Morphological Response to River Engineering and Management in Alluvial Channels in Italy. Geomorphology. 50 (4), 307–326. doi:10.1016/S0169-555X(02)00219-2
Tian, S., Wang, W., and Shang, H. (2013). Comparison of Traditional Methods and Fractal Dimension Method in River Pattern Discrimination. Energ. Educ. Sci. Technol. 31 (1), 485–488. doi:10.19026/rjaset.5.4217
Turcotte, D. L. (1986). Fractals and Fragmentation. J. Geophys. Res. 91 (B2), 1921–1926. doi:10.1029/jb091ib02p01921
Tyler, S. W., and Wheatcraft, S. W. (1992). Fractal Scaling of Soil Particle-Size Distributions: Analysis and Limitations. Soil Sci. Soc. America J. 56 (2), 362–369. doi:10.2136/sssaj1992.03615995005600020005x
Van Rijn, L. C. (1984). Sediment Transport, Part I: Bed Load Transport. J. Hydraulic Eng. 110 (10), 1431–1456. doi:10.1061/(asce)0733-9429(1984)110:10(1431)
Vanoni, V. A., and Hwang, L. S. (1967). Relation between Bed Forms and Friction in Streams. J. Hydraulics Division. 93 (3), 121–144. doi:10.1061/JYCEAJ.0001607
Wang, X. J., Jiang, R. G., Xie, J. C., Wang, Y. P., Zhang, Y. J., Wang, J., et al. (2018). Spatiotemporal Variability of Runoff Using Fractal Dimension in the Weihe River Basin. IOP Conf. Ser. Earth Environ. Sci. 191 (1), 012059. doi:10.1088/1755-1315/191/1/012059
Wright, S., and Parker, G. (2003). Grain-Size Specific Suspended Sediment Transport and Flow Resistance in Large Sand-Bed Rivers. Dordrecht, Netherlands: Springer.
Wu, W., and Wang, S. S. Y. (1999). Movable Bed Roughness in Alluvial Rivers. J. Hydraulic Eng. 125 (12), 1309–1312. doi:10.1061/(asce)0733-9429(1999)125:12(1309)
Zhong, L., Xu, G., and Zeng, F. (2013). Fractal Expression of Sand Grain Equivalent Roughness. Adv. Water Sci. 24 (1), 111–117. doi:10.14042/j.cnki.32.1309.2013.01.008
Zhou, Y.-j., Lu, J.-y., Chen, L., and Ren, J. (2018). Bed Roughness Adjustments Determined From Fractal Measurements of River-Bed Morphology. J. Hydrodyn. 30 (5), 882–889. doi:10.1007/s42241-018-0101-y
Keywords: dam, sand pebble, resistance, habitat, riverbed coarsening, flow structure
Citation: Zhou Y, Lu J, Jin Z, Li Y, Gao Y, Liu Y and Chen P (2021) Experimental Study on the Riverbed Coarsening Process and Changes in the Flow Structure and Resistance in the Gravel Riverbed Downstream of Dams. Front. Environ. Sci. 9:611668. doi: 10.3389/fenvs.2021.611668
Received: 29 September 2020; Accepted: 18 August 2021;
Published: 29 September 2021.
Edited by:
HongGuang Sun, Hohai University, ChinaCopyright © 2021 Zhou, Lu, Jin, Li, Gao, Liu and Chen. This is an open-access article distributed under the terms of the Creative Commons Attribution License (CC BY). The use, distribution or reproduction in other forums is permitted, provided the original author(s) and the copyright owner(s) are credited and that the original publication in this journal is cited, in accordance with accepted academic practice. No use, distribution or reproduction is permitted which does not comply with these terms.
*Correspondence: Yinjun Zhou, emhvdXlpbmp1bjExMTRAMTI2LmNvbQ==; Jinyou Lu, bHVqeUBtYWlsLmNyc3JpLmNu
Disclaimer: All claims expressed in this article are solely those of the authors and do not necessarily represent those of their affiliated organizations, or those of the publisher, the editors and the reviewers. Any product that may be evaluated in this article or claim that may be made by its manufacturer is not guaranteed or endorsed by the publisher.
Research integrity at Frontiers
Learn more about the work of our research integrity team to safeguard the quality of each article we publish.