 Yanan Sun
 Fangrong Ren
 Jiawei Liu
 Naixin Shi
 Haofei Wang1
94% of researchers rate our articles as excellent or good
Learn more about the work of our research integrity team to safeguard the quality of each article we publish.
Find out more
ORIGINAL RESEARCH article
Front. Environ. Sci. , 15 February 2021
Sec. Water and Wastewater Management
Volume 9 - 2021 | https://doi.org/10.3389/fenvs.2021.585718
Under the comprehensive reform of its household registration system, China has experienced the largest and fastest urbanization process in the world since its establishment 70 years ago, but with the deepening of urbanization, cities are facing greater environmental challenges. As the total amount of urban wastewater discharge increases, the condition of water pollution nationwide has become more severe. Thus, through the use of dynamic exogenous variable data envelopment analysis (DEA) this research selects the employment population and input cost of wastewater treatment in 31 provinces of China from 2013 to 2017 as input indicators, gross domestic product (GDP), wastewater production, and chemical oxygen demand (COD) in wastewater as output indicators, fixed assets as a carry-over variable, and urbanization level as an important influencing factor to evaluate and compare wastewater treatment efficiency in the northeast, central, western, and eastern regions with and without the influence of the level of urbanization. Findings show that the total efficiency score under the influence of the level of urbanization is generally higher than that without such an influence. The level of urbanization has a significantly positive effect on wastewater output efficiency in various regions, whereas wastewater output efficiency presents a downward trend from 2013 to 2017. The overall level of chemical oxygen demand efficiency is weak. When affected by the level of urbanization, the scores of COD efficiency in the eastern, northeast, and central regions have increased significantly. Finally, there is a large inter-provincial gap in the level of urbanization in the western region, while the level of urbanization has no significant impact on COD efficiency.
Following the comprehensive reform of China’s household registration system, more than 90 million people from its agricultural regions have settled in cities and towns across the nation. Since the founding of modern-day China 70 years ago, China has experienced the largest and fastest urbanization process in the history of the world. Its urbanization rate increased from 10.64% at the end of 1949 to 59.58% at the end of 2018, with an average annual increase of 0.69%. In 2019, China’s urban permanent population stood at 840 million, and the number of cities above county level is now 672. During the 38 years from 1981 to 2019, China’s built up its urban areas by 7.1 times, from 7,438 square kilometers to 60,312 square kilometers.1
With the acceleration of urbanization, the country’s urban economy has also risen rapidly. In 1988, the total GDP of all urban areas was only 702.5 billion RMB, or about half of national GDP, but nearly 30 years later in 2017, the total GDP of cities above the prefecture level alone hit 52.1 trillion RMB, accounting for 63.0% of national GDP. In fact, the aggregate GDP of four cities alone, Shanghai, Beijing, Shenzhen, and Guangzhou, exceeded two trillion RMB.2
With this expansion of urbanization, cities are now facing great environmental challenges, as the total amount of urban wastewater discharge increases and the condition of water pollution in China becomes more severe. From the perspective of wastewater discharge, in 2007–2019 alone, wastewater discharge nationwide increased 39.6% from 55.68 billion tons to 77.74 billion tons.3 The discharge of urban domestic sewage is also rising year by year, as evidenced by domestic sewage accounting for 76.48% of total wastewater in 2017.4 The greater amount of domestic sewage discharge has an increasingly significant impact on surface water and groundwater quality.
From the perspective of China’s urbanization process and relevant policies, the 18th National Congress of the Communist Party of China in 2012 proposed “a new road of intensive, intelligent, green and low-carbon urbanization,” marking that the nation’s urbanization has entered a new stage of development. In 2015, the China government issued “the water pollution prevention plan of action.” In the 13th Five-Year Plan in 2016, higher requirements were put forward for China’s water management system and water management capacity. In the 13th Five-Year Plan for Water Conservancy Reform and Development, the main goal is to comprehensively improve water security, build a water-conserving society, reform and innovate water conservancy development systems and mechanisms, and strengthen water ecological governance and protection. Therefore, the research period of 2013–2017 selected in this paper has a strong correlation with the acceleration of China’s urbanization process and the strengthening of its water pollution control. Will wastewater treatment efficiency be affected by urbanization under the policy of implementing a new urbanization path in China? This research period should represent urbanization as an external variable and allow us to compare the wastewater treatment efficiency before and after urbanization became the norm.
The existing literature presents current related research directions in three categories: 1) the impacts and problems of the urbanization process; 2) research on wastewater treatment efficiency; and 3) applying DEA to evaluate urbanization efficiency. We note that studies generally focus on problems during the process of urbanization and efficiency analysis, with few taking urbanization as an exogenous variable. Therefore, the contributions of this paper are as follows: 1) Focus on wastewater discharge during the process of urbanization and take the level of urbanization as an exogenous variable to measure the change of wastewater discharge and treatment efficiency after adding the urbanization level index. 2) Use the dynamic DEA model to analyze the time series changes of wastewater discharge and treatment efficiency during the process of urbanization. 3) Add unexpected output in model construction to present the adverse effects of wastewater pollution more clearly.
The remainder of this paper is organized as follows. Following the introduction, we have 2. Literature Review; 3. Research Method; 4. Empirical Results and Discussion; and 5. Conclusion.
Urbanization in China involves a unique process due to its household registration (hukou) system Wang et al. (2015), and many scholars have studied the problems that arise from this process. Urbanization brings problems such as waste and exhaustion of resources, a decline of quality of life and environmental capacity, and an imbalance between urban and rural development Zhang (2011). Based on the status quo of urbanization in Guangxi Province, Zhang et al. (2015) analyzed environmental pollution during the development of urbanization, the lagging construction of environmental protection facilities, and the lack of an evaluation system. Zhao et al. (2018) studied the growth pattern of household pollution emissions for the urbanization process of the Taihu Lake area5 in china, and the results showed that household pollution emissions are affected by urbanization factors. Lishan et al. (2018) analyzed the rapid growth of sludge production based on the life cycle method under the condition of a continuous increase in the urbanization level and evaluated the environmental and economic performances of a new emerging technology (hydraulic hydrology technology, HPT). The literature has shown that the development of urbanization brings about environmental pollution and a wastage of resources.
Some scholars also conducted empirical studies on the relationship between urbanization and environmental pollution and found that urbanization is indeed one of the factors that aggravate environmental pollution. Yuanhong et al. (2018) noted that the urbanization rate has a significant impact on the efficiency of agricultural water use, whether it is high or not, and the effect is most significant when the urbanization rate is high or the society pays more attention to urban environmental remediation. China’s urbanization rate is decreasing from east to west, highlighting the huge differences between the provinces in the upper, middle, and lower reaches of the Yangtze River (Jin et al., 2018). Liu et al. (2019b) constructed an urbanization coordination evaluation index system based on the actual development of Tianjin, showing results that the urbanization level of Tianjin is relatively satisfactory. Liang et al. (2019) used the analytic hierarchy process, entropy method, and minimum information entropy principle to establish urbanization and environmental pollution indicators. The conclusion is that urbanization will aggravate environmental pollution, and that the impact of the urbanization rate on environmental pollution is cyclical. The current research on urbanization mainly has focused on the problems that have emerged during the process of urbanization, the spatial distribution law of urbanization, and the causal relationship between urbanization and environment pollution.
The DEA method is widely used among research on wastewater treatment efficiency and urbanization efficiency. For example, Deng et al. (2016) employed the SBM (slack based measure) DEA model to measure water use efficiency of 31 provinces in China in 2004–2013 and discussed the factors affecting water use efficiency through a panel data model. Guerrini et al. (2017) evaluated the efficiency of 139 wastewater treatment plants in Tuscan (a region in Italy) and concluded that larger-scale and higher capacity utilization can improve cost efficiency. Zhan et al. (2017) used 5 input and 3 output data variables as well as BCC (Banker, Charnes and Cooper) and CCR (Charnes, Cooper and Rhodes) models to conclude that the urbanization efficiency of 11 out of 17 districts and counties in Shanghai is in a downward trend. In addition, many researches also utilized different DEA models to study wastewater treatment and urbanization efficiency in related areas (Jia and Liu, 2012; Guo, 2017; An et al., 2018; Feng et al., 2019; Wu et al., 2019). However, these research findings are separate studies of wastewater treatment and urbanization efficiencies without considering the correlation between the two efficiencies.
The Stage DEA model and Network DEA model considering the input-output intermediate process are also used in wastewater and urbanization. Li et al. (2018) took provincial panel data of 2006–2015 in China as an example and used the two-stage SBM-DEA model to test the efficiency of water and sewage treatment systems. Zhang et al. (2019) applied the dynamic SBM model to evaluate the wastewater resources of 30 regions in China and concluded that many regions with low/medium/high industrial production have not achieved a balance between industrial output and industrial wastewater treatment. Liu et al. (2019a) selected panel data of 30 provinces in China from 2011 to 2015, established the two-stage DEA model and regression model based on the Simar-Wilson method, and revealed the impact of urbanization on industrial water efficiency. Their results showed that industrial water use efficiency in China fluctuated slightly from 2011 to 2015, and efficiency has not improved significantly. Some research has adopted DEA combined with other empirical methods, such as (D'Inverno et al., 2018; Hu et al., 2018; Ren et al., 2018; Wang et al., 2018; Zhou et al., 2018), but an external index such as urbanization is rarely selected to compare the changes of its influence on efficiency after it is added into the evaluation system.
To sum up, most scholars have studied urbanization and the efficiency of wastewater pollution treatment from multiple perspectives. Moreover, most studies on the efficiency of wastewater pollution treatment consider the influence of economic development, population, industrialization, and other factors on the efficiency of wastewater treatment, yet there is no relevant research on an exogenous variable DEA model to compare wastewater treatment with and without urbanization efficiency. The research methods and ideas in this paper offer great innovative significance for current issues related to urbanization level and wastewater treatment.
The Dynamic DEA (D-DEA) method was initiated by Klopp (1985), who proposed a window analysis of the D-DEA approach. Färe et al. (1994) followed up and proposed the Malmquist index (MPI), but did not analyze the interaction effect for two carry-over periods. In order to deal with the issue of efficiency for multiple carry-over periods, Färe and Grosskopf (1996) inputted the effect of internal linkages into D-DEA. Studies that ensued include Bogetoft et al. (2008), (Nemoto and Goto, 1999; Nemoto and Goto, 2003), Sueyoshi and Sekitani (2005), etc.
Tone and Tsutsui (2010) extended the topic to the Slack-Based Measures (SBM) D-DEA model and then proposed the weighted SBM D-DEA model. They used carry-over as the dynamic period link and classified inputs and outputs as desirable (good), undesirable (bad), discretionary (free), non-discretionary (fixed). The D-DEA model is divided into input-oriented, output-oriented, and non-oriented types.
Our study assesses overall efficiency (OE) and term efficiency (TE) via the non-oriented SBM D-DEA approach. Each period has independent input and output in every decision-making unit (DMU), and there is a carry-over link from periods t to t+1 so as to find the change across two periods. This study also considers undesirable output in the dynamic SBM model. The Tone and Tsutsui (2010) dynamic SBM model can be modified to include undesirable output in the Dynamic SBM model. Figure 1 shows the D-DEA structure in this study.
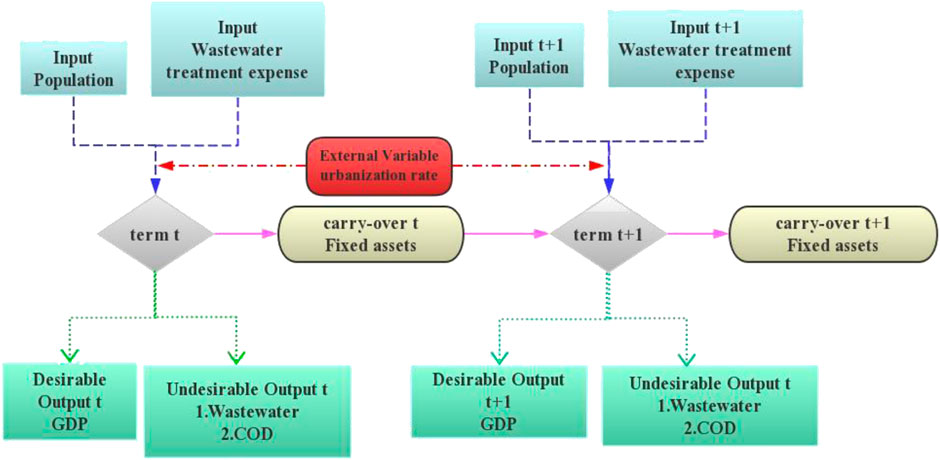
FIGURE 1. Dynamic DEA model.
Suppose the observations make up a (=1 … n)-dimension DMU set in which the DMU under evaluation is represented by and is subject to. The input and output used to compute the efficiency are labeled as m inputs (i = 1 … m) and s outputs, respectively. Let output Y be divided into (Yg, Yb), where Yg is a desirable output, Yb is an undesirable output, and is carried over from period t to period t+1. Here, is an exogenous variable that is outside of a given economic model and often has an impact on the outcome of the model. The following is the non-oriented model:
Equation 2 is the connection equation between periods t and t + 1.
The most efficient solution is
This paper uses panel data from 30 provinces and cities in China in 2013–2017, which cover the eastern, central, western, and northeast regions. The eastern region includes Beijing, Tianjin, Hebei, Shanghai, Jiangsu, Zhejiang, Fujian, Shandong, Guangdong, and Hainan. The central region includes Shanxi, Anhui, Jiangxi, Henan, Hubei, and Hunan. The western region includes Inner Mongolia, Guangxi, Chongqing, Sichuan, Guizhou, Yunnan, Shaanxi, Gansu, Qinghai, Ningxia, and Xinjiang. The northeast region includes Liaoning, Jilin, and Heilongjiang. Data from the years 2013–2017 are collected from the Statistical Yearbook of China and China Environmental and Protection Bureau reports. Table 1 shows all the input and output variables. There are two inputs, three outputs, one external variable, and one carry-over variable.
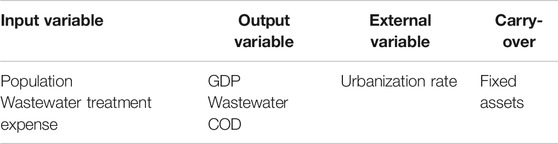
TABLE 1. Input and output variables.
Input variables:
Population: This study takes the total population in each region at the end of each year. Unit: 10,000 persons.
Wastewater treatment expense: Annual investment amount of each district’s wastewater treatment project. Unit: 10,000 RMB.
Output variables:
Desirable output (GDP): Refers to the final result of production activities of all resident units in a region calculated by market price in a year. Unit: 100 million RMB.
Undesirable output (Wastewater): It is the sum of industrial wastewater discharge and domestic sewage discharge. Unit: 10,000 tons.
Undesirable output (COD): The sum of chemical oxygen demand (COD) emissions from industrial wastewater and domestic wastewater. It refers to the amount of oxygen required to oxidize organic pollutants in water with chemical oxidants. In general, oxidizers are used to decompose oxidizable substances (organic matter, nitrite, ferrous salt, sulfide, etc.) in wastewater, and then the consumption of oxygen is calculated according to the number of residual oxidants so as to indicate the content of organic matter in wastewater and to reflect the degree of organic matter pollution in water.
External variable:
Urbanization rate: It is a measure of urbanization and is generally based on demographic indicators, like the proportion of urban population to total population (both agricultural and non-agricultural).
Carry-over:
Fixed assets: The total amount of work done by the whole society in building and purchasing fixed assets and related expenses. Unit: 100 million RMB.
Figure 2 illustrates the changes in various input-output indicators. From 2013 to 2017, the maximum value of population has been growing. The average value is in an overall growth state, but a short decline occurred in 2015–2016. The average value of wastewater treatment cost is in a stable growth state, but the maximum value fluctuates significantly, with 2016 as the node showing a trend of first rising and then falling.
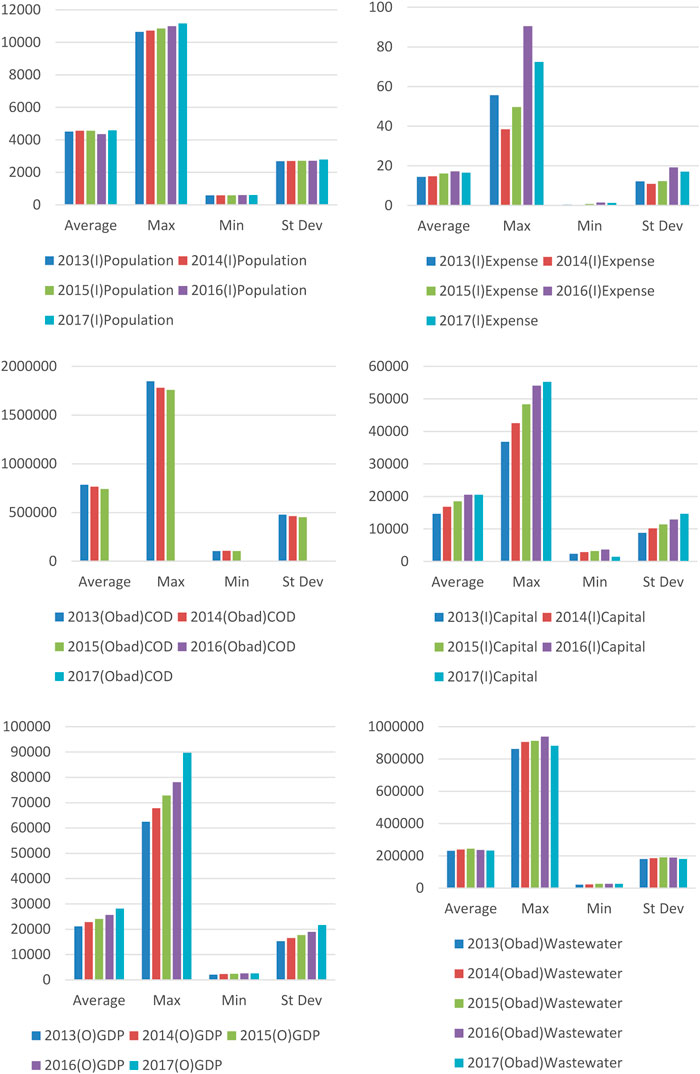
FIGURE 2. Statistical analysis of input-output indicators in 2013–2017.
COD, as one of the important standards to reflect the quality of wastewater, declined significantly after 2015. This means that “The New Environmental Protection Law” and “The Action Plan for Water Pollution Prevention and Control” issued and implemented by the China government in 2015 have made remarkable achievements. However, it is worth noting that the maximum value of COD in 2017 shows a rebound and upward trend compared to 2016, which means that water pollution in some provinces and cities has been aggravated again.
Fixed assets are in a growth state as a whole, with the minimum value only falling in 2016–2017. It denotes that fixed capital investment in wastewater treatment has increased steadily in each region, and each region has paid more attention to the relationship between economic development and environmental protection. The average and maximum values of wastewater discharge clearly fluctuate. The average value and the maximum value peaked in 2015–2016, respectively. The standard deviation also shows a trend of rising first and then falling, indicating that regional differences are narrowing.
According to Figure 3, except for Gansu and Guizhou in the western region, most provinces and autonomous regions’ total efficiency scores under the influence of urbanization level are higher than those without the influence of urbanization level. The most obvious cities affected by urbanization are Liaoning in the northeast, Inner Mongolia in the west, Henan in the central, and Jiangsu, Shandong, and Zhejiang in the east. It is worth noting that the efficiency values in eastern China vary a lot. The scores of Jiangsu, Guangdong, and Shandong under the influence of urbanization level are 1, but the scores without the influence of urbanization level are all below 0.4. The total efficiency score of the western region is generally lower than 0.5, and Qinghai is the lowest with a total efficiency score of 0.1683. We see that the urbanization process is an important factor in the overall efficiency evaluation of wastewater treatment in China.
FIGURE 3. Total efficiency score of each region.
According to Table 2, the total efficiency score of provinces without the influence of urbanization level has remained at one for five consecutive years, and all of them are in the eastern region: Beijing, Shanghai, and Tianjin. In 2017, Liaoning and Inner Mongolia also reached the optimal value of 1. Those with a significant decline in total efficiency scores in the five years are Hainan, Jilin, Qinghai, Sichuan, Shaanxi, and Zhejiang. The biggest drop is for Sichuan, which fell 11 places. The efficiency scores of most other regions are rising, and the most significant one is Liaoning, moving up nine places in total. In general, the overall efficiency score of most cities increased without the influence of urbanization level, but the overall score is low. The scores of non-DEA effective areas are below 0.5, and those in the eastern region have a slight advantage, while the northeast region shows the greatest progress.
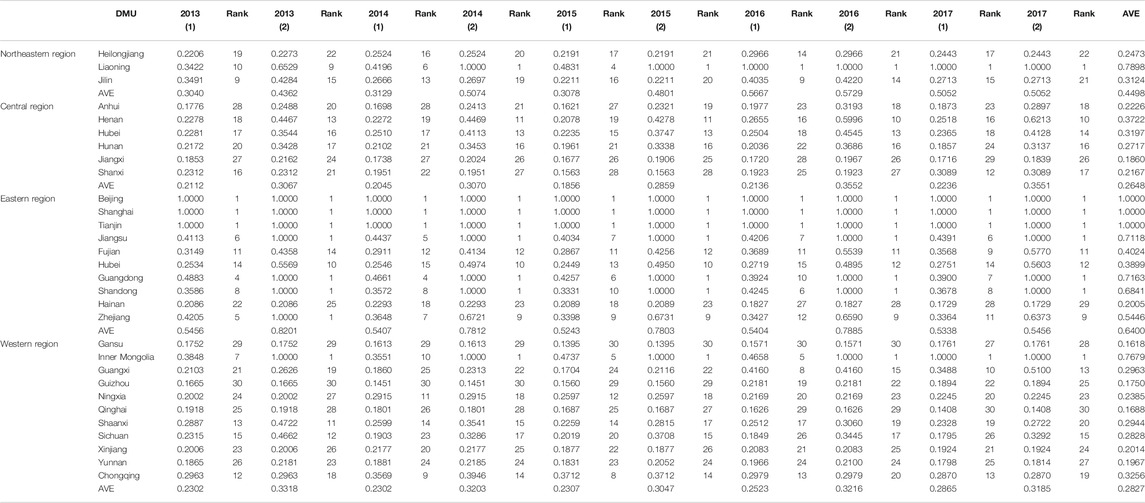
TABLE 2. 2013–2017 total efficiency level of provinces and autonomous regions.
After adding the exogenous variables of urbanization, the total efficiency score of cities at the level of total efficiency in 2017 has reached 8, including Guangdong, Jiangsu, Liaoning, Inner Mongolia, and Shandong compared to 2013, showing that the total efficiency score of northeast China has made great progress. Guangxi (up six places) and Guizhou (up five places) are the regions with a large increase in ranking. The regions with a relatively large decline in ranking are Hainan, Shaanxi, Sichuan, Yunnan, and Shaanxi, which dropped nine places as the largest decline.
Table 3 reflects the input efficiency level of wastewater treatment in each region. It can be seen that the level of urbanization has a positive impact on cost input efficiency in the eastern, central, and western regions. The most obvious positive effect is in the central region, in which the average score without urbanization is 0.1651, and the average score after urbanization increased to 0.4379. In northeast China, the urbanization level has no significant impact on the region, because of the large differences and complex situations among provinces and cities. When there is no impact of urbanization level in five years, the average score of cost input efficiency of the four regions is rising, while the scores are declining after the impact of urbanization level is added through vertical comparison. Therefore, we conclude that the positive impact of urbanization level on the cost input efficiency of each region is weakening year by year.
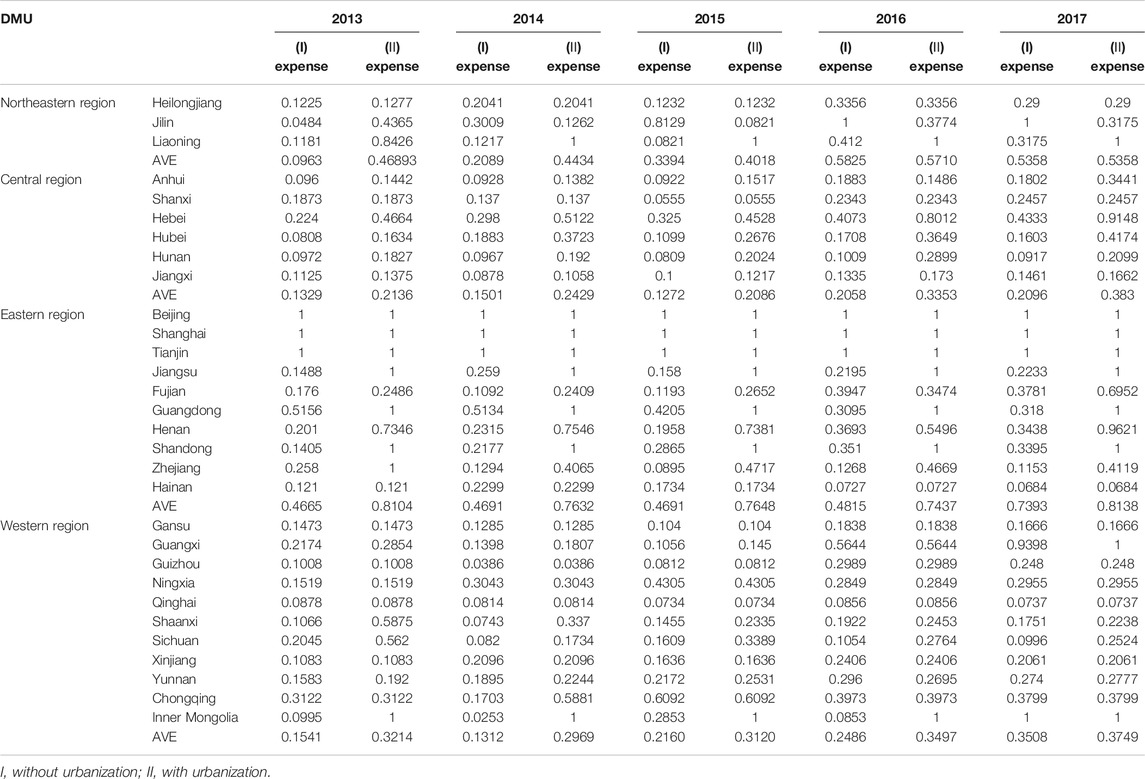
TABLE 3. Input efficiency level of wastewater treatment in various regions of China from 2013 to 2017.
In terms of specific provinces and cities, Inner Mongolia, Liaoning, Beijing, Shanghai, and Tianjin have achieved DEA efficiency without the influence of urbanization level. Under the influence of urbanization level, Guangdong, Guangxi, and Shandong have also achieved DEA effectiveness, and the time for Inner Mongolia to achieve DEA effectiveness is the year of 2013. The scores of cost input efficiency in most provinces increased significantly under the influence of urbanization level. Among them, the largest increase is from 0.2854 to 1 in Guangxi, followed by 0.4664–0.9118 in Henan. In addition, affected by the level of urbanization, the decline in scores also increased - for example, Zhejiang dropped from 1 to 0.4119, down 58.81%; while Shaanxi dropped from 0.5875 to 0.2238, down 61.9%.
Table 4 shows the change of mean efficiency value of fixed assets and population in the four regions. In terms of the efficiency of fixed assets, the average score of the western region without the influence of urbanization level shows an upward trend in five years and a downward trend after considering the urbanization level, but the urbanization level from 2015 to 2017 has no positive impact on the investment efficiency of fixed assets in the western region. Therefore, we find that the level of urbanization has a significantly positive impact on the investment efficiency of fixed assets in the eastern and central regions. The positive impact on the western region has changed in the opposite direction. The internal differences in the northeast region are large, and so the positive impact of urbanization on the region is not significant.
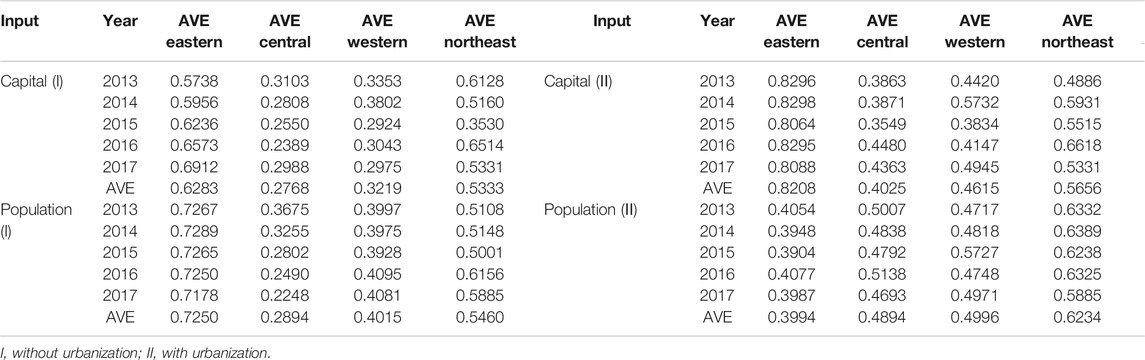
TABLE 4. Efficiency of capital and population under the influence of regional urbanization.
Urbanization level has a significantly positive effect on the scores of population input efficiency in the northeast, central, and western regions. The scores of these three regions without considering urbanization level are 0.5460, 0.2894, and 0.4015, respectively. After the impact of urbanization level is added, the scores rise to 0.6234, 0.4894, and 0.4996. However, under the influence of urbanization level, the average score of population input efficiency in the eastern region decreases from 0.7250 to 0.3994. Therefore, urbanization level has no positive effect on population input efficiency in the eastern region.
To sum up, we find without the influence of urbanization level that the eastern region has significant advantages in the input efficiency scores of fixed assets, population, and expenses. Considering the urbanization level, the input efficiency of fixed assets and expenses in the eastern region is still the best among the four regions, while the input efficiency of the population of the eastern region is the worst among the four regions.
Table 5 shows that the provinces with DEA efficiency but without the influence of urbanization level are Inner Mongolia, Liaoning, Beijing, Shanghai, Tianjin, and Jiangsu. After considering the level of urbanization, 10 provinces are DEA-efficient, including Hubei, Hunan, Fujian, Guangdong, Hebei, and Shandong in the central region and Fujian, Guangdong, Hebei, and Shandong in the eastern region. Without the influence of urbanization level, the largest increase is in Liaoning, from 0.6766 to 1, up 47.8%. The largest decline is in Chongqing, down 36.85% from 0.9165 to 0.6697.
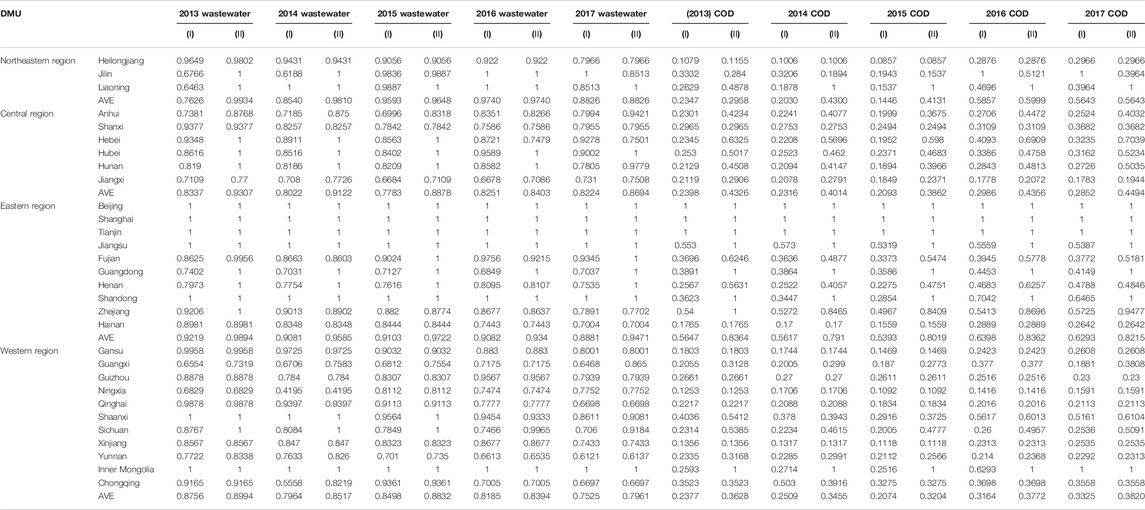
TABLE 5. Efficiency of wastewater and COD under the influence of regional urbanization.
After considering the impact of urbanization level, the output efficiency scores of most provinces are decreasing, with the largest decline from 0.8338 to 0.6137 in Yunnan. On the whole, the wastewater output efficiency of each province and autonomous region is relatively high. However, most provinces and cities show a downward trend, which requires the governments of each region to be vigilant.
The average scores of the four regions affected by the level of urbanization in the past five years are on the whole declining. However, comparing before and after considering the level of urbanization, we find that the scores of the eastern, central, and western regions are significantly higher than those without the impact of the level of urbanization. However, the scores of most provinces in the western region from 2013 to 2017 show a downward trend. The influence of the level of urbanization does not change the declining trend, but further expands the declining range of these provinces. It shows that the positive effect of urbanization level on wastewater output efficiency is not sustainable and is only reflected in the improvement of the scores of provinces and cities compared with those without urbanization level.
Influenced by the level of urbanization, the scores of COD output efficiency of most provinces in the eastern, northeast, and central regions are significantly higher than those before considering the level of urbanization. There are seven provinces running under DEA output efficiency: Inner Mongolia, Liaoning, Beijing, Shanghai, Tianjin, Guangdong, and Shandong. They total two more than those without the influence of urbanization level, and the effective time of DEA in Inner Mongolia and Liaoning is ahead of schedule. Affected by the level of urbanization, the efficiency scores of most provinces in the non-DEA effective region are rising, and Heilongjiang has the largest increase rate of 0.1125, rising to 0.2966. In addition, under the influence of urbanization level, the largest decline of COD is in Fujian, from 0.6246 to 0.5161. Other declining provinces are all from the central and western regions. The basic score is low, and the urbanization level has a limited impact on the western region.
Comparing the COD efficiency scores of provinces and autonomous regions with and without urbanization level, we see that the positive impact of urbanization level on the eastern region and the central region is more significant, and the eastern region is always the best of the four regions. There are great internal differences in northeast China, among which the COD efficiency score of Jilin has declined significantly after being affected by the urbanization level. Overall, the COD efficiency score from 2013 to 2017 has also decreased compared to that without the urbanization level, and the eastern region has the most significant increase under the influence of the urbanization level. Moreover, there is a large gap in the urbanization level between the provinces and cities in the western region. The overall score of the western region has increased after the impact of urbanization level. The most significant increase is in Sichuan, while the other provinces have a small increase. Without the impact of urbanization level, the COD efficiency score of Sichuan is 0.2536, and its score rises to 0.5091 under the impact of urbanization level.
Figure 4 shows the average change of waste and COD efficiencies in the four regions. We see that the wastewater output efficiency is significantly higher than COD efficiency, indicating that China has some control over the total amount of wastewater, but the improvement of wastewater pollution is not optimistic. COD shows greater regional differences. Influenced by urbanization factors, the 5-years average value of COD efficiency in the eastern region is as high as 0.8174, while it is only 0.3576 in the western region. The difference in wastewater production efficiency among regions is small. Influenced by urbanization, the lowest value of 0.8540 in the western region is only 0.1 lower than the highest value of 0.9602 in the eastern region. In addition, the COD efficiency value of the four regions presents a greater increase after adding the urbanization level, which shows that the impact of urbanization level on COD efficiency is greater than that of wastewater output, which is closely related to the more complete wastewater treatment and pollution control system of urbanization.
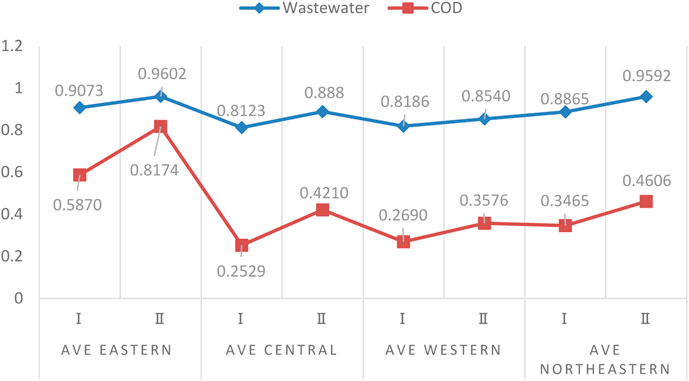
FIGURE 4. Five-year mean value of waste and COD efficiencies in each region.
Figure 5 shows the urbanization level efficiency of provinces and cities from 2013 to 2017. Findings show that the overall urbanization level efficiency of China is very high. The level of urbanization in the eastern region is the greatest. Except for Hainan, all other provinces have achieved DEA efficiency, but the level of urbanization in the western region is the most unbalanced, which is consistent with the economic differences among regions in China.
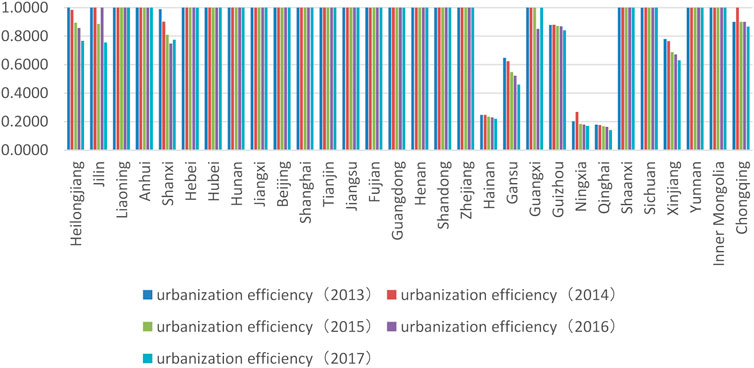
FIGURE 5. 2013–2017 urbanization level efficiency of provinces and cities.
We are able to conclude that the improvement of urbanization level has a positive effect on the input efficiency of most provinces, but on the whole this positive effect is only reflected in the improvement of scores in the same year compared with no urbanization level, and this positive effect is not sustainable. Compared with other years, a high urbanization level changes the declining trend of wastewater output efficiency in the four regions, while its positive effect on COD production efficiency is not significant.
Since there may be a known or unknown correlation between population and urbanization, in order to ensure that the correlation does not interfere with the results, a regression of population to urbanization to eliminate the part of the urbanization rate that is irrelevant to population is carried out. The concrete idea runs as follows.
One of the basic assumptions of multiple regression analysis is that there is no correlation between independent variables and random disturbance terms. Therefore, the correlation between the residual terms obtained from multiple regression analysis and independent variables is 0. According to this characteristic of multiple regression, the urbanization rate is regressed to the population, and the residual is extracted after regression. At this time, the correlation between the residual and the population is 0. This residual is the part of the urbanization rate that is independent of population.
The efficiency value is measured again. Figure 6 shows the change of the total efficiency value before and after elimination. The score 1) represents the total value of wastewater treatment efficiency before a treatment of the interaction between population and urbanization, and the score 2) represents the total value after treatment interaction. Except that the total score of efficiency is 1 for Beijing, Guangzhou, Jiangsu, Inner Mongolia, Shandong, Shanghai, and Tianjin, the total score of efficiency does not change before and after processing correlation, and the total score of efficiency in the other regions has improved to different degrees. In particular, the total efficiency score of Liaoning, Ningxia, and Qinghai rose to 1 after dealing with the correlation between population and urbanization, achieving the Frontier of efficiency. Overall, although the correlation between population and urbanization has a certain positive influence on the total efficiency value, the overall trend and score difference of the efficiency value in various regions remain basically the same before and after the exclusion of the correlation.
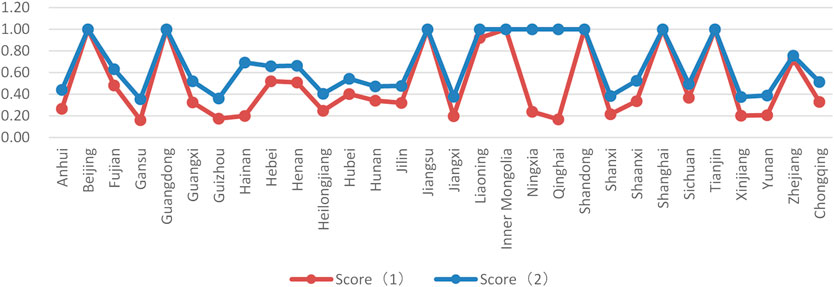
FIGURE 6. Total efficiency score before and after processing correlation.
1) By using the DEA model and taking the urbanization level as an exogenous variable to compare wastewater treatment with and without urbanization efficiency, we find that the average level of the overall efficiency score of wastewater treatment is generally higher under the urbanization level than under the non-urbanization level. This is similar to the result of Wang et al. (2018), whose study showed that city size generates a positive impact on efficiency improvement.
2) In previous studies on wastewater treatment efficiency, the influence of economic, population, and industrialization factors on wastewater treatment efficiency is typically considered, such as the studies of Feng et al. (2019) and Zhang et al. (2019). This present paper uses the urbanization level as an exogenous variable to compare wastewater treatment efficiency with or without urbanization, filling the gap in the related literature. The process of urbanization is bound to have a certain effect on the environment, but also like in (Carlino et al., 2007), we argue that urbanization brings about more advanced technology. Therefore, it is very important to study the impact of urbanization on China’s wastewater pollution and treatment efficiency, which will provide strong support for the formulation of policies in economic development and environmental protection during China’s urbanization.
3) This paper does not consider the impact of environmental factors such as water resource endowment, economic development level, and industrial structure on wastewater treatment efficiency when the DEA method is used to evaluate wastewater treatment efficiency. Further studies on wastewater treatment efficiency can take external environmental factors into more comprehensive consideration to reduce the impact of environmental factors and random interference.
This research has investigated wastewater pollution and wastewater treatment efficiency in the process of China’s urbanization. We present the following findings.
1) The level of urbanization is the key factor affecting the level of total efficiency. The average level of the total efficiency score under the level of urbanization is generally higher than that without the level of urbanization. The overall efficiency of most provinces in China is clearly on the rise. In terms of total efficiency and input efficiency, the eastern region is the best, the northeast region is next, the central region is third, and the western region lags as the worst.
2) The level of urbanization has a significant positive impact on the efficiency of cost input in the eastern and central regions, a negative impact on the western region, and no significant impact on the northeast region. In terms of population input efficiency, urbanization level has a significantly positive impact on the score of population input efficiency in northeast, central, and western regions, while it has no positive impact on the population input efficiency in the eastern region. From the perspective of urbanization level, the investment efficiency of fixed assets and costs in the eastern region is still the best among the four regions, while the investment efficiency of population is the worst among the four regions.
3) Wastewater output efficiency is generally higher than COD output efficiency, but the level of urbanization has no continuous positive effect on wastewater output efficiency. Moreover, wastewater output efficiency in the four regions is declining. The output efficiency of COD distinctly fluctuates and the efficiency value is low on average.
In conclusion, we note that there are significant differences in wastewater pollution and treatment efficiency among regions and provinces in China, and that the level of urbanization impacts each region differently. Therefore, treatment measures should be taken according to the characteristics of each region and local conditions.
The eastern region has the highest level of urbanization and also has an absolute advantage in the number of DEA-efficient provinces in terms of factor input efficiency and output efficiency, but there is also a gap in the development among regional provinces. For provinces with a relatively low urbanization level and insufficient investment in fixed capital and governance, urbanization and ecological environment construction should be developed together. Governments can actively increase the construction of wastewater treatment enterprises and facilities and improve the capacity of wastewater treatment. According to the statistical data, over 50% of domestic sewage in China is directly discharged into natural water bodies without professional treatment, causing a huge burden on urban sewage treatment, and thus provinces that have reached DEA efficiency still need to be vigilant. Due to the complexity of wastewater treatment, more research still needs to be carried out to find innovative technology with high efficiency and low cost.
Those provinces and autonomous regions with rapid development of urbanization need to pursue stability and strengthen the concept of sustainable development during the process of urbanization. Urban sewage monitoring and the construction of basic urban sanitation systems are the key points to improve urban wastewater treatment. An urban sewage monitoring system can help promote the process of urbanization. It can also detect urban sewage in an all-round way by using detection instruments, data transmission network, data result analysis, application equipment, business information, and other related systems.
The whole northeast region has been making progress. Liaoning has been in the leading position in the country, but Heilongjiang and Jilin at low urbanization levels exhibit an obvious weakness in cost input efficiency and COD output efficiency, which may be related to a single technology type or high maintenance cost. Therefore, the focus of wastewater treatment in these areas is to improve COD output efficiency and the investment efficiency of fixed assets, population, and expenses. Attention should be paid to the rationality of wastewater treatment planning and to gradually achieve the centralized treatment of urban wastewater, so as to combine urban wastewater treatment with industrial wastewater treatment, improve wastewater treatment efficiency, and reduce resource waste.
Promoting the process of urbanization in the western region needs to be steady and fast. Improvement in the level of urbanization can quickly improve the efficiency of investment in assets and expenses. However, during the process of promoting urbanization in the western region, attention should also be paid to the problem that the sewage treatment system is difficult to advance along with rapid urbanization, and so it is important to make the construction of sewage treatment system infrastructure match the urbanization level. Although the overall level of urbanization in the central region is very high, there are still many problems to be solved in wastewater treatment there. In general, the efficiency of each index in the central and western regions is low and fluctuates greatly. The most important problem is the cost and investment efficiency of fixed assets. It is thus necessary for governments to develop preferential or subsidy policies to encourage early water treatment projects in the central and western regions. In terms of capital, they need to enact policies to attract investment from enterprises and improve the efficiency of wastewater treatment through applicable and precise investment in wastewater treatment. In terms of technology, governments must strengthen learning and cooperation in advanced areas, learn from successful experience, and introduce new technology and equipment. Governments can adopt the method of first pilot testing and then promoting the successful cases in order to reduce the relevant risks.
The raw data supporting the conclusions of this article will be made available by the authors, without undue reservation.
Conceptualization, F-R.R; methodology, F-R.R; software, F-R.R; validation, Y-N.S and F-R.R; formal analysis, J-W.L; investigation, N-X.S.; resources, Y-N.S.; data curation, Y-N.S; writing–original draft preparation, J-W.L and N-X.S; writing–review and editing, H-F.W and X-T.Y; visualization, J-W.L; supervision, H-F.W and X-T.Y; project administration, N-X.S; funding acquisition, F-R.R.
This study was supported by the Fundamental Research Funds for the Central Universities (Student project, B200203170), Major Projects of Philosophy and Social Science Research of Jiangsu Educational Committee 2020 (2020SJZDA055), Postgraduate Research & Practice Innovation Program of Jiangsu Province (KYCX20_0512,KYCX20_2806), Province and Special Project of Humanities and Social Sciences of Education Department of Shaanxi Province (18JK1215) and Social Science Foundation of Jiangsu Province (20EYD004).
The authors declare that the research was conducted in the absence of any commercial or financial relationships that could be construed as a potential conflict of interest.
1Net of the Central People’s Government of the People’s Republic of China, http://www.gov.cn/shuju/2019-08/16/content_5421576.htm
2National Bureau of Statistics of China, https://data.stats.gov.cn/, series of reports on China’s achievements in economic and social development on the 70th anniversary of the founding of the People’s Republic of China
3National Bureau of Statistics of China, https://data.stats.gov.cn/
4Ministry of Ecological and Environmental Protection of China, http://www.mee.gov.cn/hjzl/sthjzk/sthjtjnb/
5The Taihu lake basin covers most of Southern Jiangsu Province, Huzhou and parts of Jiaxing and Hangzhou in Zhejiang province, and most of Shanghai.
An, M., He, W., Degefu, D., Liao, Z., Zhang, Z., and Yuan, L. (2018). Spatial patterns of urban wastewater discharge and treatment plants efficiency in China. Int. J. Environ. Res. Public Health 15, 1892. doi:10.3390/ijerph15091892
Carlino, G. A., Chatterjee, S., and Hunt, R. M. (2007). Urban density and the rate of invention. J. Urban Econ. 61, 389–419. doi:10.1016/j.jue.2006.08.003
D'Inverno, G., Carosi, L., Romano, G., and Guerrini, A. (2018). Water pollution in wastewater treatment plants: an efficiency analysis with undesirable output. Eur. J. Oper. Res. 269, 24–34. doi:10.1016/j.ejor.2017.08.028
Deng, G., Li, L., and Song, Y. (2016). Provincial water use efficiency measurement and factor analysis in China: based on SBM-DEA model. Ecol. Indicat. 16, 12–18, doi:10.1016/j.ecolind.2016.03.052
Färe, R., Grosskopf, S., Norris, M., and Zhang, Z. (1994). Productivity growth, technical progress, and efficiency change in industrialized countries. Am. Econ. Rev., 84, 66–83. doi:10.1016/0165-1765(95)00729-6
Färe, R., and Grosskopf, S. (1996). Productivity and intermediate products: a Frontier approach. Econ. Lett. 50, 65–70. doi:10.1016/0165-1765(95)00729-6
Feng, Y., Chiu, Y.-H., and Liu, F.-P. (2019). Measuring the performance of wastewater treatment in China. Appl. Sci. 9, 153. doi:10.3390/app9010153
Guerrini, A., Romano, G., Carosi, L., and Mancuso, F. (2017). Cost savings in wastewater treatment processes: the role of environmental and operational drivers. Water Resour. Manag. 31, 1–14. doi:10.1007/s11269-017-1586-9
Guo, Q. (2017). “The evaluation and analysis of urbanization efficiency in west China,” in Fifth Symposium of Risk Analysis and Risk Management in Western China (WRARM 2017), Guiyang, Guizhou, November 3–5, 2017 (Atlantis Press). doi:10.2991/wrarm-17.2017.42
Hu, Z., Yan, S., Yao, L., and Moudi, M. (2018). Efficiency evaluation with feedback for regional water use and wastewater treatment. J. Hydrol. 562, 703–711. doi:10.1016/j.jhydrol.2018.05.032
Jia, Y. P., and Liu, R. Z. (2012). Study of the energy and environmental efficiency of the Chinese economy based on a DEA model. Procedia Environ. Sci. 13, 2256–2263. doi:10.1016/j.proenv.2012.01.214
Jin, G., Deng, X., Zhao, X., Guo, B., and Yang, J. (2018). Spatiotemporal patterns in urbanization efficiency within the Yangtze River economic belt between 2005 and 2014. J. Geogr. Sci. 28, 1113–1126. doi:10.1007/s11442-018-1545-2
Klopp, , and Allan, G. (1985). The analysis of the efficiency of productive systems with multiple inputs and outputs. Engineering Industrial.
Li, J., Huang, X., Kwan, M.-P., Yang, H., and Chuai, X. (2018). The effect of urbanization on carbon dioxide emissions efficiency in the Yangtze River Delta, China. J. Clean. Prod. 188, 38. doi:10.1016/j.jclepro.2018.03.198
Liang, L., Wang, Z., and Li, J. (2019). The effect of urbanization on environmental pollution in rapidly developing urban agglomerations. J. Clean. Prod. 237, 117649. doi:10.1016/j.jclepro.2019.117649
Lishan, X., Tao, L., Yin, W., Zhilong, Y., and Jiangfu, L. (2018). Comparative life cycle assessment of sludge management: a case study of Xiamen, China. J. Clean. Prod. 192, 354–363. doi:10.1016/j.jclepro.2018.04.171
Liu, B., Li, Y., Hou, R., and Wang, H. (2019a). Does urbanization improve industrial water consumption efficiency? Sustainability 11 1787. doi:10.3390/su11061787
Liu, H., Liu, Y., Wang, H., Yang, J., and Zhou, X. (2019b). Research on the coordinated development of greenization and urbanization based on system dynamics and data envelopment analysis——a case study of Tianjin. J. Clean. Prod. 214 195–208. doi:10.1016/j.jclepro.2018.12.046
Nemoto, J., and Goto, M. (1999). Dynamic data envelopment analysis: modeling intertemporal behavior of a firm in the presence of productive inefficiencies. Econ. Lett. 64, 51–56. doi:10.1016/s0165-1765(99)00070-1
Nemoto, J., and Goto, M. (2003). Measurement of dynamic efficiency in production: an application of data envelopment analysis to Japanese electric utilities. J. Prod. Anal. 19, 191–210. doi:10.1023/a:1022805500570
Ren, Y., Li, H., Shen, L., Zhang, Y., Chen, Y., and Wang, J. (2018). What is the efficiency of fast urbanization? A China study. Sustainability 10, 3180. doi:10.3390/su10093180
Sueyoshi, T., and Sekitani, K. (2005). Returns to scale in dynamic DEA. Eur. J. Oper. Res. 161, 536–544. doi:10.1016/j.ejor.2003.08.055
Tone, K., and Tsutsui, M. (2010). Dynamic DEA: a slacks-based measure approach☆. Omega 38, 145–156. doi:10.1016/j.omega.2009.07.003
Wang, S., Qiu, S., Ge, S., Liu, J., and Peng, Z. (2018). Benchmarking Toronto wastewater treatment plants using DEA window and Tobit regression analysis with a dynamic efficiency perspective. Environ. Sci. Pollut. Res. Int. 25, 32649–32659. doi:10.1007/s11356-018-3202-9
Wang, X.-R., Hui, E. C.-M., Choguill, C., and Jia, S.-H. (2015). The new urbanization policy in China: which way forward? Habitat Int. 47, 279–284. doi:10.1016/j.habitatint.2015.02.001
Wu, G., Hong, J., Li, D., and Wu, Z. (2019). Efficiency assessment of pollutants discharged in urban wastewater treatment: evidence from 68 key cities in China. J. Clean. Prod. 233, 1437–1450. doi:10.1016/j.jclepro.2019.06.012
Yuanhong, T., Jinfeng, D., Dajian, Z., and Nicholas, M. (2018). The effect of the urban wastewater treatment ratio on agricultural water productivity: based on provincial data of China in 2004–2010. Applied Water Science 8, 144.
Zhan, J., Zhang, F., Jia, S., Chu, X., and Li, Y. (2017). Spatial pattern of regional urbanization efficiency: an empirical study of Shanghai. Comput. Econ. 52, 1277–1291. doi:10.1109/infoman.2017.7950345
Zhang, J. (2011). Several problems in the course of urbanization in China and planning responses, in: International Conference on Information and Business Intelligence (Springer, Berlin, Heidelberg), 494–499.
Zhang, L.-H., Zhao, L.-X., Song, X.-W., Qin, N.-J., and Zhang, J. (2015). The analysis of Guangxi environmental problems of urbanization and low-carbon development strategy. (Springer, Berlin, Heidelberg), 139–149.
Zhang, R., Lu, C.-C., Lee, J.-H., Feng, Y., and Chiu, Y.-H. (2019). Dynamic environmental efficiency assessment of industrial water pollution. Sustainability 11, 3053. doi:10.3390/su11113053
Zhao, H., Cui, J., Wang, S., and Lindley, S. (2018). Customizing the coefficients of urban domestic pollutant discharge and their driving mechanisms: evidence from the Taihu Basin, China. J. Environ. Manag. 213, 247–254. doi:10.1016/j.jenvman.2017.08.007
Keywords: urbanization, wastewater pollution, wastewater treatment, efficiency evaluation, dynamic DEA
Citation: Sun Y, Ren F, Liu J, Shi N, Wang H and You X (2021) Evaluation of Wastewater Pollution and Treatment Efficiencies in China During Urbanization Based on Dynamic Exogenous Variable Data Envelopment Analysis. Front. Environ. Sci. 9:585718. doi: 10.3389/fenvs.2021.585718
Received: 21 July 2020; Accepted: 11 January 2021;
Published: 15 February 2021.
Edited by:
Alberto Tiraferri, Politecnico di Torino, ItalyReviewed by:
Zacharias Frontistis, University of Western Macedonia, GreeceCopyright © 2021 Sun, Ren, Liu, Shi, Wang and You. This is an open-access article distributed under the terms of the Creative Commons Attribution License (CC BY). The use, distribution or reproduction in other forums is permitted, provided the original author(s) and the copyright owner(s) are credited and that the original publication in this journal is cited, in accordance with accepted academic practice. No use, distribution or reproduction is permitted which does not comply with these terms.
*Correspondence: Fangrong Ren, MzgzODg2OTkwQHFxLmNvbQ==
Disclaimer: All claims expressed in this article are solely those of the authors and do not necessarily represent those of their affiliated organizations, or those of the publisher, the editors and the reviewers. Any product that may be evaluated in this article or claim that may be made by its manufacturer is not guaranteed or endorsed by the publisher.
Research integrity at Frontiers
Learn more about the work of our research integrity team to safeguard the quality of each article we publish.