 Gen Li1
 Ying Zhou
 Fan Liu
- 1School of Economics and Management, Jiangsu University of Science and Technology, Zhenjiang, China
- 2School of Business Administration, Zhongnan University of Economics and Law, Wuhan, China
To explore the evolution mechanism of manufacturing green development efficiency is of great significance to realize green transformation of manufacturing industry in the Yangtze River Economic Belt. This paper fully considers the resource inputs and undesirable outputs in the production process and applies WSR methodology to construct the index system of influencing factors. Based on the panel data of 11 provinces and cities in the Yangtze River Economic Belt from 1998 to 2017, the super-SBM model is used to calculate the manufacturing green development efficiency. Then, the regional differences of manufacturing green development efficiency in the Yangtze River Economic Belt are deeply analyzed. Finally, Tobit model is applied to analyze the influencing factors of the manufacturing green development efficiency. And it turns out, during the statistics period, manufacturing green development efficiency in the Yangtze River Economic Belt is “U” shaped distribution, the mean value of each province over the years is 0.812, which is at the medium development level; the manufacturing green development efficiency in the Yangtze River Economic Belt is on the rise, and the low scale efficiency is the main reason that restricts the manufacturing green development efficiency in the Yangtze River Economic Belt. All the influencing factors have different effects on the manufacturing green development efficiency in different regions. Therefore, this paper puts forward corresponding policy suggestions from the three dimensions of Wuli, Shili and Renli.
Introduction
Manufacturing industry is the main source of modern material wealth, but also an important industry that causes damage to the ecological environment. The manufacturing enterprises in the Yangtze River Economic Belt are dense, and there are many environmental risks. The unreasonable industrial structure and layout result in prominent ecological and environmental problems of accumulation, superposition and potential, which have become the main bottleneck restricting the green development of the Yangtze River Economic Belt. To this end, China issued the guidance on strengthening the green development of industry along the Yangtze River Economic Belt in 2017. In april 2018, general secretary Xi Jinping pointed out at a symposium on promoting the development of the Yangtze River Economic Belt in Hubei province that manufacturing industry was the main body and important force in the ecological and environmental protection construction along the Yangtze River Economic Belt, sticking to the path of ecological priority and green development. In June 2018, the Chinese audit office announced that the total amount of wastewater discharge in the Yangtze River Economic Belt accounted for more than 40% of China’s total, and the emission intensity of chemical oxygen demand, ammonia nitrogen, nitrogen oxides, sulfur dioxide and volatile organic compounds per unit region was about 1.5–2.0 times the national average level. Incremental expansion of manufacturing development in the Yangtze River Economic Belt, such as high water production mode is still dominant; the ecological environment pressure is still large. Under the background of calling for ecological priority and green development, the Yangtze River Economic Belt should focus on improving the green development level of manufacturing industry and reducing the waste of resources and environmental pollution as much as possible. As the regions of the Yangtze River Economic Belt have great differences in economic development level and other aspects, and the development model of manufacturing industry is also different, so it is urgent to consider the green balanced development of manufacturing industry among regions. Therefore, it is of great significance to explore the evolution mechanism of manufacturing green development efficiency in the Yangtze River Economic Belt and find out the causes of unbalanced manufacturing green development efficiency in different regions for realizing green transformation of manufacturing industry in the Yangtze River Economic Belt.
At present, scholars have carried out a lot of researches on the connotation, mechanism and realization path of green development. In 1989, Pierce first put forward the concept of “green economy”, and then the concept of green development gradually took shape. Green development emphasizes saving resources and protecting the ecological environment while developing economy. Jiang and Qu, 2020 conducted an in-depth discussion on core journals, core authors, core countries, discipline distribution, key word co-occurrence and literature co-citation by using Cite Space software, taking 6,591 papers from core journals of Science Net (1999–2019) as research samples. It found that the influence of Chinese research institutions and scholars was increasing, mainly in the fields of engineering and environmental science. The sustainable innovation ability of the manufacturing industry was generally at a high level. There are relatively few researches on the green development efficiency measurement of manufacturing industry in the Yangtze River Economic Belt. The existing researches on the green development efficiency measurement mainly focus on the following aspects: 1) Object of the study. Most existing scholars choose regions or industries as research objects and analyze the evolution characteristics of the green development efficiency of regions or industries. Wang et al. (2014) calculated the green technology efficiency of provincial units from 2001 to 2010 based on the SFA model, and then analyzed the factors from the perspectives of technology, system and industry. Jing and Zhang, 2014 constructed the global Luenberger index based on SBM model to measure the green technology progress of Chinese industry. Li and Zhang, 2016 used the entropy weight TOPSIS model to evaluate the industrial green development level of 108 prefecture-level cities in the Yangtze River Economic Belt from 2004 to 2013, and applied the Tin index to analyze the difference characteristics and composition of industrial green development level among and within the three major city clusters in the Yangtze River Economic Belt. Duman and Kasman, 2018 adopted the parametric hyperbolic distance function to study the environmental technology efficiency of EU member states and candidate countries from 1990 to 2011. Singh C. et al. (2020) identified and examined the various key performance parameters (KPPs) of Green-Lean practices in manufacturing industries to develop green manufacturing by utilizing resources and reducing waste. Future research would focus on ranking these KPPs of green lean manufacturing using appropriate Multi-Criteria Decision Analysis (MCDA) technique. 2) Research indicator. Since the index system method contains many indicators, it is difficult to obtain statistical data. Many scholars adopt the input-output method, which takes capital, labor and energy as input variables, GDP or industrial added value as desirable output, and industrial waste as undesirable output, to calculate the efficiency of green development. Wu and Wen, 2013 calculated China’s industrial green productivity and emission reduction cost from 1995 to 2009 respectively by SML index method and DEA method based on the direction distance function. Then, based on the panel data model estimation method, it discussed the influencing factors of performance and cost in industrial emission reduction. Chen (2010) re-estimated the total factor productivity of Chinese industry since the reform based on the directional distance function, and found that the actual total factor productivity with correct consideration of environmental constraints was much lower than the traditional estimate without correct consideration of environmental factors, which was also supported by the comparison with the results of the main literature. Yi et al. (2018) used DEA-Malmquist index method and exploratory spatial data analysis method to calculate and study the spatial and temporal differences of green total factor productivity (GTFP) in 11 provinces (cities) of the Yangtze River Economic Belt from 2004 to 2015. (3)Research method. Based on the regional or industrial input and output data, most scholars apply SFA, DEA and comprehensive index evaluation to calculate the regional or industrial green development efficiency. Considering the undesirable output in the production process, Li et al. (2019)constructed an SBM model to estimate the energy ecological efficiency of 30 provinces and cities in China from 2000 to 2016. Then the regional differences in the energy ecological efficiency of the manufacturing industry were analyzed in depth. Finally, the Tobit model was used to empirically analyze the factors affecting the energy ecological efficiency of the manufacturing industry in China. Li and Lin, 2017 evaluated and compared the ecological total factor energy efficiency of heavy and light industries and evaluated their technology gaps. Wang et al. (2017) built the Epsilon-Based Measure (EBM)-Tobit two-stage efficiency analysis model by taking regional industry as the research object and integrating industrial water and water pollution emissions into the analysis framework. Sun et al. (2017) measured the green efficiency of water resource based on data enveloped technology, comparing and analyzing the results with the traditional measures of water resource economic efficiency and environmental efficiency, and studying the spatial pattern by using ESDA method. Nukman et al. (2017) established a green manufacturing index (GMI) technology that would determine the effectiveness of green manufacturing processes from an economic and environmental perspective. Zhang J. et al. (2018) used the DEA-Malmquist method to measure the green total factor productivity of various types in China's food industry from 2006 to 2014. The results showed that from 2006 to 2014, the environmental pollution index of China's food industry showed an upward - downward - upward trend. From 2006 to 2014, green total factor productivity in China's food industry showed an upward trend. The mean technical efficiency of China's food industry was low, but the technical efficiency was on the rise. The above-mentioned scholars mainly focus on the macro research of the whole country or province, and the micro research results of a certain region or subdivided industry are relatively less. They mostly use the traditional input-output indicators and adopt the SBM model of undesirable output to measure the green development efficiency. The scientificity of the results needs to be improved.
There are relatively few studies on the factors affecting the manufacturing green development efficiency in the Yangtze River Economic Belt, and more scholars pay attention to the effects of different factors on the green development efficiency of the industry, which are mainly reflected in the following five aspects: 1) Technical factor. Zhou and Wu, 2013; Wu and Du, 2018 found that technological progress was an important factor to improve the efficiency of industrial green transformation. Gandhi et al. (2018) determined the drivers of integrated lean and green manufacturing industry by using the ideal solution similarity sorting method (TOPSIS) and simple additive weighting method (SAW). The results showed that top management commitment, technology upgrading, current legislation, green brand image and future legislation were the five driving forces of lean and green manufacturing integration for SMEs in India's manufacturing sector. Singh M. et al. (2020) obtained answers from 36 senior managers of SMEs in different geographical locations in India through the Green Manufacturing Questionnaire. According to the empirical data, the adoption of new technology had become an important factor affecting the business performance of enterprises. Lu and Zhao, 2016 held different views. 2) Economic factor. Huang and Shi, 2015; Ban and Yuan, 2016 believed that the relationship between green development efficiency and per capita income was u-shaped, while Zhang Y. H. et al. (2018) thought that the level of economic development had a positive effect on green development efficiency. 3) Structural factor. Zhang (2016) believed that industrial structure restricted the improvement of green development efficiency, while Hu and Li, 2012 held the opposite view. 4) Factor of opening to the outside world. Yuan and Xie, 2015 had a negative impact on the overall efficiency of industrial green development, while the impact direction of FDI depended on the intensity of environmental control. Han and Lan, 2012; Lin and Liu, 2015; Chen et al. (2017) believed that the degree of opening to the outside world had a significantly positive effect on the efficiency of green industrial growth. 5) Regulatory factors. Zhang and Wang, 2013; Borghesi et al. (2015), Zhao et al. (2018) thought that the support of environmental protection had a significantly positive effect on the efficiency of green development, while Wei and Zheng, 2017 supported that the greater the intensity of environmental protection or market segmentation, the greater the efficiency of green development would be inhibited. Based on the methodology of systematic literature review through the content analysis of literary resources. Vrchota et al. (2020) found that the most often common sustainability outcomes were energy saving, emission reduction, resource optimization, cost reduction, higher economic performance, human resources development, social welfare and workplace safety. Wang et al. (2020) used a spatial-temporal geographical weighted regression (GTWR) model to analyze the regional influencing factors of the high-carbon manufacturing industry. The industrial structure and economic scale were the main reasons for the regional carbon lock-in of the high-carbon manufacturing industry, and the strength of the lock-in had continued to increase. On the premise of estimating the green development efficiency, most scholars have explored the effect of one or fewer factors on the green development efficiency. There are significant differences in the conclusions, and the system of influencing factors needs to be improved.
On the whole, the existing literature has formed a good research foundation, but there are relatively few studies on the manufacturing green development efficiency in the Yangtze River Economic Belt. The research of relevant scholars is divided into the following aspects: 1) Research object. It mainly focuses on macro studies such as national or provincial studies, but there are relatively few micro studies on a certain region, so it is necessary to strengthen the research on green development efficiency of subregion. 2) Research indicator. More attention is paid to capital, human and energy input, while less attention is paid to water resource input. 3) Research method. The traditional DEA model and the undesirable output SBM model are mostly adopted, which fails to further distinguish the decision making unit, resulting in the deviation of the obtained efficiency value, so the research method needs to be improved. 4) Influencing factor. Most scholars explore the effect of one or fewer factors on the efficiency of green development, so it is necessary to construct a systematic and scientific system of influencing factors. To this end, this paper makes improvements from the following three aspects: 1) Fully considering the resource input and undesirable output in the production process, it selects the use of water resource in the manufacturing industry as the input variable and the emissions of waste gas, waste water and solid waste in the manufacturing industry as the output variables; 2) Based on the panel data of 11 provinces and cities in the Yangtze River Economic Belt from 1998 to 2017, super-SBM is used to measure the manufacturing green development efficiency in the Yangtze River Economic Belt, so as to fully solve the problem that multiple decision-making units may be effective at the same time; 3) It uses the WSR methodology to construct a more scientific influencing factor system of manufacturing green development efficiency and applies Tobit model to analyze the causes of regional differences in the manufacturing green development efficiency. In order to improve the overall efficiency of manufacturing green development and narrow the region differences, the corresponding suggestions are put forward.
Study Design
SBM Model and Green Development Efficiency Measurement of Manufacturing Industry
Data envelopment method (DEA) is mainly used in domestic and foreign researches on green development efficiency measurement. This method can evaluate the relative efficiency between multiple input and output decision making units, which has the advantages of not setting weights and specific forms of production frontier functions in advance. Traditional DEA models mainly include CCR model and BCC model (Han and Lan, 2012). With the proposal of these two models, DEA method has been continuously improved through the joint efforts of domestic and foreign scholars. After Tone improved DEA method twice, super efficiency SBM model has become an important method to calculate the green development efficiency. This method can not only measure the relaxation variable, but also evaluate the unit with an efficiency value of 1. Therefore, this method is adopted in this paper to measure the manufacturing green development efficiency. The model construction process is as follows:
Suppose the number of decision making units is n. In each decision making unit, there are three vectors, namely input, desirable output and undesirable output. The three matrices are
You can then construct a set of production possibilities that includes the undesirable output P,
According to the processing method of SBM model, the time-sharing planning form of SBM model (variable return to scale) considering undesirable output is shown in formula:
In Eq. 1, x, yw and yb represent input variables, desirable output variables and undesirable output variables of the decision making unit.
Considering that the SBM model with undesirable output may be effective for multiple decisions at the same time, which makes it difficult to distinguish and arrange these decision making units, this paper uses the super-SBM model with undesirable output to solve problem. A finite set of possibilities excluding DMU (x0,y0) is:
The fractional programming form of super-SBM model (variable return to scale) considering undesirable output is shown in formula:
In Eq. 2, ρ• is the target efficiency value, and the meanings of other variables are the same as Eq. 1.
TOBIT Model
When the dependent variable is the fragment value or the cut value, the Tobit model should be adopted. This model belongs to the restricted dependent variable model, and the maximum likelihood method is adopted to estimate this model, which can better avoid the problem of inconsistent and biased estimation of parameters. Its mathematical expression is shown in formula:
In Eq. 3,
Variable Selection and Data Description
Input-Output Variables
Input Variables
① Capital input variable. In the selection of input indicators, most of the relevant literatures are based on the idea of Cobb-Douglas production function and take labor and invested capital as inputs. In the past research, capital investment index is mostly represented by capital stock (Khairunnisa et al., 2015), this paper selects fixed assets investment (unit: one hundred million yuan) of the manufacturing industry to replace the capital stock (Zhang and Zhang, 2003; Guo and Sun, 2013). In order to eliminate the influence of the price factor, the paper sets the year of 1998 for the base period and uses price index of fixed assets investment to convert fixed assets investment into comparable price capital stock. ② Labor input variable. In this paper, labor input is expressed by the number of workers (unit: ten thousand) at the end of the year. ③ Energy input variable. In order to reflect the manufacturing green development efficiency in each province, energy input is also added to the input variable. The energy consumption of manufacturing industry in each province over the years (unit: 10,000 tons of standard coal) is selected to represent the energy input variable. Due to the difficulty in obtaining data, industrial data is used as a substitute. ④ Water resource input variable. In order to highlight the green development, this paper selects the water resource consumption of manufacturing industry (unit: 100 million cubic meters) as the variable of water resource input. As the data is difficult to obtain, it is replaced by industrial data.
Output Variables
① Desirable output variable. In relevant studies on the green development efficiency, GDP is generally chosen as output or the index related to the research topic is constructed based on GDP. The desirable output variable refers to the desired output that is beneficial to the overall goal. From the perspective of development, the output value created each year is the most intuitive desirable output of manufacturing industry. Manufacturing added value (unit: 100 million yuan) is adopted as the desirable output in this paper. Due to the difficulty in obtaining data, it is replaced by industrial data. In order to exclude the influence of price factors, the annual price added value is converted into comparable price added value by using the industrial GDP index (1998 = 100).
② Undesirable output variables. An undesirable output is an accompaniment to a beneficial output, which is produced with the beneficial output. When the toxic gases and substances contained in the “three wastes of manufacturing industry” are discharged into the environment, they will not only cause environmental pollution, but also cause air pollution, which will have a serious effect on human health. The discharged substances may have physical and chemical changes, and the harmful substances can enter the human body through different ways, thus harming human health. In order to consider the problem of urban air and environmental pollution caused by the development of manufacturing industry, the three wastes of manufacturing industry are selected as the undesirable output variable. Due to the difficulty in obtaining data, three industrial wastes (the units of discharge of industrial waste gas, waste water and solid waste are 100 million standard cubic meters, 100 million tons and 10 thousand tons respectively) are used to replace the undesirable output variables.
Influencing Factor Variables
This paper adopts the WSR method (Wuli-Shili-Renli theory system method), and puts forward the factors affecting the manufacturing green development efficiency from three different perspectives: Wuli, Shili and Renli theory. In 1994, Gu Jifa and Zhu Zhichang jointly proposed the WSR system methodology at the university of Hull, United Kingdom (Meng and Zou, 2018). The “principles” in “Wuli”, “Shili” and “Renli” are not only the deepening of the understanding of “Wuli”, “Shili” and Renli, but also the key to improve the universality of the methodology (Gu et al., 2007). WSR system methodology is a research method combining quantitative and qualitative. Its core idea is to make use of Wuli, Shili and Renli intelligently and rationally to solve problems. When dealing with complex problems, it is necessary to consider the objectivity of the research object (Wuli level), and how to deal with existing problems (Shili level). Then, it is necessary to consider that people, as objects or subjects, always exist in the practice of dealing with problems (Renli level). The essence of WSR system methodology is to coordinate the relationship of “Wuli”, “Shili” and “Renli” in the system practice. Earlier before year 2000, WSR methodology was listed as an integrated system methodology by foreign scholars, which had its own uniqueness and traditional Chinese philosophical thinking (Gu, 2011). At present, this method has gradually matured and has been applied in various fields (Gu and Gao, 1998). Specifically, Wuli factors include economic and technological factors; Shili factors include efficiency and structural factors; Renli factors include human and regulatory factors. Economic development level, urbanization level, openness to the outside world, technology marketization level, foreign investment level are economic and technological factors; energy productivity, labor productivity, r&d input rate, energy consumption structure, industrial structure and property rights structure are efficiency and structural factors; labor force quality, environmental protection strength and energy price are human and regulatory factors. All the selected variables are shown in Figure 1.

FIGURE 1. 3D diagram of influencing factors of WSR methodology.
Economic Development Level
The level of economic development refers to the size, speed or level of economic development. Generally speaking, regions with a higher level of economic development have a developed economy, a high level of technology, and a relatively high level of development in various industries, making a great contribution to the green development of manufacturing industry. In this paper, per capita GDP is used to represent the level of economic development of provinces and cities, and it is assumed that the level of economic development has a promoting effect on the manufacturing green development efficiency. In this variable, GDP has been converted into comparable GDP by using the GDP deflator (1998 = 100).
Urbanization Level
Urbanization is an important symbol of the level of modernization. With the acceleration of technological progress and industrialization, non-agricultural industries continue to gather in urban regions, creating many employment opportunities, resulting in the continuous migration of rural population to cities, the continuous expansion of the number and scale of cities, and the continuous spread of urban civilization to the countryside. In general, the population transformation, industrial adjustment, industrial development and scientific and technological progress brought by urbanization will have positive effects on the manufacturing green development efficiency. This paper adopts the proportion of urban population in the total population in each region to represent the urbanization level.
Openness to the Outside World
The degree of openness mainly measures the degree to which enterprises participate in the international market. The higher the degree of openness to the outside world, the greater the competitive pressure enterprises face, the more advanced management technology and mode they can learn, and thus they produce the significantly positive effect on the manufacturing green development efficiency. In this paper, the proportion of export delivery value in the main business income of manufacturing industry in each region is adopted to represent the degree of openness to the outside world.
Technology Marketization Level
The level of technology marketization reflects the importance that a region attaches to scientific and technological research and development. The higher the level of technology marketization, the higher the level of manufacturing technology in the region, and the higher the level of pollution control. In this paper, the ratio of technology market turnover to manufacturing added value is used to represent the level of technology marketization, and it is assumed that this variable has a positive effect on the manufacturing green development efficiency.
Foreign Investment Level
Foreign investment has become an important force to promote China’s economic and social development and greatly promote the improvement of manufacturing technology. In order to further promote high-quality development of foreign investment, the second session of the 13th National People’s Congress (NPC) passed the law of the People’s Republic of China on foreign investment on March 15, 2019, the first comprehensive and systematic legislation on foreign investment in China's history. In this paper, the proportion of foreign investment in GDP by region is used to represent the level of foreign investment, and it is assumed that this variable has a promoting effect on the manufacturing green development efficiency.
Energy Productivity
Energy productivity can be expressed by the ratio of manufacturing value added to energy use in different regions, which is mainly used to compare the comprehensive utilization efficiency of energy in different regions, reflecting the economic benefits of energy utilization. In recent years, China has introduced a series of energy conservation and emission reduction policies to promote energy technology innovation, which is conducive to improving China's energy productivity. In this variable, manufacturing added value has been converted into comparable added value by using the industrial GDP index (1998 = 100). This paper assumes that this variable has a positive effect on the manufacturing green development efficiency.
Labor Productivity
Labor productivity is usually determined by the development level of social productivity, and is also affected by various economic and technological factors. In this paper, the ratio of the value added of manufacturing industry to the number of employed people in manufacturing industry in each region is adopted to represent labor productivity, and it is assumed that this variable has a significantly positive effect on the manufacturing green development efficiency. In this variable, manufacturing added value also has been converted into comparable added value by using the industrial GDP index (1998 = 100).
R&d Input Rate
R&d investment is usually positively correlated with technological progress and has a positive effect on resource efficiency. Advanced technology can promote the development of high-end manufacturing industry. In this paper, the ratio of the internal r&d expenditure of manufacturing industry to the added value of manufacturing industry in each region is adopted as the proxy variable of r&d input rate. Since it is difficult to obtain data on r&d expenditure in manufacturing industry, industrial data are used instead, and it is assumed that this variable has a positive effect on the manufacturing green development efficiency.
Energy Consumption Structure
China is the world’s largest producer and consumer of coal. In 2018, China consumed 1.91 billion tons of standard coal, accounting for 50.5% of global consumption. Excessive consumption of coal will cause serious damage to the ecological environment, so it is urgent to optimize the energy consumption structure. In this paper, the ratio of coal consumption to total energy consumption in manufacturing industry in each region is used to represent the energy consumption structure, and it is assumed that this variable has a significantly negative effect on the manufacturing green development efficiency.
Industrial Structure
The proportion of different industries is the industrial structure, which directly affects the manufacturing green development efficiency. After the reform and opening up, China’s industrial structure is developing toward a higher and reasonable direction, but the proportion of the secondary industry in GDP is still high. In this paper, the ratio of the total output value of heavy industry to the total industrial output value in each region is used to represent the industrial structure, and it is assumed that this variable has a significantly negative effect on the manufacturing green development efficiency.
Property Rights Structure
The rational operation and coordinated development of modern enterprises mainly depend on the rationalization and scientific property rights structure of enterprises. Some scholars have shown that the operation efficiency of state-owned enterprises is relatively low, which may hinder the green development of the industry. In this paper, the proportion of manufacturing national capital in total paid-in manufacturing capital in each region is used as the proxy variable of property rights structure, and it is assumed that this variable has a negative effect on the manufacturing green development efficiency.
Labor Force Quality
With the continuous improvement of science and technology, the productivity of enterprises depends more and more on the intelligence level of laborers. The more talents with high knowledge level in the manufacturing industry, the faster the transformation and upgrading speed of enterprises will be. This paper chooses the average education years to measure the labor quality and the calculation method refers to Peng Guohua (Luo et al., 2017). The calculation formula is: the average number of years of education in the workforce = the proportion of working population with illiteracy, semiliterate * 1.5 + the proportion of the working population with primary education * 7.5 + the proportion of the working population with secondary education * 10.5 + the proportion of the working population with a high school education * 13.5 + the proportion of the working population with tertiary education and above * 17 and assumes that the variable has a significantly positive effect on the manufacturing green development efficiency.
Environmental Protection Strength
Environmental protection can promote enterprises to strengthen the treatment of three wastes and reduce the waste of production capacity, and thus promote the green development of manufacturing industry. In this paper, the ratio of total investment in environmental pollution control to the added value of manufacturing industry in each region is adopted to represent the environmental protection strength, and it is assumed that this variable has a positive effect on the manufacturing green development efficiency.
Energy Price
Energy price mainly includes the price of coal, oil, natural gas, new energy and other products. Energy price policy can promote lean production of enterprises, encourage using various energy resources reasonably and efficiently, and thus improve the green development level of manufacturing industry. In this paper, the purchasing price index of raw materials, fuels and power is used to represent energy price, and it is assumed that this variable has a significantly positive effect on the manufacturing green development efficiency. Description of influencing factor variables can be found in Table 1.
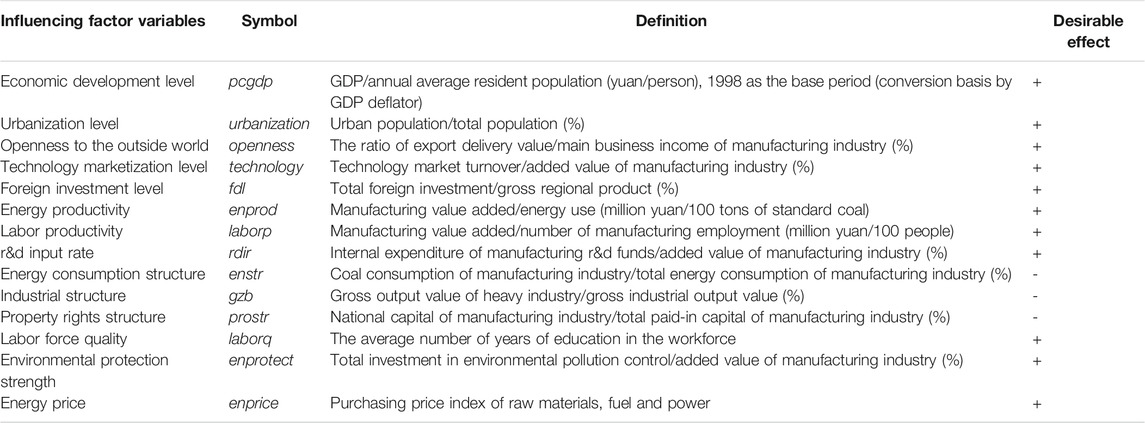
TABLE 1. Description of influencing factor variables.
In order to reduce multicollinearity and eliminate the influence of dimension to some extent, the data of the above influencing factors (excluding labor force quality, technology marketization level, foreign investment level, environmental protection strength and r&d input rate) are logarithmized in this paper.
Based on the above analysis, the specific regression equation is shown in formula:
In Eq. 4, it represents the value corresponding to the ith province in period t,
Data Description
Considering the availability and effectiveness of data, this article selects 1998–2017 panel data of manufacturing industry of 11 provinces and cities in the Yangtze River Economic Belt as a sample. Data are mainly from various provinces and cities statistical yearbook, China statistical yearbook, China industrial economic statistical yearbook, China environment statistical yearbook, China population statistics yearbook and China energy statistical yearbook.
Empirical Results and Analysis
Analysis on Green Development Efficiency and Its Regional Differences of Manufacturing Industry
This paper uses MAXDEA 7.6 software to calculate the manufacturing green development efficiency in 11 provinces and cities of the Yangtze River Economic Belt from 1998 to 2017. The distributions of green development efficiency in 1998, 2004, 2011 and 2017 are made, and the distributions in 1998 and 2017 reflect the overall change of green development efficiency in 11 provinces and cities of the Yangtze River Economic Belt. In 2004 and 2011, the intermediate years are equally separated, and they can reflect the steady growth of efficiency values in some provinces and cities and the change of efficiency values in other provinces and cities. The following is the distribution diagrams of green development efficiency made by ARCGIS software in four years. And the whole result can be gained in Supplementary Appendix Table A1.
Figures 2, 3 and Supplementary Appendix Table A1 show that the mean green development efficiency of the regions along the Yangtze River Economic Belt is not high, but the overall development trend is rising. It indicates that the manufacturing industry of the Yangtze River Economic Belt is still in a relatively low development stage and the task of transformation and upgrading is still arduous. Among them, the mean values of Shanghai, Jiangsu, Zhejiang and Yunnan are all greater than 1, indicating that the four provinces and cities have taken effective environmental protection measures in the past 20 years. The mean efficiencies of green development in Jiangxi, Anhui, Hunan, Guizhou and other regions are relatively low, which are close to 0.5, accounting for only 1/2 of that in Shanghai and Jiangsu. On the whole, the efficiency of green development in the downstream region is higher than that in the midstream and upstream regions. By analyzing Figures 2, 3 and Supplementary Appendix Table A1, the following conclusions can be drawn: 1) The efficiency of green development in most regions is lower than one except for some regions. But the overall trend of green development efficiency is rising. In recent years, the government's environmental protection policy of the Yangtze River Economic Belt region is effective and still needs to be carried out; 2) The differences among different regions are obvious. Green development efficiency in the downstream region is higher, green development efficiencies in upstream and downstream regions are low. The efficiencies of Shanghai, Jiangsu and Zhejiang provinces remain above 1 year by year, but efficiencies of Jiangxi, Anhui, Hunan and Guizhou are too low, mainly due to the lower level of manufacturing technology; 3) The high efficiency of green development in the downstream region is mainly due to its high level of economic development, huge manufacturing capital and higher level of scientific and technological research. Most studies show that technological level has a huge effect on the green development of manufacturing industry. Therefore, the manufacturing green development efficiency in developed regions is relatively higher.
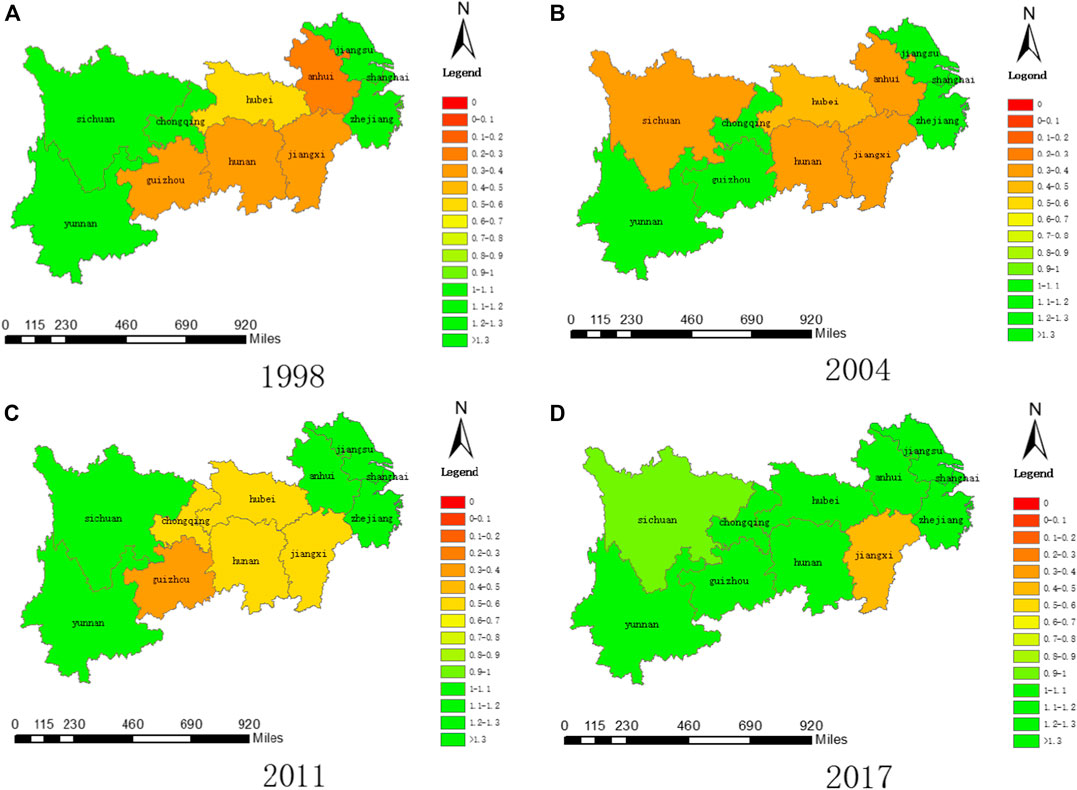
FIGURE 2. Manufacturing green development efficiency in 1998, 2004, 2011 and 2017.
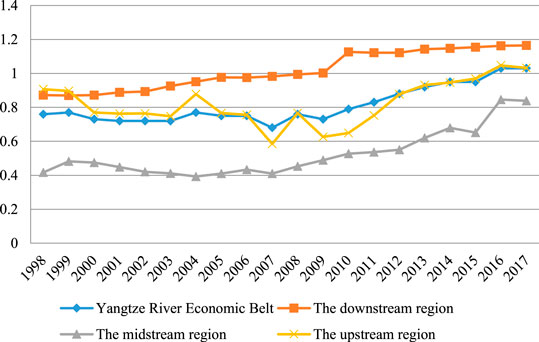
FIGURE 3. Variation trend of mean value of manufacturing green development efficiency from (1998–2017).
From the perspective of inter-provincial differences, the mean manufacturing green development efficiency in Jiangsu over the years is 1.156, followed by 1.152 in Shanghai. Regions with higher efficiency, such as Shanghai, Jiangsu and Zhejiang have maintained a relatively stable growth trend. Although the mean value of green development efficiency of Yunnan’s manufacturing industry is 1.08, from the perspective of time, it decreases slightly year by year, mainly because the scale of Yunnan’s manufacturing industry is relatively small. In January 2015, during his visit to Yunnan, President Xi Jinping put forward the strategic positioning of “building Yunnan into a radiating center for South Asia and southeast Asia”. In the same year, Yunnan province proposed to develop eight major industries, including biomedicine, advanced equipment, food and consumer goods processing and other manufacturing industries. As can be seen from Figures 2, 3, the efficiency value of green development of manufacturing industry in the midstream and upstream regions is relatively low, and the rising rate is also relatively low, which forms an obvious contrast with that in the downstream region. The plan for ecological and environmental protection of the Yangtze River Economic Belt also points out that the regional development of the Yangtze River Economic Belt is unbalanced, most regions still practice the traditional extensive development mode, and the industrial isomorphism in the upstream, midstream and downstream regions is increasingly prominent. Some polluting enterprises are gradually shifting to the midstream and upstream regions. Although this has increased employment and output value in the midstream and upstream regions, environmental pollution in some provinces such as Jiangxi and Guizhou has increased, thus slowing down the growth rate of manufacturing green development efficiency in the midstream and upstream regions.
In this paper, green development efficiency is decomposed into pure technical efficiency and scale efficiency. The results are shown in Figures 4, 5. During the statistical period, the comprehensive efficiency value of the downstream region is significantly higher than that of the upstream region, mainly because the scale efficiency value of the downstream region is larger than that of the upstream region, that is, the manufacturing scale advantage of the downstream region is larger than that of the upstream region. However, it cannot be ignored that the pure technical efficiency value of the downstream region is slightly lower than that of the upstream region, indicating that the upstream region puts more emphasis on technology and management level rather than scale when developing manufacturing industry. In undertaking the transfer of industries from the downstream region, the midstream region should focus on improving the quality of manufacturing industry and make full use of the benefits of economies of scale. While expanding the enterprise scale, the upstream region should continue improving the technology and management level.
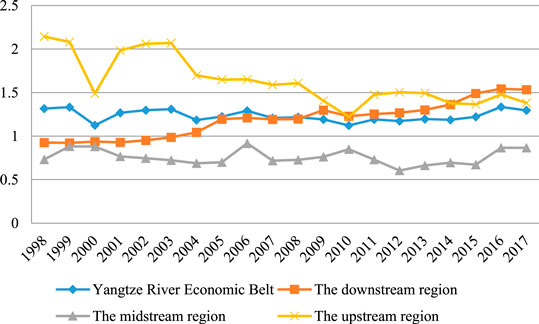
FIGURE 4. Variation trend of mean value of pure technical efficiency (1998–2017).
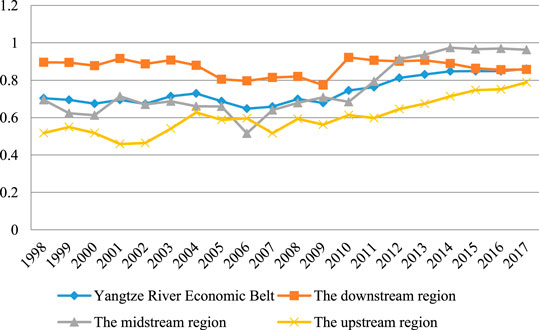
FIGURE 5. Variation trend of mean value of scale efficiency (1998–2017).
TOBIT Regression Analysis
With the help of EViews9.0 software and panel Tobit model, this paper conducts an empirical analysis on the factors influencing the manufacturing green development efficiency in the upstream, midstream and downstream regions of the Yangtze River Economic Belt. The specific effect of each variable is shown in Table 2. Table 2 shows that the coefficient of each factor variable is different from 0, and most variables reject the assumption that the value is 0 at the corresponding significance level, and the data fitting is good.
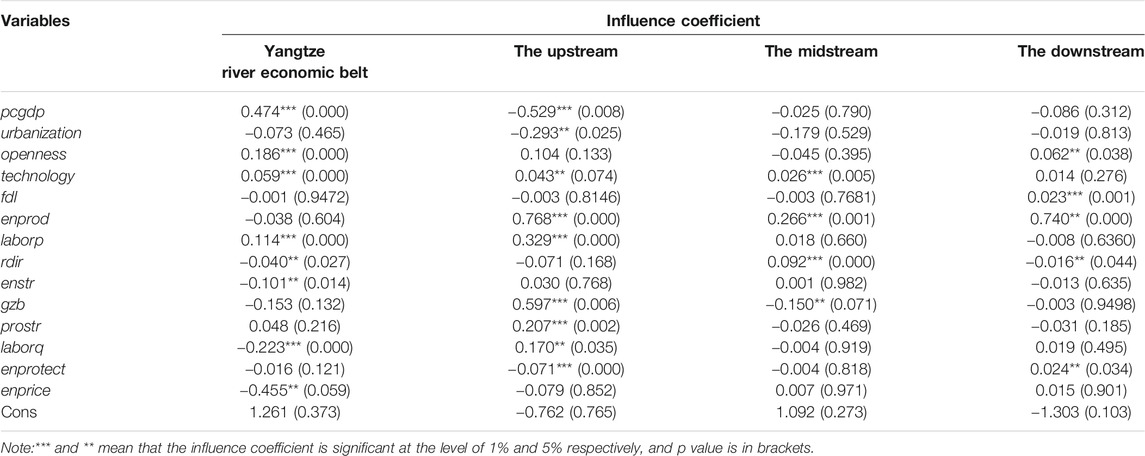
TABLE 2. Regression results of influencing factors of Yangtze River Economic Belt and its sub-regions.
Wuli Factors Analysis
Per capita GDP has the largest effect on the manufacturing green development efficiency in the Yangtze River Economic Belt, with an influence coefficient of 0.474, which is consistent with the expectation. But influence coefficients of per capita GDP in upstream, midstream and downstream regions are −0.529, −0.025 and −0.086 respectively, the causes of this phenomenon lies in that the rapid economic development usually destroys the resources and environment beyond the capacity of the environment, thus reducing the efficiency of green development of the manufacturing industry. Therefore, although the overall economic development plays a positive role in the manufacturing green development efficiency, different regions also need to consider that the economic development should match the environmental carrying capacity.
The influence coefficients of urbanization level on the green development efficiencies of manufacturing industry in the Yangtze River Economic Belt and the upstream, midstream and downstream regions are negative, which are −0.073, −0.293, −0.179 and −0.019 respectively. It is inconsistent with the expectation. On the one hand, the development of urbanization will indeed bring the positive effect of reducing transaction costs and increasing economies of scale, but on the other hand, the technical knowledge level of farmers still needs to be improved, which will affect the quality of human capital. At the same time, the development of urbanization will inevitably lead to the expansion of city scale, thus consuming a large amount of resources, which may be the main reason why the influence coefficient of urbanization level is negative.
Openness to the outside world has a positive effect on the green development efficiencies of manufacturing industry in whole basin, upstream and downstream regions, which is in line with the expectation. Although openness to the outside world has a positive effect on the upstream and downstream regions, the effect is not significant, indicating that manufacturing exports of the Yangtze River Economic Belt are still relatively small, which also confirms that the Yangtze River Economic Belt should still increase the export volume of manufacturing industry and reduce the proportion of energy-intensive products. For the midstream region, the influence coefficient of openness to the outside world is -0.045, which is not in line with the expectation. This may be due to the high energy consumption products in the exports of the midstream region, leading to the low green development efficiency of the manufacturing industry.
Technology marketization level has a positive effect on the green development efficiencies of the manufacturing industry in the Yangtze River Economic Belt and the upstream, midstream and downstream regions, which are 0.059, 0.043, 0.026 and 0.014 respectively. It is consistent with the expectation. Technology marketization level will directly affect the level of technology. According to existing studies, technology level can promote the manufacturing green development efficiency, and the use of technology innovation can solve the problem of resource constraint in the green transformation of manufacturing industry (Peng, 2005).
Foreign investment level has a negative effect on the green development efficiencies of the manufacturing industry in the Yangtze River Economic Belt and the midstream and upstream regions, with the influence coefficients of −0.001, −0.003 and −0.003, which are relatively small, while the influence coefficient on the manufacturing green development efficiency in the downstream regions is 0.023. The downstream region is located in the coastal region, which is more closely connected with the international market and more convenient for foreign investment. Therefore, the foreign investment level in the downstream region has a significant effect on the manufacturing green development efficiency.
Shili Factors Analysis
Energy productivity has a positive effect on the green development efficiencies of manufacturing industry in the upstream, midstream and downstream regions, with influence coefficients of 0.768, 0.266 and 0.740. This shows that the energy productivity has a significantly positive effect on the green development efficiencies of manufacturing industry in all regions. The energy productivity has no significantly negative effect on the green development efficiency of the overall manufacturing industry in the Yangtze River Economic Belt, which may be related to the rebound effect of energy consumption. In general, the manufacturing industry should improve energy productivity, thus promoting the green development of the manufacturing industry (Zhang and Song, 2019).
Labor productivity has a positive effect on the green development efficiencies of manufacturing industry in the Yangtze River Economic Belt, the midstream and upstream regions, with influence coefficients of 0.114, 0.329 and 0.018 respectively. Labor productivity directly affects the production efficiency of enterprises. The improvement of labor productivity will promote the improvement of industrial capacity utilization rate and energy utilization rate, which plays a good role in promoting the manufacturing green development efficiency. Labor productivity has no significantly negative effect on the manufacturing green development efficiency in the downstream region of Yangtze River Economic Belt. Labor productivity is mainly affected by the quality and technical level of laborers. Although labor productivity is relatively high in the downstream region, the high labor cost and large investment in technology research and development affect the manufacturing green development efficiency.
R&d input rate has a negative effect on the green development efficiencies of the manufacturing industry in the Yangtze River Economic Belt, the upstream and downstream regions, with influence coefficients of −0.040, −0.071 and −0.016. The research and development investment rate has less negative effect on the downstream region, but more negative effect on the upstream region and the whole Yangtze River Economic Belt. The reason is that the cost of r&d is huge and the technological innovation dividend brought by r&d investment is not enough to cover the cost of r&d (Wang et al., 2013). The influence coefficient of r&d input rate on the manufacturing green development efficiency in the midstream regions is 0.092, which is related to the relatively low r&d input rate in the midstream region, highlighting the benefits brought by r&d input to some extent.
Energy consumption structure has a negative effect on the green development efficiencies of the manufacturing industry in the Yangtze River Economic Belt and the downstream region, which is in line with the expectation. The influence coefficients are −0.101 and −0.013. The energy consumption structure has a positive effect on the midstream and upstream regions, with influence coefficients of 0.03 and 0.001. For the midstream and upstream regions, the cost of coal acquisition is low and the economic benefits of coal are relatively obvious. However, for the green development of manufacturing industry, midstream and upstream regions should reduce the use of coal and increase the use of clean energy.
Industrial structure has a negative effect on the green development efficiencies of the manufacturing industry in the Yangtze River Economic Belt, midstream and downstream regions, with influence coefficients of −0.153, −0.150 and −0.003, which are in line with the expectation. The industrial structure has a positive effect on the manufacturing green development efficiency in the upstream region, with an influence coefficient of 0.597. The reason is that the economic benefits of the development of heavy industry in the upstream region outweigh the negative environmental effects. The government should formulate strict emission regulations for heavy industry to promote green and sustainable development.
Property rights structure has a negative effect on the green development efficiencies of the manufacturing industry in the midstream and downstream regions, with influence coefficients of −0.026 and −0.031, but they are not significant. The property rights structure has a positive effect on the green development of manufacturing industry in the Yangtze River Economic Belt and the upstream region, with influence coefficients of 0.048 and 0.207. The effect in the upstream region is more significant. It can be seen that the injection of state capital can promote the expansion of upstream enterprises, thus generating economies of scale. Therefore, the higher the proportion of state capital in total paid-in capital, the more conducive to improving the manufacturing green development efficiency.
Renli Factors Analysis
Labor force quality has a positive effect on the green development efficiencies of manufacturing industry in upstream and downstream regions, with influence coefficients of 0.170 and 0.019, which are consistent with the expectation. Generally speaking, the improvement of labor quality can improve employees’ awareness of environmental protection, thus promoting the green development of manufacturing industry. The influence of labor quality on the green development of manufacturing industry in the Yangtze River Economic Belt and the midstream region is negative, with influence coefficients of −0.223 and −0.004, which are inconsistent with the expectation. On the whole, the role of labor quality in promoting the manufacturing green development efficiency in Yangtze River Economic Belt is still not significant, so it is necessary to improve the quality and quantity of talent introduction in manufacturing industry.
Environmental protection strength has a promoting effect on the manufacturing green development efficiency in the downstream region, with an influence coefficient of 0.024, but it is not significant. Environmental protection has a negative effect on the manufacturing green development efficiency in the Yangtze River Economic Belt and the upstream and midstream regions. This is mainly because the environmental damage of the Yangtze River Economic Belt is serious and the initial treatment cost is too large, which has exceeded the environmental benefits it brings. This also shows that the government should continue strengthening environmental protection efforts and improving the environmental protection mechanism.
Energy price has a significantly negative effect on the manufacturing green development efficiency in the Yangtze River Economic Belt, with an influence coefficient of −0.455, which is not in line with the expectation, while the effect on the other three regions is not significant. This shows that energy price has different effects on the manufacturing green development efficiency in different regions. The increase in energy price will not significantly reduce the use of energy consumption in the short term, but will significantly increase the production costs of manufacturing enterprises, thus reducing the economic benefits of manufacturing enterprises. Therefore, when formulating energy price policies, the government should pay more attention to the long-term effect of energy price and give full play to the promoting role of energy price in the green development of manufacturing industry.
Conclusions and Policy Recommendations
In this paper, based on super-SBM model, the fixed assets, labor, energy and water resource of manufacturing industry are set as input variables, the added value of manufacturing industry is desirable output variable, and the emissions of “three wastes of industry” are undesirable output variables. Manufacturing green development efficiencies of 11 provinces and cities in the Yangtze River Economic Belt from 1998 to 2017 are calculated. On the basis of Wuli-Shili-Renli system methodology, the influencing factors of economic development level, urbanization level, and openness to the outside world and so on are selected. It applies a limited dependent variable panel Tobit model to analyze the factors affecting the manufacturing green development efficiency. The results show that there are significant differences in the manufacturing green development efficiency in different provinces and cities. Specific conclusions are as follows:
(1) As a whole, during the statistical period, the mean manufacturing green development efficiency in the provinces and cities of the Yangtze River Economic Belt over the years is 0.812, which is at the medium level of development. The whole Yangtze River Economic Belt has a “U” shaped distribution, that is, the midstream low and the two sides high. From the comprehensive efficiency, the downstream region is higher than the upstream region, and the upstream region is higher than the midstream region. Therefore, from the overall perspective, optimizing the enterprise management model, vigorously developing energy-saving and emission reduction technologies, and formulating appropriate environmental protection policies by the government according to the actual situation are effective measures to improve the manufacturing green development efficiency. The manufacturing industry in the midstream and upstream regions should learn advanced technology and management experience from the downstream region, introduce a large number of high-tech talents, improve the infrastructure and supporting facilities of the manufacturing industry, implement the brand building strategy and enhance the public service capacity. From the results of comprehensive efficiency decomposition, the manufacturing green development efficiency in the Yangtze economic belt presents an overall rising trend. Low scale efficiency is the main reason that restricts the manufacturing green development efficiency. The scale efficiency of the downstream region is significantly higher than that of the upstream region, while the pure technical efficiency of the downstream region is slightly lower than that of the upstream region. Downstream region should continue learning and innovating excellent management models to ensure the quality of manufacturing green development; while expanding the scale of enterprises, the midstream and upstream regions should focus on the quality of manufacturing development and achieve sustainable development.
(2) From the regression results of influencing factors, the effect of economic development level on the manufacturing green development efficiency in the Yangtze River Economic Belt is the most significantly and positively correlated. The urbanization level is negatively correlated with the manufacturing green development efficiency in the Yangtze River Economic Belt and various regions. The openness to the outside world has a positive effect on the manufacturing green development efficiency in the Yangtze River Economic Belt and the upstream and downstream regions, but a negative effect on the midstream regions. The technology marketization level has a significant and positive influence on the Yangtze River Economic Belt and all regions. The foreign investment level has a significantly positive effect on the downstream region, but a significantly negative effect on other regions. The energy productivity has a significantly positive effect on the upstream, midstream and downstream regions. The labor productivity has a significantly positive effect on the Yangtze River Economic Belt and the upstream region. The r&d input rate has a negative effect on the manufacturing green development efficiency in the Yangtze River Economic Belt and the upstream and downstream regions. The energy consumption structure has a negative effect on the manufacturing green development efficiency in the Yangtze River Economic Belt and the downstream region. The industrial structure has a negative effect on the manufacturing green development efficiency in the Yangtze River Economic Belt and the midstream and downstream regions. The property rights structure has a negative effect on the manufacturing green development efficiency in the midstream and downstream regions, but a positive effect on the Yangtze River Economic Belt and the upstream region. The labor force quality has a positive effect on the manufacturing green development efficiency in the upstream and downstream regions, but a negative effect on the manufacturing green development efficiency in the Yangtze River Economic Belt and the midstream region. The environmental protection strength has a significantly positive effect on the manufacturing green development efficiency in the downstream region, while it has a significantly negative effect on the upstream region. The energy price has a significantly negative effect on the manufacturing green development efficiency in the Yangtze River Economic Belt.
It can be seen that various influencing factors have different effects on the manufacturing green development efficiency in different regions. In order to improve the manufacturing green development efficiency and narrow regional differences, Wuli factors should promote high-quality economic development, improve the quality of urbanization, reduce the proportion of energy-intensive products in exports, improve the level of technology marketization and attract high-quality foreign investment; Shili factors should improve the level of energy technology, heighten labor productivity, increase investment in research and development, optimize the energy consumption structure, adjust the structure of industry and property rights; Renli factors should cultivate high-quality personnel, strengthen emission management and rationalize the energy price system. Each region should also formulate corresponding policies based on the specific effects of various influencing factors.
Data Availability Statement
Publicly available datasets were analyzed in this study. This data can be found here: China statistical yearbook, China industrial economic statistical yearbook, China environment statistical yearbook, China's population statistics yearbook and China energy statistical yearbook from 1998 to 2017.
Author Contributions
GL: Conceptualization, Methodology, Software; YZ: Data curation, Visualization, Investigation; FL: Software, Validation, Writing-Original draft preparation; TW: Reviewing and Editing.
Funding
This paper is funded by the Key Projects of National Social Science Fund (No.16AJL008), National Natural Science Foundation of China (No.71503106, No. 71803197), Jiangsu Social Science Fund (No.19EYB016), Jiangsu College Philosophy Social Science Outstanding Innovation Team Construction Project, CSSC Modern Logistics Research Center Project (No.2045081603), Ministry of Education Humanities and Social Sciences Foundation (No. 18YJC630094), Fundamental Research Funds for the Central Universities (No. 31511910801), Soft Science Project 563 of Technological Innovation in Hubei Province (No. 2019ADC029).
Conflict of Interest
The authors declare that the research was conducted in the absence of any commercial or financial relationships that could be construed as a potential conflict of interest.
Supplementary Material
The Supplementary Material for this article can be found online at: https://www.frontiersin.org/articles/10.3389/fenvs.2020.631911/full#supplementary-material.
References
Ban, L., and Yuan, X. L. (2016). Differences in the efficiency of green economy in eight regions of China and spatial influence mechanism. J. Xi’an Jiaot. Univ. 36 (3), 22–30. doi:10.15896/j.xjtuskxb.201603004
Borghesi, S., Cainelli, G., and Mazzanti, M. (2015). Linking emission trading to environmental innovation: evidence from the Italian manufacturing industry. Res. Pol. 44 (3), 669–683. doi:10.1016/j.respol.2014.10.014
Chen, N., Xu, L., and Chen, Z. (2017). Environmental efficiency analysis of the yangtze river economic zone using super efficiency data envelopment analysis (sedea) and tobit models. Energy 134 (9), 659–671. doi:10.1016/j.energy.2017.06.076
Chen, S. Y. (2010). China’s green industrial revolution: an explanation from the perspective of environmental total factor productivity (1980–2008). Econ. Res. J. 45 (11), 21–34+58.
Duman, Y. S., and Kasman, A. (2018). Environmental technical efficiency in EU member and candidate countries: a parametric hyperbolic distance function approach. Energy 147, 297–307. doi:10.1016/j.energy.2018.01.037
Gandhi, N. S., Thanki, S. J., and Thakkar, J. J. (2018). Ranking of drivers for integrated lean-green manufacturing for Indian manufacturing SMEs. J. Clean. Prod. 171, 675–689. doi:10.1016/j.jclepro.2017.10.041
Gu, J. F., and Gao, F. (1998). On the system methodology of physics-matter-human theory from the perspective of management science. Syst. Eng.-Theory and Pract. 18 (8), 2–6.
Gu, J. F. (2011). Practice of the methodology of physical and human systems. Chin. J. Manag. 8 (3), 317–322+355. doi:10.3969/j.issn.1672-884X.2011.03.001
Gu, J. f., Tang, X. J., and Zhu, Z. X. (2007). A review of physics-matter-theory system methodology. J. Trans. Syst. Eng. Infor. Tech. 7 (6), 51–60. doi:10.3969/j.issn.1009-6744.2007.06.007
Guo, W., and Sun, T. (2013). Research on ecological total factor energy efficiency of Chinese industry. Chin. J. Manag. 10 (11), 1690–1695. doi:10.3969/j.issn.1672-884x.2013.11.018
Han, J., and Lan, Q. X. (2012). Measurement of industrial greening degree in China and research on influencing factors. China Population, Resour. Environ. 22 (5), 101–107.
Hu, D. S., and Li, Y. (2012). Regional differences in environmental efficiency assessment and its influencing factors. Finance Econ. 56 (4), 116–124. doi:10.3969/j.issn.1000-8306.2012.04.014
Huang, Y. C., and Shi, Q. P. (2015). Research on regional environmental efficiency and total environmental factors in China -- based on the analysis of SBM model including R&D input. China Population, Resour. Environ. 25 (12), 25–34. doi:10.3969/j.issn.1002-2104.2015.12.004
Jiang, J., and Qu, L. (2020). Evolution and emerging trends of sustainability in manufacturing based on literature visualization analysis. IEEE Acc. 8, 121074. doi:10.1109/ACCESS.2020.3006582
Jing, W. M., and Zhang, L. (2014). Environmental regulation, opening up and the progress of green technology in Chinese industry. Econ. Res. J. 49 (9), 34–47.
Khairunnisa, A. R., Yusof, M. Z. M., Salleh, M. N. M., and Leman, A. M. (2015). The development of energy efficiency estimation system (eees) for sustainable development: a proposed study. Energy Proc. 79, 513–519. doi:10.1016/j.egypro.2015.11.527
Li, G., Liu, J. G., and Li, T. Q. (2019). Study on regional differences of energy ecological efficiency in manufacturing industry with undesired output considered - a two-stage analysis based on SBM and Tobit models. Chinese Journal of Management Science 27 (11), 76–87. doi:10.16381/j.cnki.issn1003-207x.2019.11.008
Li, J., and Lin, B. (2017). Ecological total-factor energy efficiency of China's heavy and light industries: which performs better?. Renew. Sustain. Energy Rev. 72 (2), 83–94. doi:10.1016/j.rser.2017.01.044
Li, L., and Zhang, J. (2016). Differences and decomposition of industrial green development in the Yangtze River Economic Belt - a comparative study of 108 cities from 2004 to 2013. Soft Sci. 30 (11), 48–53. doi:10.13956/j.ss.1001-8409.2016.11.11
Lin, B. Q., and Liu, H. C. (2015). Whether foreign trade is conducive to improving energy and environmental efficiency - a case study of China’s industrial sector. Econ. Res. J. 50 (9), 127–141.
Lu, W., and Zhao, Y. F. (2016). Study on regional environmental efficiency evaluation and influencing factors in China. J. Beijing Univ. Aeronaut. Astronaut. 29 (3), 30–35. doi:10.13766/j.bhsk.1008-2204.2015.0127
Luo, J. Q., Li, W. P., Zhao, Y. P., and Cheng, F. X. (2017). Research on service derivative status of manufacturing enterprises based on WSR and its evaluation. Manag. Rev. 29 (6), 129–140.
Meng, F. S., and Zou, Y. (2018). Dynamic evaluation of energy eco-efficiency based on PP-SFA—take the 30 autonomous regions of China as an example. Syst. Eng. 36 (5), 47–56.
Nukman, Y., Farooqi, A., Al-Sultan, O., Alnasser, A. R. A., and Bhuiyan, M. S. H. (2017). A strategic development of green manufacturing index (GMI) topology concerning the environmental impacts. Procedia engineering 184, 370–380. doi:10.1016/j.proeng.2017.04.107
Peng, G. H. (2005). Analysis of income gap, total factor productivity and its convergence in China. Econ. Res. J. 15 (9), 19–29.
Singh, C., , Singh, D., and Khamba, J. S. (Forthcoming 2020). Understanding the key performance parameters of green lean performance in manufacturing industries. Mater. Today: Proceedings doi:10.1016/j.matpr.2020.06.328
Singh, M., , Singh, K., and Singh Sethi, A. (Forthcoming 2020). A pilot study on relation between various input parameters of green manufacturing and business performance parameters in Indian SME’s. Mater. Today: Proceedings 33, 1493. doi:10.1016/j.matpr.2020.02.752
Sun, C. Z., Jiang, K., and Zhao, L. S. (2017). Measurement and spatial pattern of green efficiency of water resource in China. J. Nat. Resour. 32 (12), 1999–2011. doi:10.11849/zrzyxb.20161076
Vrchota, J., Pech, M., Rolínek, L., and Bednář, J. (2020). Sustainability outcomes of green processes in relation to industry 4.0 in manufacturing: systematic review. Sustainability 12 (15), 5968. doi:10.3390/su12155968
Wang, K. L., Liu, Y., Shi, L. J., Liu, L., Meng, X. R., and Yang, B. C. (2017). Spatio-temporal differentiation and influencing factors of green water resource efficiency in the Yangtze River Economic Belt industry-two-stage analysis based on ebm-tobit model. Resour. Sci. 39 (8), 1522–1534. doi:10.18402/resci.2017.08.09
Wang, K. L., Yang, L., Yang, B. C., and Cheng, Y. H. (2013). Energy economic efficiency, energy environmental performance and regional economic growth. Journal of Management Science 26 (3), 86–99. doi:10.3969/j.issn.1672-0334.2013.03.009
Wang, X., Zhang, L., Qin, Y., and Zhang, J. (2020). Analysis of China’s manufacturing industry carbon lock-in and its influencing factors. Sustainability 12 (4), 1502. doi:10.3390/su12041502
Wang, Z. P., Tao, C. Q., and Shen, P. Y. (2014). Research on regional green technology efficiency based on ecological footprint and its influencing factors. China Population, Resources and Environment 24 (1), 35–40. doi:10.3969/j.issn.1002-2104.2014.01.006
Wei, C., and Zheng, X. Y. (2017). A new perspective on energy efficiency - based on market segmentation test. Soc. Sci. China 38 (10), 90–111+206.
Wu, C. Q., and Du, Y. (2018). Research on the influence of biased technological progress on total factor energy efficiency of the Yangtze River Economic Belt. China Soft Sci. 33 (3), 110–119. doi:10.3969/j.issn.1002-9753.2018.03.011
Wu, Y. Z., and Wen, Y. C. (2013). Industrial green productivity, emission reduction performance and emission reduction cost in China. Sci. Res. Manag. 34 (2), 105–111+151.
Yi, M., Li, G., Peng, J. C., and Chen, W. L. (2018). Spatiotemporal differentiation of green total factor productivity in the Yangtze River Economic Belt. Manag. World 34 (11), 178–179. doi:10.3969/j.issn.1002-5502.2018.11.018
Yuan, Y. J., and Xie, R. H. (2015). FDI, environmental regulation and China’s industrial green total factor productivity growth: an empirical study based on the Luenberger index. J. Inter. Trade 41 (8), 84–93.
Zhang, F., and Song, X. N. (2019). Decoupling and equilibrium relationship between environmental regulation, resource endowment and green growth of manufacturing. Science of Sci. Manag. S.& T. 40 (4), 32–47.
Zhang, J., , Qu, X., and Sangaiah, A. K. (2018). A study of green development mode and total factor productivity of the food industry based on the industrial Internet of things. IEEE Commun. Mag. 56 (5), 72–78. doi:10.1109/MCOM.2018.1700789
Zhang, J. X., and Wang, X. W. (2013). Study on the green growth index of China’s regional industry and its influencing factors. Soft Science 27 (10), 92–96. doi:10.3969/j.issn.1001-8409.2013.10.020
Zhang, J., and Zhang, Y. (2003). Re-estimation of capital stock K in China. Econ. Res. J. (7), 35–43.
Zhang, W. (2016). Ways to realize green and low-carbon modern industrial system and influencing factors. Sci. Res. Manag. 37 (S1), 426–432.
Zhang, Y. H., , Chen, J. L., and Cheng, Y. (2018). Research on the influence mechanism of environmental regulation on the efficiency of regional green economy in China - empirical analysis based on super-efficiency model and spatial panel econometric model. Resour. Environ. Yangtze Basin 27 (11), 2407–2418. doi:10.11870/cjlyzyyhj201811002
Zhao, X., Liu, C., and Yang, M. (2018). The effects of environmental regulation on China's total factor productivity: an empirical study of carbon-intensive industries. J. Clean. Prod. 179, 325–334. doi:10.1016/j.jclepro.2018.01.100
Zhou, W. Q., and Wu, G. (2013). Differences in sources of green TFP growth and its impact on industrial carbon productivity - an empirical analysis based on China’s inter-provincial panel data. Modern Finance and Economics-Journal of Tianjin University of Finance and Economics 33 (12), 38–47. doi:10.19559/j.cnki.12-1387.2013.12.004
Keywords: manufacturing industry, green development efficiency, WSR methodology, super-SBM model, tobit model
Citation: Li G, Zhou Y, Liu F and Wang T (2021) Regional Differences of Manufacturing Green Development Efficiency Considering Undesirable Outputs in the Yangtze River Economic Belt Based on Super-SBM and WSR System Methodology. Front. Environ. Sci. 8:631911. doi: 10.3389/fenvs.2020.631911
Received: 24 November 2020; Accepted: 24 December 2020;
Published: 18 February 2021.
Edited by:
Yongping Sun, Hubei University of Economics, ChinaReviewed by:
Yongbing Chen, Xiamen University, ChinaQingping Jin, Wuhan University of Science and Technology, China
Copyright © 2021 Li, Zhou, Liu and Wang. This is an open-access article distributed under the terms of the Creative Commons Attribution License (CC BY). The use, distribution or reproduction in other forums is permitted, provided the original author(s) and the copyright owner(s) are credited and that the original publication in this journal is cited, in accordance with accepted academic practice. No use, distribution or reproduction is permitted which does not comply with these terms.
*Correspondence: Fan Liu, ZmFubGl1c2ZzdUBnbWFpbC5jb20=