- 1Environmental Science Center, University of Augsburg, Augsburg, Germany
- 2Institute of Geography, University of Augsburg, Augsburg, Germany
- 3Vaisala GmbH, Hamburg, Germany
- 4Helmholtz Zentrum München, German Research Centre for Environmental Health, Institute of Epidemiology, Neuherberg, Germany
- 5Bavarian Environment Agency, Augsburg, Germany
Ultrafine particles (UFP; diameter less than 100 nm) are ubiquitous in urban air, and an acknowledged risk to human health. At the same time, little is known about the immission situation at typical urban sites such as high-traffic roads, residential areas with a high amount of solid fuels for home heating or commercial and industrial areas due to missing legal requirements for measurements of UFP. Therefore, UFP were measured and evaluated in the (sub-)urban background as well as on spots influenced by these various anthropogenic local sources in the city of Augsburg, Germany, for the year 2017. In particular, the spatial and temporal correlations of the UFP concentrations between the seven measurement sites, the quantification and valuation of the contribution of local emitters with regard to their diurnal, weekly and seasonal variations and the influence of meteorological conditions on the formation and dispersion of UFP were investigated. Our analysis results demonstrate that urban UFP concentrations show a pronounced temporal and spatial variability. The mean concentration level of UFP varies between below 8,000 ultrafine particles/cm3 at the suburban background site and above 16,700 ultrafine particles/cm3 at the measurement station located next to a busy street canyon. At this particularly traffic-exposed measurement station, maximum concentrations of over 50,000 ultrafine particles/cm3 were measured. The additional UFP load caused by intensive traffic volume during evening rush hour in connection with the unfavourable exchange processes in the street canyon can be quantified to concentrations of 14,000 ultrafine particles/cm3 on average (compared to the immission situation of the urban background). An aggravating effect is brought about by inversion weather conditions in connection with air-polluted easterly winds, low wind speeds, lack of precipitation and very low mixing layer heights, such as over Augsburg at the end of January 2017, and cause peak concentrations of UFP.
Introduction
Ultrafine Particles (UFP) are particles with a diameter of less than 100 nm (0.1 μm). Their concentration is usually expressed in number of particles per cm3. UFP are mainly caused by combustion processes (e.g. soot particles) and by photochemical formation (nucleation of gas molecules under the influence of intense solar radiation) (Kulmala et al., 2004; Seigneur 2009).
In terms of the total number of particles present in the environment, UFP account for the largest proportion. In an urban background site that is typical of a larger urban area and therefore representative of a large part of the population (integrated contribution of all UFP sources, i.e. not one predominant source), UFP account for around 80–90% of the total number of particles (Kreyling et al., 2003; Tuch et al., 2003; Chen et al., 2020). Measurements show that the proportion of UFP in the total number of particles increases with increasing proximity to the emission source and can reach up to 95% near the source (Piriola et al., 2006). The total number of particles and UFP are highly correlated (De Hartog et al., 2005; Peters et al., 2009), so that the total number of particles is a suitable indicator for describing UFP loads, both for sites far from the source and for sites with typical anthropogenic emitters (vehicle traffic, heating systems or industrial processes).
Epidemiological and toxicological studies show the harmful effects of particles entering the body from the air (Seaton et al., 1995). As particles in the environment are a highly complex and dynamic mixture of different chemical substances with different concentrations, composition, size and shape, a differentiated health effect of the particles results - due to the different toxicity of the components (Cohen et al., 2017). Due to the wide size spectrum from several micrometers (PM10 or PM2.5) to the nanometer range (UFP), the residence times of the different particle fractions in the respiratory tract and thus the places of action in the body are very different (Heyder, 2004). In particular, UFP can penetrate into the periphery of the lung, overcome cellular membranes and thus directly enter the blood, with an associated increased risk of heart attacks and strokes (Rückerl et al., 2011). Once in the blood, UFP can ultimately reach all body organs including the brain (Environment Agency, 2018). Thus, UFP are suspected of posing a greater risk to health than the larger fractions of particulate matter (Schulz et al., 2018). Studies also show a relationship between UFP and cardiovascular and respiratory morbidity and mortality, as well as with the development of local and systematic inflammatory processes (Health Effects Institute 2013; Chen et al., 2020).
Due to these negative health effects, UFP come more and more to the focus of public perception, increasing questions regarding measurements, characteristics and evaluations. Against this background, the German Ultrafine Aerosol Network (GUAN) was launched in 2008. Through the cooperation of different research institutes and authorities, UFP are measured routinely and quality-assured in outdoor air at currently 17 locations in Germany (Birmili et al., 2014; Birmili et al., 2016). Three of the locations of the GUAN measurement network are located in Bavaria: in Augsburg, at Hohenpeißenberg and on the Zugspitze. The UFP data continuously collected there therefore either contain the integrated contribution of all city sources (urban background) or represent global background data without the influence of anthropogenic sources.
UFP parameters for other typical urban sites, such as on strongly traffic exposed inner-city streets with “ravine-like” roadside structures, in industrial or commercial areas, in residential areas with an increased proportion of solid fuel combustion for heating purposes (fireplaces) or in areas without dominant sources are not yet available for Bavaria. Due to these missing measurements, it is not possible to make any statements about the UFP exposure situation to which the population there is exposed for at least a certain period of time. This is where the present research project started by collecting and evaluating UFP parameters in the (sub-)urban background as well as in the catchment areas of various anthropogenic local sources, in the city of Augsburg over the calendar year 2017. The goals of our study are the analysis of the spatial and temporal correlations of UFP exposure between the seven sites as well as to other air pollutants and meteorological parameters, the quantification and evaluation of the contribution of locally prevailing sources and the influence of meteorological conditions on the formation and spread of UFP.
Outside of Bavaria, such multiple-site intra-city UFP monitoring studies were already carried out and suggest in summary that mean UFP concentrations can range by an order of magnitude (Kumar et al., 2014). For instance, a marked spatial variability in the UFP concentrations at different locations within busy areas of cities were detected in central London, UK (Kaur et al., 2005), Cassino, Italy (Buonanno et al., 2011), Antwerp, Belgium (Mishra et al., 2012), Brisbane, Australia (Mejia et al., 2008) and Dresden, Germany (Birmili et al., 2013). The large spatial variability of UFP concentrations measured at these and other cities around the world (e.g. Kumar et al., 2014) is the result of numerous factors all together affecting the emission and dispersion situation of UFPs. For up to ∼35% of the total particle number concentrations in roadside environment the differences in the experimental setup, for example, the lower cut-off size for the measurement, can account (Kumar et al., 2009). Another aspect is the distance of the measurement location away from the road (Fujitani et al., 2012). Seasonal effects (e.g. temperature inversion) influence the spatial variations, too. Last but not least, local factors including traffic volume, fuel type, urban morphology, climate, dispersion circumstances, and uncertainty in the measurements due to manual and mechanical errors complete the list of the numerous factors affecting the observed variability (Kumar et al., 2014). This wide range of influencing factors underlines the need for city-specific studies since the results from measurement campaigns in other (distant) cities couldn't be transferred. Therefore, we collected and analysed UFP parameters in the (sub-)urban background as well as in the catchment areas of various anthropogenic local sources for the first time in a Bavarian city with indicative measurements over the calendar year 2017.
Materials and Methods
Study Area
Located at the confluence of the Alpine rivers Lech and Wertach, Augsburg is currently the third largest city in Bavaria, Germany and the capital of the Swabian government district. With a total area of 147 km2, the largest extent is 23 km in north-south direction. The approximately 300,000 inhabitants (as of 31-12-2019) of the city of Augsburg occupy about a quarter of this area, while another quarter of the city area can be assigned to usage categories agriculture and forest, respectively. The remaining quarter is mainly divided between areas for transport, recreation and water (City of Augsburg, 2017).
The number concentrations of particles in a size range of 7 nm to 2 μm were measured with three mobile UFP measuring instruments, which also record meteorological parameters, at six selected locations in Augsburg. Based on the categorization of the measurement sites in the 39th Ordinance on the Implementation of the Federal Immission Control Act (39. BImSchV) the indicative measurements took place at the following location categories:
• Suburban Background
• Urban Background
• Close to the road (traffic-related, high/low load)
• Residential area (high proportion of solid fuel combustion)
• Industrial/Commercial Area
For the indicative measurements, the minimum measurement period of 8 weeks (evenly spread over the year) together with a minimum data collection of 90% according to Appendix 1 of the 39. BImSchV is met. Between the measurement phases, regular checks of the mobile measuring equipment were carried out at the Augsburg aerosol measurement station (Pitz et al., 2008), which is operated jointly by the Environmental Science Center of the University of Augsburg and the Helmholtz Zentrum München, in order to ensure the quality and resilience of the UFP data with regard to long-term stability and traceability to a uniform standard.
Measurement Sites
The UFP measurements with the mobile measurement equipment took place at the following six sites within the city area of Augsburg:
• Bavarian Environment Agency (Landesamt für Umwelt, LfU): suburban background
• Bourges-Platz: urban background
• Karlstraße: traffic-related, high load
• Königsplatz: traffic-related, low load
• Kriegshaber: residential area with a high proportion of solid fuel combustion (Bavarian Environment Agency, 2009)
• Environment Institute bifa: industrial/commercial area with waste incineration plant including the typical heavy-duty traffic
At four of these sites (LfU, Bourges-Platz, Karlstraße and Königsplatz), measurement stations of the Bavarian Air-Hygienic Surveillance System (Lufthygienisches Landesüberwachungssystem Bayern, LÜB) are operated, at which fine particles (PM2.5, PM10) and gaseous air pollutants are measured. This enables the exploration of the correlation between UFP and already regulated air pollutants. Details of the LÜB measurement stations can be found at the following link: https://www.bestellen.bayern.de/shoplink/lfu_luft_00207.htm.
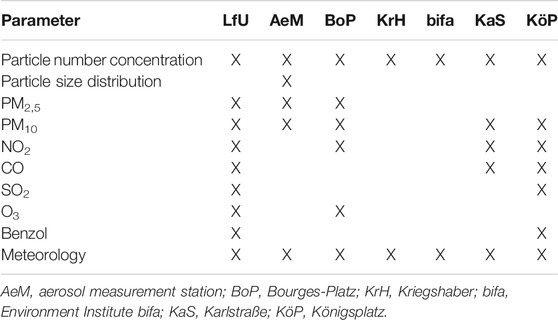
In the context of quality assurance, regular comparative measurements were carried out at the aerosol measurement station on the campus of the Augsburg University of Applied Sciences, which is operated since 2004 by the Environmental Science Center of the University of Augsburg and the Helmholtz Zentrum München. The measurements run here show a decreasing trend of (ultrafine) particle number concentrations since 2006 due to reduced sulphur content in diesel and petrol together with the continued improvement from Euro 5 passenger cars uptake (de Jesus et al., 2020). The aerosol measurement station serves as a reference for the temporal adjustment of the mobile measurements and at the same time acts as the seventh measurement site. For more information including pictures and maps about all seven sites of the measurement campaign see Giemsa et al., 2020 (in German). All locations of the measurement campaign are shown on the map in Figure 1. Table 1 shows which key parameters were measured at the respective measuring sites in 2017.
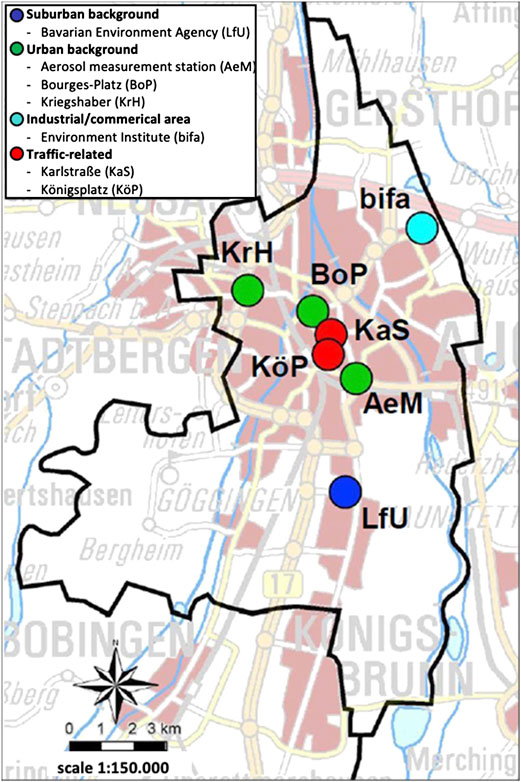
FIGURE 1. Overview map of the locations in the city area of Augsburg, where UFP measurements were carried out during the measurement campaign 2017.
Measurement Techniques
Mobile Measurement Equipment
Three mobile measuring systems of type Environmental Dust Monitor (EDM) 465 based on the Ultrafine Particle Counter (UFPC) product line from Grimm are used at the measurement sites. The EDM 465 UFPC has been developed for the continuous measurement of the total particle load of the outdoor air up to the nanometer range and records these in the measuring range from 7 nm (50% detection efficiency) to 2,000 nm (2 μm). It meets the recommendations of the standard working group CEN/TC 264/WG 32 for an environmental condensation particle counter with regard to counting efficiency, drying properties and particle losses in the supply line. The measuring principle is based on the so-called heterogeneous condensation of supersaturated butanol vapour on the surface of the particles. The particles serve as condensation nuclei and grow due to the supersaturation with butanol vapour to size ranges, which can be counted by optical detection. In addition, the EDM 465 UFPC is equipped with sensors for the detection of the meteorological parameters temperature, relative humidity, precipitation, air pressure, wind direction and wind speed (Grimm Aerosol Technik GmbH & Co. KG 2014).
Stationary Measuring Instruments
To check the quality and resilience of the UFP data from the field measurement phase with regard to long-term stability and traceability to a uniform standard as well as to supplement it with additional measurement variables, the data from the stationary measuring instruments of the Augsburg aerosol measurement station are used. An overview of the measuring instruments and parameters used is given in Table 2. The measuring instruments listed there provide a wide range of air quality parameters, which are continuously recorded, aggregated, processed and quality tested (for detailed explanations of the individual procedures see Pitz et al., 2008; Pitz 2010; Gu et al., 2011). In addition to the mobile UFP measurements, the data from the Augsburg aerosol measurement station thus provide a profound data basis for quality assurance in the course of the comparison measurements.
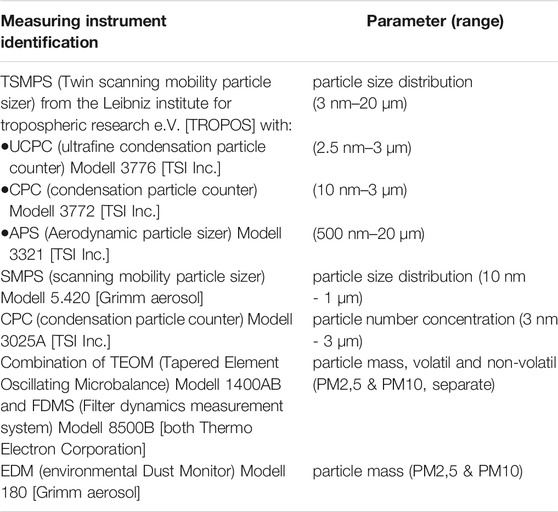
TABLE 2. Overview of the stationary measuring instruments of the Augsburg aerosol measurement station.
Measurement Periods
Evenly distributed over the calendar year 2017, a total of eight field measurement phases each over a period of four weeks were carried out with the EDM 465 UFPC mobile measuring instruments at the above mentioned sites. Since only three EDMs were available, they had to switch their operation site after two weeks during each field measurement phase. For quality control, comparative measurements were made with the mobile UFPCs at the Augsburg aerosol measurement station. These began before the first field measurement phase and were then repeated regularly after each field measurement phase. The aim was to evaluate the data of the mobile measuring instruments among themselves and against the standard of the Aerosol measurement station. This process of the measurement campaign ensures that the criteria of indicative measurements according to Appendix one of the 39th BImSchV were met (measurements are evenly distributed over the year with a minimum measurement duration of 8 weeks and a minimum data collection of 90%).
All in all, over 2,600 hourly mean values were available for each site over all eight field measurement phases, so that UFP concentrations for each of the seven sites cover over 30% of the calendar year 2017. This comprehensive data base enables meaningful analyses of the spatial and temporal distributions of ultrafine particles at urban locations in the catchment area of typical urban sources.
Quality Assurance
Several days of parallel measurements of the three mobile UFPCs were used for quality control. The measurements began before the first field measurement phase and were repeated regularly after each field measurement phase at the Augsburg aerosol measurement station. After each of these altogether nine comparative measurements, the data of the parallel operation of the three EDMs as well as the stationary measurement instruments of the aerosol measurement station were immediately evaluated and summarized in status reports in order to be able to assess the functionality and usability of the mobile UFPCs for the next measurement campaign in a timely manner. These status reports mainly contain information on the measurement phase as well as preliminary statistical analyses like the calculation of time series and correlations. If these preliminary evaluations would have revealed evidence of deviations from the normal operation of the mobile measuring instruments, additional maintenance or repairs would have been initiated.
In addition to the routine status reports, which were regularly produced during the ongoing measurement campaign in 2017, a detailed evaluation of the measurement data from the parallel operation of the mobile measuring instruments at the Augsburg aerosol measurement station took place after the completion of the entire measurement campaign. The data of the nine parallel measurement periods are checked for their homogeneity and continuity by means of descriptive statistical methods and measures. Individual correction factors for each measuring instrument and each field measurement phase were finally derived from the comparison measurements. This ensures the comparability of the measurement results from the field measurement phases as well as traceability to a standard.
The hourly averages of the standard of the aerosol measurement station, which are formed from the mean values of the stationary particle size spectrometers (see Table 2), serve as the basis for traceability to a standard and as an adequate foundation for comparison. For the comparison measurements, the particle number concentration for the measuring range of the mobile EDMs (7 nm – 2 μm) is calculated from the size distributions of the stationary measuring instruments as sum parameters on an hourly basis. The mean value from the stationary measured values of the particle size spectrometers is assumed to be the standard.
In total, the comparative measurements comprise 1,155 hourly mean values, for which all three mobile EDM 465 UFPCs as well as the stationary instruments of the Augsburg aerosol measurement station recorded data in parallel. These comprehensive parallel measurements are spread over the entire calendar year 2017 and therefore form a meaningful database for the analysis and evaluation of long-term stability, quality and resilience of the mobile UFP measurements.
Detailed statistical studies were carried out for the evaluation of the comparative measurements, which can be summarised as follows:
• The mobile measuring instruments among each other show high Spearman correlation coefficients of r > 0.99 on an hourly basis over all comparative periods. Compared to the standard of the aerosol measurement station, the mobile instruments achieve Spearman correlation coefficients of r > 0.98. This proves that the temporal variations in the number of particles for both small (<1,000 particles/cm3) as well as high (>35,000 particles/cm3) concentrations are very well mapped by the mobile measuring instruments.
• Comparisons of the hourly mean values of mobile instruments show average deviations of 3–8% over all reference periods and an average of 3–12% to the standard of the aerosol measurement station.
• The consistently positive results of the statistical analysis of the comparative measurement data confirm great comparability of the mobile measuring instruments during the field measurement phases. They also enable the calculation of measuring instrument specific correction factors, which further increase the comparability of the mobile measuring instruments.
• The calculated correction factors differ only marginally for the eight field measurement campaigns. Depending on the field measurement period, they amount from about +3 to +11% for the mobile measuring instrument no. 1, about −3 to −8% for the mobile measuring instrument no. 2 and about +2 to +4% for the mobile measuring instrument no. 3. By applying the correction factors, it is ensured that differences during the field measurement phases fully arise from the influence of weather conditions or site-specific emitters and are not caused by the individual mobile measuring instrument.
Spatial and Temporal Variations
Coefficient of Divergence
In order to determine the spatial heterogeneity or homogeneity of two measurement sites, the coefficient of divergence (COD) is calculated as follows (Wongphatarakul et al., 1998):
Here, xia and xib are two (simultaneous) measurements at the two sites a and b to be compared with each other, while n is the total number of these measurement value pairs. If the spatial variations of the two sites coincide, then CODa,b = 0. If they are completely different, then CODa,b = 1. A COD value of 0.2 is considered to be the limit below which the measured UFP concentrations of two locations are regarded to be similar or to be influenced by similar source types of comparable intensity, while COD values greater than 0.2 imply spatial heterogeneity and thus the influence of different emitters at the two sites (Krudysz et al., 2008). In this way, the divergence coefficient gives information on the relative degree of uniformity or difference of two measurement sites.
Spearman Correlation Coefficient
The Spearman rank correlation coefficient r is a classical empirical measure to quantify the relationship between two variables and indicates how much the temporal variations of the UFP concentrations of two sites coincide. The advantages of the Spearman rank correlation coefficient are its independence from the normal distribution of the data as well as its robustness against outliers. For two (simultaneous) measurements xia and xib at the two comparative sites a and b, the Spearman rank correlation coefficient is calculated via their rankings R(xia) and R(xib) according to the following formula (Sharma 2005):
If r = 1, the temporal variations of the UFP measurements at the two locations are the same, while for r = 0 there is no correspondence.
Results
Site-specific Ultrafine Particles Characteristics
The results of the eight field measurement phases of the UFP measurement campaign 2017 are shown in Figure 2 as site-specific time series. Significantly dissimilar concentration levels of the different site categories according to the locally prevailing sources can be seen. Nevertheless, a temporal correlation between the UFP concentrations appears at all measurement sites, which is not covered by the site-specific UFP emissions from local sources. This becomes particularly clear when the results of the eight field measurement phases are aggregated as UFP daily mean values (see Figure 3). The representation of the daily UFP concentrations differentiated according to the measurement locations shows strong correlations in the temporal variations of the number of particles per cm3, which indicate a supra-regional influence by meteorology and/or long-distance transport. These influences lead to the fact that different UFP concentration levels are measured at the individual sites due to varying local emitters, but these are overprinted by the same meteorological influences at all locations in relative synchronicity. This supra-regional influence of the UFP measurements is most evident in the day-to-day variations, which cause the concentration levels at all stations to vary to the same extent.
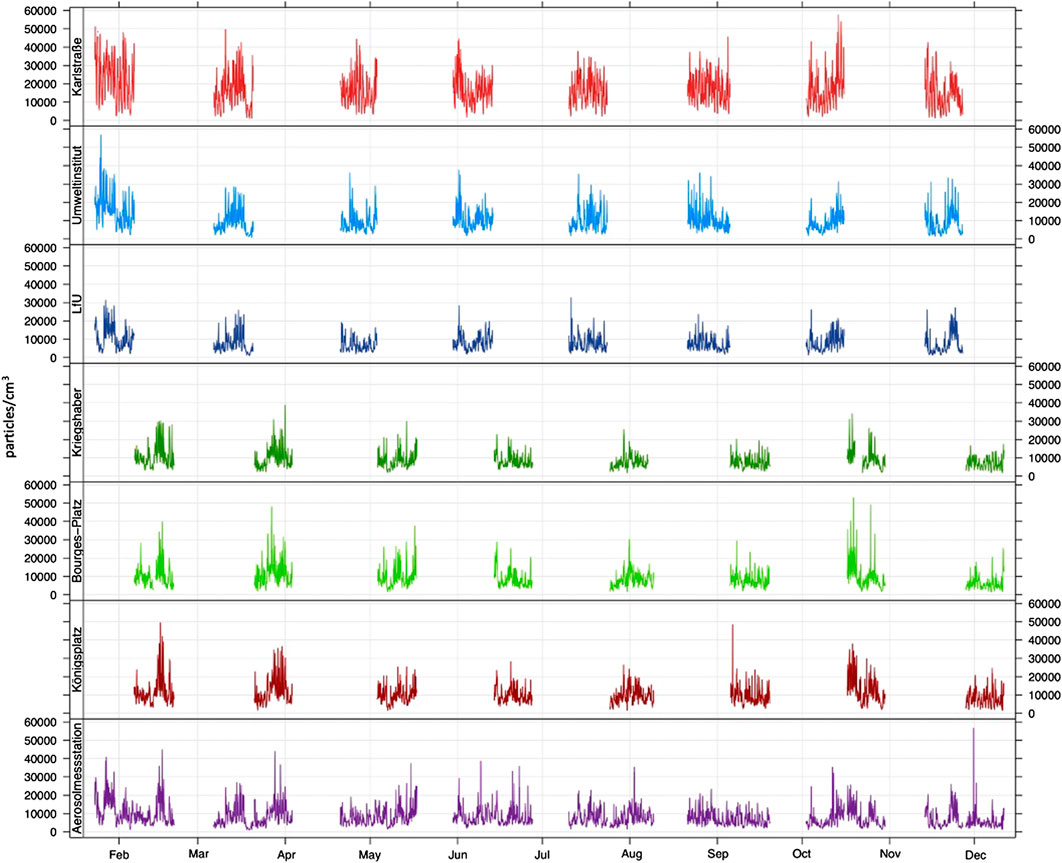
FIGURE 2. Time series of the hourly UFP number concentrations in particles/cm3 from the eight field measurement phases of the measurement campaign 2017.
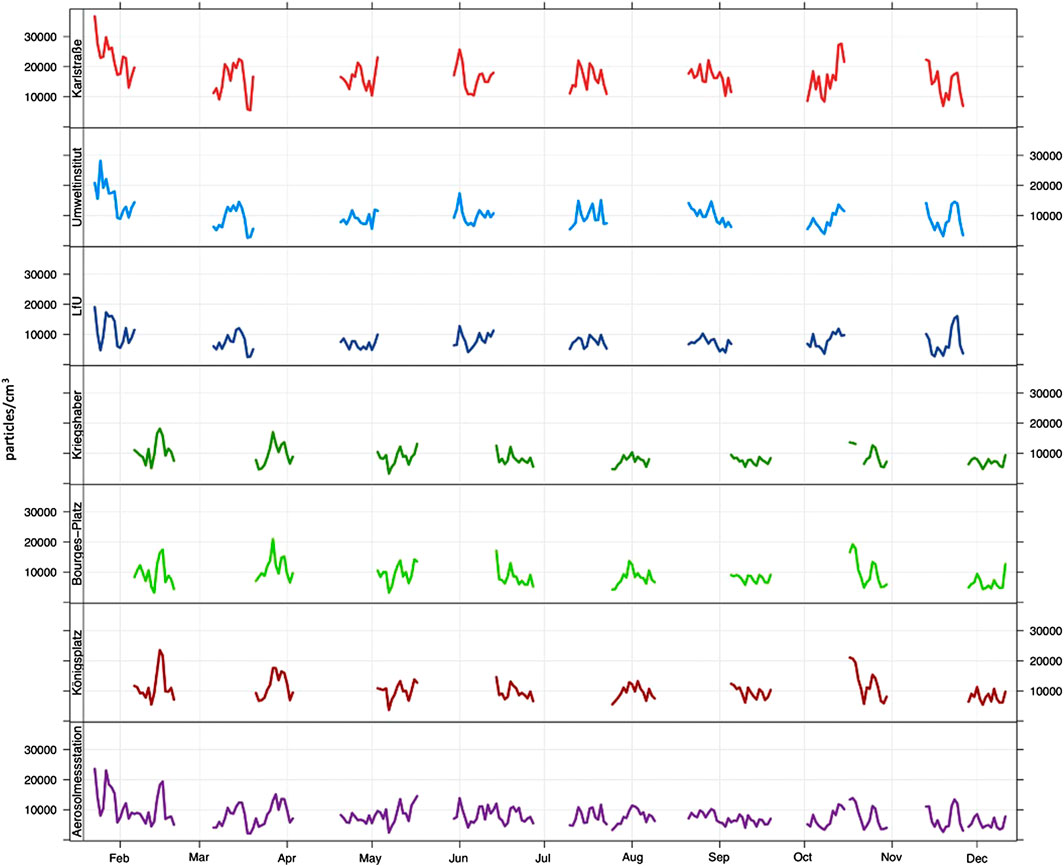
FIGURE 3. Time series of the daily UFP number concentrations in particles/cm3 from the eight field measurement phases of the measurement campaign 2017.
In Table 3 the descriptive statistical parameters of the hourly UFP concentrations obtained during the measurement campaign 2017 are shown. Since the measurements couldn't take place at the seven sites simultaneously and not all year round, the comparability of the measurement results was assessed beforehand by a sensitivity study indicating that the measurements could be interpreted as annual mean values. At the traffic-influenced measurement sites as well as at the industrial/commercial area, values of more than 10,000 ultrafine particles/cm3 are measured on average throughout the entire measurement campaign. The concentration level rarely falls below 3,000 particles/cm3 (5th percentile) and reaches maximum levels (95th percentile) of more than 20,000 particles/cm3. At the highly traffic-exposed Karlstraße even more than 34,000 particles/cm3 are recorded. At the other locations in the (sub-)urban background, lower UFP concentrations occur, ranging on average between nearly 8,000 and nearly 9,000 particles/cm3. The spread of variation between the 5th and 95th percentile ranges from 2,600 to over 19,000 particles/cm3. Depending on the locally prevailing sources and the correspondingly different concentration levels at the individual sites, the standard deviation as a measure of the spread of the measured UFP concentrations amounts to values between 4,500 and over 9,000 particles/cm3.

TABLE 3. Descriptive statistics of the UFP number concentrations in particles/cm3 (The comparability of the partial non-simultaneous measurement results was assessed beforehand by a sensitivity study indicating that the measurements could be interpreted as annual mean values).
The graphical representation of further statistical distribution parameters is shown in Figure 4. The box-whisker plots of the particle number concentrations of the measurements at the locations clearly show the differential measurement results of the individual sites in terms of location measures (median and quartile values) and dispersion measures (range and interquartile distance). The lowest concentration levels of UFP exposure are observed at the (sub-)urban background sites, with the lowest mean concentrations measured at the LfU and the aerosol measurement station. Here, the measured UFP concentrations usually remain below 10,000 particles/cm3 (75% quartile) and rarely exceed the 20,000 particle/cm3 mark. On the other hand, the traffic-influenced sites (Karlstraße and Königsplatz) as well as the commercial/industrial site Bifa-Umweltinstitut clearly show the concentration-increasing effect of the predominant emitters there. At these three sites, an hourly average of more than 10,000 or 16,700 (Karlstraße) particles/cm3 are measured, respectively. It is not uncommon that the measurements lay above 20,000 particles/cm3 there. At the particularly traffic-exposed site Karlstraße, maximum values of over 50,000 particles/cm3 are measured during the measurement campaign, whereas the maximum at the suburban background site is 30,000 particles/cm3.
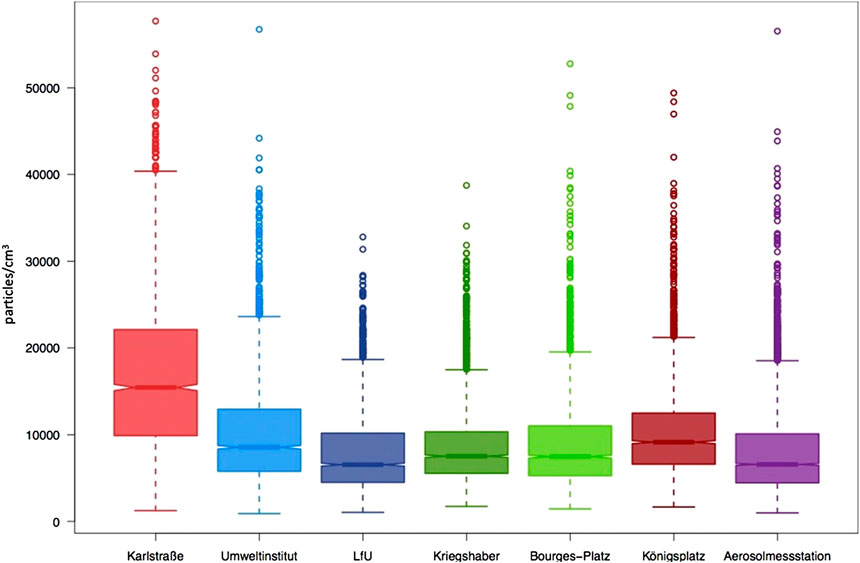
FIGURE 4. Box-whisker plots of the UFP number concentrations differentiated according to the measurement sites.
In addition to the box-whisker plots, the probability density functions shown in Figure 5 convey a visual impression of the distribution of the hourly averaged UFP measurements at each site. It can be clearly seen that at the (sub-)urban background sites at LfU and the aerosol measurement station, the measured concentrations are most densely concentrated in the region of around 5,000 particles/cm3. This peak has shifted further to higher UFP concentrations at the urban background sites of Kriegshaber and Bourges-Platz, which are more influenced by sources such as traffic and house fire. According to the increasing influence of sources at the traffic-related sites and the commercial/industrial area at the measurement stations Königsplatz, Karlstraße and Bifa-Umweltinstitut an even stronger shift in the peak of the most frequently measured values to higher UFP concentrations appears. At the strongly traffic-influenced measurement station Karlstraße, this peak is already beyond the 10,000 particle/cm3 mark. In addition, the probability density function of the measured concentrations there is significantly flattened to the right - in contrast to the other locations - as higher UFP concentrations occur more frequently. This means that the distribution of the UFP number concentrations in Karlstraße differs significantly from that of the other sites, which is due to the influence of emissions from the high load of traffic in combination with unfavourable dispersion conditions (street canyon). Overall, all sites have individual distributions of their measured concentrations according to the different influences of local sources. The only exceptions to this are the (sub-)urban background sites at LfU and the aerosol measurement station, where very similar UFP concentrations are detected during the measurement campaign, which show up in approximately congruent distribution functions.
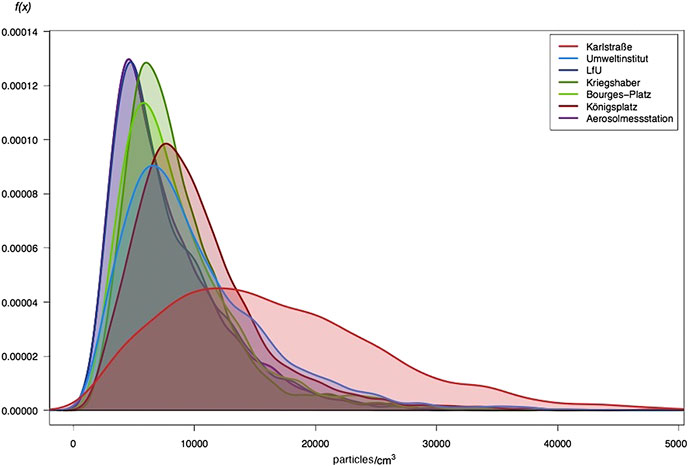
FIGURE 5. Probability density functions of the UFP number concentrations differentiated according to measurement sites.
Spatial Heterogeneity
The coefficients of divergence (COD) between the hourly averaged UFP measurements of all sites are shown in Figure 6 and provide information about the spatial heterogeneity or homogeneity, respectively of the measuring locations (see chapter Coefficient of Divergence). As an aid to interpretation, the COD values are coloured according to the 0.2 limit mark, so that a high homogeneity value between the UFP concentrations of two sites is recognizable in a red coloured field, while a blue field symbolizes heterogeneous UFP concentrations of two sites. Based on this colour scheme, it is easy to see that the UFP concentrations of measuring stations of the same site categorie exhibit low COD values and thus low spatial differences. For example, the measurement sites Kriegshaber and Bourges-Platz (COD = 0.14) as well as the background locations LfU and the aerosol measurement station (COD = 0.15) are particularly similar. The latter high correlation between the two (sub-)urban background sites is in very good agreement with a former study carried out fifteen years before in Augsburg (Cyrys et al., 2008). In contrast, the measurement sites in Karlstraße and at the Bifa-Umweltinstitut occupy a special position, as high COD values (Bifa: COD = 0.2–0.32, Karlstraße: COD = 0.32–0.41) result here for all other simultaneous measurements. This means that the measurement sites in Karlstraße and Bifa-Umweltinstitut are so strongly influenced by local emitters (transport or industry) that they are not comparable with any of the other sites. With a COD value of 0.22, the UFP measurements at Königsplatz, which is also categorized as traffic-related, clearly differ from the aerosol measurement station in the suburban background, but have relatively high homogeneity values compared with the measurements at Kriegshaber and Bourges-Platz. These results are due to the conversion of Königsplatz, in the course of which private transport was partially relocated there, and reflect the correspondingly lower emissions due to the reduced traffic load.
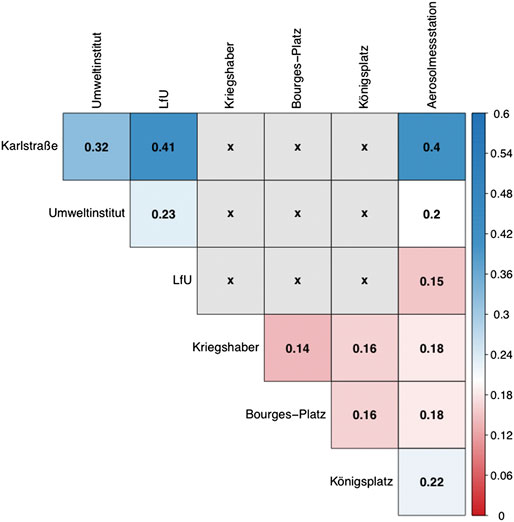
FIGURE 6. Coefficients of divergence between the hourly UFP number concentrations of all measurement sites.
Overall, all coefficients of divergence recapitulate the image of the site-specific UFP parameters outlined in the previous chapter by summarising the similarity or difference between the distributions of the measurement data at the individual sites due to the locally prevailing source types and intensities in a single value. All COD values are therefore in accordance with the previous results and reflect the heterogeneities or homogeneities of the measuring sites, which have already become apparent in Site-Specific Ultrafine Particles Characteristics, according to the influence of the specific emitters on site.
In addition to the COD values in Figure 6, which are based on the entire data of the UFP measurement campaign, the COD values between the UFP concentrations at the measurement sites have been calculated in a differentiated manner according to working days vs. weekend days and seasons. It turns out that the basic picture of homogeneous and heterogeneous sites continues to exist in these distributions of UFP measured values.
On weekends, however, the similarities between the measurement sites are even more pronounced than on weekdays, which is reflected in the even lower values of the COD on Saturdays and Sundays. This result can be explained by the reduced emissions of local sources such as traffic at the weekend. On working days, these emitters ensure that the characteristic emission load at the individual locations appears, which means that the site-specific UFP measurements differ more from one another from Monday to Friday than on weekends, when the local influence from the various sources is less pronounced. This leads to the fact that the UFP concentrations at Bifa-Umweltinstitut and at the aerosol measurement station have a COD value below the 0.2 mark at the weekend and can therefore be regarded as measurements of relatively homogeneous sites. This similarity between two differently categorized locations is due to the pausing of industry and commerce on weekend days (especially on Sunday) at the Bifa-Umweltinstitut, which gives a relatively comparable picture of UFP immissions at both sites on these days. The opposite is true at Karlstraße, where the UFP measurements are still so strongly influenced by traffic emissions even at the weekend that they differ significantly from the UFP concentrations of all other locations in the measurement campaign.
The seasonal differentiated calculation of the COD indices between the UFP measurements of the sites shows an analogous picture of the previously identified spatial heterogeneity and homogeneity. In addition, the seasonal COD values enable supplementary conclusions about the influence of local sources on the measurements of ultrafine particles at the measurement stations in Augsburg’s urban area. For example, the UFP concentrations at Kriegshaber, which is known for its high amount of solid fuel combustion in private households (Bavarian Environment Agency, 2009), show the highest homogeneity values compared to the simultaneous measurements at the other sites in summer when heating is not necessary. At the Bifa-Umweltinstitut, measurements during winter also differ most from UFP concentrations elsewhere. At Karlstraße, on the other hand, the lowest (albeit still high) values of the COD between the UFP measurements there and those at the other sites are found in winter.
Overall, these seasonal differentiations as well as the separate calculation of the COD indices by working days and weekend days provide more detailed insights into the site-specific emission factors and help to better understand the seasonal and weekday varying influence of local sources. Despite the differences outlined in these breakdowns by seasons and weekdays in connection with their causes, the general division into spatially heterogeneous and homogeneous sites are the same for all calculation modes of the COD.
Temporal Variations
The Spearman rank correlation coefficients, calculated for the hourly averaged UFP measurements between all sites (where simultaneous measurements took place during the measurement campaign 2017), are visualized in Figure 7 and show how much the temporal variations of the UFP number concentrations of the different locations coincide or differ. As an aid to interpretation, the correlation values are coloured and symbolically accentuated according to their degree of conformity. High correspondence between the UFP concentrations of two sites can be seen in a darker red tone and a narrower ellipse, while a lighter orange in combination with an (almost) circular field symbolises weakly correlated UFP concentrations of two sites.
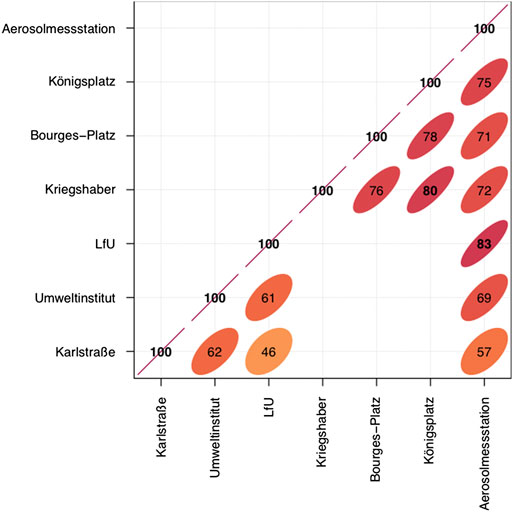
FIGURE 7. Spearman rank correlation coefficients between the hourly UFP number concentrations of all measurement sites [for a better overview only the decimal values after 0. are shown].
Based on this colour and symbol scheme, it is easy to see that the UFP concentrations at Karlstraße and Bifa Umweltinstitut show the lowest correlations to the (simultaneous) measurements at the other sites and therefore match in their temporal variation correspondingly weaker to the values measured in parallel elsewhere. In contrast, the UFP concentrations at the (sub-)urban background sites LfU and aerosol measurement station in particular have a high Spearman correlation coefficient of r = 0.83, which indicates very consistent temporal variations at these two sites. With values between 0.76 and 0.8, the temporal variations of the UFP concentrations at the measurement stations Königsplatz, Kriegshaber and Bourges-Platz correlate almost as strongly with each other. This shows the highest/lowest coincidences between the temporal variations of the UFP measurements at the same sites that were already stuck out in the previous chapter by the strongest/weakest spatial homogeneities of the UFP concentrations via small/large coefficients of divergence.
A comparable result of both coefficients can also be seen in their separate calculation for weekend days and working days (no figures provided). Here - as with the COD values before - the basic picture of strongly/weakly correlating sites according to Figure 7 remains unchanged. At the weekend, higher values of Spearman rank correlations compared to the working days can be observed. This result can be explained by the reduced emissions of local sources, such as traffic at the weekend. On working days, these emitters ensure that the immission levels at the individual sites differ more strongly than at weekends. If the local emission factors come to a standstill at the weekend (as much as possible), the correlation coefficients rise to 0.91 (between LfU and aerosol measurement station). The strongest differences in correlation coefficients for working days vs. weekend days can be observed at Karlstraße compared to the (sub-)urban background measurement stations. During weekdays the correlation coefficients between these totally different site categories amount to 0.41 (LfU) and 0.51 (aerosol measurement station), while r reaches 0.59 (LfU) and 0.69 (aerosol measurement station) on Saturdays and Sundays.
In the seasonally differentiated calculation of the Spearman rank correlation coefficients, a conform picture with the already presented analysis appears. The previous correspondence with the results of the COD indices also continues with the seasonally differentiated investigation of temporal similarities of the UFP measurements at the seven sites. For example, the highest correlation coefficients between the UFP concentrations are found in winter, when supra-regional meteorological influences such as inversion weather conditions often occur and lead to strongly correlated temporal variations of the UFP concentrations at all sites. The only exception are the UFP measurements at Bifa-Umweltinstitut, where during winterly months the greatest differences in temporal variations from UFP concentrations elsewhere occur. This special position of the UFP measurements at Bifa-Umweltinstitut in winter was already present in the seasonally differentiated COD indices of the previous chapter.
Daily, Weekly and Annual Cycles
Figure 8 shows the daily, weekly and annual cycles of the hourly UFP concentrations during the measurement campaign 2017. The highest UFP concentrations can be observed at Karlstraße. During the course of the day, about 10,000–15,000 particles/cm3 more are measured in Karlstraße compared to the other locations. At night (especially between zero and four o'clock) the differences decrease to minimum values. The weekly cycle visualizes that this strongly increased UFP concentration level on Karlstraße compared to measurements elsewhere is mainly observed on working days and only to a much lesser extent at weekends. These observations are due to traffic-related UFP emissions. UFP peaks appear at all sites during morning and evening rush hours. This pattern corresponds to the characteristic course of the traffic load. On Karlstraße, where traffic is particularly intensiv, there is a constant high level of UFP air pollution between these two peaks, as traffic on this west-east connecting road is also high outside the rush hour and there is an accumulation of air pollutants in the local road canyon too.
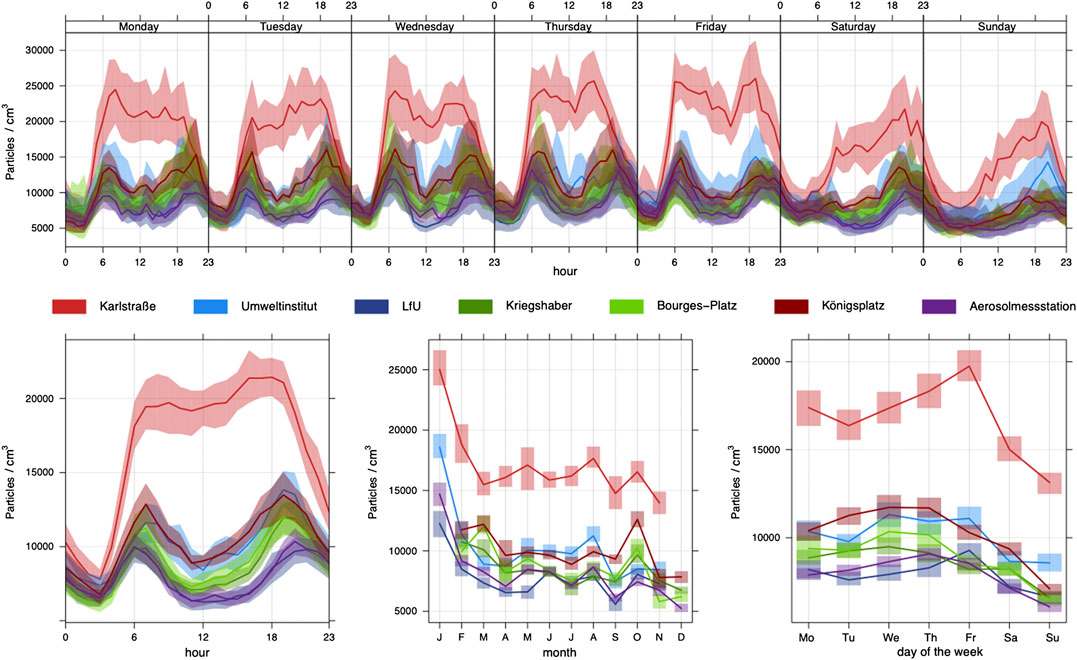
FIGURE 8. Daily (bottom left), weekly (top: hourly averages, bottom right: daily averages) and annual cycles (bottom center) of the hourly UFP number concentrations from the measurement campaign 2017 [lines: mean values; shaded areas: fluctuation range between 5th and 95th percentile].
The daily cycles of the UFP measurements at the other locations correspond in their typical course with two maxima - between 6 a. m. and 7 a. m. and between 7 p. m. and 8 p. m. respectively. However, they differ in their concentration levels, with the (sub-)urban background measurement stations at LfU and at the aerosol measurement station having the lowest UFP concentrations. The traffic-related station at Königsplatz and the industrial/commercial site at Bifa-Umweltinstitut show, apart from Karlstraße, the highest UFP number concentrations of all sites. In between, the measurements in the residential area in Kriegshaber and at Bourges-Platz rank with a similarly consistent UFP concentration level.
These typical concentration levels of the UFP measurements in the daily cycles are consistently continued in the weekly cycles and over the course of the year. Especially the illustration of the weekly cycle of the UFP daily mean values (graphic at the bottom right in Figure 8) shows the differential UFP concentration levels of the individual sites. In the same graph, the lowering of the measured UFP level at the weekend across all sites compared to the correspondingly higher measured UFP concentration levels during the working days is also very clearly visible. In the course of the year (graphic in the middle below in Figure 8) the monthly averaged measurement results of the seven sites show an almost parallel course, which reflects the seasonal influences on the UFP concentrations. Particularly striking here is the high concentration level of the UFP measurements in January, the causes of which are examined in more detail in Meteorological Influences on Ultrafine Particles.
Contribution of Local Sources
Typically, the immission load measured at a station is composed of the following parameters (Lenschow et al., 2001):
• a regional background contamination, which is mainly formed by air pollutants transported over long distances
• an additional load from urban sources (urban background)
• a local load (so-called hotspots) such as close to busy roads or downwind of industrial plants
Transferred to the locations of the project, the measurements at the aerosol measurement station are considered to be representative of the UFP exposure situation of the urban background. So, the UFP concentrations recorded at the aerosol measurement station are subtracted from the simultaneous measurement results of the urban sites in order to explicitly consider the additional local load according to the contribution of the sources dominating at the other sites. This approach to determine the additive immission loads in dependence on local sources compared to the urban background load is based on Lenschow et al. (2001). The results of the Lenschow approach are shown in Figure 9 in the form of the site-specific UFP daily cycles of the additional local loads compared to the immission situation in the urban background (represented by the UFP concentrations at the aerosol measurement station). It becomes clear that at all sites - with the exception of the measurement station at the LfU, which is located in the suburban background and therefore does not find its way into the present investigation of the influence of local emission factors - there is an additive pollutant load due to the contribution of locally prevailing sources.
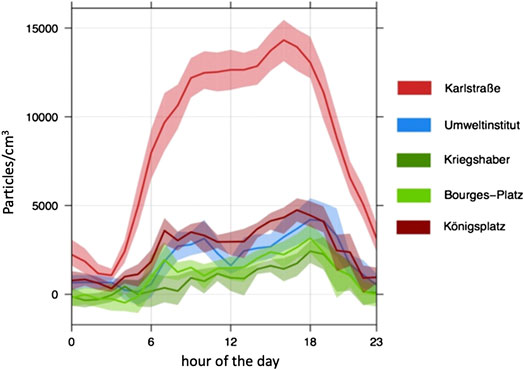
FIGURE 9. Daily cycles of the additional local loads of the UFP number concentrations normalized to the urban background load [lines: mean values; shaded areas: fluctuation range between 5th and 95th percentile].
However, the extent to which UFP emissions from locally prevailing sources increase the immission situation varies considerably between the sites. For example, the measurements in Kriegshaber show only a small increase in the additional UFP impact by local emitters compared to the urban background concentration, which reaches its maximum especially in the evening hours (approximately around 6 p. m.). The situation is similar at Bourges-Platz, where in addition a peak of the additive UFP load occurs in the morning hours, so that the characteristic course of traffic-influenced measurements with two maxima during rush hours becomes visible again and a corresponding influence can be inferred. The same applies, to an even greater extent, to the additive UFP load at Königsplatz, where traffic-related emissions increase the measured concentrations during the evening rush hour by an average of 5,000 particles/cm3 per hour. At the highly traffic-influenced Karlstraße, this additional load due to the intensive traffic during the rush hour in the evening in connection with the unfavourable exchange processes in the road canyon achieves values of an average of 14,000 particles/cm3.
The analogue calculations for the measurements in Karlstraße, differentiated according to winter and summer half-year, show that the contribution of traffic to the immission situation there is even higher in the winter months than during summer. This is due to the increased emissions themselves (higher use of building heating systems and less favourable emission behaviour in motor vehicles) as well as to the more frequent adverse weather conditions in winter, which make it difficult to remove emissions (see chapter Meteorological Influences on Ultrafine Particles) and can be estimated at an average of up to 3,000 particles/cm3. The additive load with ultrafine particles at the measurement site in Kriegshaber is increased by about the same average amount from October to March compared to the rest of the year in the evening. As a result, the local UFP additional load during the evening hours in this residential area is limited exclusively to the time of the winterly heating period and reflects the strengthening of the UFP emission situation by the private solid fuel firing during the evenings.
Correlations of Ultrafine Particles and Relevant Air Pollutants
Figure 10 shows the Spearman rank correlation coefficients of the legally regulated air pollutants measured at LfU as well as the ultra-fine particles among each other. The LfU site was selected because most air pollutants are detected there. The highest correlation coefficients are observed for UFP and the air pollutants emitted by transport NO2 and CO, without reaching the highly correlated levels between CO and NO2. There is only a weak correlation between UFP and particulate matter (PM2.5 and PM10) (Kwasny et al., 2010). The reasons for this are the different sources: While UFP are mainly formed in local combustion processes either as a direct emission product or secondary from the gaseous precursor substances of these sources, particulate matter is mainly produced by mechanical processes or as secondary aerosols (Morawska et al., 2019). In addition, UFP shows a (mostly exponential) decrease in its concentration with increasing distance from the source, whereas the particle mass decreases significantly less with the same distance to the emitter (Morawska et al., 2019).
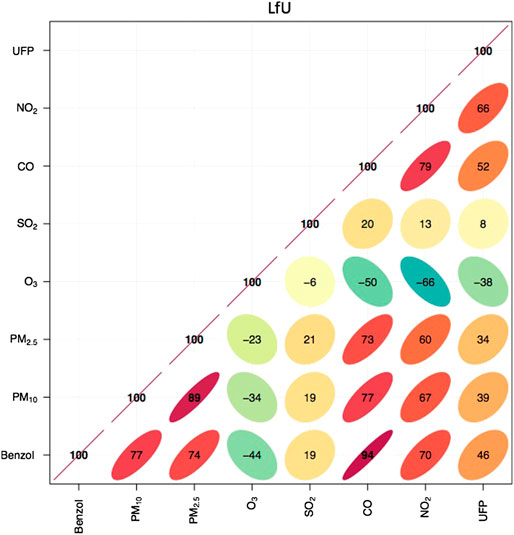
FIGURE 10. Spearman rank correlation coefficients of the hourly UFP number concentrations as well as the legally regulated air pollutants at the LfU measurement site [for a better overview only the decimal values after 0. are shown].
In Figure 11 the parallelism between the monthly averaged UFP concentrations and the monthly mean NO2 and CO values for the measurements at Karlstraße is particularly clear. This synchronicity can also be found in the daily (graphic at the bottom left in Figure 11) and weekly cycles (top graph in Figure 11 in hourly averages and graph on the bottom left in Figure 11 in daily mean values) and differs significantly from the corresponding graphs of the PM10 concentrations. Thus, on the one hand, the high correlation between UFP and transport-related gaseous air pollutants and on the other hand, the significantly lower correlation between particle mass (PM10) and UFP number concentration is illustrated very clearly. These connections can be found both at the traffic-exposed street canyon of Karlstraße and at the LfU measurement station, which is representative of the suburban background, as well as at the two other LÜB stations at Bourges-Platz and Königsplatz. These findings are in good agreement to the study of Wolf et al. (2017), who reported that the particle number concentration in Augsburg was moderately correlated with PM2.5, but highly correlated with NOx indicating common sources, such as traffic and industry emissions (de Jesus et al., 2019). Furthermore, UFP measurements in other cities in Europe and around the world yielded the same result when compared to gaseous as well as to particulate air pollutants (de Jesus et al., 2019; Morawska et al., 2019).
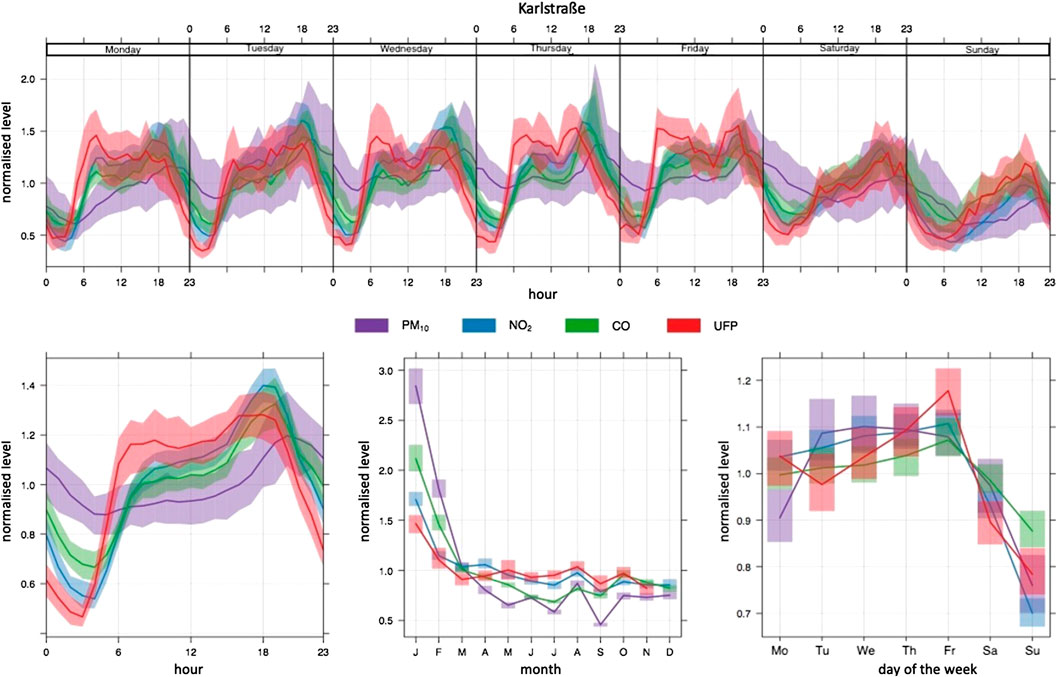
FIGURE 11. Daily (bottom left), weekly (top: hourly averages, bottom right: daily averages) and annual cycles (bottom center) of the concentrations of PM10, NO2, CO and UFP at the measurement station in Karlstraße during the measurement campaign 2017 [lines: mean values; shaded areas: fluctuation range between 5th and 95th percentile].
Meteorological Influences on Ultrafine Particles
We analysed the correlation coefficients between the UFP measurements and the meteorological parameters precipitation, humidity, wind speed, air pressure, temperature and mixing layer height. The latter is determined at the aerosol measurement station by means of ceilometer measurements by the company Vaisala GmbH. The negative Spearman rank correlation coefficient between the mixing layer height extracted from the ceilometer data and the UFP concentrations symbolizes the exacerbating effect that a low level of the tropospheric mixing layer has on the immission situation over Augsburg. If a low mixing layer height of a few 100 m above Augsburg is formed, air pollutants can accumulate due to the lack of vertical removal. Particularly at mixing layer heights below 400 m, significantly higher UFP concentrations are recorded especially in the winter half-year. At the same time, a low mixing layer height does not necessarily lead to high UFP concentrations, since even on a large number of days with low mixing layer heights, low particle number concentrations have been measured. On such days, for example, precipitation, high wind speeds or different areas of origin of the air masses can be responsible for a reduction of the UFP concentration level. Conversely, it can be seen that on days with a high mixing layer height due to the greater dilution effect, a lower UFP concentration can be expected.
Similarly, low wind speeds lead to an exacerbation of the air pollution situation, since air mass exchange processes responsible for the dilution of the particles and gases are reduced. Apart from these significant (negative) correlations between wind speed and mixing layer height on the one hand and UFP on the other, the further meteorological parameters do not have a strong influence on the UFP concentration over the entire measurement campaign in 2017.
The results of the year-round correlation analysis retain their basic validity also in the seasonal differentiated calculation of the correlation coefficients, according to which a pronounced influence on the UFP concentrations during all seasons is only shown by the meteorological parameters wind speed and mixing layer height. In addition, a negative correlation between air temperature and UFP is established during the winter months, so that the lower the temperatures, the higher the UFP emissions.
All of these correlations, as exemplified for the measurements at the aerosol measurement station, can also be found in comparable intensity at the other sites of the measurement campaign 2017. Only the humidity often shows a more negative correlation coefficient at the other stations - especially in summer, when a high humidity value usually occurs during rain - which reflects the concentration-reducing effect of precipitation on air pollution. This leaching effect is particularly pronounced at the measurement station in Karlstraße and makes up even the strongest meteorological influence on the UFP concentration there in the summer months of June to August.
The interaction of the individual meteorological parameters is demonstrated impressively during the first week of the measurement campaign, when an episode of high immission values occurred in Augsburg. From the 23rd to the 29th of January 2017, relatively weak easterly winds with very low mixing layer heights (especially in the second half of the week: <300 m) dominated the weather conditions over Augsburg. This situation of strongly inhibited exchange processes of air masses was accompanied by low temperatures (mostly below freezing point), comparatively low air humidity (especially during the day), very low air pressure and no precipitation which could have caused a leaching of air pollutants. In their entirety, these meteorological conditions facilitate the enrichment of ultrafine particles, so that, daily maxima of the hourly mean concentrations reached between 38,000 and 50,000 particles/cm3 at the site in Karlstraße, for example.
In order to investigate the influence of air mass origin for this period at the end of January, backward trajectories outlining the path taken by the air pollutants recorded in Augsburg were calculated with the FLEXTRA model (Stohl et al., 1995; Stohl & Seibert 1998). The backward trajectories show that during this week of increased immission values, the air masses frequently traversed Eastern European regions before their recording in Augsburg (see Figure 12). This effect of long-distance transport is particularly evident in connection with low wind speeds and humidity values. If the air humidity and the wind speed increase (e.g. 24th–26th January 2017), potentially long-distance transported ultrafine particles from Eastern European countries are diluted in such a way that they can no longer be measured in Augsburg.
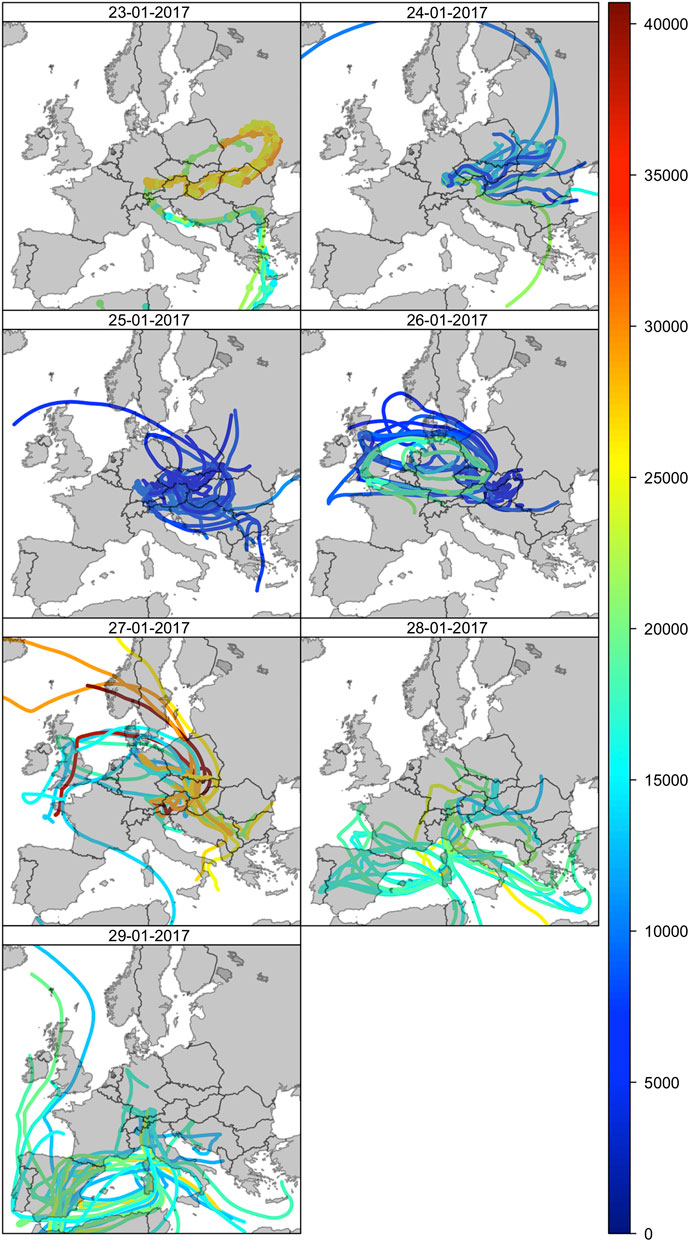
FIGURE 12. Hourly 7-day backward trajectories over Augsburg using the trajectory model FLEXTRA based on the ECMWF reanalysis fields [The colours of the individual trajectories correspond to the UFP number concentrations (in particles/cm3) that prevailed when the air masses arrived in Augsburg].
From another study we already know that a distinct connection between local particulate matter concentrations in Bavarian cities and atmospheric circulation types exists and is most pronounced during the winter months December, January and February (Beck et al., 2014). A look at the results of an automated weather type classification (Beck 2000; Beck et al., 2007), which assigned a large scale circulation type to every day of the measurement campaign, shows that Augsburg was under constant high pressure influence during this episode of high UFP concentrations at the end of January 2017. In the cold season, these high-pressure weather conditions encourage the development of an inversion. An inversion weather situation occurs when the normally prevailing decrease in temperature with altitude is reversed. This prevents mixing with the upper atmosphere and pollutants accumulate below the inversion layer. If such an inversion situation occurs in connection with air-loaded easterly winds, low wind speeds, lack of precipitation and very low mixing layer height as at the end of January 2017 over Augsburg, its effect intensifies and peak values of the UFP concentrations are measured.
Conclusions and Outlook
The analysis results show that the number concentration of ultrafine particles in an urban environment is strongly dominated by the locally prevailing sources, but also significantly influenced by meteorological conditions. At the same time, UFP concentrations vary significantly depending on the season and, in particular, the time of day, according to the behaviours of the site-specific urban emission factors. As a result, urban UFP concentrations in particular exhibit pronounced temporal and small-scale variability, so that UFP measurements with high technical quality standards together with a broad scientific analysis of comprehensive influencing factors are fundamental for reliable statements on the local immission situation in the city.
By applying these high standards to the measurement campaign 2017, we obtain site-specific UFP characteristics for typical urban locations, such as on strongly traffic exposed inner-city streets with “ravine-like” roadside structures, in industrial or commercial areas, in residential areas with an increased proportion of solid fuel combustion for heating purposes (fireplaces) or in areas without dominant sources. Due to the collection and evaluation of UFP parameters in the (sub-)urban background as well as in the catchment areas of these various anthropogenic local sources in the city of Augsburg over the calendar year 2017, it is now possible to make statements about the UFP exposure situation to which the population there is exposed for at least a certain period of time. Thereby, the studies on the immission situations on site carried out here may help to obtain more data for the health assessment of UFP in the ambient air.
The data collected and analysed within our study provide for the first time UFP characteristics in the (sub-)urban background as well as in the catchment areas of various anthropogenic local sources in a Bavarian city over 1 year with indicative measurements. In other German states as well as in international surveys some similar UFP measurements are carried out that comprise comparative data. These comparisons show for example that the Augsburg measurement results at Königsplatz are similar in terms of their statistical distribution parameters to the particle number concentrations of the three traffic-related GUAN measurement stations in Leipzig and Dresden (Birmili et al., 2015; Birmili et al., 2016; Birmili et al., 2018; Sun et al., 2019; Birmili et al., 2020). A measurement site comparable to our measurement location at Karlstraße where similar UFP concentration levels as well as the typical temporal variations with a remarkable rush hour effect occur can be found for example at Marylebone Road in London (Air Quality Expert Group 2018). For all these comparisons, however, it should be kept in mind that there are different measurement periods as well as different particle size intervals due to dissimilar instruments and technologies used for the measurements, which is why they are mentioned here exclusively at the end of this study for the sake of completeness and in order to provide a rough categorization of the measurement results in Augsburg compared to UFP measurements elsewhere.
Data Availability Statement
The raw data supporting the conclusions of this article can be requested from the authors.
Author Contributions
MP developed the basic idea for the project together with JS and JC. MP provided all the LÜB air pollutant data. TK was as technician responsible for all the technical and infrastructural tasks around the measurement campaign and the stationary measurements at the Augsburg aerosol station. EG took charge of the processing and aggregation of the UFP data from the three mobile EDMs as well as from the stationary scanning mobility particle sizers. Additionally, EG designed the computational framework of the study and analysed the data. CM provided the mixing layer heights over Augsburg derived from the ceilometer measurements at the Augsburg aerosol measurement station. CB run the circulation type classification (Beck, 2000; Beck, et al., 2007) with the cost377class classification software (Tveito, et al., 2016) and was the expert for all matters related to the statistical programming langue R. The backward trajectories were performed with FLEXTRA at the Leibniz Supercomputing Centre (LRZ) on resources of the Alpine Environmental Data Analysis Centre (www.alpendac.eu). JS supervised the project and contributed to the interpretation of the results. JC supervised the measurement campaign and the quality assurance of the data as well as contributed to the interpretation of the results. EG designed the figures and wrote the manuscript with input from all authors. The whole team of authors provided critical feedback and helped shape the research and analysis. All authors read and approved the final manuscript.
Funding
This research has been funded by the Bavarian Environment Agency on behalf of the Bavarian State Ministry for Environment and Consumer Protection and was named “Influence of local sources on the spatial and temporal distribution of ultrafine particles”. The final report of the project could be downloaded via the following link: https://www.bestellen.bayern.de/shoplink/lfu_luft_00209.htm.
Conflict of Interest
CM was employed by the company Vaisala GmbH.
The remaining authors declare that the research was conducted in the absence of any commercial or financial relationships that could be construed as a potential conflict of interest.
Acknowledgments
Trajectory calculations with FLEXTRA were executed on resources of the Alpine Environmental Data Analysis Centre (www.alpendac.eu), in particular on the LRZ Compute Cloud.
References
Bavarian Environment Agency (2009). Einfluss von Emissionen aus der Gebäudeheizung auf Feinstaubimmissionen im Raum Augsburg. Available at:https://www.bestellen.bayern.de/shoplink/lfu_luft_00161.htm, 198 p.
Beck, C. (2000). Zirkulationsdynamische Variabilität im Bereich Nordatlantik-Europa seit 1780. Wurzbg. Geogr. Arb. 95, 350.
Beck, C., Jacobeit, J., and Jones, P. D. (2007). Frequency and within-type variations of large scale circulation types and their effects on low frequency climate variability in Central Europe since 1780. International Journal of Climate 27, 473–491. doi:10.1002/joc.1410
Beck, C., Weitnauer, C., and Jacobeit, J. (2014). Downscaling of monthly PM10 indices at different sites in Bavaria (Germany) based on circulation type classifications. Atmospheric Pollution Research 5, 741–752. doi:10.5094/APR.2014.083
Birmili, W., Pietsch, A., Niemeyer, T., Kura, J., Hoffmann, S., Daniels, A., et al. (2020). Abundance and source of ultrafine particles in indoor and ambient air – current state of knowledge. Gefahrst. Reinhalt. Luft. 80, 33–43.
Birmili, W., Rückerl, R., Hoffmann, B., Weinmayr, G., Schins, R., Kuhlbusch, T. A. J., et al. (2014). Ultrafeine Aerosolpartikel in der Außenluft: perspektiven zur Aufklärung ihrer Gesundheitseffekte. Gefahrst. Reinhalt. Luft. 74, 492–500.
Birmili, W., Süring, K., Becker, K., Gerwig, H., Schwirn, K., Löschau, G., et al. (2018). Ultrafeine partikel in der Umgebungsluft – aktueller wissensstand. UMID: Umwelt und Mensch – Informationsdienst 2/2018, 57–65.
Birmili, W., Sun, J., Weinhold, K., Merkel, M., Rasch, F., Wiedensohler, A., et al. (2015). Atmospheric aerosol measurements in the German Ultrafine Aerosol Network (GUAN) – Part III: black Carbon mass and particle number concentrations 2009-2014. Gefahrst. Reinhalt. Luft. 75, 479–488.
Birmili, W., Tomsche, L., Sonntag, A., Opelt, C., Weinhold, K., Nordmann, S., et al. (2013). Variability of aerosol particles in the urban atmosphere of Dresden (Germany): effects of spatial scale and particle size. Meteorol. Z. 22, 195–211. doi:10.1127/0941-2948/2013/0395
Birmili, W., Weinhold, K., Rasch, F., Sonntag, A., Sun, J., Merkel, M., et al. (2016). Long-term observations of tropospheric particle number size distribution and equivalent black carbon mass concentrations in the German Ultrafine Aerosol Network (GUAN). Earth Syst. Sci. Data. 8, 355–382. doi:10.5194/essd-8-355-2016
Buonanno, G., Fuoco, F. C., and Stabile, L. (2011). Influential parameters on particle exposure of pedestrians in urban microenvironments. Atmos. Environ. 45, 1434–1443. doi:10.1016/j.atmosenv.2010.12.015
Chen, K., Schneider, A., Cyrys, J., Wolf, K., Meisinger, C., Heier, M., et al. (2020). Hourly exposure to ultrafine particle metrics and the onset of myocardial infarction in Augsburg, Germany. Environ Health Perspect. 128, 17003. doi:10.1289/EHP5478
City of Augsburg (2017). Structural atlas of the city of Augsburg 2017. Available at:https://www.augsburg.de/fileadmin/user_upload/buergerservice_rathaus/rathaus/statisi-ken_und_geodaten/statistiken/strukturatlas/strukturatlas_der_stadt_augsburg_2017.pdf, 148 p.
Cohen, A. J., Brauer, M., Burnett, R., Anderson, H. R., Frostad, J., Estep, K., et al. (2017). Estimates and 25-year trends of the global burden of disease attributable to ambient air pollution: an analysis of data from the Global Burden of Diseases Study 2015. Lancet 389, 1907–1918. doi:10.1016/S0140-6736(17)30505-6
Cyrys, J., Pitz, M., Heinrich, J., Wichmann, H. E., and Peters, A. (2008). Spatial and temporal variation of particle number concentration in Augsburg, Germany. Sci. Total Environ. 401. 168–175. doi:10.1016/j.scitotenv.2008.03.043
De Hartog, J. J., Hoek, G., Mirme, A., Tuch, T., Kos, G. P., Ten Brink, H. M., et al. (2005). Relationship between different size classes of particulate matter and meteorology in three European cities. J. Environ. Monit. 7, 302–310. doi:10.1039/b415153d
De Jesus, A. L., Rahman, M. M., Mazaheri, M., Thompson, H., Knibbs, L. D., Jeong, C., et al. (2019). Ultrafine particles and PM2.5 in the air of cities around the world: are they representative of each other? Environmental International 129, 118–135. doi:10.1016/j.envint.2019.05.021
Environment Agency (2018). Health Effects of Ultrafine Particles–systematic literature search and the potential transferability of the results to the German setting. Dessau-Roßlau, Germany: Umwelt & Gesundheit 05/2018, 108 p.
Fujitani, Y., Kumar, P., Tamura, K., Fushimi, A., Hasegawa, S., Takahashi, K., et al. (2012). Seasonal differences of the atmospheric particle size distribution in a metropolitan area in Japan. Sci. Total Environ. 437, 339–347. doi:10.1016/j.scitotenv.2012.07.085
Giemsa, E., Soentgen, J., Cyrys, J., and Pitz, M. (2020). Einfluss lokaler Quellen auf die räumliche und zeitliche Verteilung ultrafeiner Partikel. Abschlussbericht im Auftrag des Bayerischen Landesamtes für Umwelt, Augsburg, Germany, 93. Available at: https://www.bestellen.bayern.de/shoplink/lfu_luft_00209.htm.
Grimm Aerosol Technik GmbH & Co. KG (2014). Handbuch EDM 465 UFP - Version 1.1, Ainring, Germany: Ainring, 63 p.
Gu, J., Pitz, M., Schnelle-Kreis, J., Diemer, J., Reller, A., Zimmermann, R., et al. (2011). Source apportionment of ambient particles: comparison of positive matrix factorization analysis applied to particle size distribution and chemical composition data. Atmos. Environ. 45, 1849–1857. doi:10.1016/j.atmosenv.2011.01.009
Health Effects Institute (2013). HEI review panel on ultrafine particles - understanding the health effects of ambient ultrafine particles. Boston, MA (USA): HEI Perspectives Vol. 3, 108.
Heyder, J. (2004). Deposition of inhaled particles in the human respiratory tract and consequences for regional targeting in respiratory drug delivery. Proc. Am. Thorac. Soc. 1, 315–320. doi:10.1513/pats.200409-046TA
Kaur, S., Nieuwenhuijsen, M., and Colvile, R. (2005). Personal exposure of street canyon intersection users to PM2.5, ultrafine particle counts and carbon monoxide in Central London, UK. Atmos. Environ. 39, 3629–3641. doi:10.1016/j.atmosenv.2005.02.046
Kreyling, W. G., Tuch, T., Peters, A., Pitz, M., Heinrich, J., Stölzel, M., et al. (2003). Diverging long-term trends in ambient urban particle mass and number concentrations associated with emission changes caused by the German unification. Atmos. Environ. 37, 3841–3848. doi:10.1016/S1352-2310(03)00457-6
Krudysz, M. A., Froines, J. R., Fine, P. M., and Sioutas, C. (2008). Intra-community spatial variation of size-fractionated PM mass, OC, EC, and trace elements in the Long Beach, CA area. Atmos. Environ. 42, 5374–5389. doi:10.1016/j.atmosenv.2008.02.060
Kulmala, M., Vehkamäki, H., Petäjä, T., Dal Maso, M., Lauri, A., Kerminen, V. M., et al. (2004). Formation and growth rates of ultrafine atmospheric particles: a review of observations. J. Aerosol Sci. 35, 143–176. doi:10.1016/j.jaerosci.2003.10.003
Kumar, P., Fennell, P., Hayhurst, A., and Britter, R. E. (2009). Street versus rooftop level concentrations of fine particles in a Cambridge street canyon. Boundary-Layer Meteorol. 131, 3–18. doi:10.1007/s10546-008-9300-3
Kumar, P., Morawska, L., Birmili, W., Paasonen, P., Hu, M., Kulmala, M., et al. (2014). Ultrafine particles in cities. Environ. Int. 66, 1–10. doi:10.1016/j.envint.2014.01.013
Kwasny, F., Madl, P., and Hofmann, W. (2010). Correlation of air quality data to ultrafine particles (UFP) concentration and size distribution in ambient air. Atmosphere 1, 3–14. doi:10.3390/atmos1010003
Lenschow, P., Abraham, H.-J., Kutzner, K., Lutz, M., Preuß, J.-D., and Reichenbächer, W. (2001). Some ideas about the sources of PM10. Atmos. Environ. 35, 23–33. doi:10.1016/S1352-2310(01)00122-4
Lorelei de Jesus, A., Thompson, H., Knibbs, L. D., Kowalski, M., Cyrys, J., Niemi, J. V., et al. (2020). Long-term trends in PM. Environ. Pollut. 263, 114500. doi:10.1016/j.envpol.2020.114500
Mejia, J. F., Morawska, L., and Mengersen, K. (2008). Spatial variation in particle number size distributions in a large metropolitan area. Atmos. Chem. Phys. 8, 1127–1138. doi:10.5194/acpd-7-17147-2007
Mishra, V. K., Kumar, P., Van Poppel, M., Bleux, N., Frijns, E., Reggente, M., et al. (2012). Wintertime spatio-temporal variation of ultrafine particles in a Belgian city. Sci. Total Environ. 431, 307–313. doi:10.1016/j.scitotenv.2012.05.054
Morawska, L., Cassee, F. R., and Peters, A. (2019). White Paper – ambient ultrafine particles: evidence for policy makers. Pfinztal, Germany: European Federation of Clean Air and Environmental Protection Associations (EFCA), 19 p.
Peters, A., Breitner, S., Cyrys, J., Stölzel, M., Pitz, M., Wölke, G., et al. (2009). The influence of improved air quality on mortality risks in erfurt, Germany. Res. Rep. Health. Eff. Inst. 137, 5–77.
Pirjola, L., Paasonen, P., Pfeiffer, D., Hussein, T., Hämeri, K., Koskentalo, T., et al. (2006). Dispersion of particles and trace gases nearby a city highway: mobile laboratory measurements in Finland. Atmos. Environ. 40, 867–879. doi:10.1016/j.atmosenv.2005.10.018
Pitz, M. (2010). “Validierung und Analyse von innovativen Parametern zur kontinuierlichen Charakterisierung von feinen und ultrafeinen Partikeln für epidemiologische Studien.” in Dissertation. Zentrum für Ingenieurwissenschaften, Martin-Luther-Universität Halle-Wittenberg. (Halle, Germany: Universitäts- und Landesbibliothek Sachsen-Anhalt), 120.
Pitz, M., Birmili, W., Schmid, O., Peters, A., Wichmann, H. E., and Cyrys, J. (2008). Quality control and quality assurance for particle size distribution measurements at an urban monitoring station in Augsburg, Germany. J. Environ. Monit. 10 (9), 1017–1024. doi:10.1039/b807264g
Rückerl, R., Schneider, A., Breitner, S., Cyrys, J., and Peters, A. (2011). Health effects of particulate air pollution: a review of epidemiological evidence. Inhal. Toxicol. 23, 555–592. doi:10.3109/08958378.2011.593587
Schulz, H., Karrasch, S., Bölke, G., Cyrys, J., Hornberg, C., Pickford, R., et al. (2018). Atmen–luftschadstoffe und Gesundheit. Positionspapier der Deutschen Gesellschaft für Pneumologie und Beatmungsmedizin e.V. (DGP). Berlin, 99.
Seaton, A., Godden, D., MacNee, W., and Donaldson, K. (1995). Particulate air pollution and acute health effects. Lancet 345, 176–178. doi:10.1016/s0140-6736(95)90173-6
Seigneur, C. (2009). Current understanding of ultrafine particulate matter emitted from mobile sources. J. Air Waste Manag. Assoc. 59, 3–17. doi:10.3155/1047-3289.59.1.3
Sharma, A. K. (2005). Text book of correlations and regressions. New Delhi, India: Discovery Publishing Pvt. Ltd, 212.
Stohl, A., and Seibert, P. (1998). Accuracy of trajectories as determined from the conservation of meteorological tracers. Q. J. R. Meteorol. Soc. 124, 1465–1484. doi:10.1002/qj.49712454907
Stohl, A., Wotawa, G., Seibert, P., and Kromp-Kolb, H. (1995). Interpolation errors in wind fields as a function of spatial and temporal resolution and their impact on different types of kinematic trajectories. J. Appl. Meteorol. 34, 2149–2165. doi:10.1175/1520-0450(1995)034<2149:IEIWFA>2.0.CO;2
Sun, J., Birmili, W., Hermann, M., Tuch, T., Weinhold, K., Spindler, G., et al. (2019). Variability of black carbon mass concentrations, sub-micrometer particle number concentrations and size distributions: results of the German Ultrafine Network ranging from city street to High Alpine locations. Atmos. Environ. 202, 256–268. doi:10.1016/j.atmosenv.2018.12.029
Tuch, T., Wehner, B., Pitz, M., Cyrys, J., Heinrich, J., Kreyling, W. G., et al. (2003). Long-term measurements of size-segregated ambient aerosol in two German cities located100 km apart. Atmos. Environ. 37, 4687–4700. doi:10.1016/j.atmosenv.2003.07.010
Tveito, O. E., Huth, R., Philipp, A., Post, R., Pasqui, M., Esteban, P., et al. (2016). COST action 733: harmonization and application of weather type classifications for European regions–final scientific report. Available at: https://www.researchgate.net/publication/303863197_COST_Action_733_Harmonization_and_Application_of_Weather_Type_Classifications_for_European_Regions.
Wolf, K., Cyrys, J., Harciníková, T., Gu, J., Kusch, T., Hampel, R., et al. (2017). Land use regression modelling of ultrafine particles, ozone, nitrogen oxides and markers of particulate matter pollution in Augsburg, Germany. Sci. Total Environ. 579, 1531–1540. doi:10.1016/j.scitotenv.2016.11.160
Keywords: ultrafine particles (UFP), urban immission situation, local sources, meteorological influence, high-traffic site, (sub-)urban background
Citation: Giemsa E, Soentgen J, Kusch T, Beck C, Münkel C, Cyrys J and Pitz M (2021) Influence of Local Sources and Meteorological Parameters on the Spatial and Temporal Distribution of Ultrafine Particles in Augsburg, Germany. Front. Environ. Sci. 8:609846. doi: 10.3389/fenvs.2020.609846
Received: 24 September 2020; Accepted: 09 December 2020;
Published: 20 January 2021.
Edited by:
Nina Jasmin Schleicher, Imperial College London, United KingdomReviewed by:
Maria De Fatima Andrade, University of São Paulo, BrazilAna Cristina Russo, University of Lisbon, Portugal
Copyright © 2021 Giemsa, Soentgen, Kusch, Beck, Münkel, Cyrys and Pitz. This is an open-access article distributed under the terms of the Creative Commons Attribution License (CC BY). The use, distribution or reproduction in other forums is permitted, provided the original author(s) and the copyright owner(s) are credited and that the original publication in this journal is cited, in accordance with accepted academic practice. No use, distribution or reproduction is permitted which does not comply with these terms.
*Correspondence: Esther Giemsa, ZXN0aGVyLmdpZW1zYUBnZW8udW5pLWF1Z3NidXJnLmRl
†These authors share last authorship
 Esther Giemsa
 Jens Soentgen1
 Christoph Beck