
94% of researchers rate our articles as excellent or good
Learn more about the work of our research integrity team to safeguard the quality of each article we publish.
Find out more
ORIGINAL RESEARCH article
Front. Environ. Sci. , 16 July 2020
Sec. Environmental Informatics and Remote Sensing
Volume 8 - 2020 | https://doi.org/10.3389/fenvs.2020.00102
This article is part of the Research Topic Emerging Technologies and Techniques for Remote Sensing of Coastal and Inland Waters View all 14 articles
 Samy I. Elmahdy1*
 Tarig A. Ali1,2
 Mohamed M. Mohamed3,4*
 Fares M. Howari5
 Mohamed Abouleish6
 Daniel Simonet7
Mangrove forests are acting as a green lung for the coastal cities of the United Arab Emirates, providing a habitat for wildlife, storing blue carbon in sediment and protecting shoreline. Thus, the first step toward conservation and a better understanding of the ecological setting of mangroves is mapping and monitoring mangrove extent over multiple spatial scales. This study aims to develop a novel low-cost remote sensing approach for spatiotemporal mapping and monitoring mangrove forest extent in the northern part of the United Arab Emirates. The approach was developed based on random forest (RF), Kernel logistic regression (KLR), and Naive Bayes Tree machine learning algorithms which use multitemporal Landsat images. Our results of accuracy metrics include accuracy, precision, and recall, F1 score revealed that RF outperformed the KLR and NB with an F1 score of more than 0.90. Each pair of produced mangrove maps (1990–2000, 2000–2010, 2010–2019, and 1990–2019) was used to image difference algorithm to monitor mangrove extent by applying a threshold ranges from +1 to −1. Our results are of great importance to the ecological and research community. The new maps presented in this study will be a good reference and a useful source for the coastal management organization.
Mangroves are woody plants that are extensively distributed in intertidal and estuary zones and their forests cover thousands of hectares along the shorelines (Sherrod and McMillan, 1985; Field et al., 1998). Mangroves are able to store 1200 Mg of carbon per hectare (Donato et al., 2011; Pham et al., 2019a, b). They form an essential component of the coastal ecosystem consisting of salt-tolerant plants with aerial breathing roots that supply a microenvironment to several marine species (Snedaker, 1982; Upadhyay and Mishra, 2008).
Mangroves provide a wide range of benefits to the economy and the environment as they play a vital role in ecology. Some ways they do this for example, are by supplying a safe breeding ground and suitable environment for fish species and birds nesting, as well as and stabilization and protection for shorelines from hurricanes (Fry and Cormier, 2011; Giri et al., 2011; Inoue et al., 2011; Barua et al., 2014).
Although mangroves have declined globally by 2% per annum, the mangroves of the United Arab Emirates appear to have rapidly increased. This is due to localized plantation activities and increased public awareness and conservation efforts during the last decade (Food and Agriculture Organization of the United Nations, 2007; Loughland et al., 2007; Howari et al., 2009). The most common mangrove species in the United Arab Emirates is Avicennia marina or gray mangrove and its protection is consequently an urgent conservation priority (Figure 1).
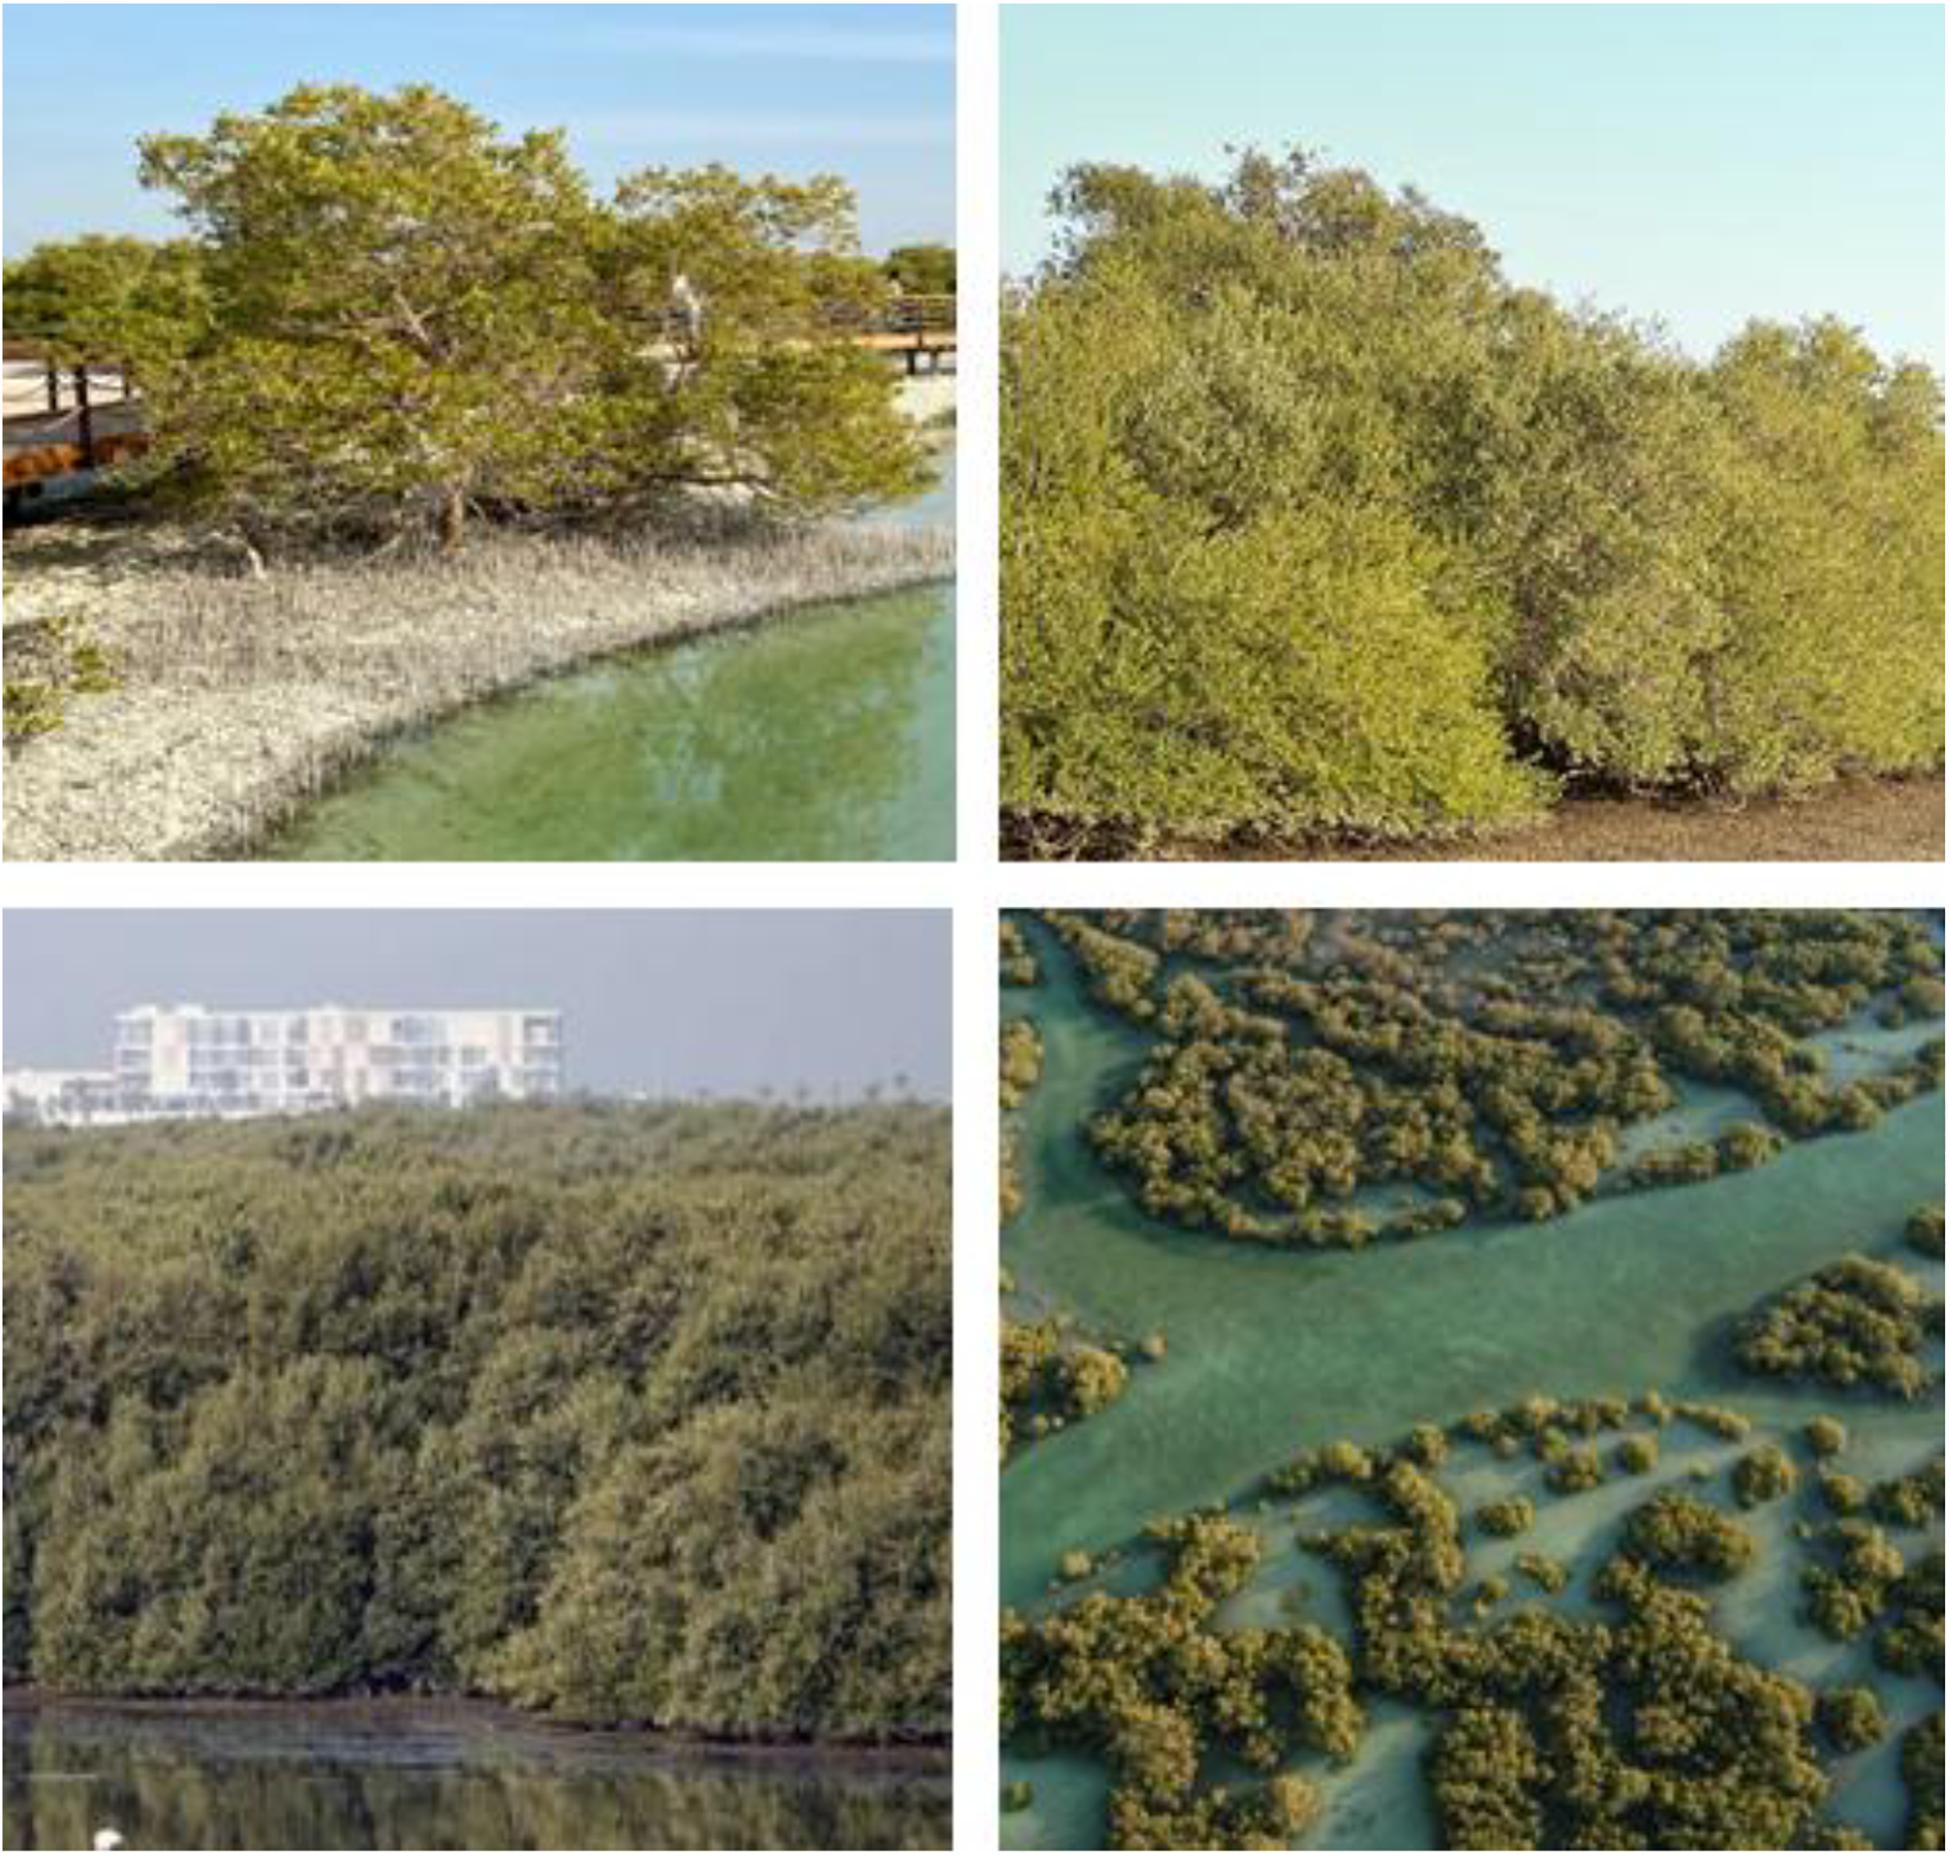
Figure 1. Photos of the NUAE mangrove forests showing their spatial patterns and environment.
Our knowledge on the spatial variation, causes of degradation of the mangroves are still poor due to; (i) the northern part of the United Arab Emirates (NUAE) mangrove database suffering from significant errors and it is sometimes unavailable and has usage restricted, (ii) inaccessibility of the tidal fluctuation mangrove forests in isolated islands, and (iii) the majority of previous studies have been conducted based on field surveys and measurements over a local scale with manual screen digitizing (Moore et al., 2013; Alsumaiti, 2014). Understanding the spatiotemporal changes of the NUAE mangrove over a regional scale could provide valuable information for the ecologists and natural resources specialists in the United Arab Emirates and this requires a potential method.
Remote sensing data has proven to be a good tool for mapping and monitoring mangrove changes over a regional scale as it has low-cost and is not time-consuming (Boardman and Kruse, 1994; Guild et al., 2004; Ghanavati et al., 2008; Mondal et al., 2018, 2019; Elmahdy et al., 2019, 2020a,b; Spruce et al., 2020). The multi-temporal Landsat images have been widely used for mapping and monitoring mangrove changes due to their suitable of spatial and temporal resolutions, as well as their easy availability and accessibility (Birth and McVey, 1968; Edwards et al., 2007; Klemas, 2009; Vo et al., 2013; Nguyen et al., 2013; Kanniah et al., 2015; Chen et al., 2017; Elmahdy and Mohamed, 2018; Buitre et al., 2019).
The most common method for mapping vegetation are the vegetation indices such as the Simple Ratio Index (SRI) of Birth and McVey (1968), Normalized Difference Vegetation Index (NDVI) of Edwards and Richardson (2004), and the Normalized Difference Moisture Index (NDMI) is the oldest and most well known and most frequently used by several researchers (Fang and Liang, 2003; Huete et al., 2010). These indices were designed to enhance the sensitivity of the spectral reflectance contribution of vegetation while minimizing the soil background reflectance or atmospheric effects (Fang and Liang, 2008; Huete et al., 2010) and widely used in the literature (Díaz and Blackburn, 2003; Ishil and Tateda, 2004; Jean-Baptiste and Jensen, 2006; Kovacs et al., 2009; Rodríguez-Romero et al., 2011; Laongmanee et al., 2013; Nascimento et al., 2013; Pereira et al., 2018; Otero et al., 2019; Liu et al., 2020). These indices sometimes cannot discriminate between mangrove and non-mangroves areas such as grass and algae (Howari et al., 2009; Elmahdy and Mostafa Mohamed, 2013a, b). Generally, the classification methods can be divided into five types: (i) unsupervised learning; (ii) supervised; (iii) advanced learning; (iv) object-based image analysis (OBIA); and (v) sub-pixel. Recently, several machine learning algorithms have been designed for mapping and classifying land use land cover (LULC). Ensemble machine learning algorithms such as Random forest (RF) is widely used in LULC classification and mangrove mapping from Landsat images (Erftemeijer and Hamerlynck, 2005; Pal, 2005; Sesnie et al., 2008; Mountrakis et al., 2011), mangrove and sea grass mapping (Heumann, 2011; Hossain et al., 2015; Buitre et al., 2019; Diniz et al., 2019; Small and Sousa, 2019; Toosi et al., 2019), prediction in water resources (Zhao et al., 2012; McGinnis and Kerans, 2013; Naghibi et al., 2016; Naghibi and Dashtpagerdi, 2017), and prediction of land subsidence (Elmahdy et al., 2020a). Further studies combined image transformation and supervised classification to map and classify mangrove forests (Yokoya and Iwasaki, 2010; Ouerghemmi et al., 2018). Locally, only limited numbers of studies have been carried out using remote sensing data (Embabi, 1993; Moore et al., 2013; Almahasheer, 2018). However, these studies were based only on traditional techniques of traditional classifiers and visual interpretation of Landsat and spot images, sometimes coupled with manual digitization techniques for mapping mangrove forests. These techniques introduced a level of human bias and can be subjective and time-consuming owing to the rapid changes in the United Arab Emirates mangroves (Crouvi et al., 2006; Adam and Hutchings, 2010). Therefore, to construct and maintain a flexible regional database for the NUAE mangroves, it is urgent to modify an integrated powerful machine learning classifier.
Integration of RF, Kernel logistic regression (KLR), Naive Bayes Tree (NBT), and Image difference (ID) have shown the ability to achieve classification over a regional scale and precise monitoring extent of the mangrove (Colkesen and Kavzoglu, 2017). These techniques can reduce the variance and overfitting of the classification maps and assess many variables separately compared to traditional classifiers, such as maximum likelihood (Ha et al., 2020). Thus, integration of RF and KLR and ID was adopted to extract spatiotemporal information about the NUAE mangrove forests. The use of machine learning algorithms decreases the overfitting and variance in the classified maps (Belgiu and Dăguţ, 2016; Feng et al., 2018; Mondal et al., 2019; Elmahdy et al., 2020b; Ha et al., 2020). Thus, the main goals of this study were to present a novel ensemble machine learning approach which integrates RF with KLR and NBID algorithms and uses Landsat images for spatiotemporal mapping of the NAEU mangroves, comparing the performance of these algorithms, and implementing a novel image to image change detection technique for monitoring mangrove changes over multiple scales.
The study area is in the eastern and western coastal areas of the United Arab Emirates. In particular, it extends between the longitudes E 53°56′ 23′′ and E 60°15′ 22″ and latitudes 24° 21′ 2′′ and 26° 12′ 20′′ N (Figures 2, 3). The area consists of two mangrove ecosystems; the Khor Fakkan mangrove is located in the Gulf of Oman (5.5 km length) and the Dubai’s Greek, Ajman’s Creek, Hammraih’s Creek, Umm Al Quwain and Ras Al Khaimah (RAK) Estuaries (Figures 2, 3). They are facing the Gulf of Oman in the east and the Arabian Gulf in the west and dominated by gray mangroves (A. marina) and locally referred to as Al Qurm, which is one of the most habitat-tolerant mangroves (Boer and Aspinall, 2005; Howari et al., 2009; Alsaaideh et al., 2013). The United Arab Emirates mangroves are able to grow in saline soil that exceeds the seawater salinity of the Arabian Gulf and Gulf of Oman (Alsumaiti, 2014). An Assessment of A. marina Forest Structure and Aboveground Biomass in Eastern Mangrove Lagoon National Park, Abu Dhabi (Alsumaiti, 2014). The height of the United Arab Emirates mangrove trees ranges from a few centimeters to 3–8 m (Moore et al., 2013; Alsumaiti, 2014). The mangrove soil texture is loamy clay and silt and characterized by high porosity and low permeability, which allows keeping the seawater in the soil porosity for a long time, especially during tidal times (Cintron et al., 1978; Bashitialshaaer et al., 2011).
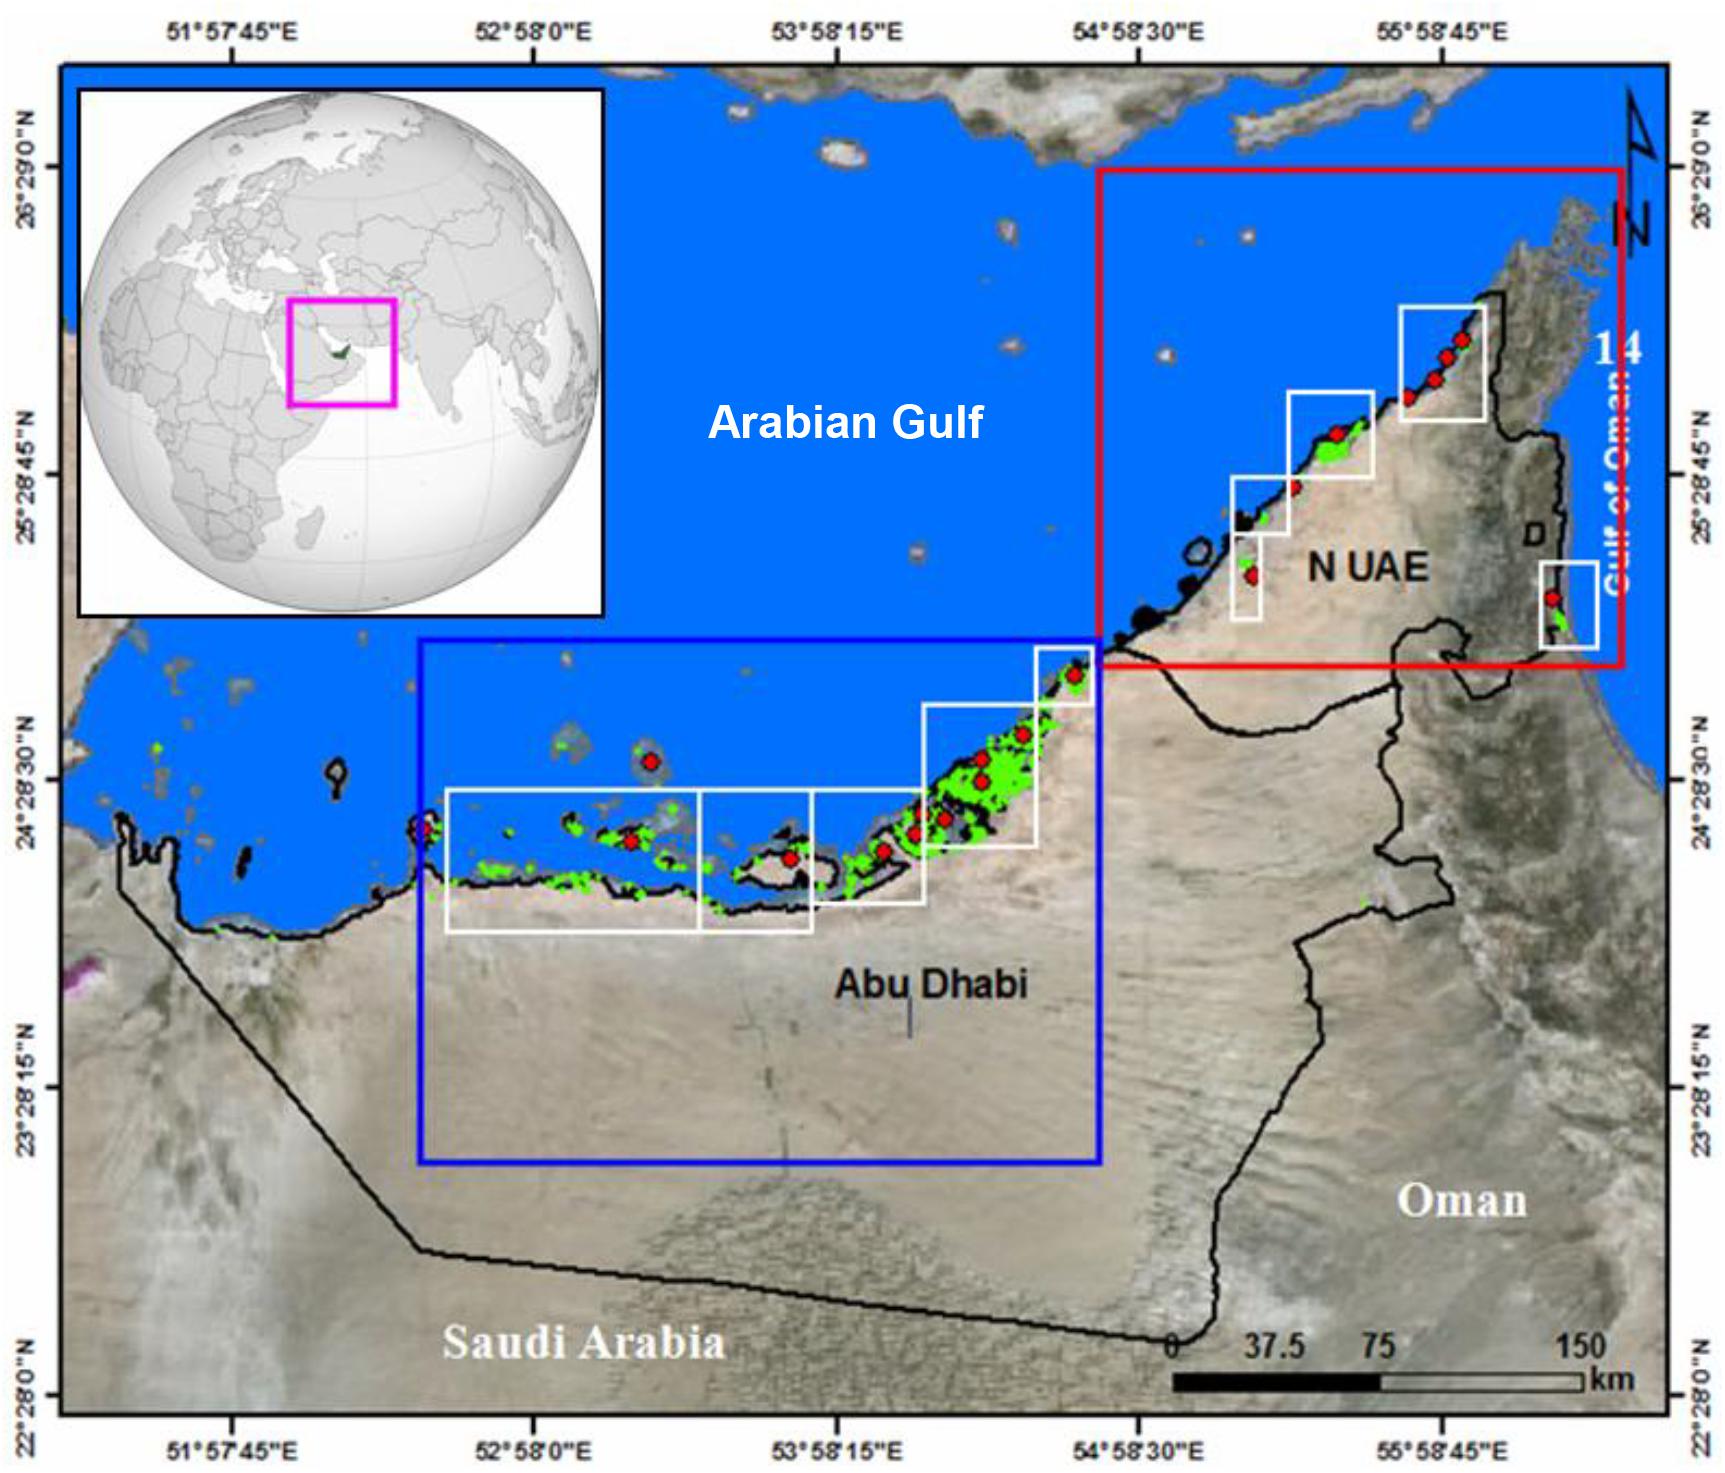
Figure 2. RGB 541 band combination of Landsat image of the UAE showing the spatial distribution of the UAE mangroves and in the study area (red polygons).
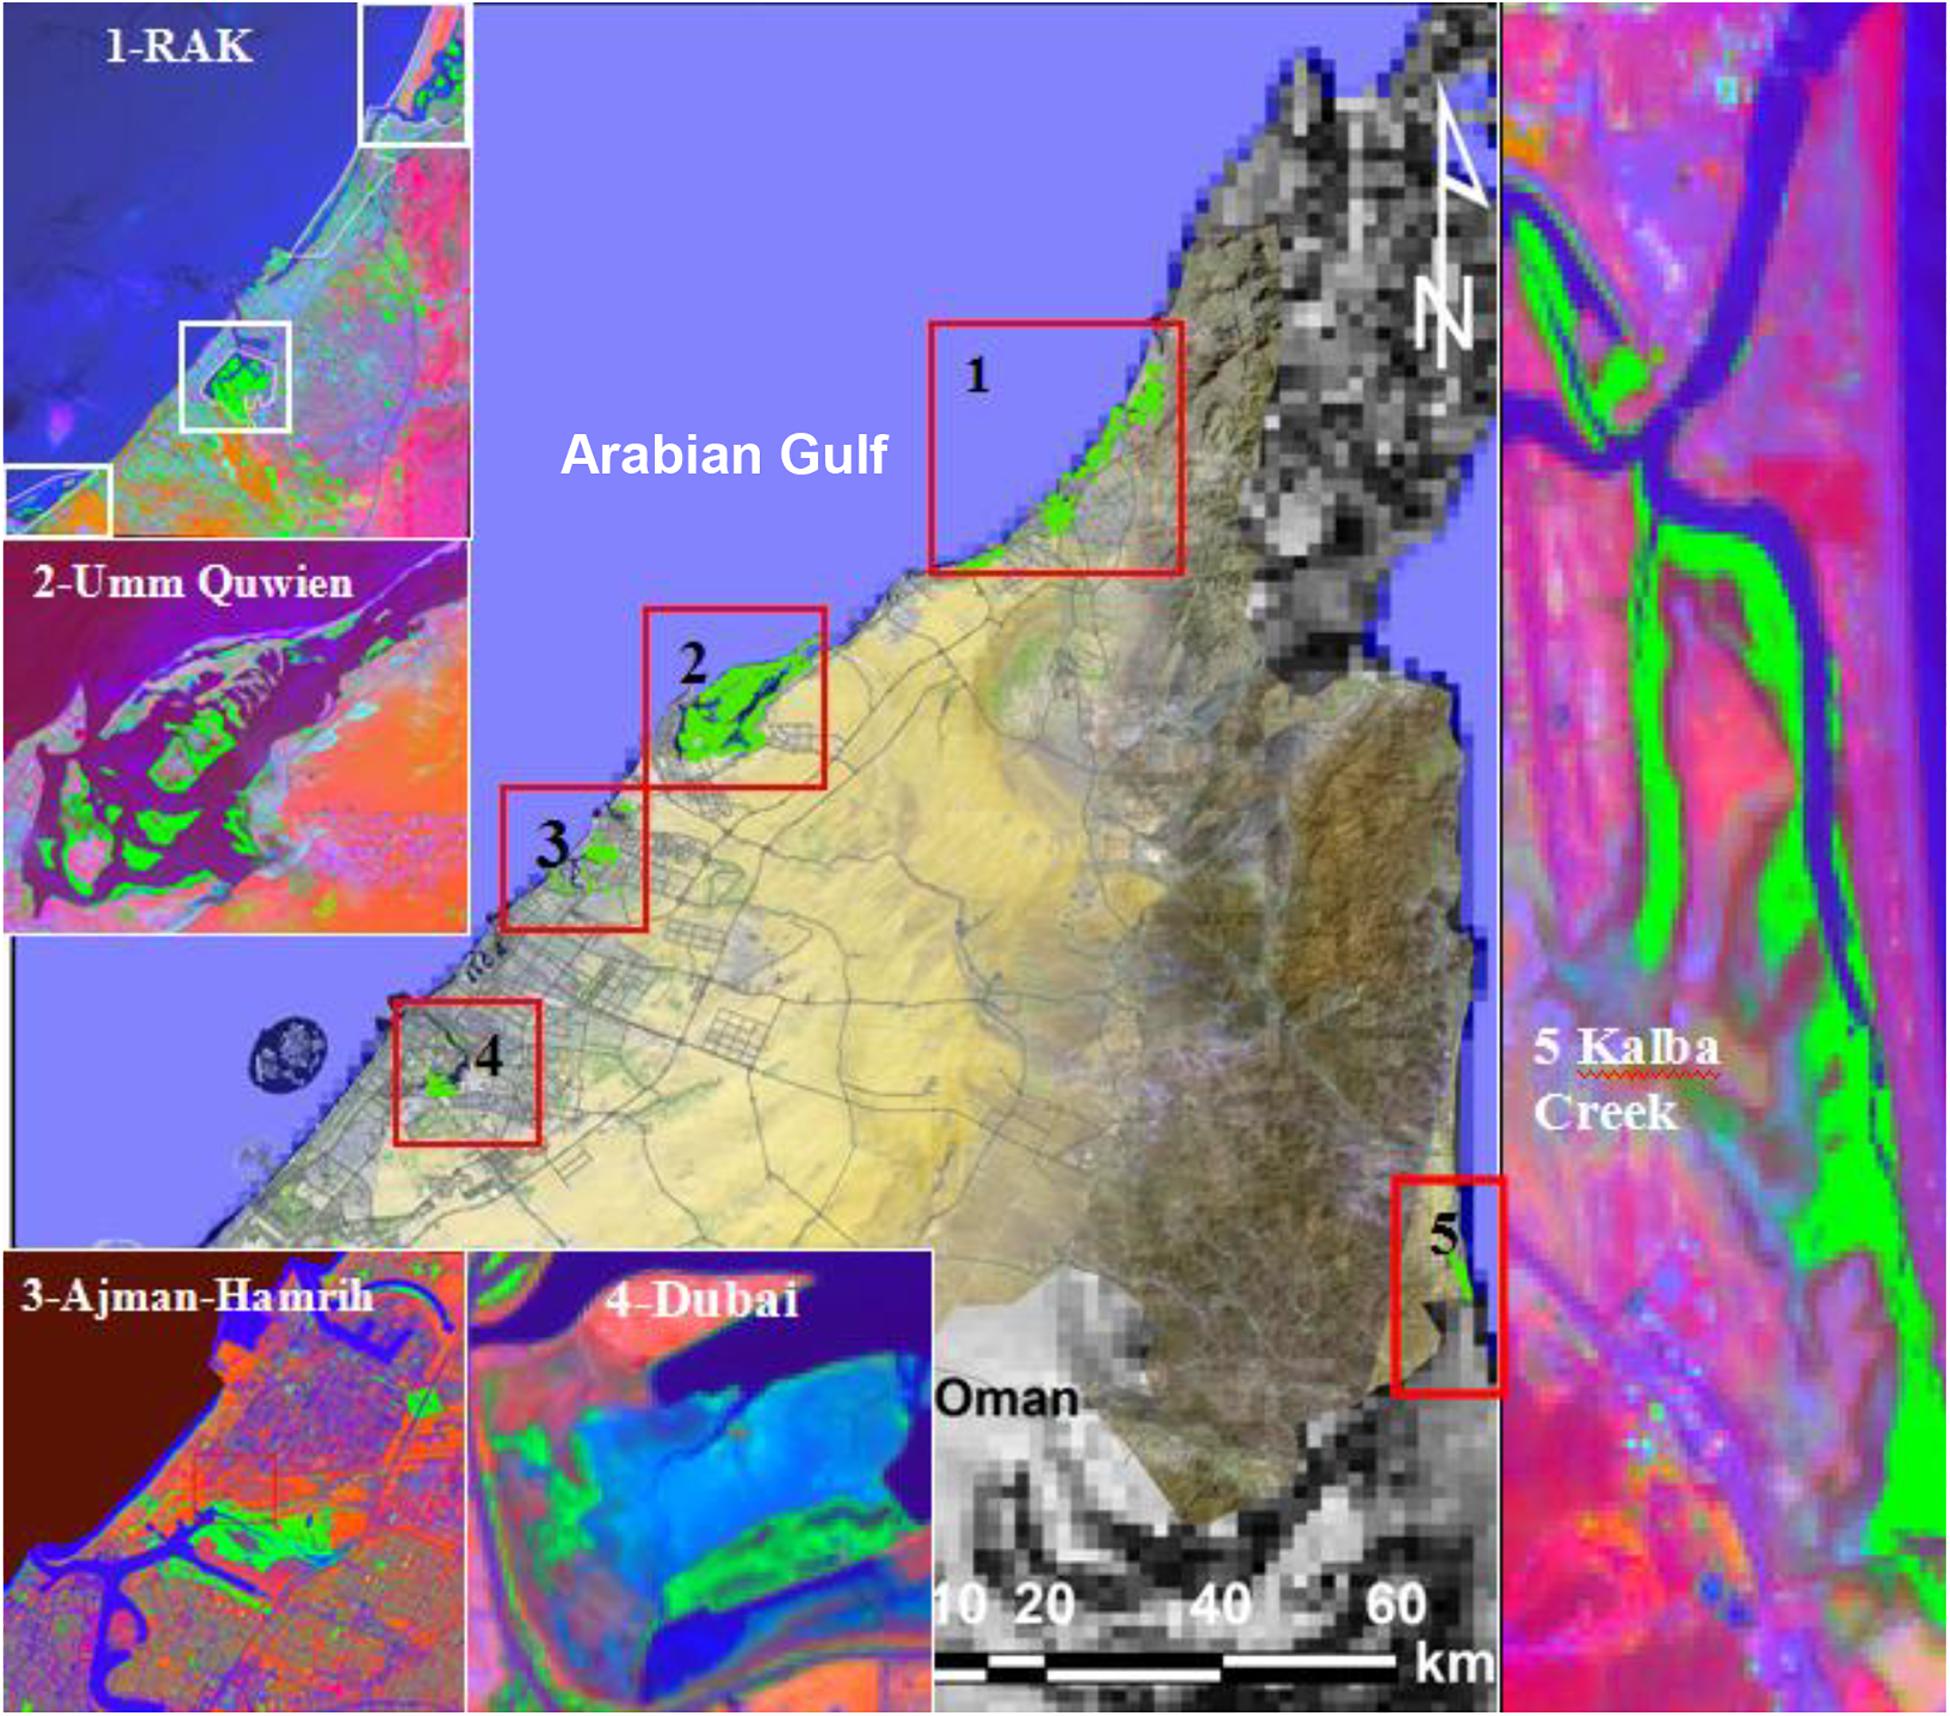
Figure 3. RGB 541 band combination of Landsat image of the NUAE and zooms of the mangrove locations distributed along the eastern and western coastal areas in the NUAE.
Two remotely sensed data were used in this study. The first dataset was the Landsat Thematic Mapper (TM) acquired on August 23, 1990, the Landsat Enhanced Thematic Mapper (ETM+) acquired on August 23, 2000 and August 19, 2010 and the Operational Landsat Imager (OLI) Landsat 8 acquired on August 15, 2019 (Path 160, rows 42 and 43). The data were obtained via the USGS Earth Resources Observations and Science (EROS) Center through the Global Visualization Viewer1. The mangrove forests in Landsat images (coastal areas) were then clipped into five subsets to reduce the image processing time by avoiding unnecessary calculations (Amarsaikhan et al., 2009; Diniz et al., 2019; Ma et al., 2019). We used the Landsat images due to their suitability spectral and spatiotemporal resolutions, free of charge, easy accessibility, and time-series availability (Chander, 2009; Irons et al., 2012; Elmahdy and Mohamed, 2018; Milani, 2018; Toosi et al., 2019). Additionally, Landsat images are provided in orthorectification format at a lower level of cloud cover (Darvishsefat, 1995). The second dataset includes the QuickBird images with a spatial resolution of 0.6 m acquired on August 22, 2019, the Advanced Spaceborne Thermal Emission and Reflection Radiometer (ASTER), and Earth Observing-1 (EO-1) images with a spatial resolution of 30 m acquired on August 13, 2019 and July 29, 2019, respectively.
The spectral coverage of ASTER sensor consists of four visible and near-infrared bands (0.52–0.86 μm) with a spatial resolution of 15 m, six shortwave infrared (SWIR) bands (1.6–2.43 μm) with a spatial resolution of 30 m and five thermal bands (8.125–1165 μm) with a spatial resolution of 90 m. The EO-1 Advanced Land Imager (ALI) provides Landsat type panchromatic and multispectral bands. These bands have been designed to mimic six Landsat bands with three additional bands covering 0.433–0.453, 0.845–0.890, and 1.20–1.30 μm. The ALI also contains wide-angle optics designed to provide a continuous 15° × 1.625° field of view for a fully populated focal plane with a 30-m resolution for the multispectral pixels and 10-m resolution for the panchromatic pixels.
These datasets were downloaded via the USGS EROS Center through the Global Visualization Viewer (see footnote 1). We used these various datasets to collect training datasets as input to the classifiers and visual verification of the obtained mangrove maps and compare the textural features (mangroves and non-mangrove areas), mapped from Landsat images against those mapped from the ASTER and EO-1 images using RF, KLR, and NB algorithms.
After collecting the remote sensing data, the datasets were all re-sampled to UTM WGS 84 projection, at a spatial resolution of 30 m with mean root square error values of less than 0.40 pixels. All the United Arab Emirates images were assigned to a UTM zone 40 N and datum WGS 48 (Jensen, 1996; Foody, 2002) followed by an atmospheric correction. The atmospheric correction was performed by Fast Line-of-sight Atmospheric Analysis of Hypercubes (FLAASH) implemented in Envi v. 4.6 software. Fast Line-of-sight Atmospheric Analysis of Hypercubes process consists of radiometric calibration and dark subtraction. In radiometric calibration, beta nought calibration, all digital number (DN) values were converted into Top Of Atmosphere (TOA), reflectance. Top Of Atmosphere was performed using four parameters, namely, calibration type (reflectance), output interleave (BSQ), output data type (float), and scale factor value of 1. In dark objects subtraction, TOA was converted into surface reflectance (SR) using band minimum (Green et al., 1988; Foody, 2002; Todd and Chris, 2010).
The training data collection is a very important step in producing a higher quality of classification, especially when the classifiers trained with training datasets with higher spatial resolutions (Elmahdy and Mohamed, 2018). The training datasets were collected from QuickBird images with a spatial resolution of 0.6 m using a straight random sampling or proportional method, which reduces error and bias. This method divides the population into homogenous groups and produces training sample sizes that are directly related to the size of the classes. We used this method due to its ability to reduce bias and errors (Van Niel et al., 2005; Elmahdy and Mohamed, 2018).
Random sampling collection was performed using Envi v. 4.5 software. In total, 536 training datasets were collected and divided into 375 (70%) for training and mangrove mapping and 161 (30%) for validation of this study. The collected training datasets were checked using visual interpretation and knowledge and background of the authors and where they live (Figure 4).
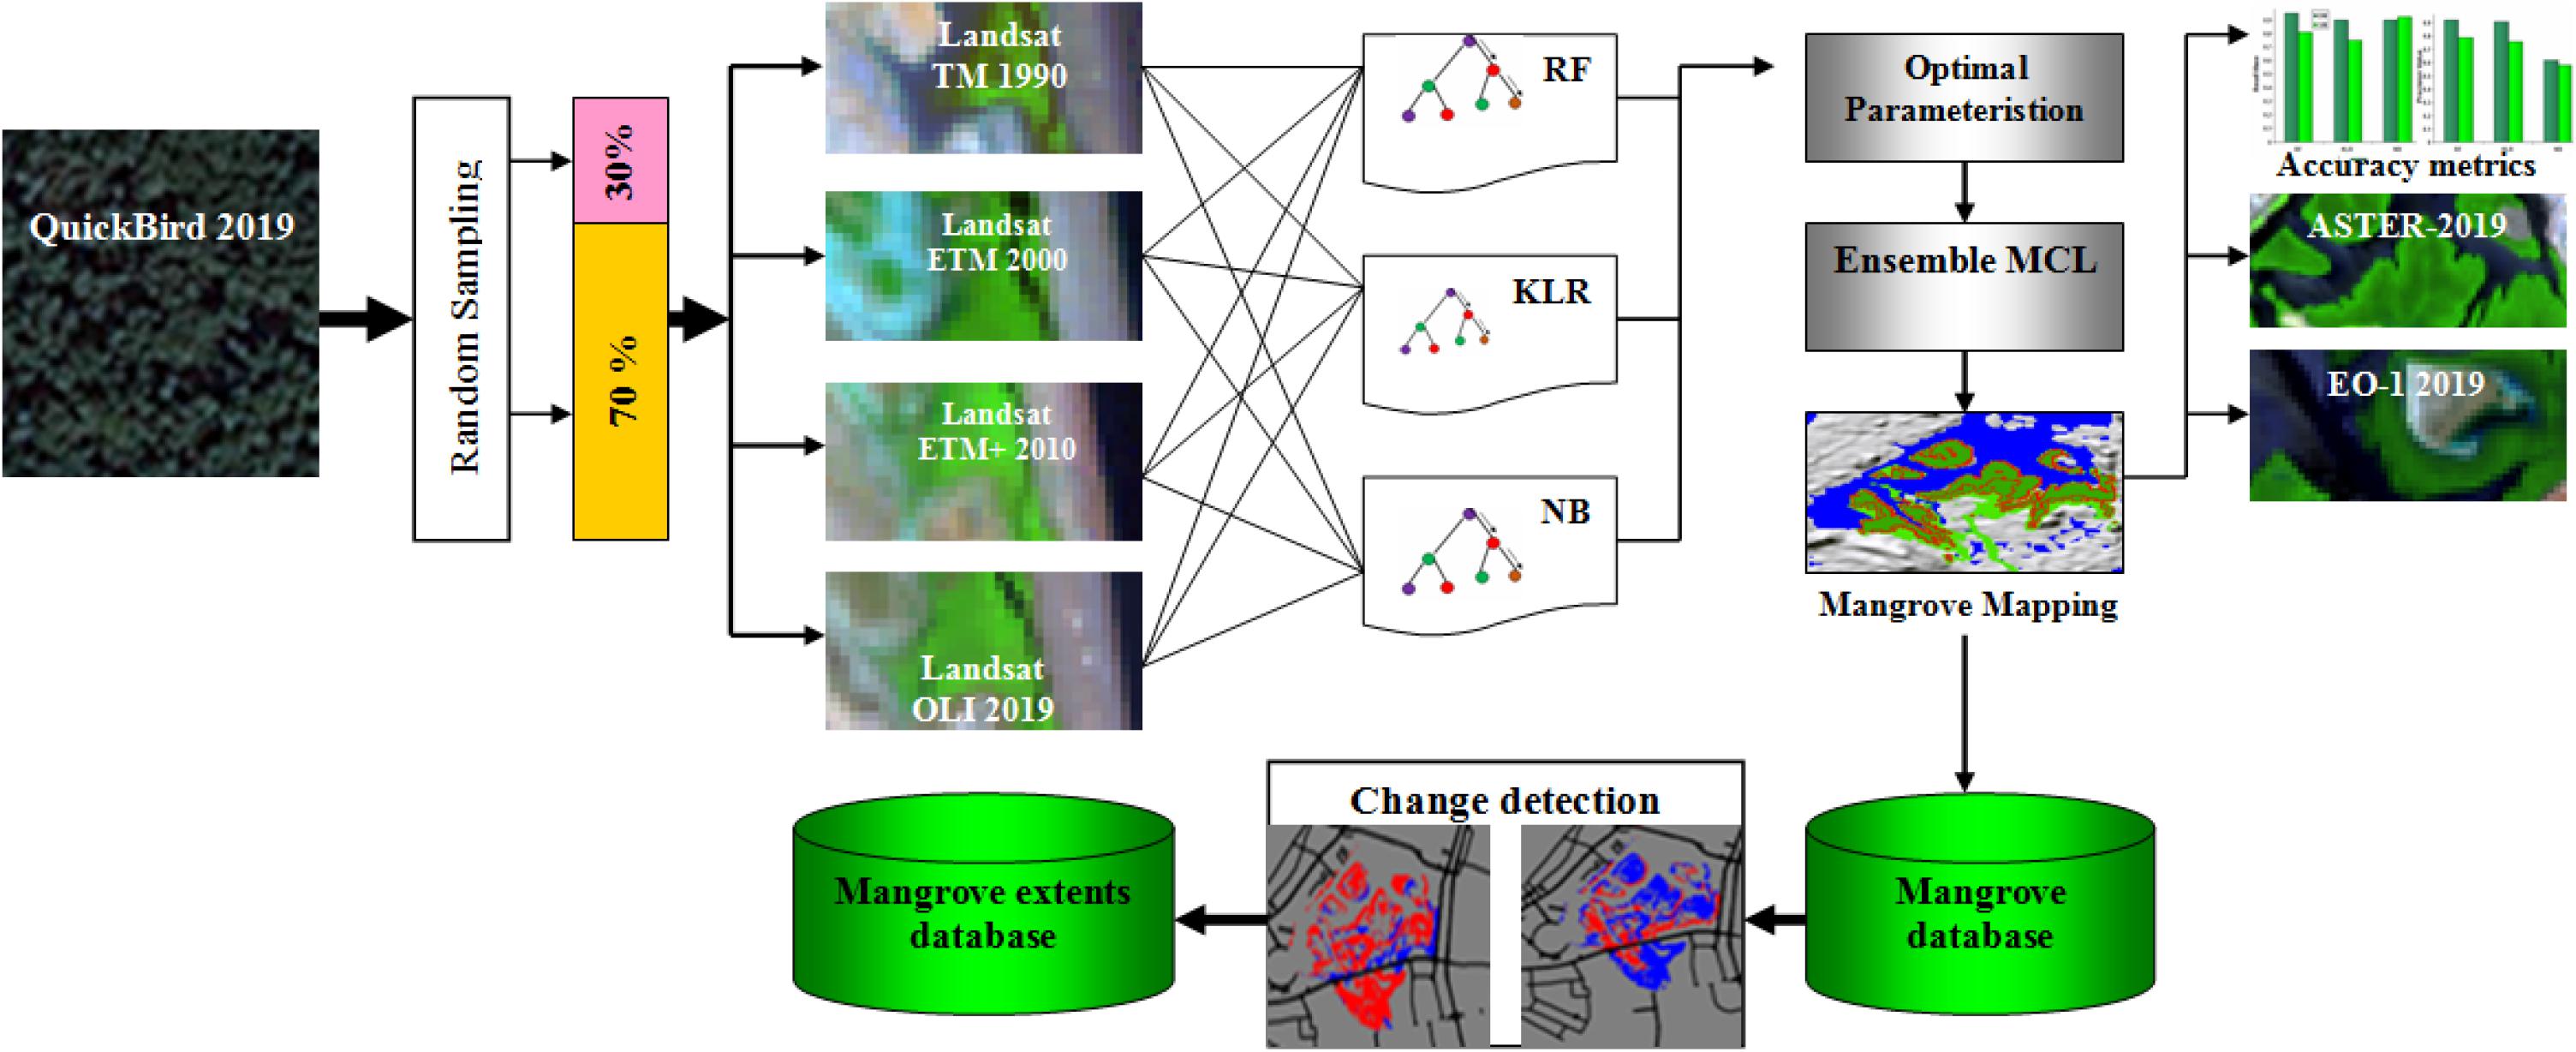
Figure 4. Flowchart of the methodology applied in this study.
To classify and map mangrove forests in an accurate and low-cost way, it is important to employ machine learning algorithms, then learn these algorithms with training datasets with a higher spatial resolution as well as algorithm optimal parameterization (Huang et al., 2009; Elmahdy and Mohamed, 2018).
The RF algorithm can provide a higher quality of classification than linear classifiers and has been employed previously to map and classify mangroves in Iran based on Landsat images (Kamal and Phinn, 2011; Kamal et al., 2015). The algorithm performs well for mangroves mapping over a regional scale and its ability to handle data with unclassified pixels (Prasad et al., 2006; Taalab et al., 2018; Thomas et al., 2018). Random forest algorithm is a non-parametric ensemble machine learning and one of the most popular algorithms that provide high-quality of mangroves classification and environmental modeling (Strobl et al., 2008; Vyas et al., 2011; Bachmair and Weiler, 2012; Torres and Qiu, 2014; Fu et al., 2017). It is a combination of classification and regression tree (CART).
A regression tree is a hierarchy and comprises of a root node, node separator (decision rules) and end of a leaf node (desired classes). The algorithm involves an ensemble of tree- structure classifiers and each tree starts by choosing a set of random model units selected separately. Then, it creates a forest using the vote on all decision “tree” in the “forest.” Then, two-thirds of the set was employed to make the decision tree and the remaining data are then used to estimate the model performance based on a bootstrapping procedure (Breiman, 2001; Schapire, 2003). Finally, the best model was chosen based on the majority vote approach (Yu et al., 2011). The model is flexible and can be used to solve problems related to classification and exploit the information provided by several condition variables (Catani et al., 2013; Ha et al., 2020). The model uses a random selection of predictor variables to divide each node of the trees. After that, each tree was developed in such a way as to reduce errors in the classification process. However, this type of random selection influences the results, hence creating a very unsuitable single-tree classification (Figure 5).
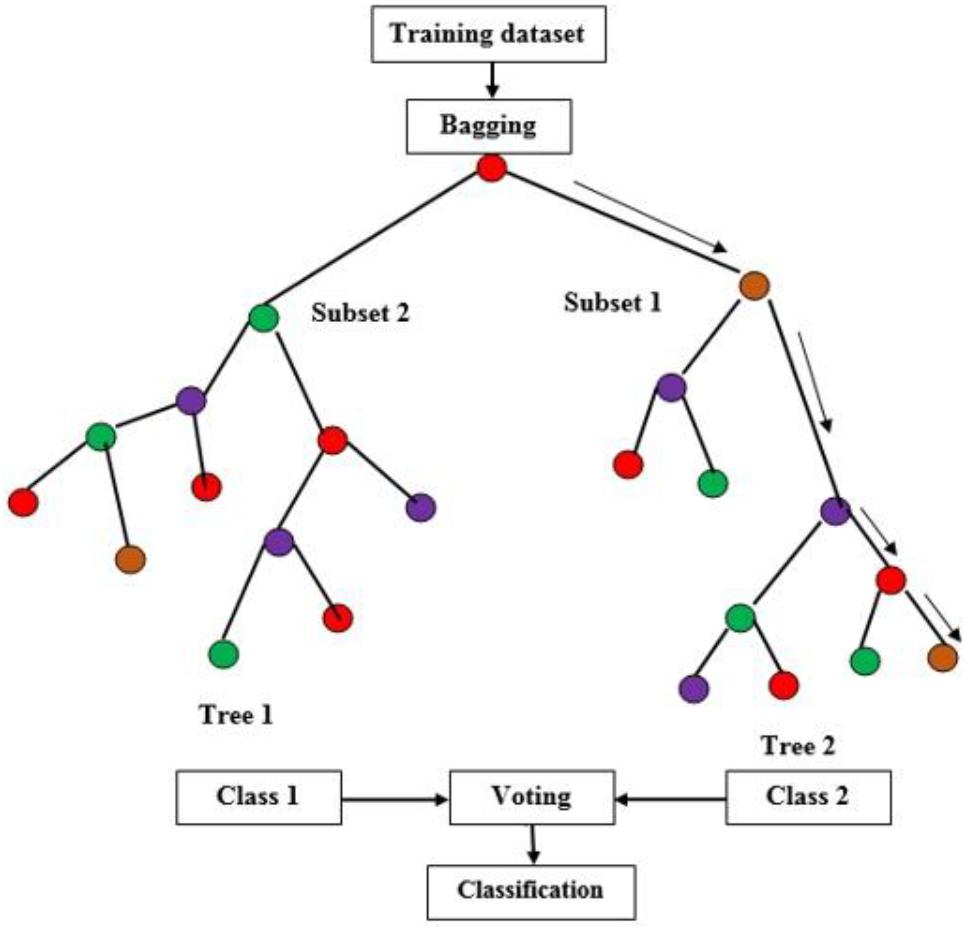
Figure 5. Flow chart of classification using machine learning algorithms.
The algorithm is widely employed in environmental modeling (Strobl et al., 2008; Bachmair and Weiler, 2012), although only rarely in land subsidence and sinkholes susceptibility mapping (Vorpahl et al., 2012).
For b = 1 to B:
(b) Grow a random-forest tree Tb from the bootstrapped data, by recursively repeating the following steps for each terminal node of the tree, until the minimum node size nmin is reached.
1. Select m variables at random from the p variables.
2. Pick the best variable/split-point among the m variables.
3. Split the node into two daughter nodes.
Kernel logistic regression is a discriminative machine learning classifier that differentiate the mangrove and non-mangrove classes perfectly where probabilistic output are evaluated based on minimizing the negative log-likelihood function using the Broyden–Fletcher–Goldfarb–Shanno (BFGS) optimization (Yokoya and Iwasaki, 2010). It is described as the kernel version of logistic regression capable of converting into a high-dimensionality feature space of the original input feature space kernel functions (Tanaka et al., 2011).
The kernel function can be defined as the basic function in which ϕ is supposed to be unidentified:
where T is the inner product in the Z space.
Suppose a set of training dataset {xi,yi}Ni = 1 with xi ϵ Rn as input parameters with n variables and N data samples. Here, the input parameters are dense mangrove, dispersed mangrove and non mangrove.
yk ϵ {1,0} is the related label that indicates mangrove and non-mangrove classes. The KLR was applied to built a non-linear decision boundary that may divide the two classes in the feature space based on the following equation:
where y (x) is the logistic function with values in [0,1]; αi is a vector of dual model parameters, whereas b is the intercept; K(xi, xj) is the kernel function.
For our study, radial basis function (RBF), which is used widely in the literature, was chosen due its flexibility and reliability (Bui, 2015; Hong et al., 2015).
Naive Bayes (NB) is a machine learning classifier that creates a probability-based model. It works based on Bayes Theorem, which is known as Naive Bayes. The NB uses a decision tree (DT) for its structure and organizes the NB model on every leaf node of the constructed DT. The NBT exhibits a significant classification performance and accuracy (Liang et al., 2006; Wang et al., 2015).
During the NB process, the impact of an attribute value on a specific class is an independent value of another attribute and known as class conditional independence. This conditional independence of NB makes the datasets to train quicker and it considers all the vectors as independent and applies the Bayes rule (Farid et al., 2014).
The theorem of the Bayes can be explained as follows:
where:
P(A|B) = conditional probability of A given B;
P(B|A) = conditional probability of A given B;
P(A) = probability of event A;
P(B) = probability of event B.
This classifier was chosen due to its: (i) quick training and classification, (ii) powerful to irrelevant features, (iii) easy to use and understand, and (v) ability to work with few numbers of training datasets (Ho, 1998).
The model starts by estimating the probability of each class in the model, calculating covariance and variance matrix, and building the discrimination function for each class (Pham and Yoshino, 2015; Wang et al., 2015).
For the KLR and NB, mapping and monitoring of mangroves were performed using SATISTICA v. 7 (Fleiss et al., 2003; Hill and Lewicki, 2006) and Salford system (Friedman, 2001; Friedman, 2002). These tools have a stochastic gradient boosting tree which is used widely for regression problems related to predict and map a continues dependent variables (Hill and Lewicki, 2006). After that, the setting and optimizing of all parameters were performed. These parameters namely; learning rate, the number of additive trees, the proportion of subsampling, and so forth. Here, the optimal value for the learning rate was set as 0.1, additive trees were 185 and the maximum size of the tree was 5. These values may lead to precise result accuracy (Friedman, 2001).
To get the optimum RF parameter values, we tested several RF parameter values. These parameters include the maximum total of tree depth, the minimum numbers of samples per node (sample), and maximum tree number (tree number). The tested values of tree depth and minimum sample per node were 0,1,5, 10, 20, 50, 100, 500, and 1000, while the maximum tree number values were 50, 100, 200,400,800, and 1000. After that, the best band combination of RF parameters and the highest overall accuracy was chosen and applied. RF was applied to each Landsat image separately using 536 training data sets collected from QuickBird images with a spatial resolution of 0.6 m. The classification process was performed using the R package (Catani et al., 2013).
Among several ensemble methods, the stacking algorithm was employed to build the ensemble model with a threshold of 0.9 used to detect mangrove pixels. The algorithm builds a model on of the RF, KLR, and NB machine learning algorithms based on the selected training datasets R package via the “glmet”.
To evaluate the performance of the classifiers, maps of mangroves were standardized and compared based on a pixel by pixel producing numerical values for mangrove commission, mangrove omission, total incorrect pixels, percentage of incorrect pixels, precession, recall, and F1 score (Congalton et al., 1983; Raschka, 2018; Raschka and Mirjalili, 2019). Once the classification process was achieved, it is important to evaluate classifiers’ performance. Confusion metrics include accuracy, precision, recall, F1 score was found to the best technique and used widely in this literature (Ha et al., 2020). The calculation of accuracy, precision, recall, and F1 score is based on four parameters namely; true positive (TP), true- negative (TN), false-positive (FP), and false-negative (FN). Accuracy, precision, recall and F1 score can be calculated via the following equations:
or
where ypredi is the predicted value and y is the corresponding true value
where po is the observed agreement ratio and pe is the expected agreement
where TP is the true positive; FP is the false positive; and FN is the false negative.
The performance of machine learning algorithms were evaluated using the open source R 4.0.0 software.
Further evaluation of the performance of the RF, KLR, and NS algorithms were performed by applying them on the ASTER and EO-1 with a spatial resolution of 30 m and calculate the total area of mangrove (Mondal et al., 2019) and the textural features (mangroves and non-mangrove areas) evident from Landsat images were compared against those from the ASTER and EO-1 images with a spatial resolution of 30m using RF, KLR, and NB algorithms. This method was applied to the Kalba mangrove natural reserve on the eastern side of the study area. These two methods can be considered as an alternative way of field observation, especially when the mangrove forests are located in remote and inaccessible areas (Elmahdy and Mostafa Mohamed, 2013a, b; Elmahdy and Mohamed, 2018; Estoque et al., 2018).
Among several change detection techniques, ID algorithm was chosen to monitor mangrove changes. The ID algorithm was chosen due to its ability to locate the changes in mangroves within each class (dense and sparse) (Mishra et al., 2017; Elmahdy and Mohamed, 2018). The ID algorithm determines the difference in the DN values in each pair of mangrove images (1990–2000, 2000–2010, 2010–2019, and 1990–2019). This can serve as an indicator of mangrove change which has occurred over the NUAE. Monitoring changes start with proper input parameters such as the number of classes, threshold value and change detection type. Threshold value locates the changes in mangroves within each class, epending on the type of remote sensing data (Singh, 1986).
The threshold values are evenly spaced between (−1) and (+1) for simple difference (the initial state image is subtracted from the final state image). The positive changes (positive value) represent the first (n/2) classes, while the negative changes represent the last (n/2) classes. The no-change class [(n/2) + 1] represents the middle class (Figure 4), and normalizing the images (raster maps) by subtracting the image minimum. On the final change detection maps, a positive change was identified when pixels took on a red color code (final state image), while a negative change was identified when pixels took on a blue color code (initial state image). Monitoring the NUAE mangrove changes were performed using a change detection tool implemented in the Envi v.4.5 software.
Figures 6A–C show different precision, recall, and F1 values for RF, KLR, and NB. Random forest and KLR yielded the highest values (0.95) for F1 score, while NB presented the lowest value (0.75) for F1. Slight differences in F1 score between RF and KLR algorithms were observed. This difference appears to be due to the difference in precision and recall scores and this difference to be due to the difference in overall incorrect pixels between RF, KLR, and NB. Both RF and KLR showed a strong ability in discriminating between dense mangrove compared with NB. However, all models showed less ability to distinguish dispersed mangroves as indicated from F1 score (<0.8), and thus, lower ability to detect mangrove forests. This lower accuracy due to lower ability in discriminating between mangrove and non-mangrove areas and the lower ability in discriminating owing to the lower reflects. Results of cross-validation showed that the RF and KLR classifiers predicted and classified mangrove from the EO1 ALI better than NB classifier. The extent predicted mangrove areas by the RF and KLR have a wider range compared to those predicted by NB (Figure 6D).
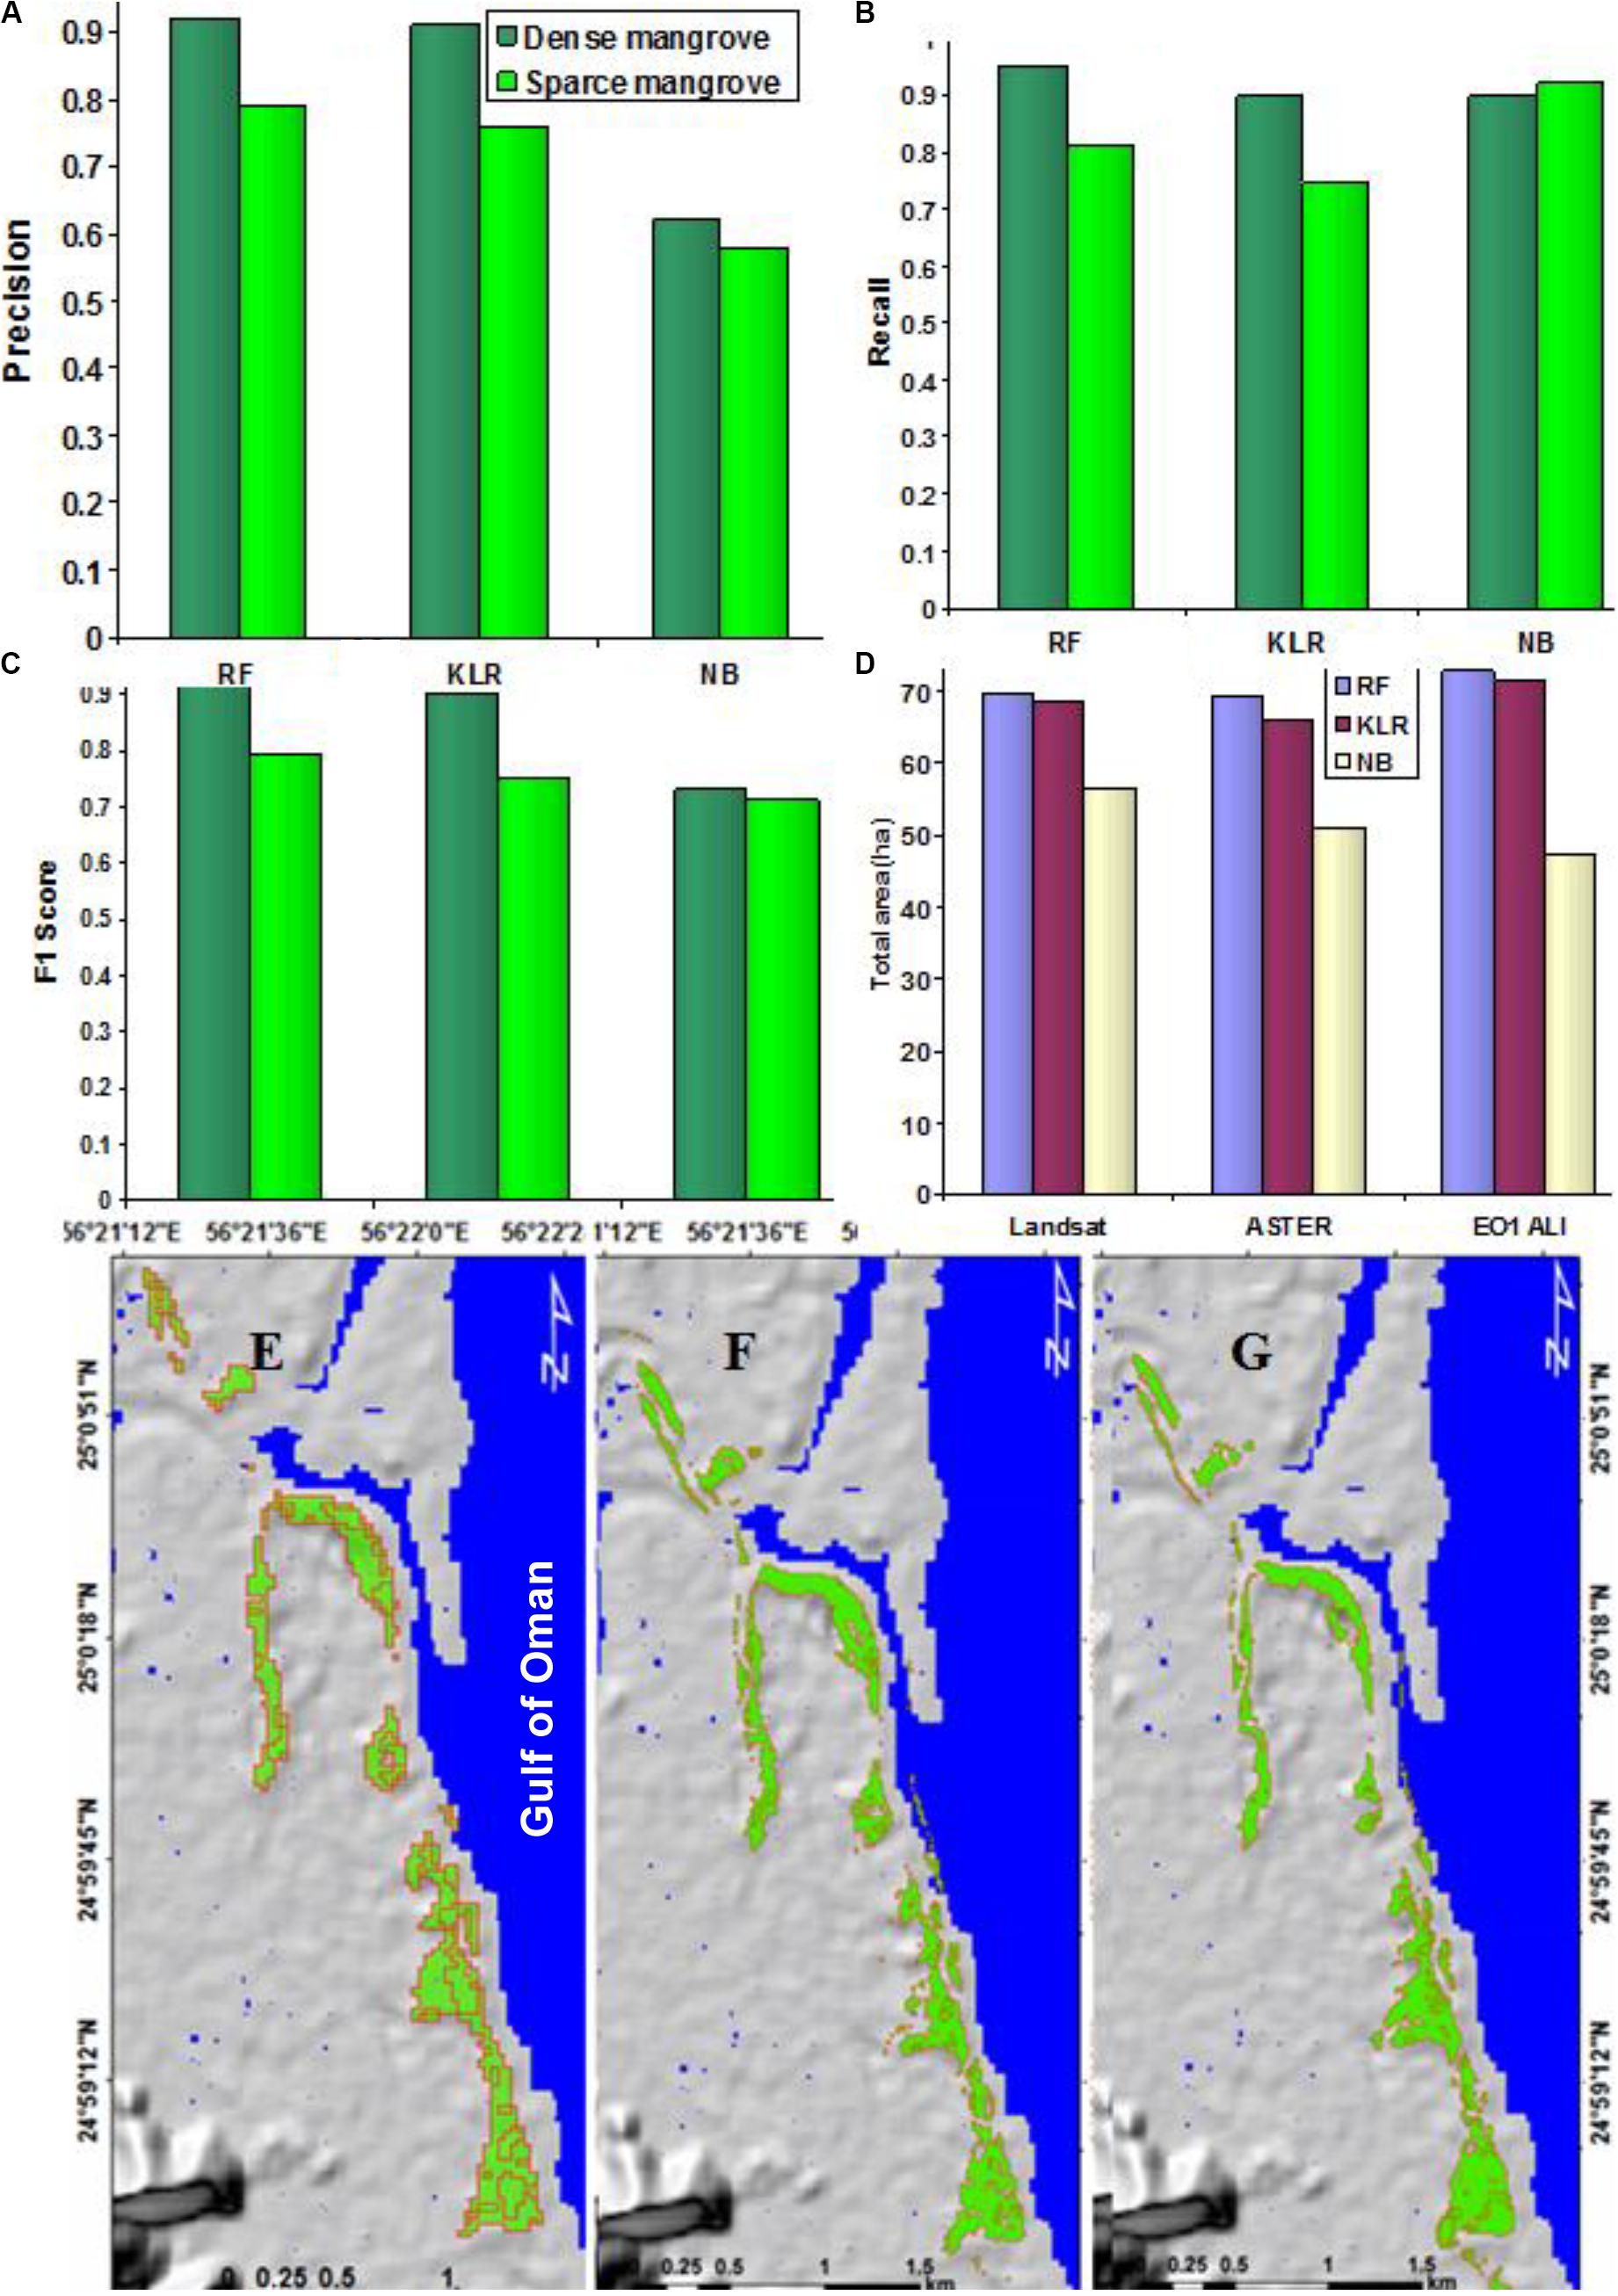
Figure 6. A comparison of the precision (A), recall (B), and F1 scores (C) for the Landsat image (August 15, 2019) using RF, KLR, and NB classifiers and total area in ha mapped using RF, KLR, and NB (D) and feature extracted from the Landsat images (E), ASTER images (F), and EO-1 (G) for the year 2010.
Both RF and KLR predicted an area of 72.86 and 71.7 ha, respectively. However, the mangrove extent predicted by the NB has a lower range of mangroves from the Landsat, ASTER and EO-1 images. Although these images have the same spatial resolution, the ASTER and EO-1 miss the regular time span and geographical coverage of the NUAE mangrove. Further validation of the proposed approach was performed by comparing textural features from Landsat images against those extracted from the ASTER and EO-1 images using RF, KLR, and NB algorithms (Figures 6E–G).
Maps of mangrove forests produced from the Landsat images using RF classifier with a population minimum of 100 and 8 neighbors are shown in Figures 7–10. The figures comprise of two color codes to facilitate visual interpretation. The first color code is dark green corresponding to dense mangroves (healthy mangroves). These dense mangroves are located on the gentle slopes of tidal flats, easily discriminated and concentrated in the middle parts of the mangrove patches. The second color code is light green, corresponding to disperse mangroves and are difficult to discriminate and map and are clustered around the dense mangroves and submerged in the water. The figures show that the mangrove forests are mainly spatially distributed in creeks (Khors in local language) of Kalba (Figures 7, 11B), Ras Al Khaimah (Figures 8, 11C), Ajman-Hammria and Dubai (Figure 9), and Umm Al Quwain (Figure 10), which represent about 35% of the total area of the United Arab Emirates mangrove (Elmahdy and Mostafa Mohamed, 2013a, b).
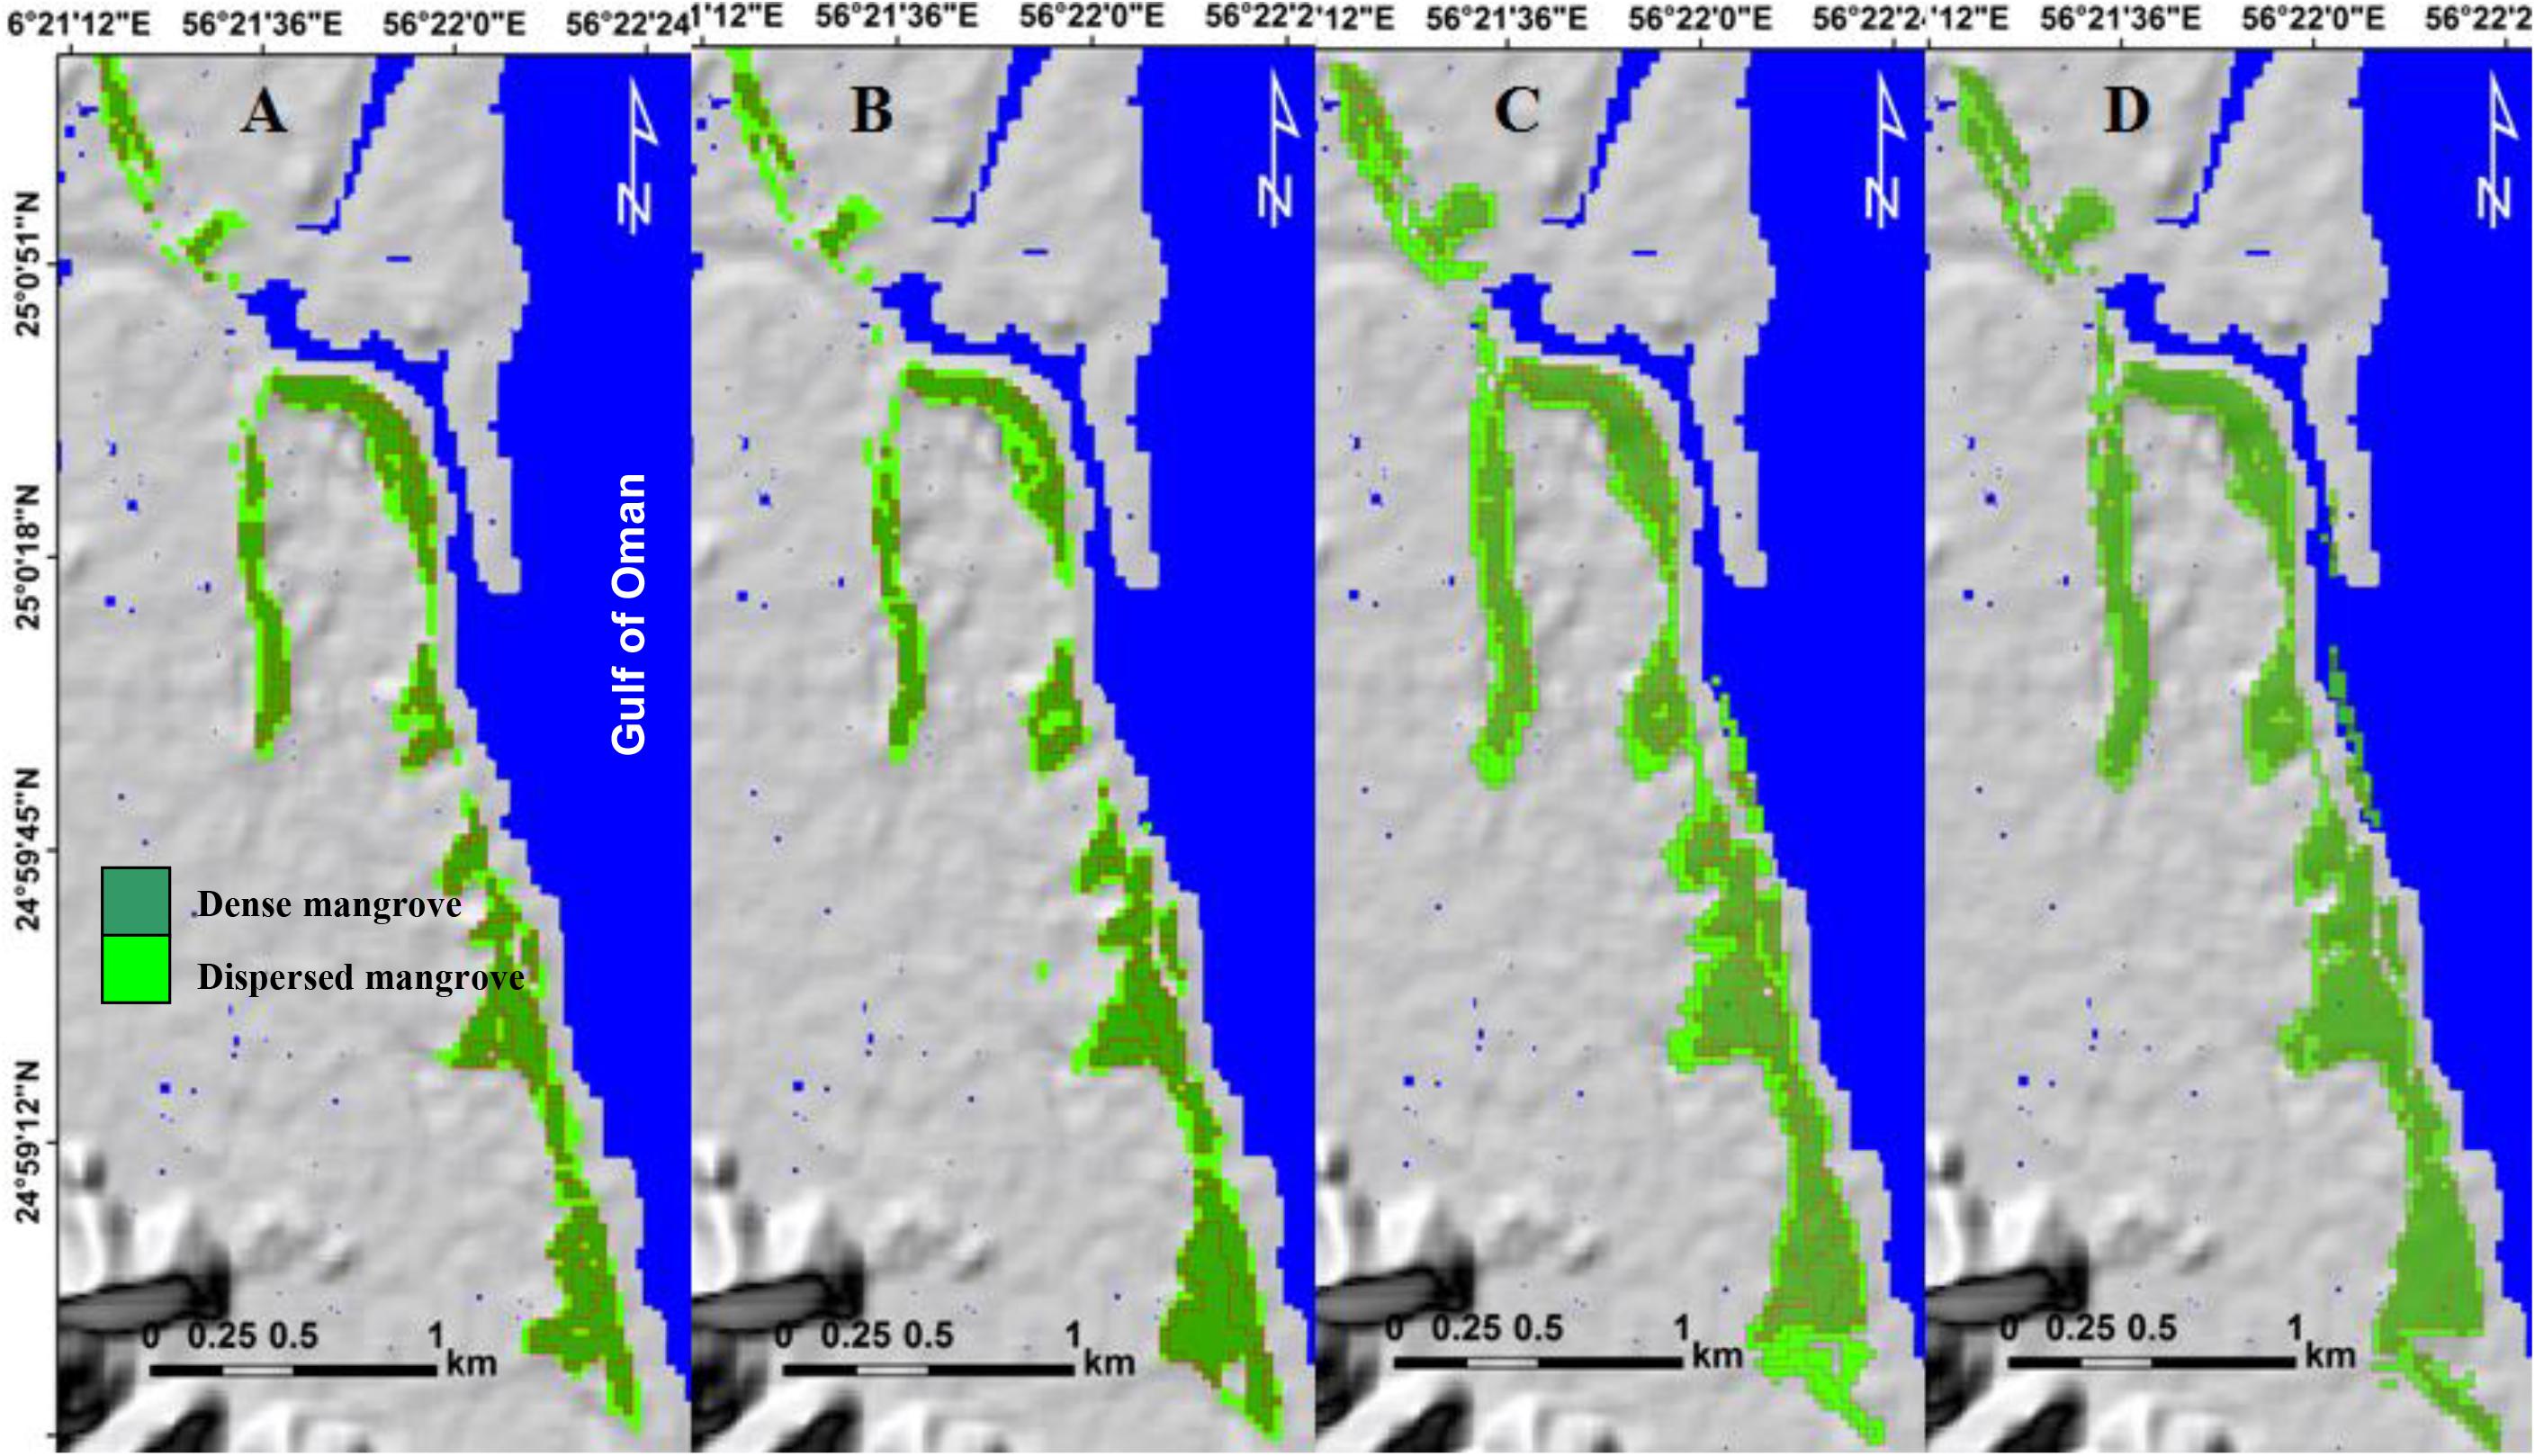
Figure 7. Spatiotemporal variation of mangrove forests in Khor Kalba of the Emirate of Sharjah for the years 1990 (A), 2000 (B), 2010 (C), and 2019 (D).
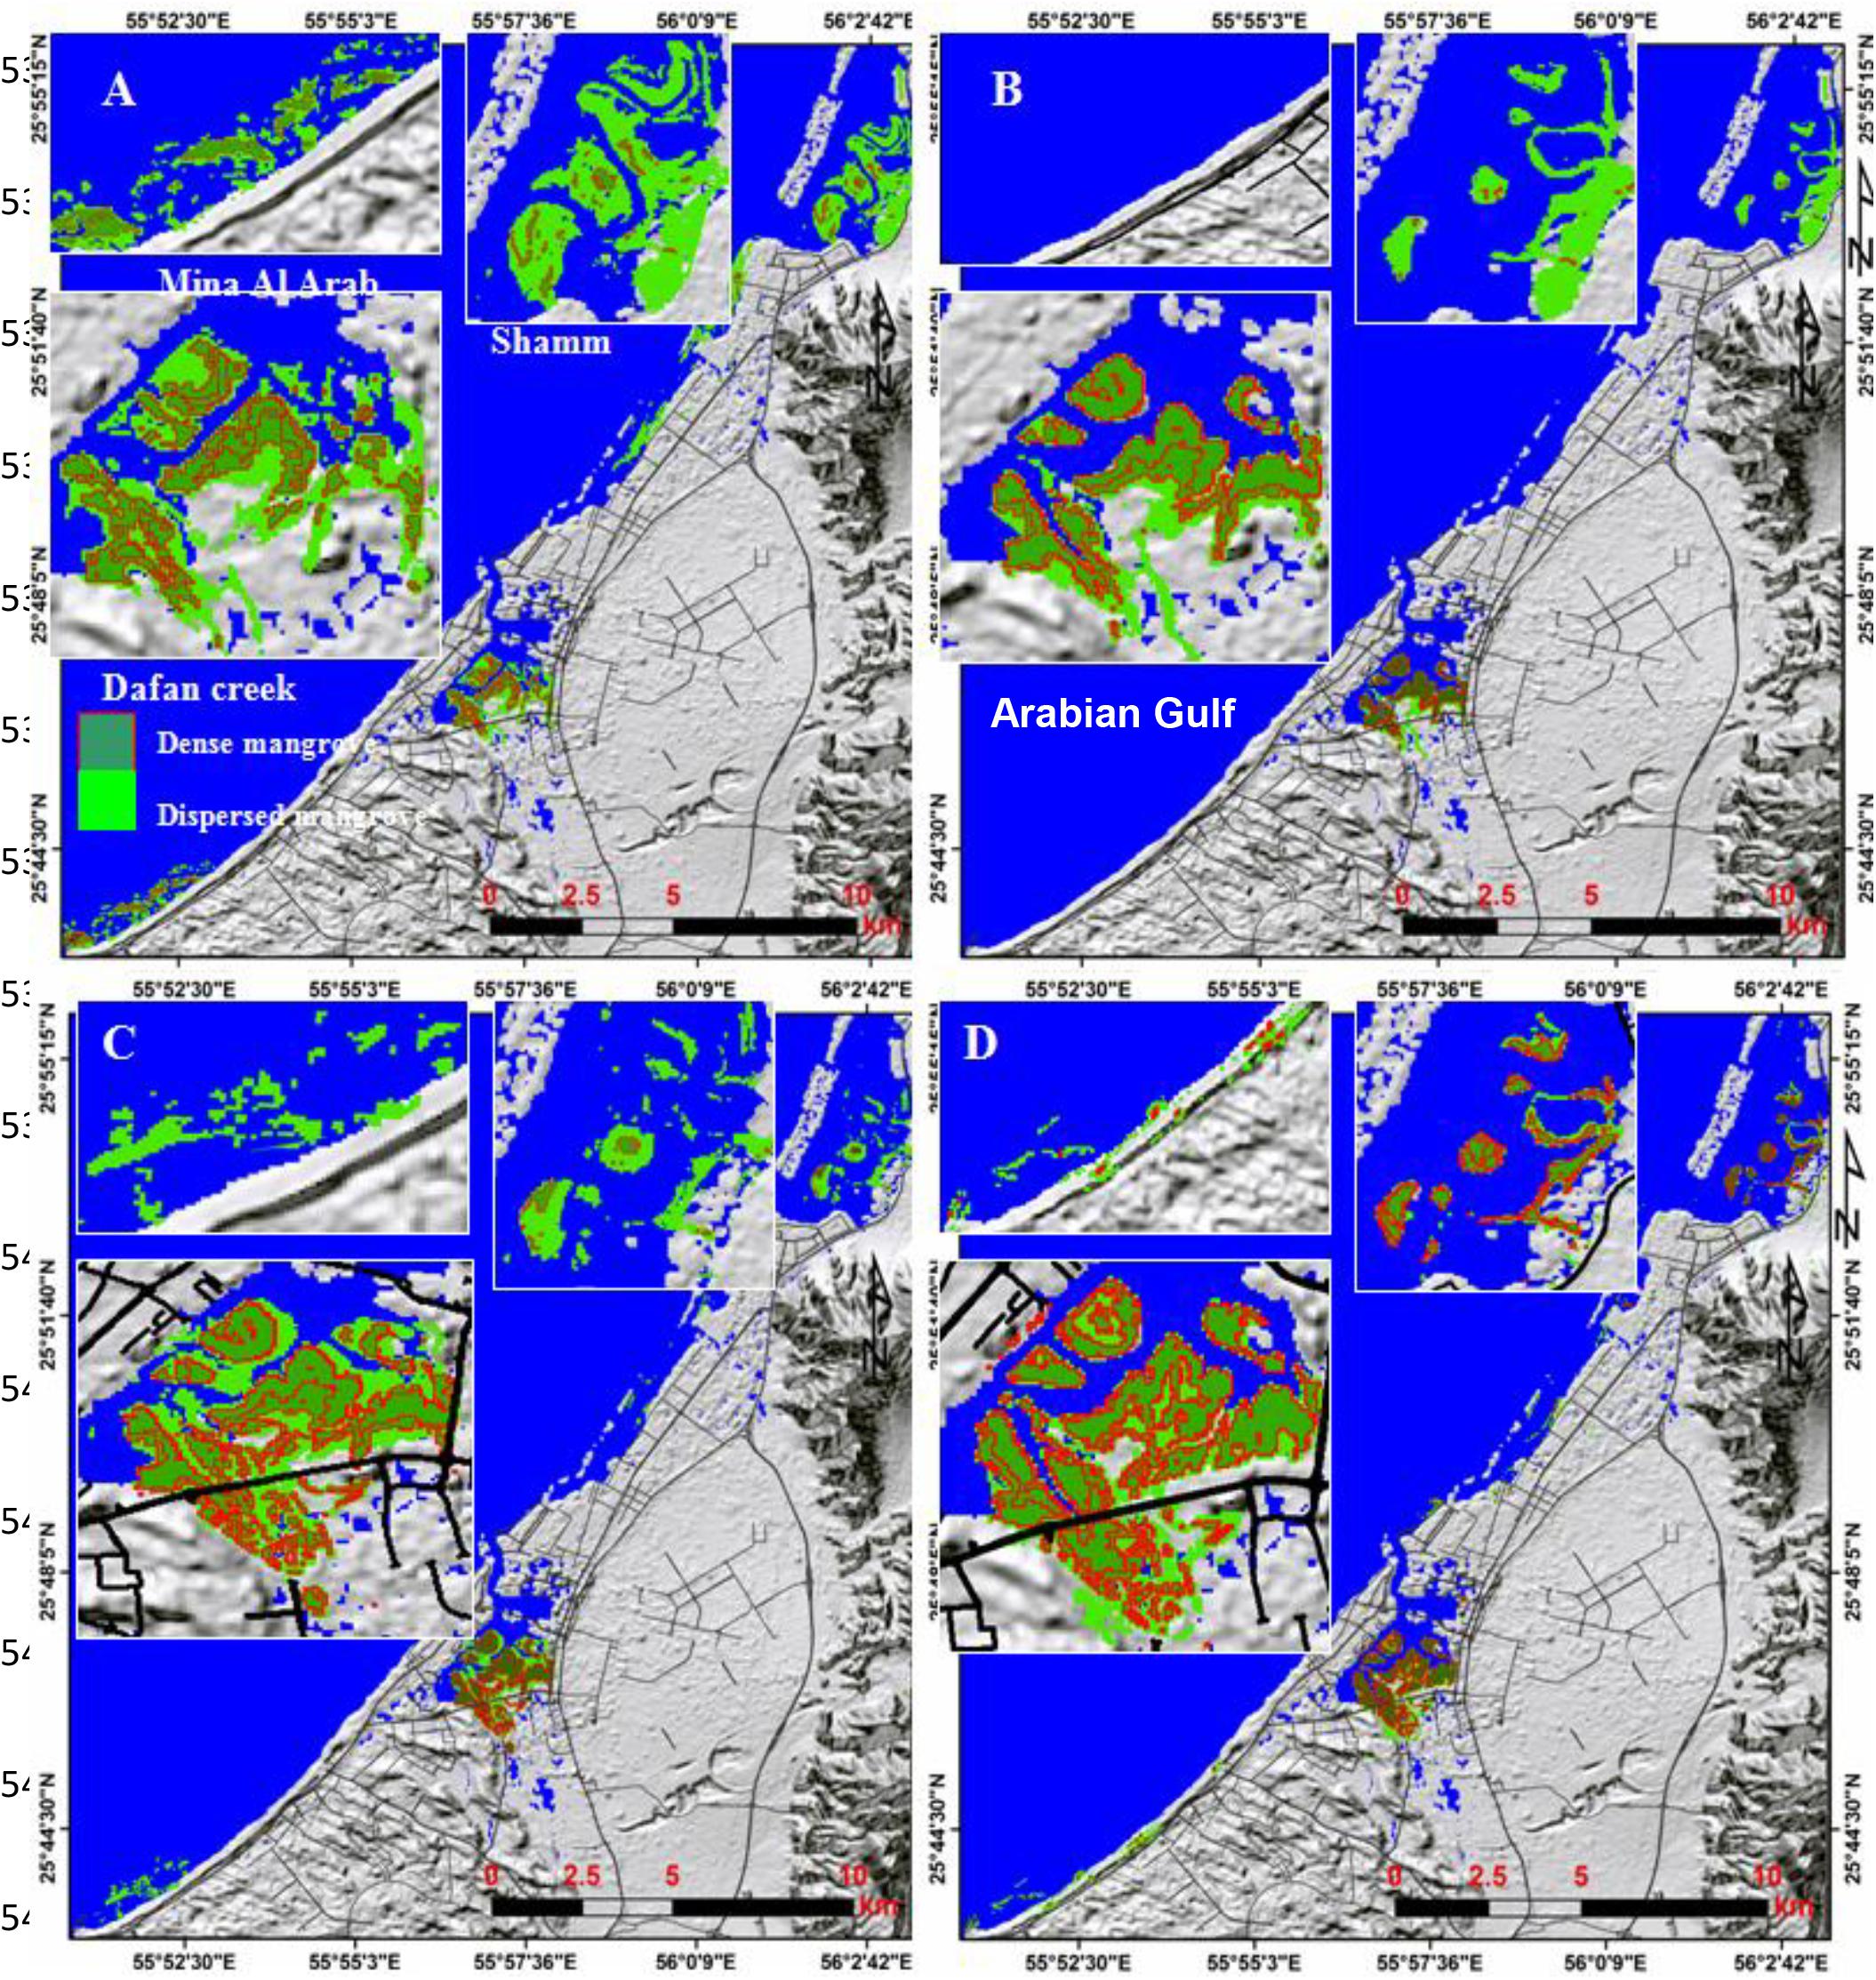
Figure 8. Spatiotemporal variation of mangrove forests on the coastal area of RAK for the years 1990 (A), 2000 (B), 2010 (C), and 2019 (D) and zooms of Mina Al Arab (southwest), Dafan creek (middle), and Shamm (northeast). Red polygons and dark green highlight dense mangroves.
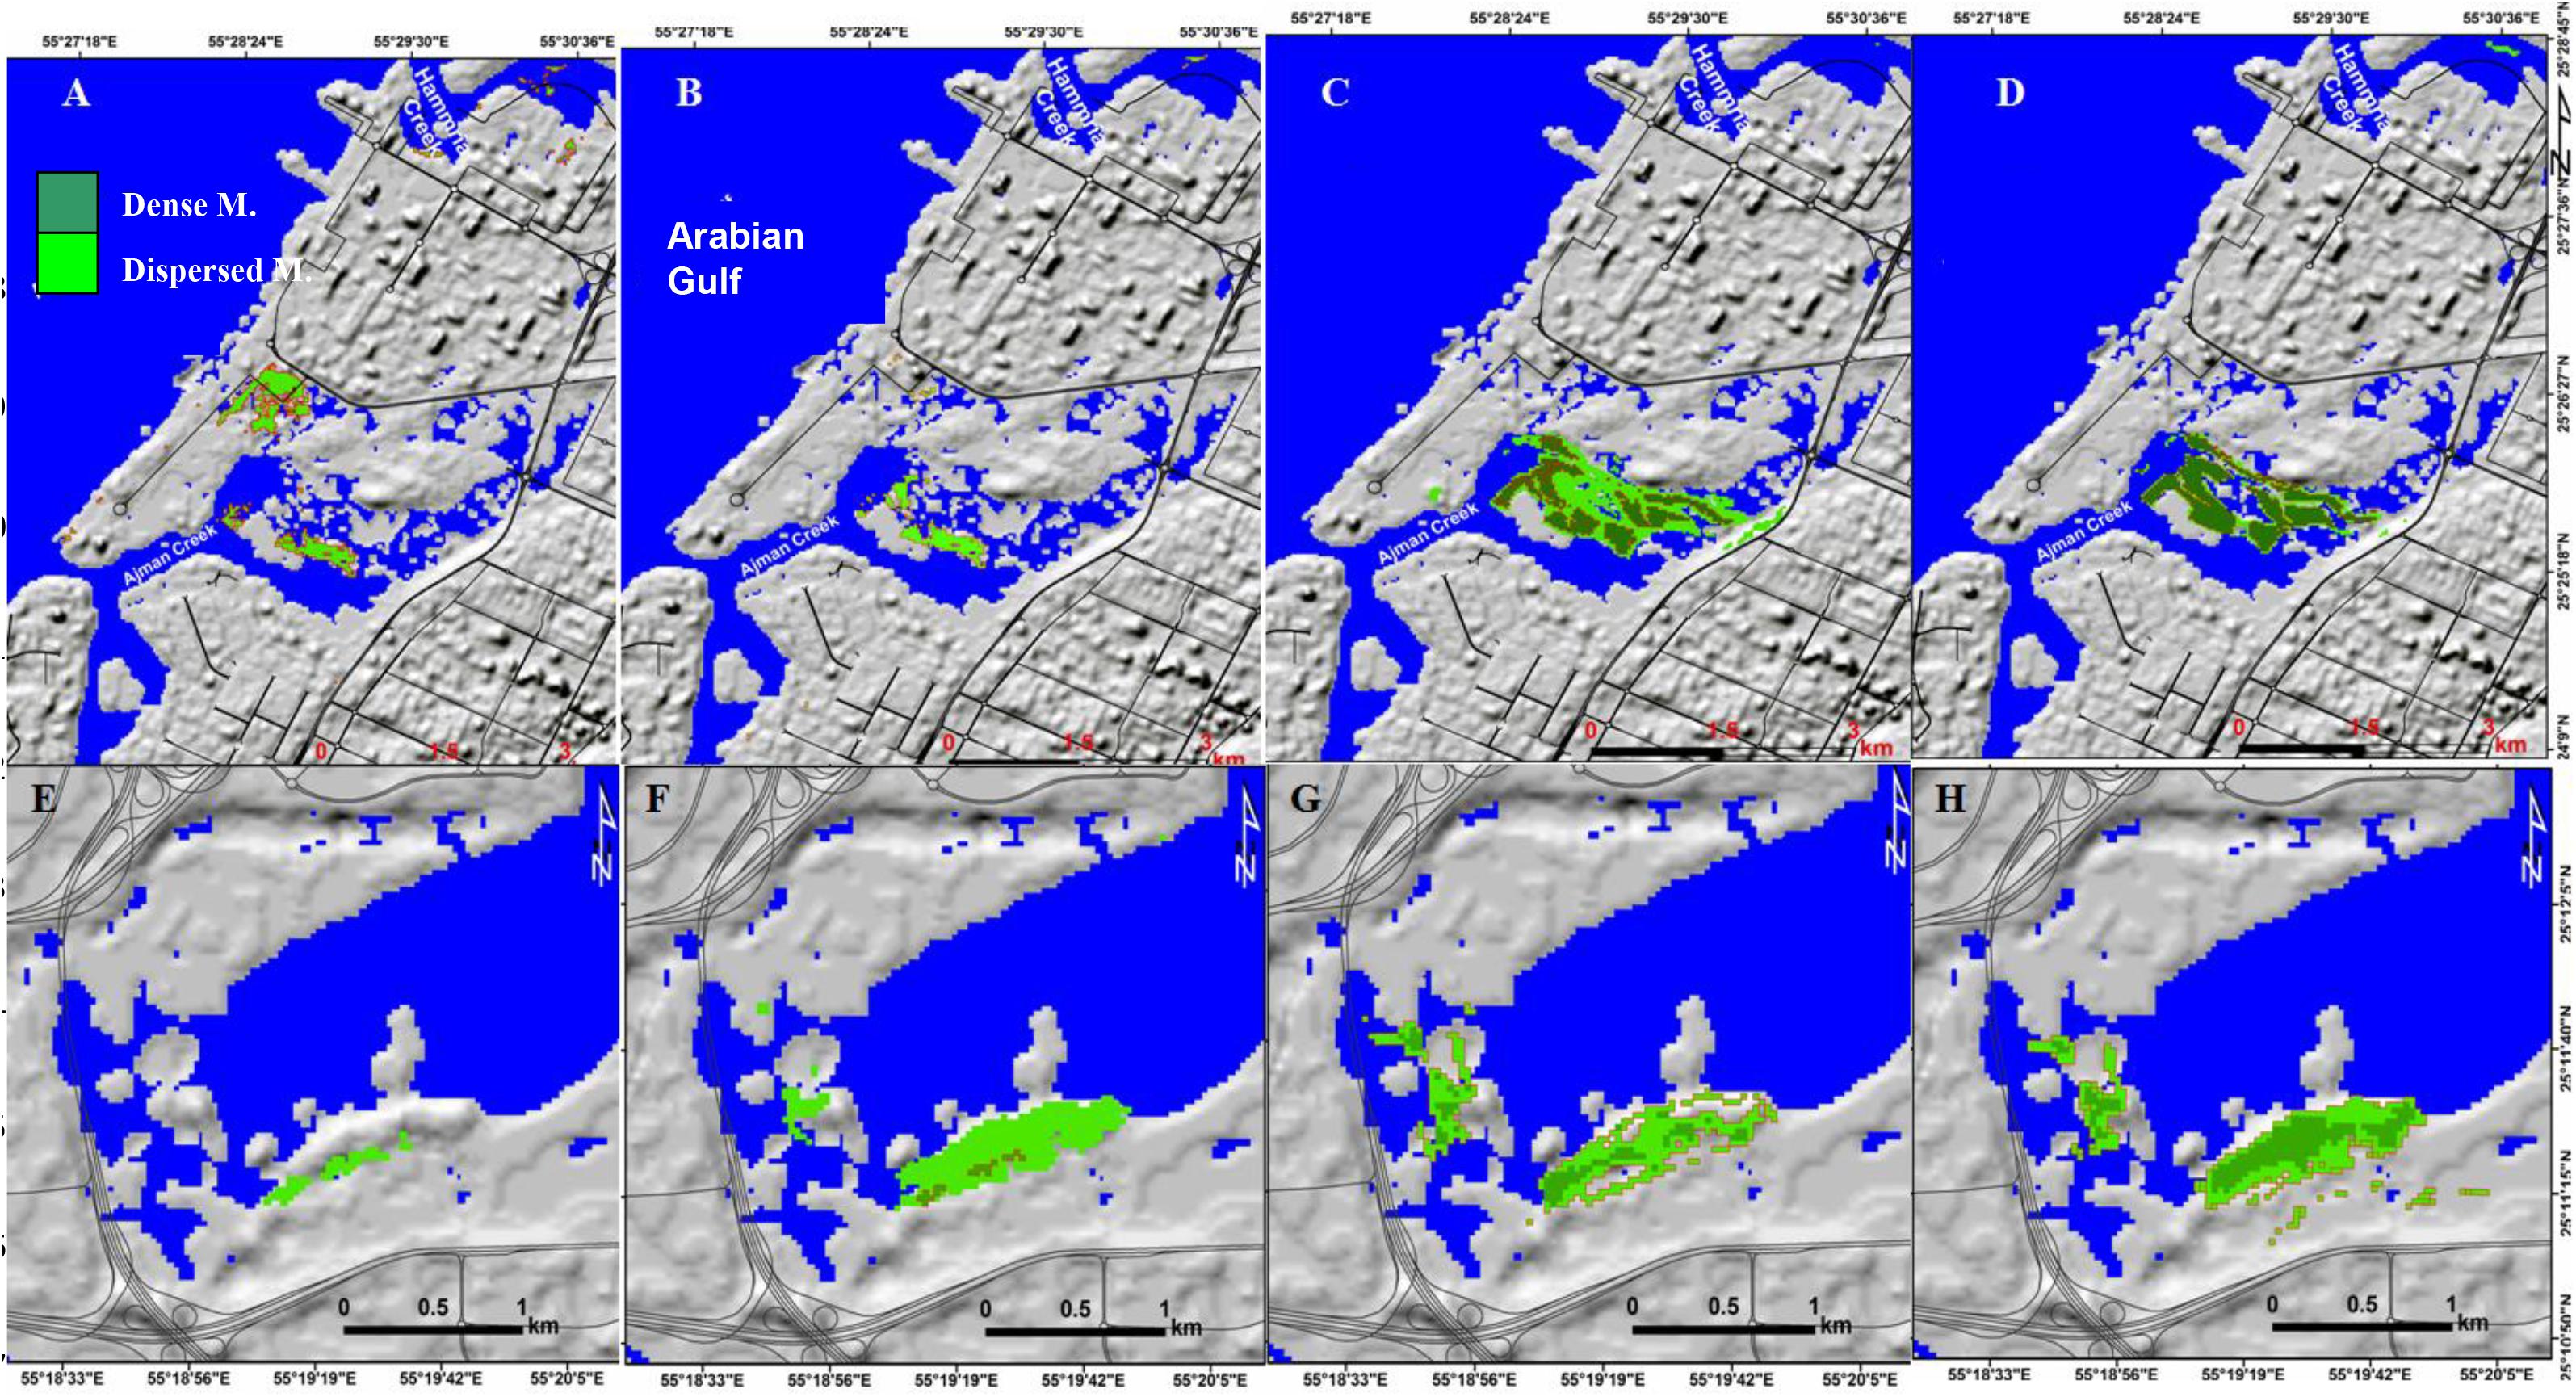
Figure 9. Spatiotemporal variations of mangrove forests for the years in Ajman-Hammriah (A–D), and Ras Al Khor (E–H) natural reserves for the years 1990, 2000, 2010, and 2019. Red polygons and dark green highlight dense mangroves.
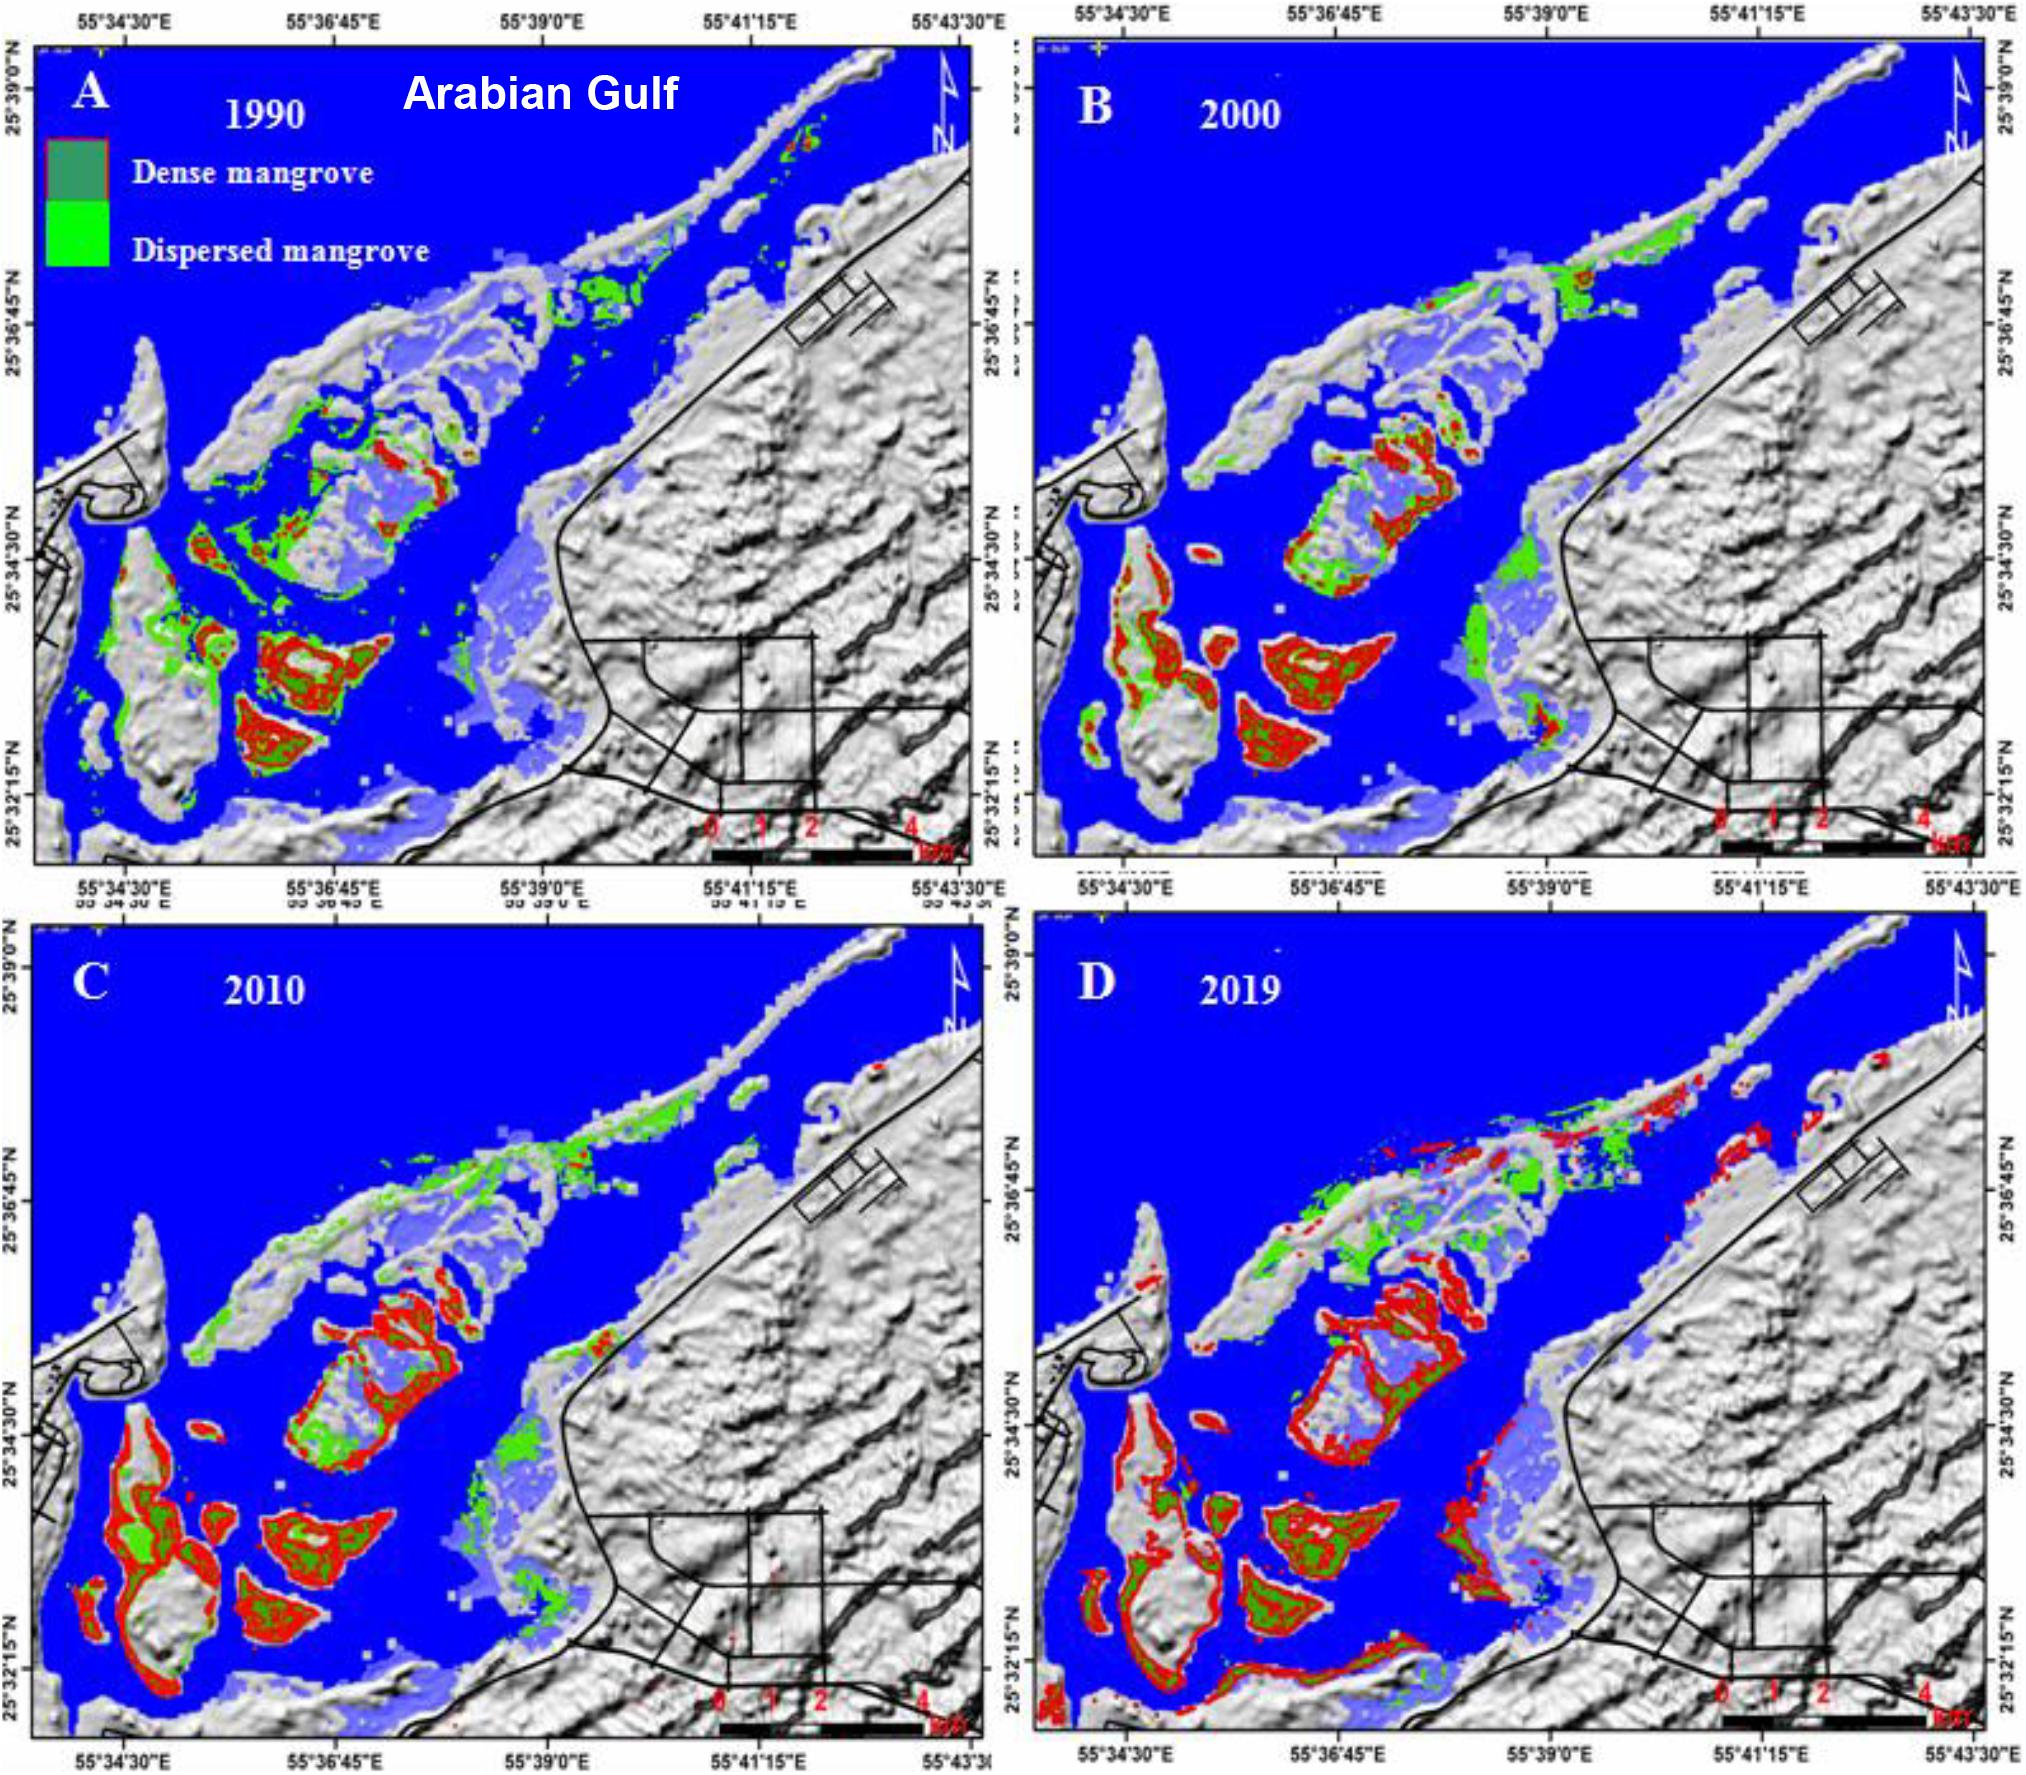
Figure 10. Spatiotemporal variations of mangrove forests in Umm Al Quwain natural reserve for the years 1990 (A), 2000 (B), 2010 (C), and 2019 (D). Red polygons highlight dense mangroves.
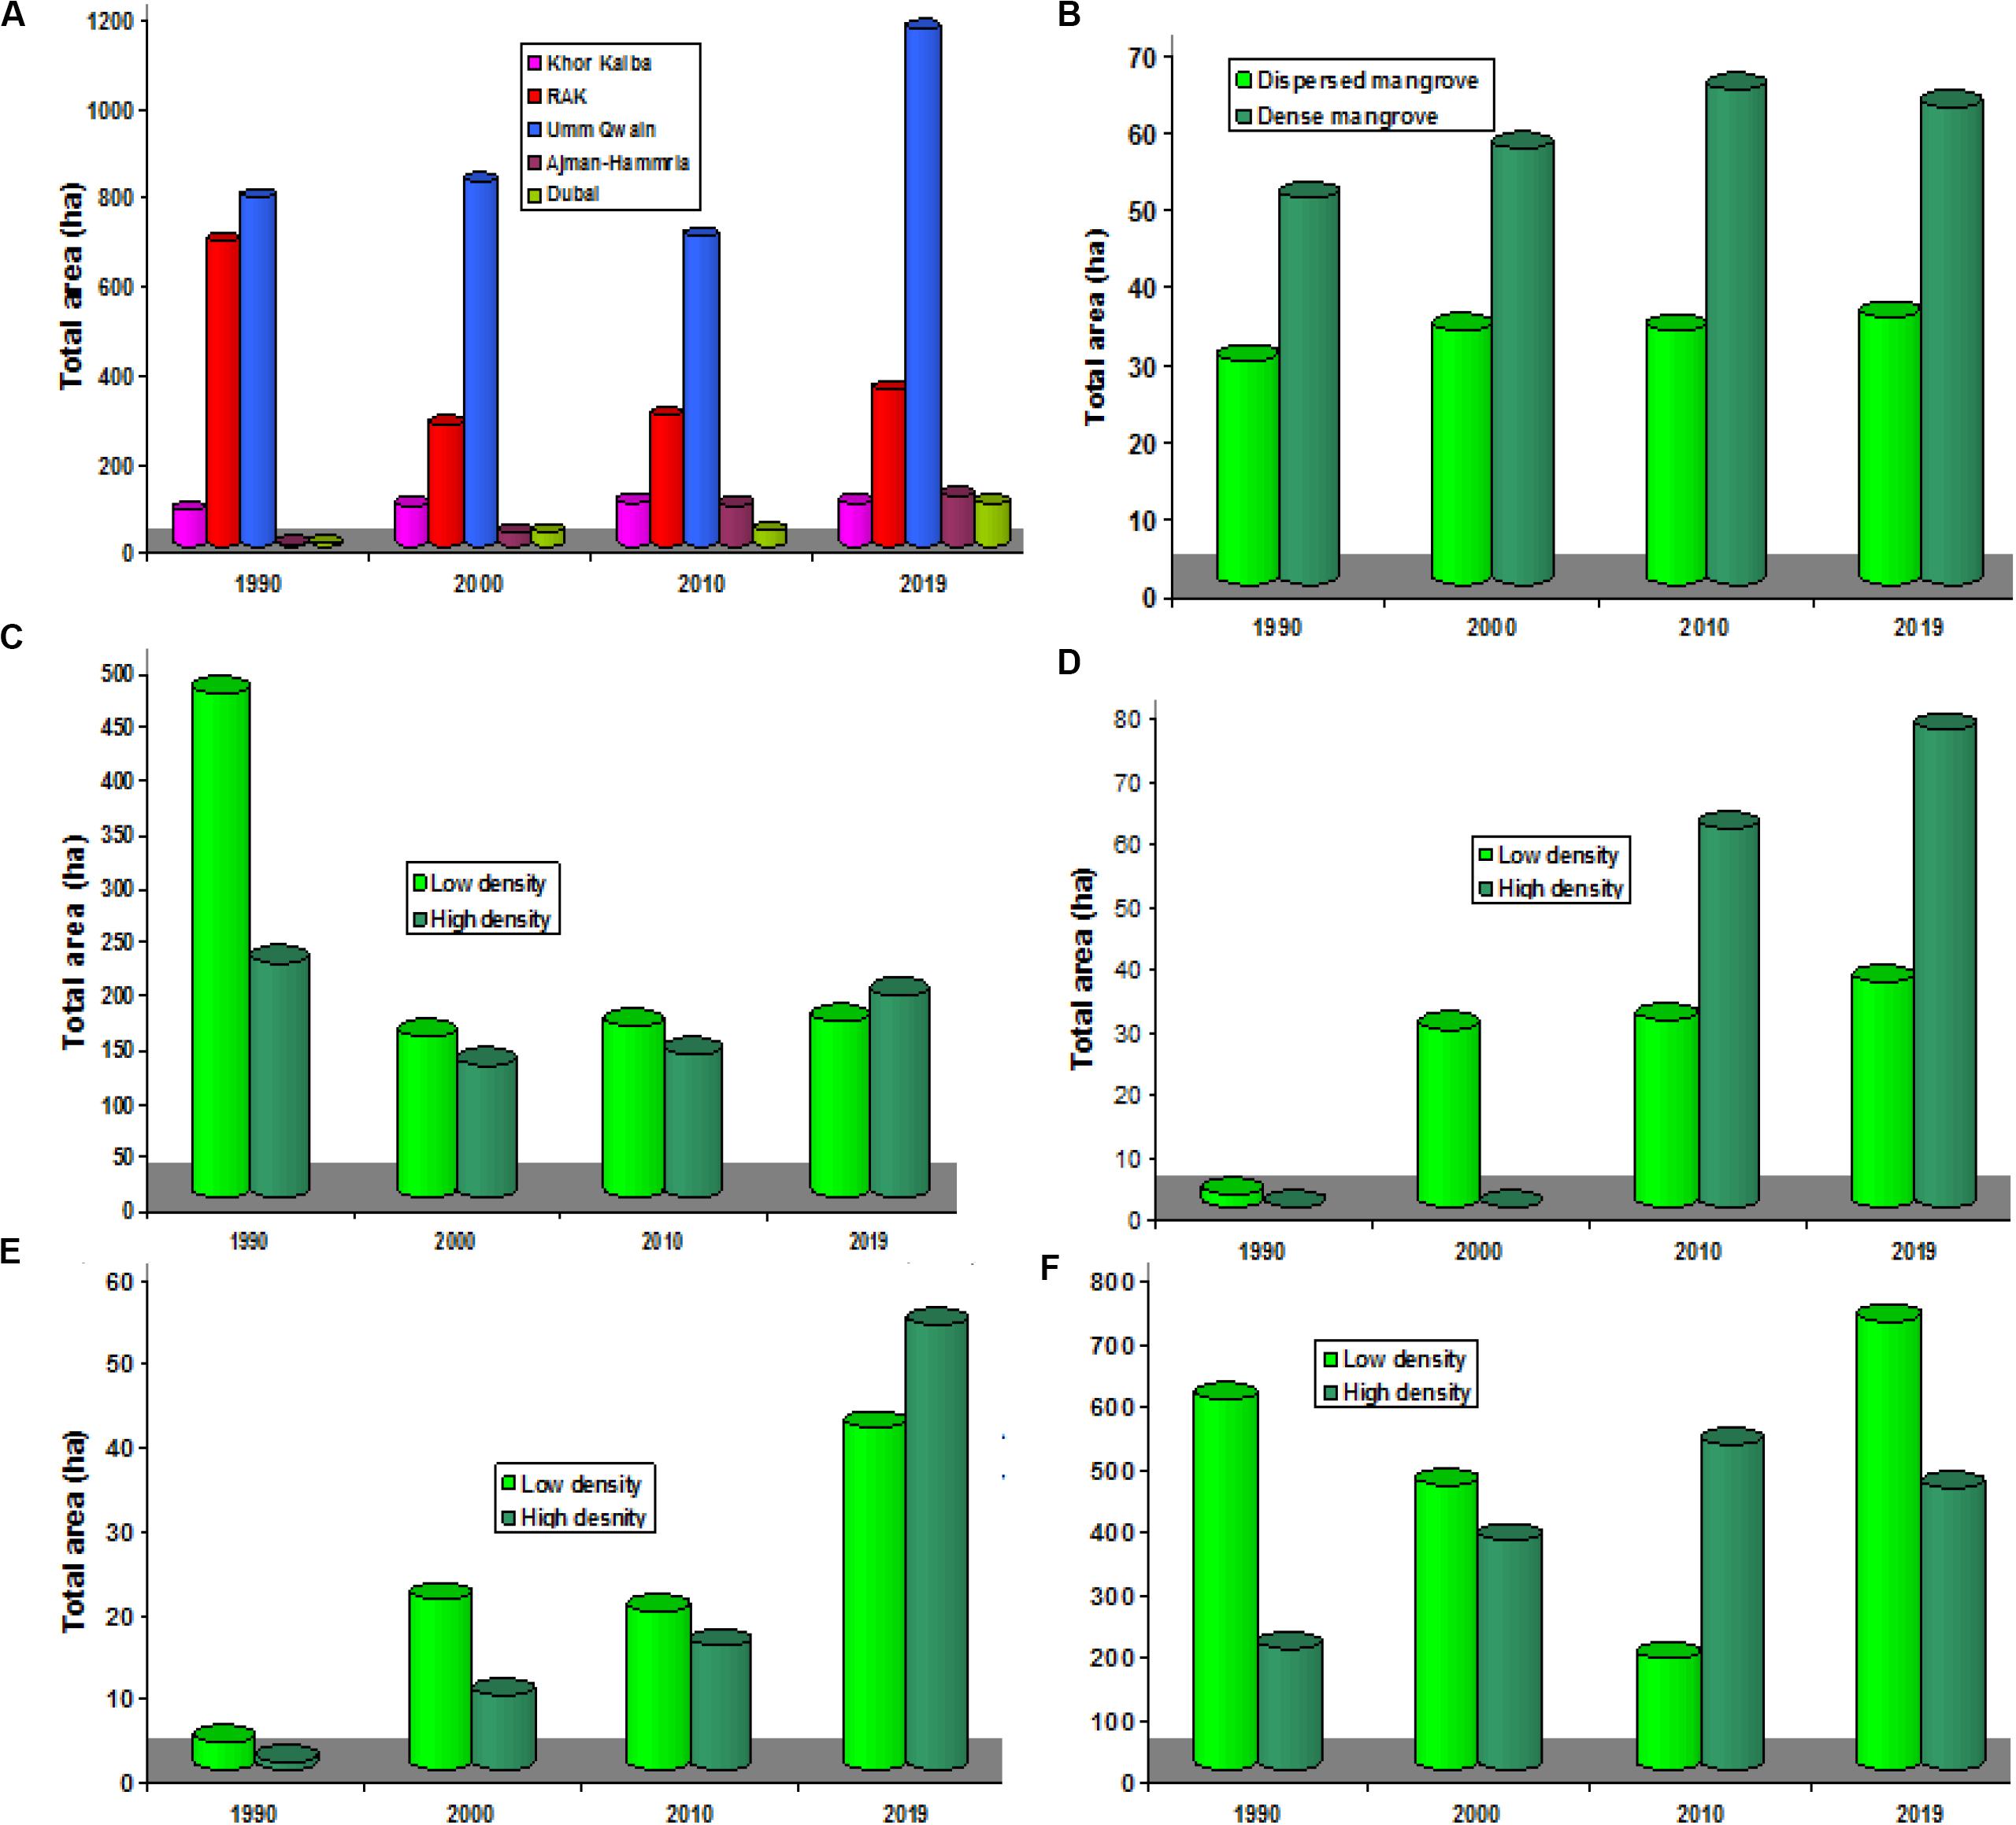
Figure 11. The annual rate of the NUAE mangroves growth (A), and mangrove types for Khor Kalba (B), RAK (C), Ajman-Hammriah (D), Ras Al Khor (E), and Umm Al Quwain (F).
In Khor Kalba (the Emirate of Sharjah), mangrove areas are spatially distributed as linear and curvilinear strips with a length of 5 km and a width of 300 m. Their common trends were found to be in the NNW-SSE and NNW-SSE directions (Figures 7, 11A). From 1990 to 2019, sparse mangroves have slightly increased from 28.89 ha (1.53%) in 1990 to 34.56 ha (2.037%) in 2019, while dense mangroves increased from 49.95 ha (2.7%) in 1990 to 61.74 ha (4.11%) in 2010 and 63.9 ha (4.80%) in 2019. Most of the mangrove areas are mainly distributed in creeks and estuaries (that now are natural reserves) along the coastal area of the Arabian Gulf.
The highest spatial distribution of mangroves was observed to be in the estuarine area of Umm Al Quwain, covering an area ranging from 700 to 1200 ha, while the lowest spatial distribution of mangrove was observed to be in Ras Al Khor of Dubai covering an area ranging from 4 to 9 ha, where the saline tidal flats distributed in an area is currently dominated by intensive urbanization. Moving to the west, in Ras Al Khaima, mangroves are mainly distributed in Mina Al Arab (south), Dafan Creek (middle) and Shaam estuarine areas (north) (Figures 8, 11C).
In Ajman and Hammria Creeks, dispersed mangroves occupied an area of 2.1 ha (0.0021%) in 1990, 28.42 ha (0.39%) in 2000 and 36 ha (0.41%) in 2019. Between 1990 and 2000, the mangroves were dispersed and occupied an area of 28.42 ha (0.39%) (Figures 9A–D, 11D). In 2010, both types of mangroves were clearly observed. Dense and dispersed mangroves occupied an area of 29.88 (0.41%) and 60.39 ha (0.83%), respectively. Like the Ajman-Hammria area, small patches of dispersed and dense mangroves were observed in the 1990 map. Moving to Dubai, mangrove forests were observed to be the smallest mangrove area (Figures 9E–H).
The total area of dispersed mangroves in these three locations was 468 ha (1.38%) in 1990, 149.22 ha (0.305%) in 2000 and 163.53 ha (0.33%) in 2019 (Figure 11D). Similarly, dense mangrove occupied an area of 217.71 ha (0.44%) in 1990 to 187.65 ha (0.832%). These small patches of mangroves were observed in the western edges of Ras Al Khor and occupied an area of about 18.99 ha in 2010 and 40.95 ha in 2019, respectively. Dense mangroves were observed to be clustered in the southern edge of the Ras Al Khor and easily definable in remote sensing data than the dispersed mangrove distributed in the western edge of the Ras Al Khor. Since 1990, dense and dispersed mangroves have gradually increased from 4.3 ha in 1990 to 94.23 ha in 2019 (Figure 11E) and spatially distributed in the Ras Al Khor area. The dispersed mangroves were observed to be distributed in the western part of the Ras Al Khor, while dense mangroves were observed to be distributed in the southwestern edge of Ras Al Khor (Figures 9, 11E). They occupied an area of about 3.22 ha (0.51%) and 0.97 ha (0.071%), respectively.
In Umm Al Quwain estuarine, dispersed mangrove occupied an area of 590.22 ha (2.29%) in 1990, 453.24 ha (1.764%) in 2000 and 715.32 (2.784%) in 2019 (Figures 10, 11F). Similarly, the dense mangrove occupied an area of 194.13 ha (0. 75%) increased to 366.57 ha (0.42%) in 2000 and 518.58 ha (2%), then slightly declined to 449.55 (1.74%) in 2019. In 2019, dispersed and dense mangroves increased, occupying an area of 36 ha (0.46%) and 76.14 ha (0.91%), respectively.
The results of monitoring mangrove changes in four periods: 1990–2000, 2000–2010, 2010–2019, and 1990–2019 with a time-span of 10 years are shown in Figures 12–16 and their statistics are shown in Figure 17. In Khor Kalba (Figure 12), the total area of mangroves increased by about 10.35 ha from 1990 to 2000 and 7.47 ha (0.26%) between 2000 and 2010, and then decreased slightly by about 0.36 ha between 2010 and 2019. It can be noticed that although the Khor Kalba mangroves expansion is small. The rate of growth of the Khor Kalba mangrove remains relatively stable during the last 29 years (Figures 12, 17).
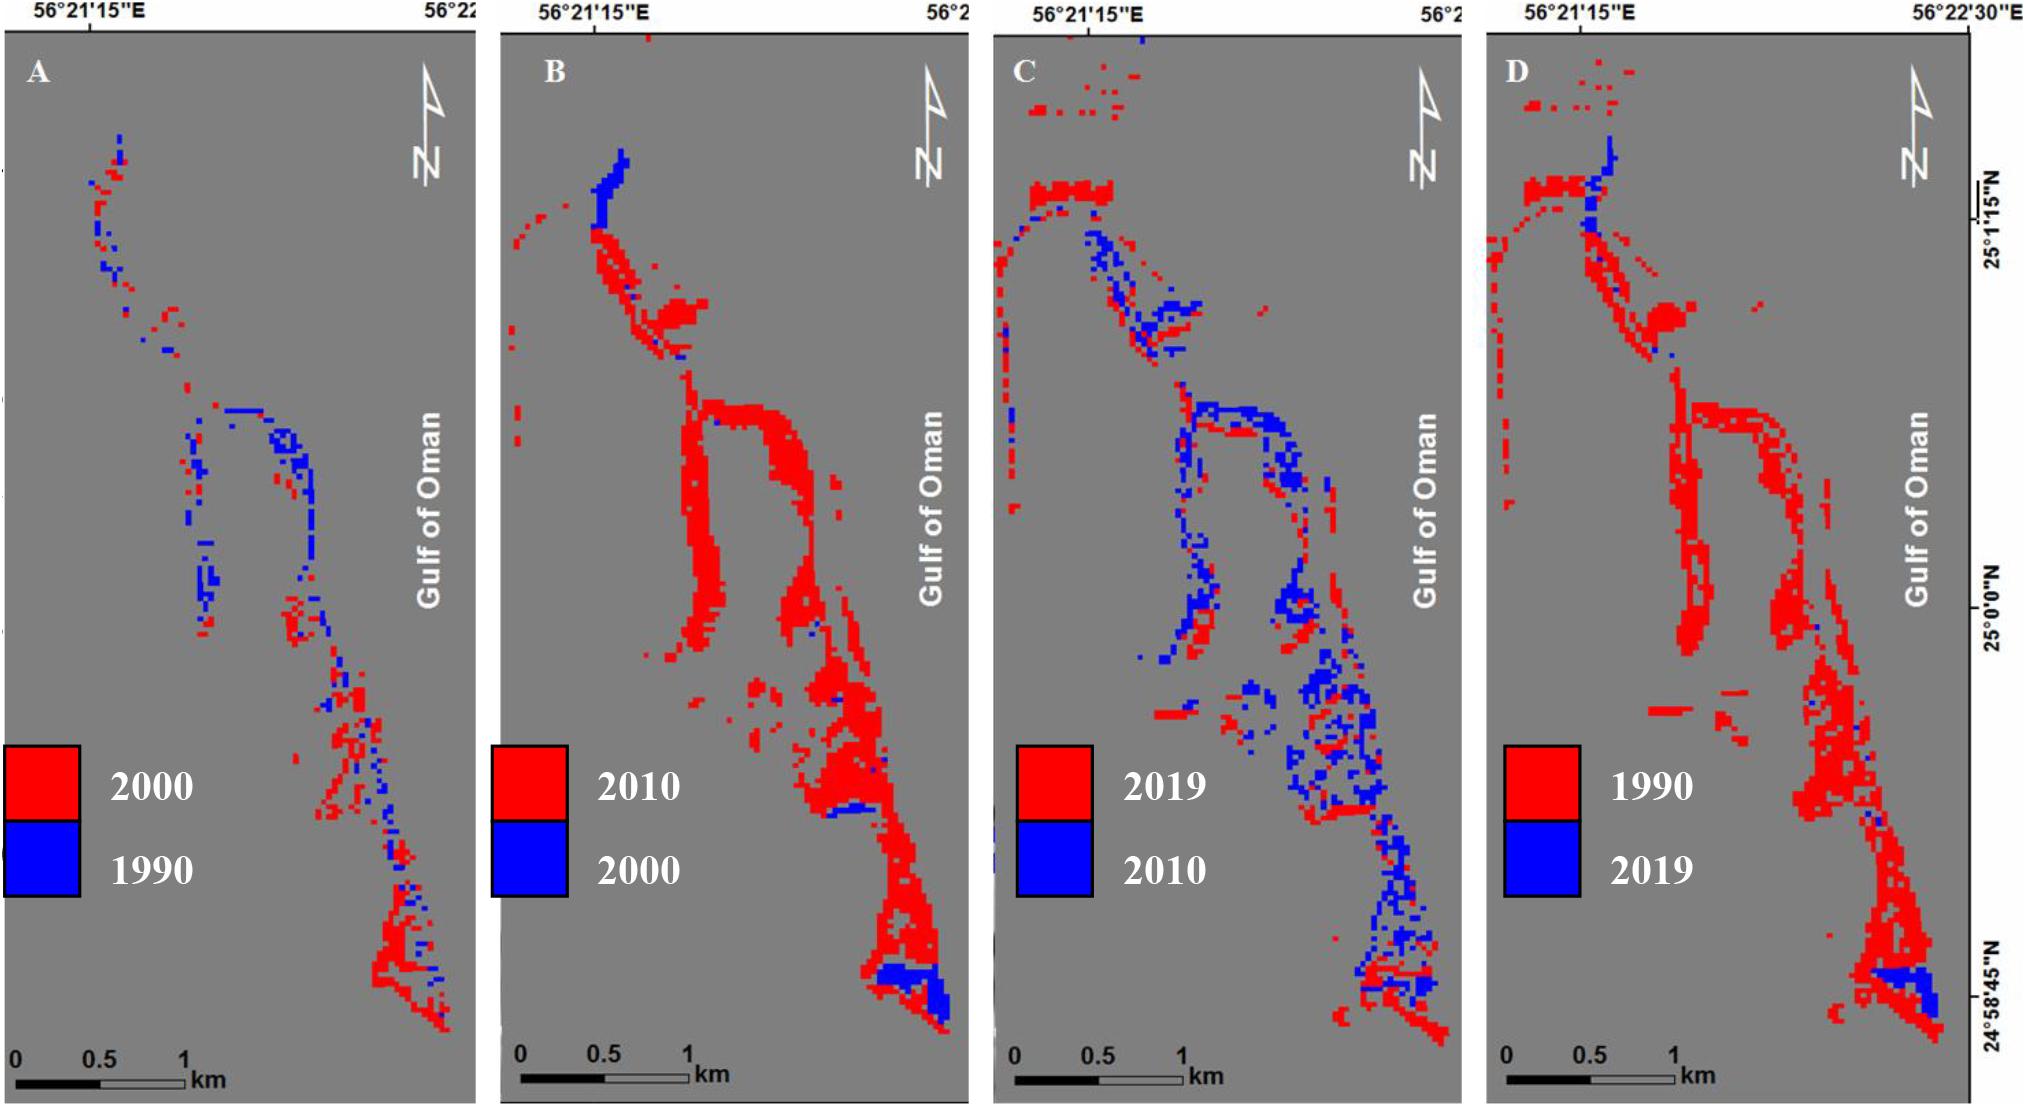
Figure 12. Mangrove pattern change between 1990 and 2000 (A), 2000 (B), 2010–2019 (C), and 1990–2019 (D) for Khor Kalba natural reserve. Red color highlights changes in mangroves.
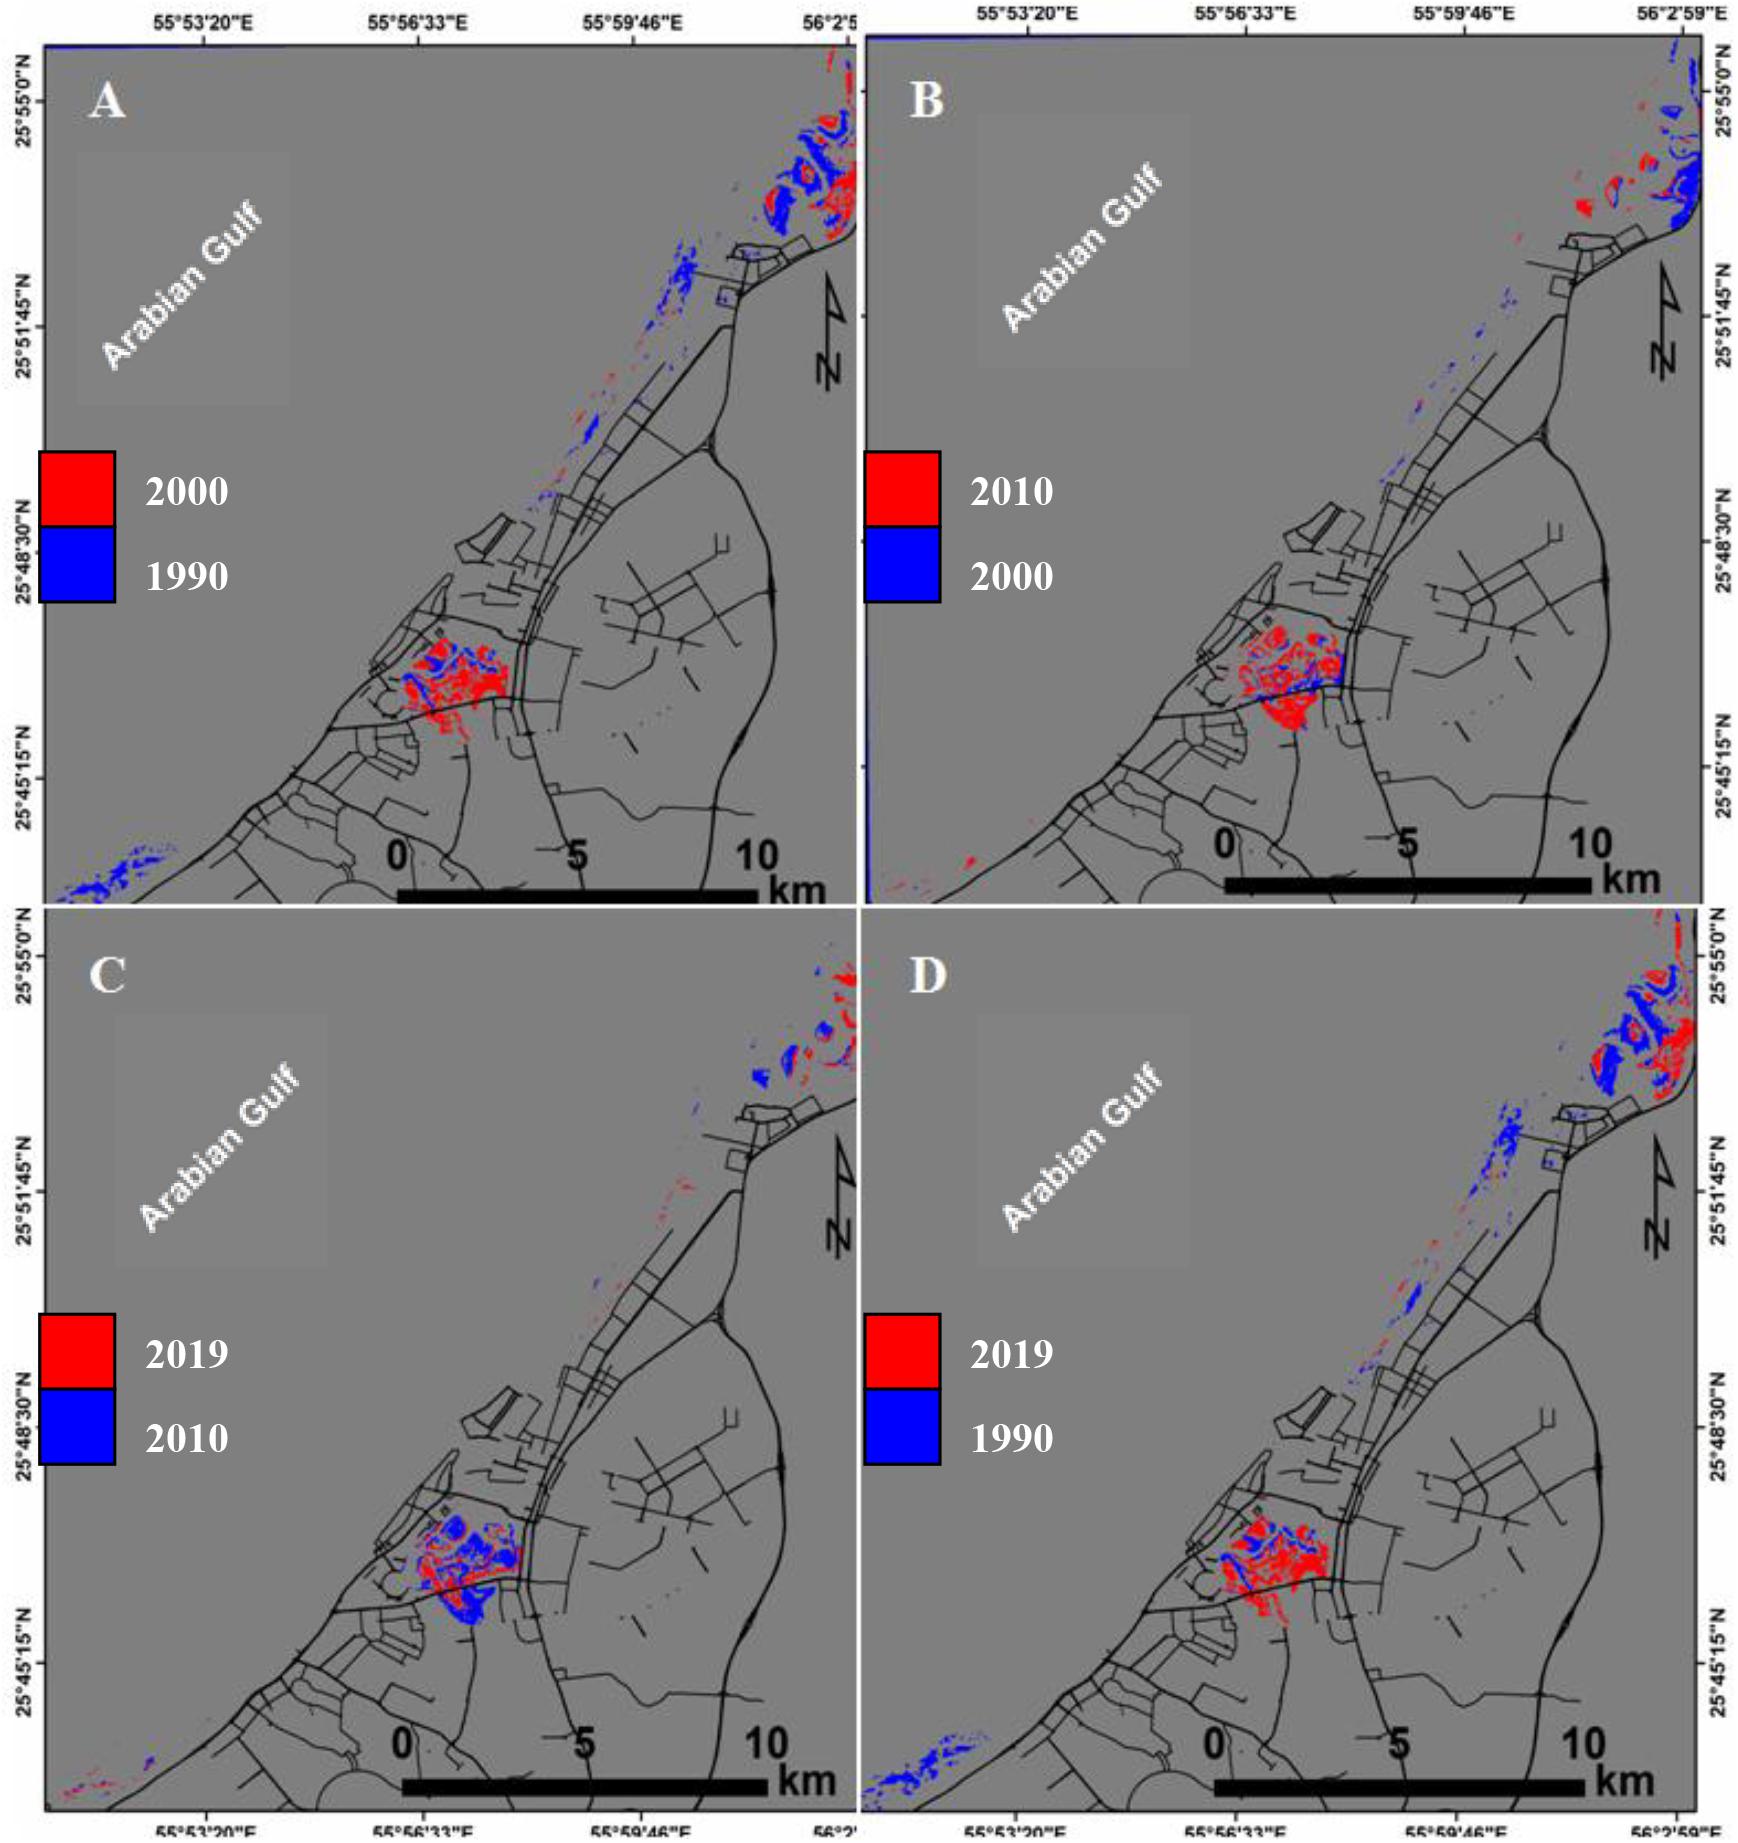
Figure 13. Mangrove pattern changes between 1990 and 2000 (A), 2000–2010 (B), 2010–2019 (C), and 1990–2019 (D) for the RAK natural reserves.
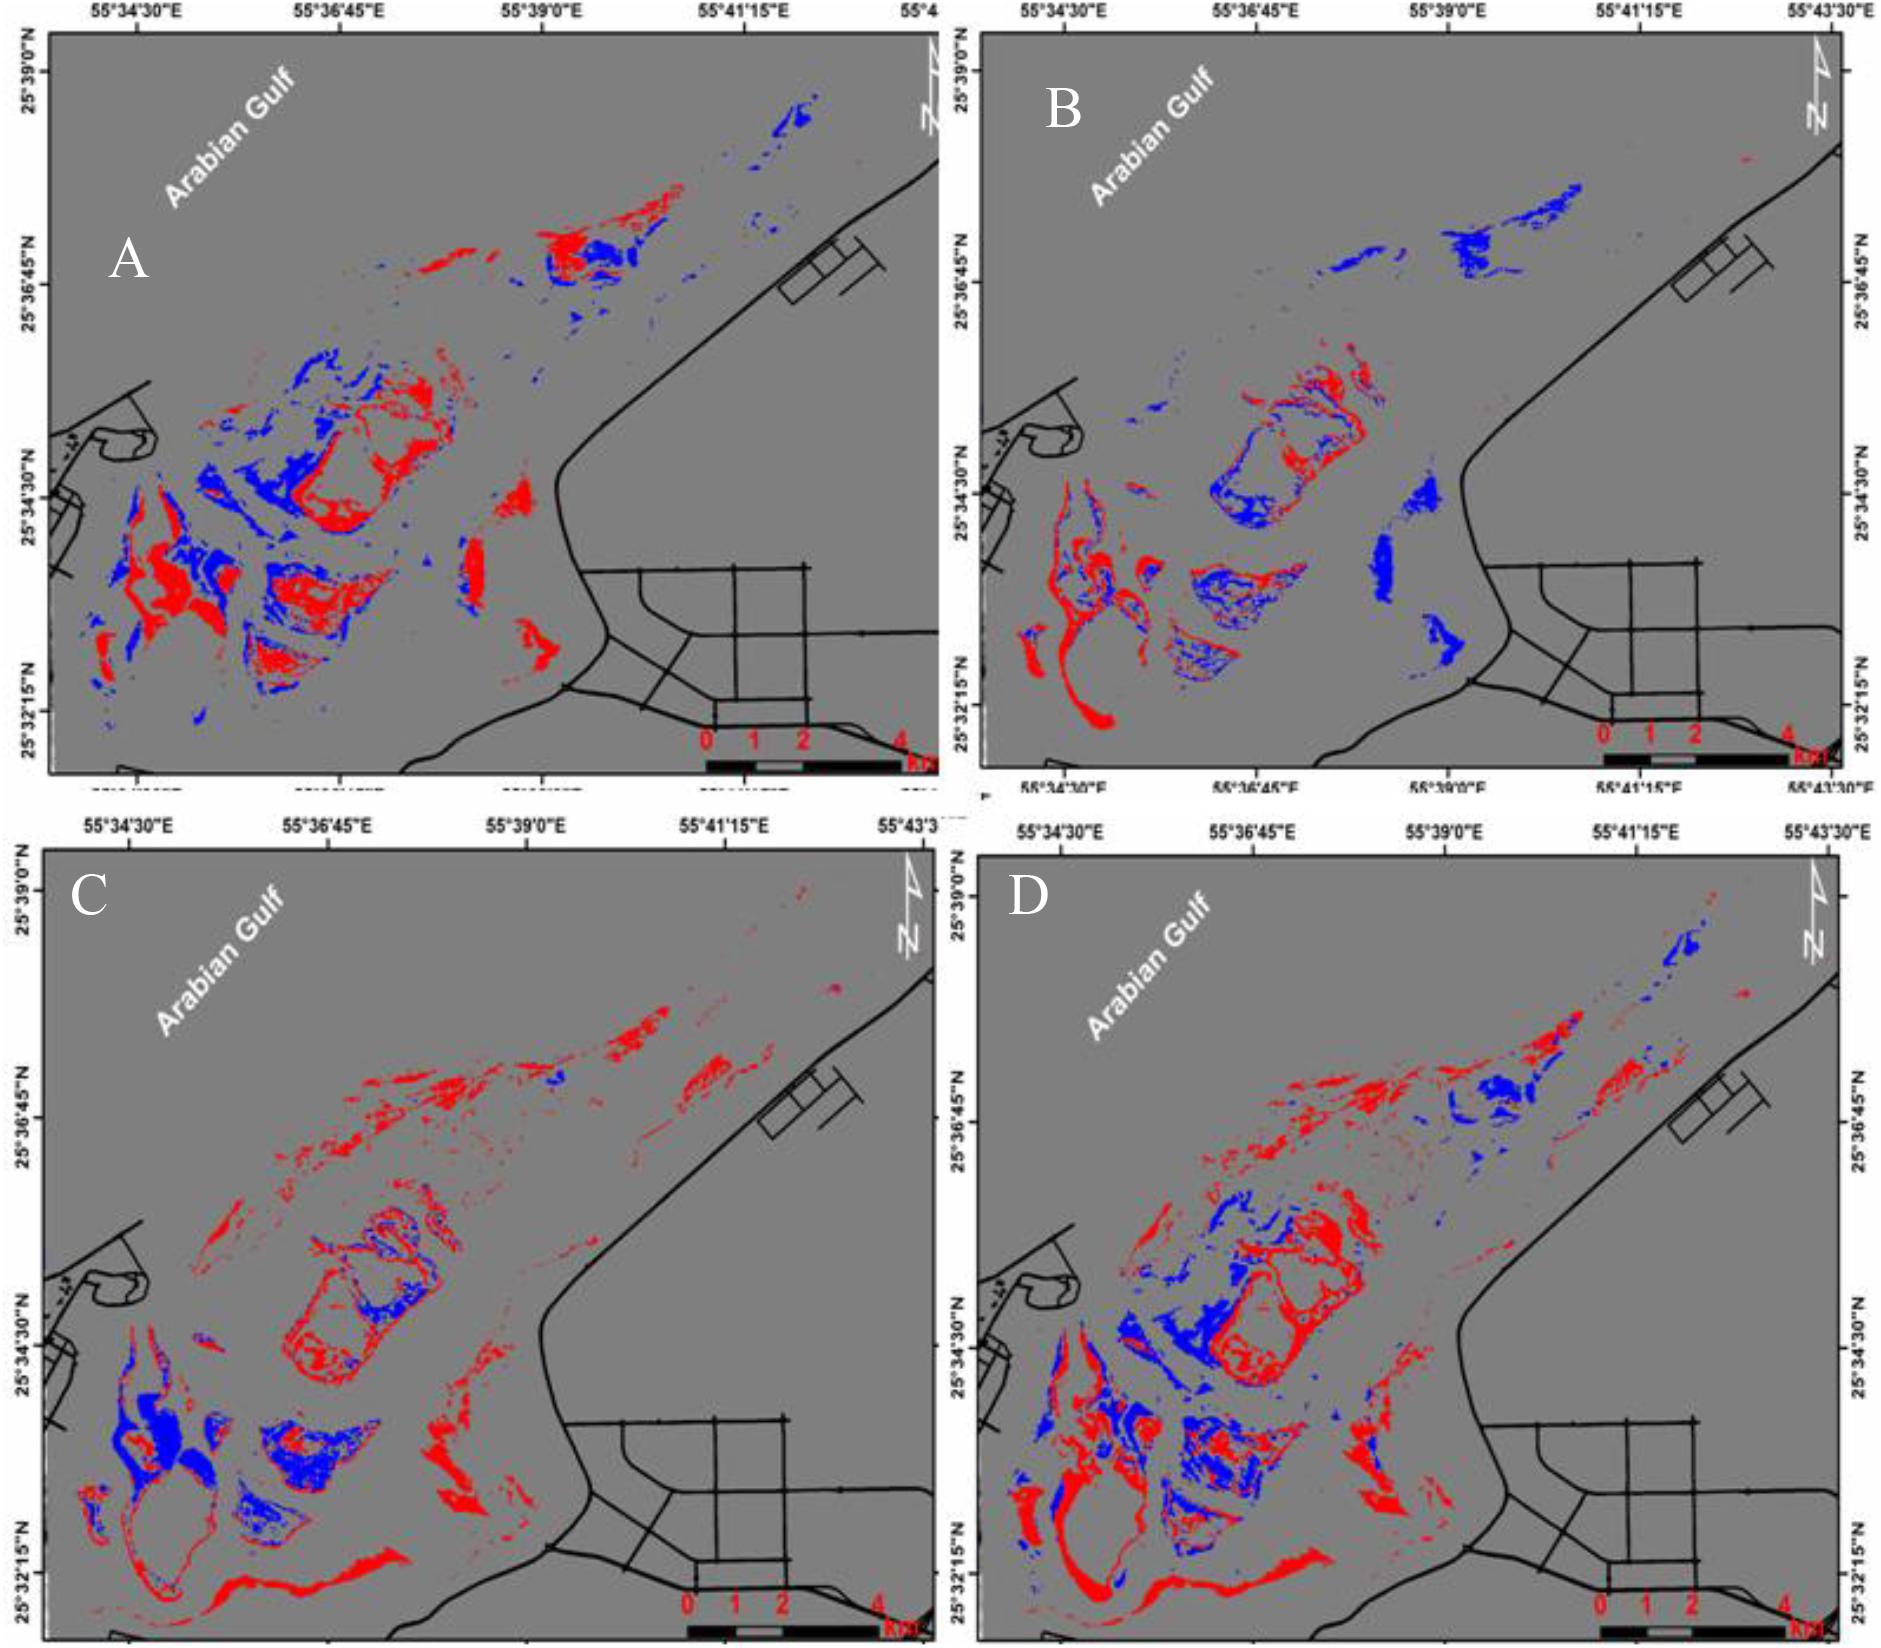
Figure 14. Mangrove pattern changes between 1990 and 2000 (A), 2000–2010 (B), 2010–2019 (C), and 1990–2019 (D) for Umm Al Quwain.
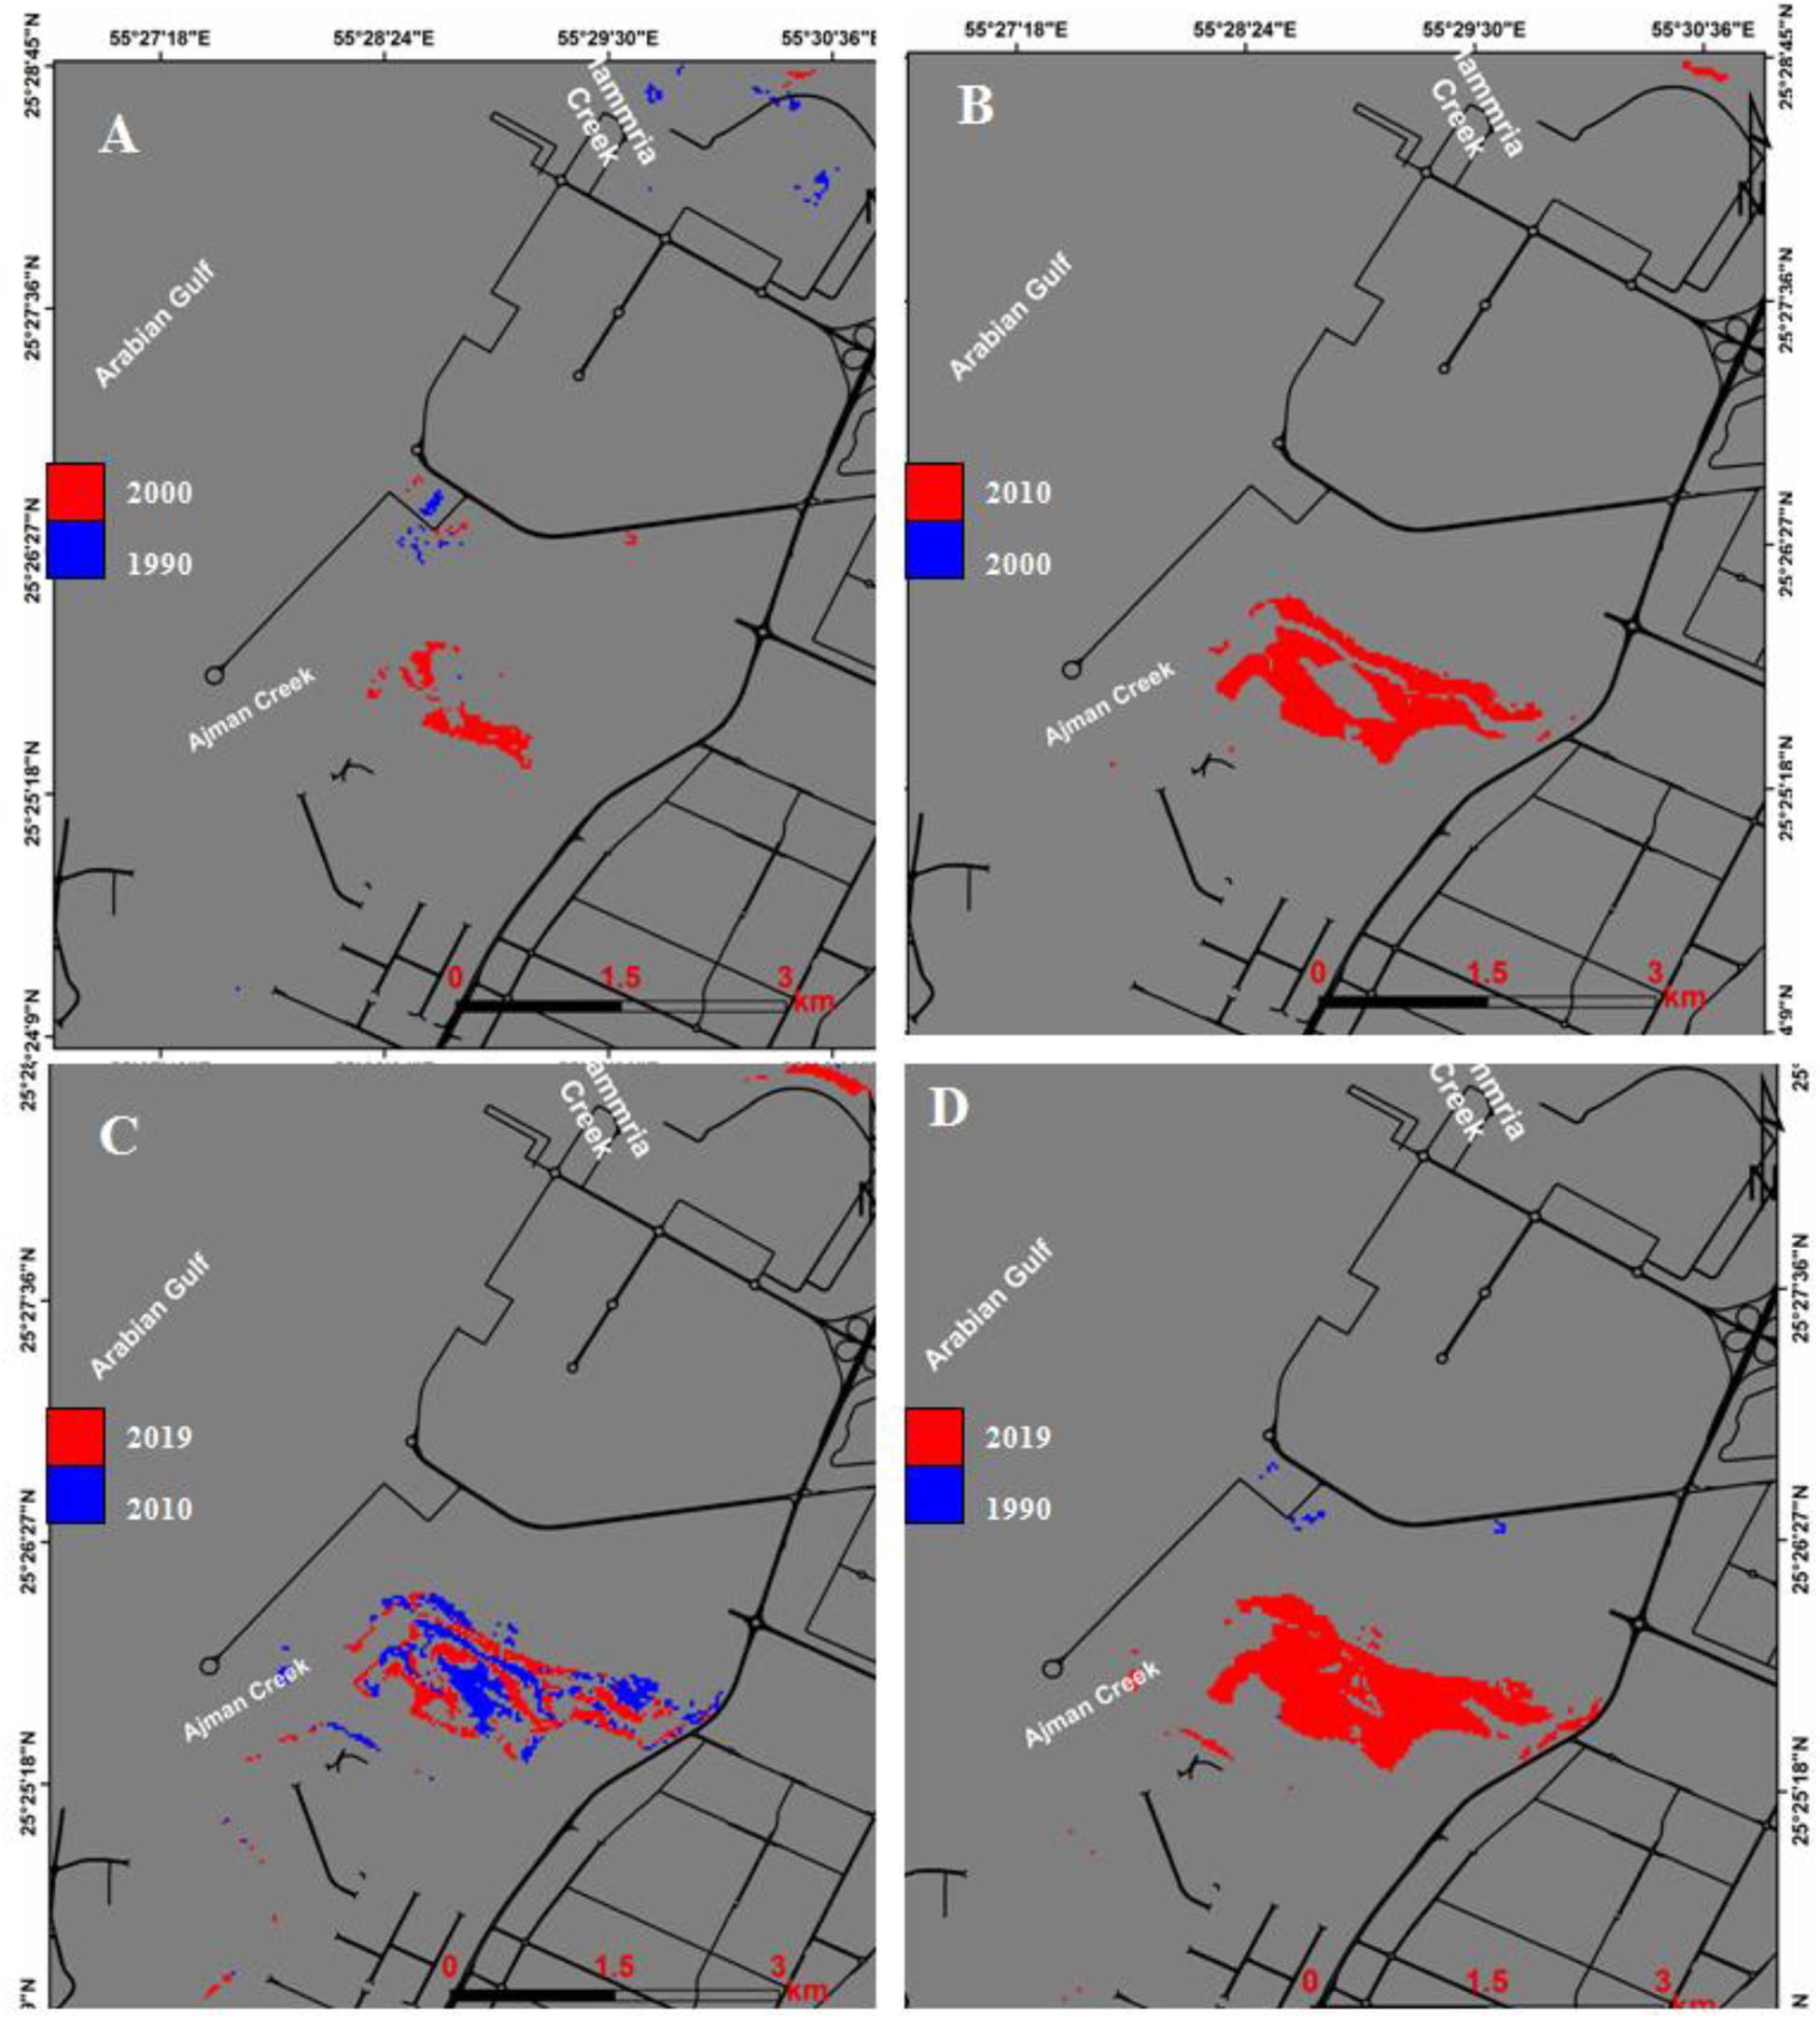
Figure 15. Mangrove pattern changes between 1990 and 2000 (A), 2000–2010 (B), 2010–2019 (C), and 1990–2019 (D) for Ajman-Hammriah.
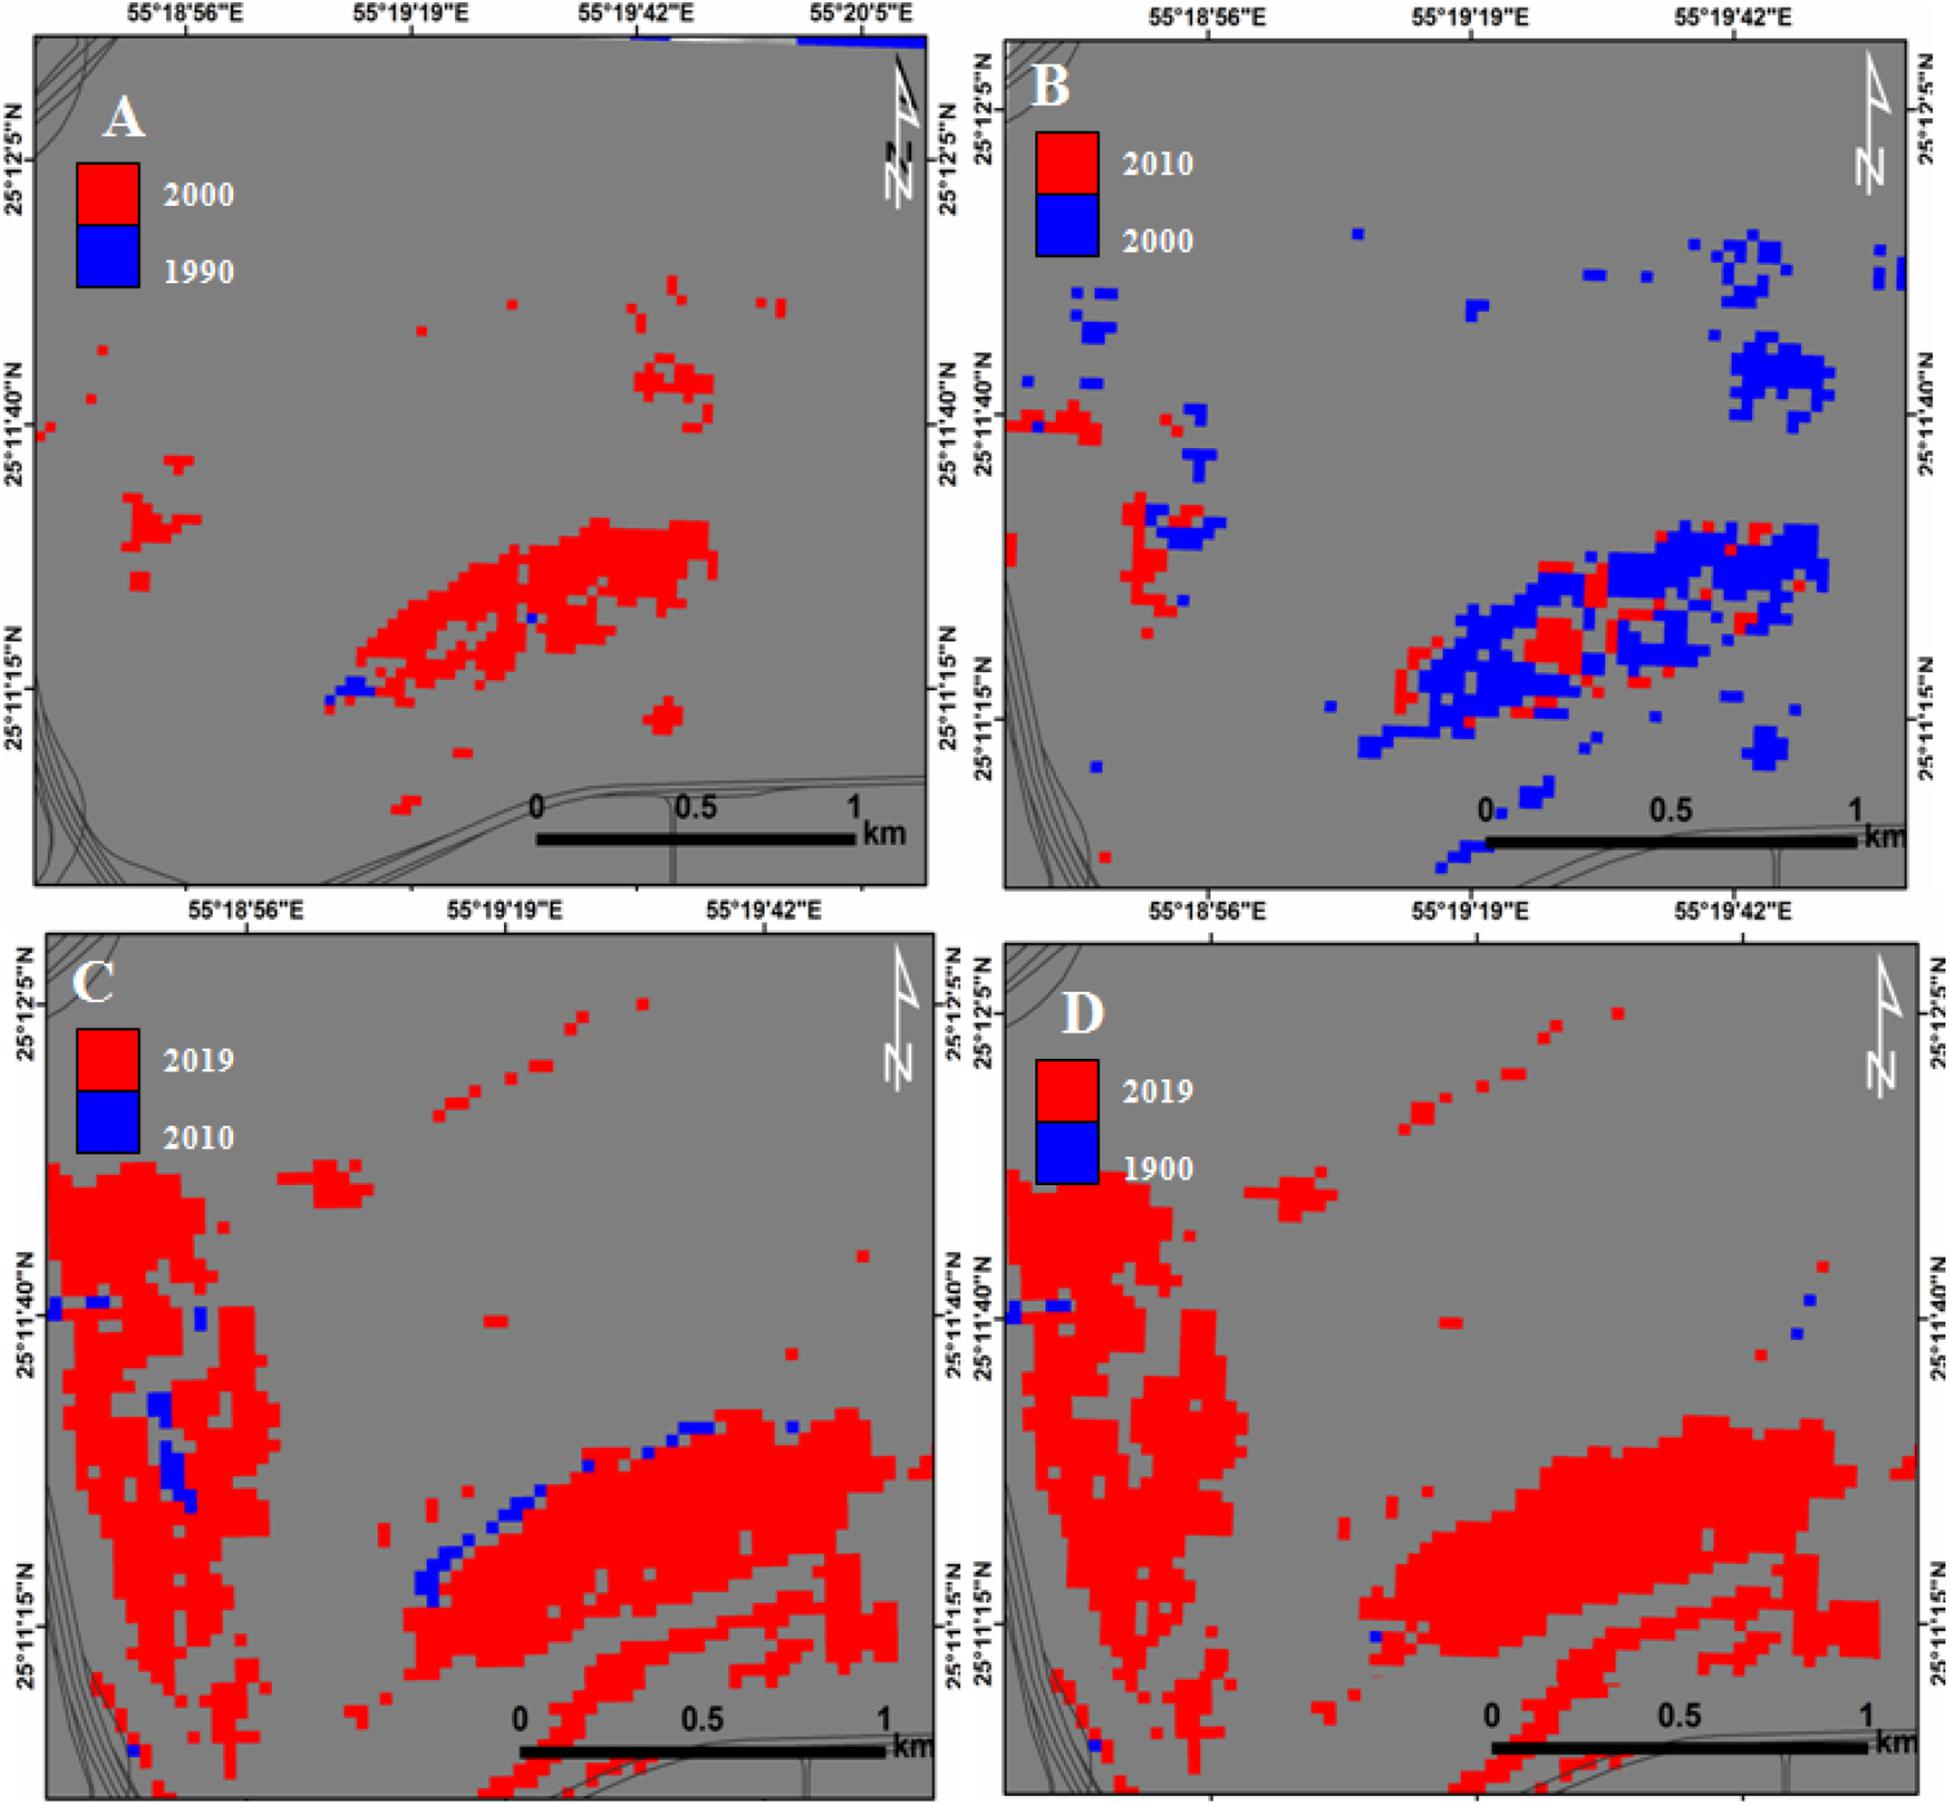
Figure 16. Mangrove pattern changes between 1990 and 2000 (A), 2000–2010 (B), 2010–2019 (C), and 1990–2019 (D) Ras Al Khor, Dubai.
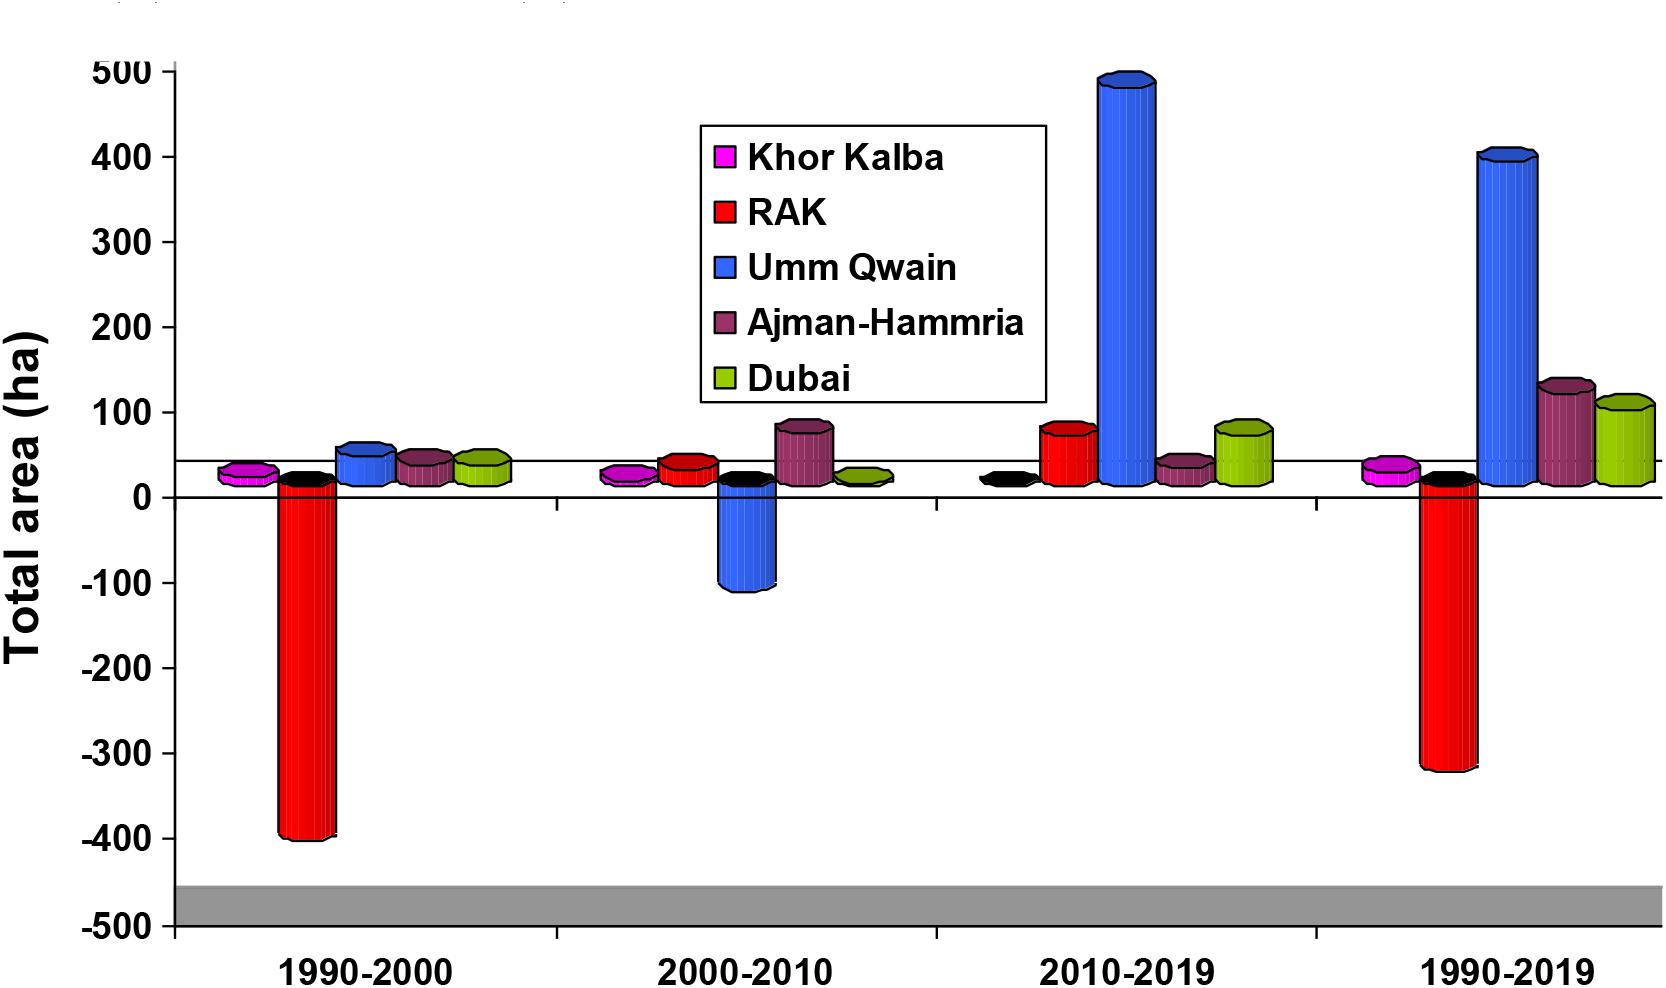
Figure 17. The graphical representation of the NUAE mangrove forests extent from 1990 to 2019 (in hectare). The graph shows a significant decrease in RAK Mangroves from 1990 to 2000 (in hectare) and a slight decrease in Umm Al Quwain Mangroves from 2000 to 2010.
In RAK areas, there is a negative change (mangrove loss) of -414.27 and -334.53 ha during the periods from 1990 to 2000 and from 1990 to 2019, respectively (Figures 13A–D). From 2000 to 2010, the mangrove increased slightly by 20.79 ha and more than double (58.95 ha) during the period from 2010 to 2019.
In Umm Al Quwain estuarine, similar changes (mangrove loss) were observed during the period from 2000 to 2010 (Figures 14E–H). The estimated lost area was about -122.76 ha. Conversely, the mangrove forests increased sharply by approximately 467.82 ha from 2010 to 2019. Between 1990 and 2019, the mangrove forests increased by about 380.52 ha (Figure 17).
Further south, the mangrove area in Ajman and Hammria creeks increased by about 26.32 ha from 1990 to 2000, then increased sharply by about 61.85 ha between 2000 and 2010 (Figures 15A–D). From 2010 to 2019, the mangroves increased slightly by about 28.87 ha. Since 1990, the total area of the mangroves increased by about 110.04 ha (1.88%).
In Ras Al Khor of Dubai, the lowest positive changes were observed to be during the periods from 1990 to 2000 (25.18 ha) and from 2000 to 2010 (4.36 ha), respectively. The largest changes were observed from 2010 to 2019 of about 60.39 ha (Figures 16, 17). Since 1990, an increase (positive change) in the mangrove area was reported. The estimated area of mangrove was 89.93 ha which represents the third after Umm Al Quwain and Ajman and Hammria Creeks. Generally, the mangrove areas showed an increase in all locations except the RAK and Umm Al Quwain areas. Comparing between the two mangrove ecosystems there appears to be stability in the mangrove area faced to the Gulf of Oman than those facing the Arabian Gulf.
The use and comparison of the performance of RF, KLR, NB, and ID algorithms permitted precisely mapping, classifying, and monitoring mangrove changes over 29 years in different ecological systems. Among the machine learning, RF yielded high precision, high recall and F1 score. This means that the RF has a powerful ability to map the mangrove forests in different ecosystems. These results also indicated that the RF and KLR are able to detect patches of dense mangrove that represent the majority of mangrove forests. On the other hand, NB yielded the lowest value for the F1 score (<0.8), and thus, lower ability to detect mangrove forests (Figure 6).
Random forest iterations predicted a slightly wider range of mangrove forest extent compared to those by KLR with F1 scores of 0.93 and 0.90, respectively. These findings were in good agreement with several studies that have indicated that RF algorithm has higher accuracy compared to CART (Mondal et al., 2019), support vector machine (SVM; Chen et al., 2020), and maximum likelihood (Ha et al., 2020) who compared machine learning methods against traditional classifiers and assist potentiality of groundwater.
These findings are also in accordance with Toosi et al. (2019) who compared different classifiers for monitoring mangrove changes and concluded that the RF which uses freely available Landsat images, had performed best. Feng et al. (2018) implemented a novel change detection approach based on visual saliency and RF from multi-temporal high-resolution remote-sensing images. However, the opposite occurred for mapping mangrove using traditional classifiers.
The use of freely available Landsat images offered the ability to detect mangroves with overall accuracy comparable to the machine learning classifiers that involved the commercially remote sensing data such as LiDAR and WorldView-3 (Elmahdy and Mohamed, 2018; Toosi et al., 2019). Although the LiDAR, WorldView, and RapidEye images have high spatial resolution, the overall accuracy of RF only reached 82% (Ha et al., 2020). Other studies confirmed that the rotation forest (RoF) algorithm had a higher accuracy than the canonical correlation forest (CCF) in LULC classification, which has less sensitivity compared to the RF algorithm (Colkesen and Kavzoglu, 2017; Ha et al., 2020).
The proposed approach represents a significant modification in mangroves and LULC, as well as an enhancement of the performance of linear and non-linear classifiers. The machine learning algorithms, especially, when optimized, have their robust and a higher efficiency and quality of classification (Coppin and Bauer, 1996; Banfield et al., 2006; Wang et al., 2015; Gong et al., 2019).
The wide availability and ease of implementation of machine learning and free availability of Landsat images permitted an exceptional simplicity in processing vast amounts of remote sensing data promptly and at low costs (Elmahdy et al., 2019; Mondal et al., 2019).
The use of machine learning algorithms and Landsat images provides up-to-date mangrove maps over multiple scales and able to discriminate between mangrove and non-mangrove areas and dense mangrove and dispersed mangrove patches than currently available. Between 1990 and 2019, the largest increase in mangrove forest extent occurred in the Umm Al Quwain Estuarine (1200 ha), while the largest decrease occurred in Dubai Natural Reserve (9 ha). Locally, these results are consistent with Su et al. (2009), Martins et al. (2016), Elmahdy and Mohamed (2018), and Gong et al. (2019) who optimized SVM, SAM, and RF classifiers and much more precisely than those mapped by Moore et al. (2013) using manual screen digitizing and field observations. This result is not consistent with our results, which indicated the mangrove of Khor Kalba was over 800 ha. The maps produced by Moore et al. (2013) had a lot of errors and bias and cannot be used as a reference. However, our results permitted better understanding of the NUAE mangrove’s extent and can be updated in any future study, as well as building a new framework of the change detection. The proposed approach provides a better accuracy by reducing the level of noise associated with remote sensing data and helping in discriminating between mangrove and non-mangrove areas.
During change detection, we observed that the ID algorithm using pair of bi-temporal mangrove classification of images with a threshed value between -1 and +1, is better than other algorithms such as an image to map and map to map (Elmahdy and Mohamed, 2018; Ma et al., 2019). The ID minimizes the errors created in one or two of the classification maps detecting greater presence pixels (+) and absence pixels (-) than those detected by image to map and map to map approaches. These approaches suffer from error propagation and differences in image calibration between Landsat sensors.
The rapid changes in mangrove forests during the period from 2010 to 2019 are much more than those during the period from 1990 to 2000. These changes are due to localized plantation activities and increased public and the local authorities awareness and conservation efforts during the last decade (Food and Agriculture Organization of the United Nations, 2007; Loughland et al., 2007; Howari et al., 2009). Additionally, most of the mangrove forests are natural reserve and inaccessible areas. The mangrove forests play a vital role in ecosystems, supporting biodiversity and protecting coastal areas from erosion and storms. Mangrove forests have an incredible ability to store blue carbon in soil and subsoil and removing carbon from the atmosphere and the Arabian Gulf (Food and Agriculture Organization of the United Nations, 2007; Loughland et al., 2007; Howari et al., 2009). The soil of the United Arab Emirates stocks about 25% quantile of other sites globally (Schile et al., 2017).
The results of mangroves change detection show a significant change in mangrove forests facing the Arabian Gulf, while a slight increase in mangrove forests facing the Gulf of Oman, possibly due to lower human activities and urbanization, lower sea surface temperature (SST), lower sea surface salinity (SSS; Freeman et al., 2008; Elmahdy and Mohamed, 2018; Noori et al., 2019), and the coarser soil texture (Ooi et al., 2011; Rodriguez et al., 2016). These factors strongly influence the spatial distribution and density of mangrove forests and thus the carbon pools (Schile et al., 2017).
A low-cost remote sensing approach that integrates machine learning and ID algorithms have not been employed for mapping and monitoring mangroves extent over different ecological systems for the first time. The proposed approach is of great benefit for monitoring mangrove changes in remote and inaccessible areas where ecological and environmental information are unavailable, and the need for shoreline protection and fish breeding is critical. It performs very well in coastal and inland areas as well as the dense and dispersed mangroves. The main limitation of the proposed approach and Landsat images is that it cannot identify mangrove species, heights and small patches of mangroves in a submerged form. In future research, it might be interesting to estimate mangrove height using dual HH/VV SAR data and coastal survey using Lidar data, and compare the results from that study with those from the current study. Future studies will assess and investigate the impact of the climate and environment on landscape change.
This study presented an integration approach based on learning RF with training data with a higher spatial resolution, RF optimal parameterization and applying a post-classification enhancement to the produced mangrove maps. The best parameters were 7 for sample node, 0 for tree depth and 75 for a tree in a forest. The results indicated that the integration approach, which uses Landsat images, is able to discriminate mangrove and non-mangrove areas and had an overall accuracy of more than 90% with an increase of 6.7% compared with supervised classifications. The results also demonstrated that the NUAE mangroves increased in all locations over the last 29 years. The majority of the NUAE mangroves are spatially distributed in the western coastal area than those in the eastern coastal area and the dense mangrove is much more than dispersed mangrove and much easier to discriminate and map. The mangrove forests of Khor Kalba facing the Gulf of Oman are more stable than those facing the Arabian Gulf. The highest distribution of mangroves was observed to be in the Umm Al Quwain estuarine, occupying an area of 1200 ha, while the lowest distribution of mangrove was reported to be in Ras Al Khor of Dubai covering an area of about 9 ha. Although there is a rapid change in the built-up area along with the eastern and western coastal areas of the NUAE, the mangroves had increased in sites of the NUAE and predicted to increase further over the next decade. The proposed approach can be applied to any area in arid and semi-arid regions and the results can be used as reference maps and updated by future studies as well as to provide useful ecological and environmental information.
The original contributions presented in the study are included in the article/supplementary material, further inquiries can be directed to the corresponding author/s.
SE processed the data and developed the RF. TA supervised the project and provided data. MM provided data and reviewed the methods. FH coded the RF algorithm. MA contributed to the scientific review. DS reviewed the manuscript. All authors contributed to the article and approved the submitted version.
The research has received funding under financial grant SCRI 18 Grant EN0-284 and the grant of UAE Space Agency z01-2016-001.
The authors declare that the research was conducted in the absence of any commercial or financial relationships that could be construed as a potential conflict of interest.
We would like to thank the American University of Sharjah, United Arab Emirates and UAE Space Agency for supporting this research.
Almahasheer, H. (2018). Spatial coverage of mangrove communities in the Arabian Gulf. Environ. Monit. Assess. 190:85.
Alsumaiti, T. S. (2014). An assessment of Avicennia marina forest structure and aboveground biomass in Eastern Mangrove Lagoon National Park, Abu Dhabi. Arab. World Geogr. 17, 166–185.
Alsaaideh, B., Al-Hanbali, A., Tateishi, R., Kobayashi, T., and Hoan, N. T. (2013). Mangrove forests mapping in the southern part of Japan using Landsat ETM+ with DEM. J. Geogr. Inform. Syst. 5, 369–377. doi: 10.4236/jgis.2013.54035
Amarsaikhan, D., Blotevogel, H. H., Ganzorig, M., and Moon, T. H. (2009). Applications of remote sensing and geographic information systems for urban land-cover change studies in Mongolia. Geocarto Int. 24, 257–271. doi: 10.1080/10106040802556173
Bachmair, S., and Weiler, M. (2012). Hillslope characteristics as controls of subsurface flow variability. Hydrol. Earth Syst. Sci. 16:3699. doi: 10.5194/hess-16-3699-2012
Banfield, R. E., Hall, L. O., Bowyer, K. W., and Kegelmeyer, W. P. (2006). A comparison of decision tree ensemble creation techniques. IEEE Trans. Pattern Anal. Machine Intell. 29, 173–180. doi: 10.1109/tpami.2007.250609
Barua, S., Karim, E., and Humayun, N. M. (2014). Present status and species composition of commercially important finfish in landed trawl catch from Bangladesh marine waters. Int. J. Pure Appl. Zool. 2, 150–159.
Bashitialshaaer, R. A., Persson, K. M., and Aljaradin, M. (2011). Estimated future salinity in the Arabian Gulf, the Mediterranean Sea and the Red Sea consequences of brine discharge from desalination. Int. J. Acad. Res. 3, 133–140.
Belgiu, M., and Dăguţ, L. (2016). Random forest in remote sensing: a review of applications and future directions. ISPRS J. Photogram. Rem. Sens. 114, 24–31. doi: 10.1016/j.isprsjprs.2016.01.011
Birth, G. S., and McVey, G. R. (1968). Measuring the color of growing turf with a reflectance spectrophotometer 1. Agron. J. 60, 640–643. doi: 10.2134/agronj1968.00021962006000060016x
Boardman, J. W., and Kruse, F. A. (1994). “Automated spectral analysis: a geological example using AVIRIS data, north Grapevine Mountains, Nevada,” in Proceedings of the ERIM Tenth Thematic Conference on Geologic Remote Sensing. Environmental Research, ed. ERIM (Ann Arbor, MI: Institute of Michigan), 407–418.
Boer, B., and Aspinall, S. J. (2005). “Life in the Mangroves,” in The Emirates: a Natural History, eds P. Hellyer and S. Aspinall (Cape Town: Trident Press).
Bui, T. (2015). Analysis of docker security. arXiv [Preprint]. arXiv:1501.02967.
Buitre, M. J. C., Zhang, H., and Lin, H. (2019). The mangrove forests change and impacts from tropical cyclones in the philippines using time series satellite imagery. Rem. Sens. 11:688. doi: 10.3390/rs11060688
Catani, F., Lagomarsino, D., Segoni, S., and Tofani, V. (2013). Landslide susceptibility estimation by random forests technique: sensitivity and scaling issues. Nat. Hazards Earth Syst. Sci. 13:2815. doi: 10.5194/nhess-13-2815-2013
Chen, B., Xiao, X., Li, X., Pan, L., Doughty, R., Ma, J., et al. (2017). A mangrove forest map of China in 2015: analysis of time series Landsat 7/8 and Sentinel-1A imagery in Google Earth Engine cloud computing platform. ISPRS J. Photogram. Rem. Sens. 131, 104–120. doi: 10.1016/j.isprsjprs.2017.07.011
Chen, J., Wang, P., Wang, C., and Gao, H. (2020). “Effects of six types of straw derived biochar on anaerobic biodegradation of polybrominated diphenyl ethers in mangrove sediments: a microcosm experiment,” in Proceedings of the IOP Conference Series: Earth and Environmental Science, Vol. 435 (Bristol: IOP Publishing), 012003.
Cintron, G., Lugo, A. E., Pool, D. J., and Morris, G. (1978). Mangroves of arid environments in Puerto Rico and adjacent islands. Biotropica 10, 110–121.
Colkesen, I., and Kavzoglu, T. (2017). Ensemble-based canonical correlation forest (CCF) for land use and land cover classification using sentinel-2 and Landsat OLI imagery. Rem. Sens. Lett. 8, 1082–1091. doi: 10.1080/2150704x.2017.1354262
Congalton, R. G., Oderwald, R. G., and Mead, R. A. (1983). Assessing Landsat classification accuracy using discrete multivariate analysis statistical techniques. Photogram. Eng. Rem. Sens. 49, 1671–1678.
Coppin, P. R., and Bauer, M. E. (1996). Digital change detection in forest ecosystems with remote sensing imagery. Rem. Sens. Rev. 13, 207–234. doi: 10.1080/02757259609532305
Crouvi, O., Ben-Dor, E., Beyth, M., Avigad, D., and Amit, R. (2006). Quantitative mapping of arid alluvial fan surfaces using field spectrometer and hyperspectral remote sensing. Rem. Sens. Environ. 104, 103–117. doi: 10.1016/j.rse.2006.05.004
Darvishsefat, A. A. (1995). Einsatz und Fusion von Multisensoralen Satellitendaten zur Erfassung von Waldinventuren. Rem. Sens. Ser. 24:1995.
Díaz, B. M., and Blackburn, G. A. (2003). Remote sensing of mangrove biophysical properties: evidence from a laboratory simulation of the possible effects of background variation on spectral vegetation indices. Int. J. Rem. Sens. 24, 53–73. doi: 10.1080/01431160305012
Diniz, C., Cortinhas, L., Nerino, G., Rodrigues, J., Sadeck, L., Adami, M., et al. (2019). Brazilian mangrove status: three decades of satellite data analysis. Rem. Sens. 11:808. doi: 10.3390/rs11070808
Donato, D. C., Kauffman, J. B., Murdiyarso, D., Kurnianto, S., Stidham, M., and Kanninen, M. (2011). Mangroves among the most carbon-rich forests in the tropics. Nat. Geosci. 4, 293–297. doi: 10.1038/ngeo1123
Edwards, M., and Richardson, A. J. (2004). Impact of climate change on marine pelagic phenology and trophic mismatch. Nature. 430, 881–884. doi: 10.1038/nature02808
Edwards, J., Gustafsson, M., and Näslund-Landenmark, B. (2007). Handbook for Vulnerability Mapping, EU Asia Pro Eco Project: Disaster Reduction Through Awareness, Preparedness and Prevention Mechanisms in Coastal Settlements in Asia. Demonstration in Tourism Destinations. Demonstration in Tourism Destinations. Stockholm: Swedish Rescue Services Agency & EU and International Affairs Department.
Elmahdy, S. I., and Mostafa Mohamed, M. (2013a). Remote sensing and GIS applications of surface and near-surface hydromorphological features in Darfur region, Sudan. Int. J. Rem. Sens. 34, 4715–4735. doi: 10.1080/01431161.2013.781287
Elmahdy, S. I., and Mostafa Mohamed, M. (2013b). Change detection and mapping of mangrove using multi-temporal remote sensing data: a case study of Abu Dhabi, UAE. J. Geomat. 7, 41–46.
Elmahdy, S. I., and Mohamed, M. M. (2018). Monitoring and analysing the Emirate of Dubai’s land use/land cover changes: an integrated, low-cost remote sensing approach. Int. J. Digital Earth 11, 1132–1150. doi: 10.1080/17538947.2017.1379563
Elmahdy, S. I., Mohamed, M. M., and Ali, T. A. (2019). Automated detection of lineaments express geological linear features of a tropical region using topographic fabric grain algorithm and the SRTM DEM. Geocarto Int. 1–20. doi: 10.1080/10106049.2019.1594393
Elmahdy, S. I., Mohamed, M. M., Ali, T. A., Abdalla, J. E. D., and Abouleish, M. (2020a). Land subsidence and sinkholes susceptibility mapping and analysis using random forest and frequency ratio models in Al Ain, UAE. Geocarto Int. 1–17. doi: 10.1080/10106049.2020.1716398
Elmahdy, S., Mohamed, M., and Ali, T. (2020b). Land use/land cover changes impact on groundwater level and quality in the Northern Part of the United Arab Emirates. Rem. Sens. 12:1715. doi: 10.3390/rs12111715
Embabi, N. S. (1993). “Environmental aspects of geographical distribution of mangrove in the United Arab Emirates,” in Towards the Rational Use of High Salinity Tolerant Plants, eds H. Lieth and A. A. Al Masoom (Dordrecht: Springer), 45–58. doi: 10.1007/978-94-011-1858-3_5
Erftemeijer, P. L., and Hamerlynck, O. (2005). Die-back of the mangrove Heritiera littoralis dryand, in the Rufiji Delta (Tanzania) following El Nino floods. J. Coast. Res. 48, 228–235.
Estoque, R. C., Pontius, R. G. Jr., Murayama, Y., Hou, H., Thapa, R. B., Lasco, R. D., et al. (2018). Simultaneous comparison and assessment of eight remotely sensed maps of Philippine forests. Int. J. Appl. Earth Observ. Geoinform. 67, 123–134. doi: 10.1016/j.jag.2017.10.008
Farid, D. M., Zhang, L., Rahman, C. M., Hossain, M. A., and Strachan, R. (2014). Hybrid decision tree and naïve Bayes classifiers for multi-class classification tasks. Expert Syst. Appl. 41, 1937–1946. doi: 10.1016/j.eswa.2013.08.089
Fang, H., and Liang, S. (2008). “Leaf area index models,” in Reference Module in Earth Systems and Environmental Sciences, ed. S. A. Elias (Amsterdam: Elsevier).
Fang, H. L., and Liang, S. L. (2003). Retrieving leaf area index with a neural network method: Simulation and validation. IEEE Trans. Geosci. Rem. Sens. 41, 2052–2062. doi: 10.1109/tgrs.2003.813493
Feng, W., Sui, H., Tu, J., Huang, W., and Sun, K. (2018). A novel change detection approach based on visual saliency and random forest from multi-temporal high-resolution remote-sensing images. Int. J. Rem. Sens. 39, 7998–8021. doi: 10.1080/01431161.2018.1479794
Field, C., Osborn, J., Hoffman, L., Polsenberg, J., Ackerly, D., Berry, J., et al. (1998). Mangrove biodiversity and ecosystem function. Glob. Ecol. Biogeogr. Lett. 7, 3–14.
Fleiss, J. L., Levin, B., and Paik, M. C. (2003). “Statistical inference for a single proportion,” in Anonymous Statistical Methods for Ratesand Proportions, Thirded, (Hoboken, NJ: John Wiley & Sons, Inc), 17–49. doi: 10.1002/0471445428.ch2
Food and Agriculture Organization of the United Nations (2007). The world’s Mangroves 1980–2005. A Thematic Study Prepared in the Framework of the Global Forest Resources Assessment 2005. Rome: Food and Agriculture Organization of the United Nations.
Foody, G. M. (2002). Status of land cover classification accuracy assessment. Rem. Sens. Environ. 80, 185–201. doi: 10.1016/s0034-4257(01)00295-4
Freeman, A. S., Short, F. T., Isnain, I., Razak, F. A., and Coles, R. G. (2008). Seagrass on the edge: Land-use practices threaten coastal seagrass communities in Sabah, Malaysia. Biol.Conserv. 141, 2993–3005. doi: 10.1016/j.biocon.2008.09.018
Friedman, J. H. (2001). Greedy function approximation: a gradient boosting machine. Ann. Stat. 29, 1189–1232.
Friedman, J. H. (2002). Stochastic gradient boosting. Comput. Stat. Data Anal. 38, 367–378. doi: 10.1016/s0167-9473(01)00065-2
Fry, B., and Cormier, N. (2011). Chemical ecology of red mangroves, Rhizophora mangle, in the Hawaiian Islands1. Pac. Sci. 65, 219–234. doi: 10.2984/65.2.219
Fu, B., Wang, Y., Campbell, A., Li, Y., Zhang, B., Yin, S., et al. (2017). Comparison of object-based and pixel-based Random Forest algorithm for wetland vegetation mapping using high spatial resolution GF-1 and SAR data. Ecol. Indic. 73, 105–117. doi: 10.1016/j.ecolind.2016.09.029
Ghanavati, E., Firouzabadi, P. Z., Jangi, A. A., and Khosravi, S. (2008). Monitoring geomorphologic changes using Landsat TM and ETM+ data in the Hendijan River delta, southwest Iran. Int. J. Rem. Sens. 29, 945–959. doi: 10.1080/01431160701294679
Giri, C., Ochieng, E., Tieszen, L. L., Zhu, Z., Singh, A., Loveland, T., et al. (2011). Status and distribution of mangrove forests of the world using earth observation satellite data. Glob. Ecol. Biogeogr. 20, 154–159. doi: 10.1111/j.1466-8238.2010.00584.x
Gong, P., Liu, H., Zhang, M., Li, C., Wang, J., Huang, H., et al. (2019). Stable classification with limited sample: transferring a 30-m resolution sample set collected in 2015 to mapping 10-m resolution global land cover in 2017. Sci. Bull. 64, 370–373. doi: 10.1016/j.scib.2019.03.002
Green, A. A., Berman, M., Switzer, P., and Craig, M. D. (1988). A transformation for ordering multispectral data in terms of image quality with implications for noise removal. IEEE Trans. Geosci. Rem. Sens. 26, 65–74. doi: 10.1109/36.3001
Guild, L. S., Cohen, W. B., and Kauffman, J. B. (2004). Detection of deforestation and land conversion in Rondonia, Brazil using change detection techniques. Int. J. Rem. Sens. 25, 731–750. doi: 10.1080/01431160310001598935
Ha, N. T., Manley-Harris, M., Pham, T. D., and Hawes, I. (2020). A comparative assessment of ensemble-based machine learning and maximum likelihood methods for mapping seagrass using sentinel-2 imagery in Tauranga Harbor, New Zealand. Rem. Sens. 12:355. doi: 10.3390/rs12030355
Heumann, B. W. (2011). An object-based classification of mangroves using a hybrid decision tree—Support vector machine approach. Rem. Sens. 3, 2440–2460. doi: 10.3390/rs3112440
Hill, T., and Lewicki, P. (2006). Statistics: Methods and Applications: A Comprehensive Reference for Science, Industry, and Data Mining. Tulsa, OK: StatSoft, Inc.
Ho, T. K. (1998). The random subspace method for constructing decision forests. IEEE Trans. Pattern Anal. Mach. Intell. 20, 832–844. doi: 10.1109/34.709601
Hong, H., Xu, C., Revhaug, I., and Bui, D. T. (2015). “Spatial prediction of landslide hazard at the Yihuang area (China): a comparative study on the predictive ability of backpropagation multi-layer perceptron neural networks and radial basic function neural networks,” in Cartography-Maps Connecting the World, eds C. R. Sluter, C. M. Cruz, and P. L. de Menezes (Cham: Springer), 175–188. doi: 10.1007/978-3-319-17738-0_13
Hossain, M. S., Bujang, J. S., Zakaria, M. H., and Hashim, M. (2015). Application of Landsat images to seagrass areal cover change analysis for Lawas, Terengganu and Kelantan of Malaysia. Cont. Shelf Res. 110, 124–148. doi: 10.1016/j.csr.2015.10.009
Howari, F. M., Jordan, B. R., Bouhouche, N., and Wyllie-Echeverria, S. (2009). Field and remote-sensing assessment of mangrove forests and seagrass beds in the northwestern part of the United Arab Emirates. J. Coast. Res. 25, 48–56. doi: 10.2112/07-0867.1
Huang, X., Zhang, L., and Wang, L. (2009). Evaluation of morphological texture features for mangrove forest mapping and species discrimination using multispectral IKONOS imagery. IEEE Geosci. Rem. Sens. Lett. 6, 393–397. doi: 10.1109/lgrs.2009.2014398
Huete, A., Didan, K., van Leeuwen, W., Miura, T., and Glenn, E. (2010). “MODIS vegetation indices,” in Land Remote Sensing and Global Environmental Change, eds B. Ramachandran, M. J. Abrams, and C. O. Justice (New York, NY: Springer), 579–602.
Inoue, T., Nohara, S., Matsumoto, K., and Anzai, Y. (2011). What happens to soil chemical properties after mangrove plants colonize? Plant Soil 346, 259. doi: 10.1007/s11104-011-0816-9
Irons, J. R., Dwyer, J. L., and Barsi, J. A. (2012). The next Landsat satellite: the landsat data continuity mission. Rem. Sens. Environ. 122, 11–21. doi: 10.1016/j.rse.2011.08.026
Ishil, T., and Tateda, Y. (2004). “Leaf area index and biomass estimation for mangrove plantation in Thailand,” in Proceedings of the IGARSS 2004. 2004 IEEE International Geoscience and Remote Sensing Symposium, Vol. 4, (Anchorage, AK: IEEE), 2323–2326.
Jean-Baptiste, N., and Jensen, J. R. (2006). Measurement of mangrove biophysical characteristics in the Bocozelle ecosystem in Haiti using ASTER multispectral data. Geocarto Int. 21, 3–8. doi: 10.1080/10106040608542397
Jensen, J. R. (1996). Introductory Digital Image Processing: A Remote Sensing Perspective (No. Ed. 2). Upper Saddle River, NJ: Prentice-Hall Inc.
Kamal, M., and Phinn, S. (2011). Hyperspectral data for mangrove species mapping: a comparison of pixel-based and object-based approach. Rem. Sens. 3, 2222–2242. doi: 10.3390/rs3102222
Kamal, M., Phinn, S., and Johansen, K. (2015). Object-based approach for multi-scale mangrove composition mapping using multi-resolution image datasets. Rem. Sens. 7, 4753–4783. doi: 10.3390/rs70404753
Kanniah, K. D., Sheikhi, A., Cracknell, A. P., Goh, H. C., Tan, K. P., Ho, C. S., et al. (2015). Satellite images for monitoring mangrove cover changes in a fast growing economic region in southern Peninsular Malaysia. Rem. Sens. 7, 14360–14385. doi: 10.3390/rs71114360
Klemas, V. V. (2009). The role of remote sensing in predicting and determining coastal storm impacts. J. Coast. Res. 25, 1264–1275. doi: 10.2112/08-1146.1
Kovacs, J. M., King, J. M. L., De Santiago, F. F., and Flores-Verdugo, F. (2009). Evaluating the condition of a mangrove forest of the Mexican Pacific based on an estimated leaf area index mapping approach. Environ. Monit. Assess. 157, 137–149. doi: 10.1007/s10661-008-0523-z
Laongmanee, W., Vaiphasa, C., and Laongmanee, P. (2013). Assessment of spatial resolution in estimating leaf area index from satellite images: a case study with avicennia marina plantations in Thailand. Int. J. Geoinform. 9, 69–77.
Liang, N. Y., Saratchandran, P., Huang, G. B., and Sundararajan, N. (2006). Classification of mental tasks from EEG signals using extreme learning machine. Int. J. Neural Syst. 16, 29–38. doi: 10.1142/s0129065706000482
Liu, Y. L., Shen, Z. J., Simon, M., Li, H., Ma, D. N., Zhu, X. Y., et al. (2020). Comparative proteomic analysis reveals the regulatory effects of H2S on salt tolerance of mangrove plant Kandelia obovata. Int. J. Mol. Sci. 21:118. doi: 10.3390/ijms21010118
Loughland, R. A., Saenger, P., Luker, G., Siddiqui, K., Saji, B., Belt, M., et al. (2007). Changes in the coastal zone of Abu Dhabi determined using satellite imagery (1972–2003). Aquat. Ecosyst. Health Manag. 10, 301–308. doi: 10.1080/14634980701512988
Ma, W., Xiong, Y., Wu, Y., Yang, H., Zhang, X., and Jiao, L. (2019). Change detection in remote sensing images based on image mapping and a deep capsule network. Rem. Sens. 11:626. doi: 10.3390/rs11060626
Martins, S., Bernardo, N., Ogashawara, I., and Alcantara, E. (2016). Support vector machine algorithm optimal parameterization for change detection mapping in funil hydroelectric reservoir (Rio de Janeiro State, Brazil). Model. Earth Syst. Environ. 2:138. doi: 10.1007/s40808-016-0190-y
McGinnis, S., and Kerans, B. L. (2013). Land use and host community characteristics as predictors of disease risk. Landsc. Ecol. 28, 29–44. doi: 10.1007/s10980-012-9810-8
Milani, A. S. (2018). “Mangrove Forests of the Persian Gulf and the Gulf of Oman,” in Threats to Mangrove Forests, eds C. Makowski and C. Finkl (Cham: Springer), 53–75. doi: 10.1007/978-3-319-73016-5_3
Mishra, S., Shrivastava, P., and Dhurvey, P. (2017). Change detection techniques in remote sensing: a review. Int. J. Wireless Mobile Commun. Ind. Syst. 4, 1–8.
Mondal, P., Trzaska, S., and De Sherbinin, A. (2018). Landsat-derived estimates of mangrove extents in the Sierra Leone coastal landscape complex during 1990–2016. Sensors 18:12. doi: 10.3390/s18010012
Mondal, P., Liu, X., Fatoyinbo, T. E., and Lagomasino, D. (2019). Evaluating combinations of sentinel-2 data and machine-learning algorithms for mangrove mapping in West Africa. Rem. Sens. 11:2928. doi: 10.3390/rs11242928
Moore, G. E., Grizzle, R. E., and Ward, K. M. (2013). “Mangrove resources of the United Arab Emirates: mapping and site survey 2011–2013,” in Final Report to the United Arab Emirates Ministry of Environment and Water, University of New Hampshire, (Durham, NC: Jackson Estuarine Laboratory).
Mountrakis, G., Im, J., and Ogole, C. (2011). Support vector machines in remote sensing: a review. ISPRS J. Photogram. Rem. Sens. 66, 247–259. doi: 10.1016/j.isprsjprs.2010.11.001
Naghibi, S. A., and Dashtpagerdi, M. M. (2017). Evaluation of four supervised learning methods for groundwater spring potential mapping in Khalkhal region (Iran) using GIS-based features. Hydrogeol. J. 25, 169–189. doi: 10.1007/s10040-016-1466-z
Naghibi, S. A., Pourghasemi, H. R., and Dixon, B. (2016). GIS-based groundwater potential mapping using boosted regression tree, classification and regression tree, and random forest machine learning models in Iran. Environ. Monit. Assess. 188:44.
Nascimento, W. R. Jr., Souza-Filho, P. W. M., Proisy, C., Lucas, R. M., and Rosenqvist, A. (2013). Mapping changes in the largest continuous Amazonian mangrove belt using object-based classification of multisensor satellite imagery. Estuar. Coast. Shelf Sci. 117, 83–93. doi: 10.1016/j.ecss.2012.10.005
Nguyen, H. H., McAlpine, C., Pullar, D., Johansen, K., and Duke, N. C. (2013). The relationship of spatial–temporal changes in fringe mangrove extent and adjacent land-use: case study of Kien Giang coast, Vietnam. Ocean Coast. Manag. 76, 12–22. doi: 10.1016/j.ocecoaman.2013.01.003
Noori, R., Tian, F., Berndtsson, R., Abbasi, M. R., Naseh, M. V., Modabberi, A., et al. (2019). Recent and future trends in sea surface temperature across the Persian Gulf and Gulf of Oman. PLoS One 14:e0212790. doi: 10.1371/journal.pone.0212790
Ooi, J. L. S., Kendrick, G. A., and VanNiel, K. P. (2011). Effects of sediment burial on tropical ruderal seagrasses are moderated by clonal integration.Cont. Shelf Res. 31, 1945–1954. doi: 10.1016/j.csr.2011.09.005
Otero, V., Van De Kerchove, R., Satyanarayana, B., Mohd-Lokman, H., Lucas, R., and Dahdouh-Guebas, F. (2019). An analysis of the early regeneration of mangrove forests using Landsat time series in the matang mangrove forest reserve, Peninsular Malaysia. Rem. Sens. 11:774. doi: 10.3390/rs11070774
Ouerghemmi, W., Gadal, S., Mozgeris, G., and Jonikavicius, D. (2018). “Urban vegetation mapping by airborne hyperspetral imagery; feasibility and limitations,” in Proceedings of the 2018 9th Workshop on Hyperspectral Image and Signal Processing: Evolution in Remote Sensing (WHISPERS), (Amsterdam: IEEE), 1–5.
Pal, M. (2005). Random forest classifier for remote sensing classification. Int. J. Rem. Sens. 26, 217–222. doi: 10.1080/01431160412331269698
Pereira, L. C. C., da Costa, ÁK. R., da Costa, R. M., Magalhães, A., de Jesus Flores-Montes, M., and Jiménez, J. A. (2018). Influence of a drought event on hydrological characteristics of a small estuary on the Amazon mangrove coast. Estuar. Coasts 41, 676–689. doi: 10.1007/s12237-017-0310-6
Pham, T. D., Xia, J., Ha, N. T., Bui, D. T., Le, N. N., and Tekeuchi, W. (2019b). A review of remote sensing approaches for monitoring blue carbon ecosystems: mangroves, seagrassesand salt marshes during 2010–2018. Sensors 19:1933. doi: 10.3390/s19081933
Pham, T. D., Yokoya, N., Bui, D. T., Yoshino, K., and Friess, D. A. (2019a). Remote sensing approaches for monitoring mangrove species, structure, and biomass: opportunities and challenges. Rem. Sens. 11:230. doi: 10.3390/rs11030230
Pham, T. D., and Yoshino, K. (2015). “Mangrove mapping and change detection using multi-temporal Landsat imagery in Hai Phong city, Vietnam,” in Proceedings of the International Symposium on Cartography in Internet and Ubiquitous Environments, (Tokyo: The University of Tokyo), 17–19.
Prasad, P. V. V., Boote, K. J., Allen, L. H. Jr., and Sheehy, J. E. (2006). Species, ecotype and cultivar differences in spikelet fertility and harvest index of rice in response to high temperature stress. Field Crops Res. 95, 398–411. doi: 10.1016/j.fcr.2005.04.008
Raschka, S. (2018). Model evaluation, model selection, and algorithm selection in machine learning. arXiv [Preprint], 2.
Raschka, S., and Mirjalili, V. (2019). Python Machine Learning: Machine Learning and Deep Learning with Python, scikit-learn, and TensorFlow 2. Birmingham: Packt Publishing Ltd.
Rodríguez-Romero, J., del Carmen López-González, L., Galván-Magaña, F., Sánchez-Gutiérrez, F. J., Inohuye-Rivera, R. B., and Pérez-Urbiola, J. C. (2011). Seasonal changes in a fish assemblage associated with mangroves in a coastal lagoon of Baja California Sur, Mexico. Latin Am. J. Aquat. Res. 39, 250–260. doi: 10.3856/vol39-issue2-fulltext-6
Rodriguez, W., Feller, I. C., and Cavanaugh, K. C. (2016). Spatio-temporal changes of a mangrove–saltmarsh ecotone in the northeastern coast of Florida, USA. Glob. Ecol. Conserv. 7, 245–261. doi: 10.1016/j.gecco.2016.07.005
Schapire, R. E. (2003). The boosting approach to machine learning: an overview. Nonl. Estim. Classif. 171, 149–171. doi: 10.1007/978-0-387-21579-2_9
Schile, L. M., Kauffman, J. B., Crooks, S., Fourqurean, J. W., Glavan, J., and Megonigal, J. P. (2017). Limits on carbon sequestration in arid blue carbon ecosystems. Ecol. Appl. 27, 859–874. doi: 10.1002/eap.1489
Small, C., and Sousa, D. (2019). Spatiotemporal characterization of mangrove phenology and disturbance response: the Bangladesh Sundarban. Rem. Sens. 11:2063. doi: 10.3390/rs11172063
Sesnie, S. E., Hagell, S. E., Otterstrom, S. M., Chambers, C. L., and Dickson, B. G. (2008). SRTM-DEM and landsat ETM+ data for mapping tropical dry forest cover and biodiversity assessment in Nicaragua. Revist. Geogr. Acad. 2, 53–65.
Sherrod, C. L., and McMillan, C. (1985). The distributional history and ecology of mangrove vegetation along the northern Gulf of Mexico coastal region. Contrib. Mar. Sci. 28, 129–140.
Singh, A. (1986). “Change detection in the tropical forest environment of northeastern India using Landsat,” in Remote Sensing and Tropical Land Management, eds M. J. Eden and J. T. Parry (London: John Wiley & Sons) 44, 273–254.
Snedaker, S. C. (1982). “Mangrove species zonation: why?,” in Contributions to the Ecology of Halophytes, eds D. N. Sen and K. S. Rajpurohit (Dordrecht: Springer), 111–125. doi: 10.1007/978-94-009-8037-2_8
Spruce, J. P., Bolten, J., Mohammed, I. N., Srinivasan, R., and Lakshmi, V. (2020). Mapping land use land cover change in the lower mekong Basin from 1997 to 2010. Front. Environ. Sci. 8:21. doi: 10.3389/fenvs.2020.00021
Strobl, C., Boulesteix, A. L., Kneib, T., Augustin, T., and Zeileis, A. (2008). Conditional variable importance for random forests. BMC Bioinform. 9:307. doi: 10.1186/1471-2105-9-307
Su, G. S., Song, Y. C., and Yan, L. B. (2009). Application of Gaussian process machine learning to slope stability evaluation. Rock Soil Mech. 30, 675–687.
Taalab, K., Cheng, T., and Zhang, Y. (2018). Mapping landslide susceptibility and types using Random Forest. Big Earth Data 2, 159–178. doi: 10.1080/20964471.2018.1472392
Tanaka, K., Hanamura, Y., Chong, V. C., Watanabe, S., Man, A., Kassim, F. M., et al. (2011). Stable isotope analysis reveals ontogenetic migration and the importance of a large mangrove estuary as a feeding ground for juvenile John’s snapper Lutjanus johnii. Fish. Sci. 77:809. doi: 10.1007/s12562-011-0396-x
Thomas, N., Bunting, P., Lucas, R., Hardy, A., Rosenqvist, A., and Fatoyinbo, T. (2018). Mapping mangrove extent and change: a globally applicable approach. Rem. Sens. 10:1466. doi: 10.3390/rs10091466
Todd, U., and Chris, C. (2010). Radiometric use of WorldView-2 Imagery Technical note 1 WorldView-2 Instrument description. Available online at: https://dg-cms-uploads-production.s3.amazonaws.com/uploads/document/file/104/Radiometric_Use_of_WorldView-2_Imagery.pdf
Torres, M., and Qiu, G. (2014). Automatic habitat classification using image analysis and random forest. Ecol. Inform. 23, 126–136. doi: 10.1016/j.ecoinf.2013.08.002
Toosi, N. B., Soffianian, A. R., Fakheran, S., Pourmanafi, S., Ginzler, C., and Waser, L. T. (2019). Comparing different classification algorithms for monitoring mangrove cover changes in southern Iran. Glob. Ecol. Conserv. 19:e00662. doi: 10.1016/j.gecco.2019.e00662
Wang, J., Zhao, Y., Li, C., Yu, L., Liu, D., and Gong, P. (2015). Mapping global land cover in 2001 and 2010 with spatial-temporal consistency at 250 m resolution. ISPRS J. Photogram. Rem. Sens. 103, 38–47. doi: 10.1016/j.isprsjprs.2014.03.007
Upadhyay, V. P., and Mishra, P. K. (2008). Population status of mangrove species in estuarine regions of Orissa coast, India. Trop. Ecol. 49, 183.
Van Niel, T. G., McVicar, T. R., and Datt, B. (2005). On the relationship between training sample size and data dimensionality: monte carlo analysis of broadband multi-temporal classification. Rem. Sens. Environ. 98, 468–480. doi: 10.1016/j.rse.2005.08.011
Vo, Q. T., Oppelt, N., Leinenkugel, P., and Kuenzer, C. (2013). Remote sensing in mapping mangrove ecosystems—An object-based approach. Rem. Sens. 5, 183–201. doi: 10.3390/rs5010183
Vorpahl, P., Elsenbeer, H., Märker, M., and Schröder, B. (2012). How can statistical models help to determine driving factors of landslides? Ecol. Model. 239, 27–39. doi: 10.1016/j.ecolmodel.2011.12.007
Vyas, D., Krishnayya, N. S. R., Manjunath, K. R., Ray, S. S., and Panigrahy, S. (2011). Evaluation of classifiers for processing Hyperion (EO-1) data of tropical vegetation. Int. J. Appl. Earth Obs. Geoinf. 13, 228–235. doi: 10.1016/j.jag.2010.11.007
Yokoya, N., and Iwasaki, A. (2010). “A maximum noise fraction transform based on a sensor noise model for hyperspectral data,” in Proceedings of the 31st Asian Conference on Remote Sensing (ACRS), (Tokyo: The University of Tokyo).
Yu, X., Hyyppä, J., Vastaranta, M., Holopainen, M., and Viitala, R. (2011). Predicting individual tree attributes from airborne laser point clouds based on the random forests technique. ISPRS J. Photogram. Rem. Sens. 66, 28–37. doi: 10.1016/j.isprsjprs.2010.08.003
Keywords: NUAE, mangrove, FMNF, remote sensing, change detection, Landsat
Citation: Elmahdy SI, Ali TA, Mohamed MM, Howari FM, Abouleish M and Simonet D (2020) Spatiotemporal Mapping and Monitoring of Mangrove Forests Changes From 1990 to 2019 in the Northern Emirates, UAE Using Random Forest, Kernel Logistic Regression and Naive Bayes Tree Models. Front. Environ. Sci. 8:102. doi: 10.3389/fenvs.2020.00102
Received: 28 March 2020; Accepted: 11 June 2020;
Published: 16 July 2020.
Edited by:
Wesley Moses, United States Naval Research Laboratory, United StatesReviewed by:
Tien Dat Pham, Florida International University, United StatesCopyright © 2020 Elmahdy, Ali, Mohamed, Howari, Abouleish and Simonet. This is an open-access article distributed under the terms of the Creative Commons Attribution License (CC BY). The use, distribution or reproduction in other forums is permitted, provided the original author(s) and the copyright owner(s) are credited and that the original publication in this journal is cited, in accordance with accepted academic practice. No use, distribution or reproduction is permitted which does not comply with these terms.
*Correspondence: Samy I. Elmahdy, c2VsbWFoZHlAYXVzLmVkdQ==; c2FteTkwM0B5YWhvby5jb20=; Mohamed M. Mohamed, bW1vaGFtZWRAdWFldS5hYy5hZQ==
Disclaimer: All claims expressed in this article are solely those of the authors and do not necessarily represent those of their affiliated organizations, or those of the publisher, the editors and the reviewers. Any product that may be evaluated in this article or claim that may be made by its manufacturer is not guaranteed or endorsed by the publisher.
Research integrity at Frontiers
Learn more about the work of our research integrity team to safeguard the quality of each article we publish.