
95% of researchers rate our articles as excellent or good
Learn more about the work of our research integrity team to safeguard the quality of each article we publish.
Find out more
ORIGINAL RESEARCH article
Front. Environ. Sci. , 03 July 2020
Sec. Biogeochemical Dynamics
Volume 8 - 2020 | https://doi.org/10.3389/fenvs.2020.00094
This article is part of the Research Topic Frontiers in Environmental Science – Editor’s Picks 2021 View all 25 articles
Two problems currently facing agriculture are drought and the availability of mineable phosphorus minerals used for fertilization. More frequent and longer drought periods are predicted to threaten agricultural yields in the future. The capacity of soils to hold water is a highly important factor controlling drought stress of plants during the growing phase. High phosphorus availability in soils is also necessary for high agricultural yields, however, over application has also led to a range of environmental problems, foremost being the eutrophication of waterways. Amorphous silica (ASi) has been suggested as one solution to mitigate both water and phosphorus availability. In this work we analyzed the effect of ASi on phosphorus mobility and the soil water storage of a sandy soil. In a lysimeter experiment we found that ASi strongly increased the water storage capacity (WSC) of soils (up to 180% by addition of 3 wt.% ASi). Furthermore, the ASi is in direct competition with phosphorus for sorption sites on iron oxides and other soil minerals increasing nutrient mobilization and increasing potential bioavailability for plants. Following calibration to the lysimeter experiment a process based hydrological model was used to extrapolate experimental results to a sandy agricultural soil with and without ASi for 1 year. For the soil with ASi, the water storage capacities for the yearly scenario were up to 40 kg/m2 higher compared to the untreated soil. Our results suggest that ASi enhances the WSC and phosphorus mobility in soil and that this may be one way to mitigate the predicted climate change related drought stress in sandy soils.
Low phosphorus (P) availability as well as longer and more frequent droughts are known to reduce terrestrial ecosystem performance and crop production (Engelbrecht et al., 2005; Elser et al., 2007; Michaelian et al., 2011; Elser, 2012; Fahad et al., 2017). The P content of soils is not always low. But a high proportion of this P is stored in inaccessible forms such as organic P (Bünemann et al., 2010), or is bound/adsorbed as inorganic P to, e.g., aluminum, iron oxides, or calcium minerals, depending on soil pH (Beauchemin et al., 2003), soil diagenesis stage (Crews et al., 1995), and mineral composition. Inorganic P is predominately immobilized as calcium phosphate minerals at soil pH > 6.5. At lower pH values P tends to be bound/adsorbed by hydrous oxides of iron, manganese, or aluminum (Brady and Weil, 2008). At neutral pH inorganic P reacts with silicate minerals (adsorption to weathered silicates like clay minerals; Rajan, 1975), but the P binding to those minerals is lowest compared with other minerals (Rajan, 1975; Brady and Weil, 2008). The different Si fractions in soils contain dissolved Si (free in soil solution or adsorbed to soil minerals), amorphous forms (e.g., the biogenic phytoliths or the minerogenic silica nodules), poorly crystalline forms (e.g., secondary quartz), and crystalline forms (the primary silicates like mica, feldspars, or quartz and the secondary silicates, e.g., clay minerals; Sauer et al., 2006). The availability of Si in soil pore waters varies over at least two orders of magnitude (0.01 to 2.0 mmol L–1; Haynes, 2014), and is largely affected by vegetation type, parent material, and soil diagenesis stage (Derry et al., 2005; Struyf and Conley, 2009). Soils differ quite substantially in regard to amorphous Si (ASi) content in soils (0.1 to ∼6%; Saccone et al., 2007) depending on climate regions, parent material, and vegetation cover.
It was recently shown that Si availability in soil is positively related to the plant P status (Neu et al., 2017) and to P availability in soils (Schaller et al., 2019; Hömberg et al., 2020). The study of Schaller et al. (2019) showed that increasing Si availability in soils lead to a mobilization of Fe(II)-P phases from mineral surfaces increasing P availability/mobility in soils (Schaller et al., 2019). However, it is currently not clear to which extent Si is able to inhibit P binding to soil minerals and if P is mobilized from secondary sources such as fertilizers.
Terrestrial ecosystems are suggested to be threatened from increased drought risks due to climate change on both the continental and the global scale (Lehner et al., 2006; Allen et al., 2010), negatively affecting ecosystem performance (IPCC, 2013). During severe drought periods plants suffer from drought stress and wilting, because the soil water storage decreases to values at which water is no longer available for plants, Anjum et al. (2011). Key parameters affecting the water supply to plants are the plant available water content in soils and the water storage capacity (WSC) at different water potentials (Saxton and Rawls, 2006). Soils differ quite substantial in WSC (Kern, 1995) and agricultural practice was shown to reduce soil water storage capacity (Mahe et al., 2005). Agricultural intensification also lead to decreasing ASi content of soils (Struyf et al., 2010; Vandevenne et al., 2012; Carey and Fulweiler, 2016) due to of yearly extractions of ASi by crop harvest (Vandevenne et al., 2012), as many crop plants are Si accumulators (Haynes, 2014).
Recently, it was shown that soil ASi content is an important factor for soil WSC and plant available water (Schaller et al., 2020). It was shown that an increase of ASi by 1% or 5% (by weight) increased the water content at any water potential and plant available water increased by up to >40% or >60%, respectively (Schaller et al., 2020). However, this effect of ASi on WSC and plant available water was only shown for small soil samples on laboratory scales with a soil depth of ∼5 cm. It is currently not clear how ASi is able to increase WSC in the rooting zone of typical crop plants (50 cm).
In this work, we analyzed the effect of different soil ASi contents on both P mobility and WSC of soils using a lysimeter with a soil depth of ∼50 cm. Lysimeter experiments were modeled using a physically based hydrological model based on soil retention functions and soil characteristics published previously in Schaller et al. (2020). The model was then used to study the WSC and water availability in the crop rooting zone over 1 year using measured rainfall and soil properties from an agricultural area in Eastern Germany (Brandenburg). Our hypotheses were (i) Si will limit sorption of P to the soil matrix due to competition for soil sorption sites on iron oxides and oxyhydroxides and (ii) the WSC and water availability for plants is increased significantly in soils amended with ASi, and this is important on a yearly scale.
The washed pure sand (Dorsilit, Dorfner GmbH, Hirschau, Germany) used in the experiments had a grain size between 0.1 and 0.5 mm. Samples taken from the sand were extracted using an aqua regia (9 mL HCl and 3 mL HNO3) digestion using 500 mg sand at 160°C according to (DIN-EN-13346, 2001). The extract was analyzed for its Fe and P content with an ICP-OES (Varian, Vista-Pro radial). Additionally, the sand was examined for its N and C content using a Nitrogen and Carbon Analyzer (Thermo Quest, Flash EA 1112). Amorphous Si of the used sand was analyzed in a 0.1 M Na2CO3 solution at 85°C for 5 h according to DeMaster (1981), and available Si was extracted by the Mehlich-3 extraction (Mehlich, 1984).
Water samples were analyzed for Si by ICP-OES and for phosphate, nitrate, sulfate, and chloride by ion chromatography (Metrohm, 822 Compact IC plus; separation column: Metrosep A Supp 4) according to (DIN-EN-ISO-10305-1, 2008). Due to the phosphate concentration being too low for ion chromatography in case of the mobilization experiments P concentrations were analyzed using a spectrophotometer (Hach, DR 2800) and the molybdenum blue method. Therefore, 2.5 ml of the sample, 25 μl molybdate sulfuric acid, and 100 μl 10%-solution of ascorbic acid were poured into cuvettes and shaken. After a reaction period of 10 min the samples were measured in the spectrophotometer at a wavelength of 720 nm. Additionally, a standard with a Si-concentration of 30 mg l–1 made from Na2O3Si ⋅ H2O and ultrapure water was measured to check for an interference of Si with the molybdenum blue method. The phosphate concentration was calculated using the extinction measured by the spectrophotometer and a standard curve made beforehand.
The setup of the lysimeter experiment is shown in Figure 1. The lysimeter was set up in a greenhouse and was operated from July to November. As there was only one scale each treatment was conducted as a separate part experiment one after the other. The experimental setting consisted of a scale and a cylindrical container with a diameter of 60 cm and a height of 60 cm. The soil container was connected to a scale to monitor the change in weight during the experiments. The scale was constructed of four load cells (Bosche, A30) with a maximum capacity load of 150 kg each. The container had an outlet at the bottom (2 cm radius), where leachate water was discharged and collected at 1 L intervals in the beginning of the experiment and later at 5–10 L intervals. The discharged leachate water was not taken into account when weighing the lysimeter. A mass fraction of 0% (as control), 1%, and 3% by volume ASi (SiO2, Aerosil 300, Evonik Industries) was mixed with sand. After mixing the dry sand with the ASi the material was filled into the lysimeter to reach 55 cm thickness, each. The weight of the dry sand was 175 kg in the treatment with 0% ASi, 172 kg with 1% ASi, and 146 kg with 3% ASi. The pure sand had an ASi content of 25 mg kg–1 DW–1 and a Si availability of 10 mg kg–1 DW–1.
For irrigation of the sand a four-channel peristaltic pump (Ismatec, Model ISM945D) and silicone tubes (4 mm diameter, 1 mm wall thickness) with holes (0.5 mm diameter) were used. The lysimeter was watered at a rate between 3 ml min–1 and 5 ml min–1, not differing between treatments. The irrigation water (deionized water) had a PO43– concentration of ∼12.5 mg L–1, a NO3– concentration of ∼55 mg L–1, and a Cl– concentration of ∼30 mg L–1. There was no SO42– in the used water. The irrigation water had a pH ∼ 8, but weakly buffered. To reach those concentrations deionized water was mixed with 0.069 g NaNO3, 0.048 g Na Cl, and 0.023 g Na2HPO4 ⋅ H2O per liter. The used sand had a Fe concentration of 299 ± 74 mg kg–1 DW–1 and a P concentration of 162 ± 30 mg kg–1 DW–1.
The load cells were logged using a BayEOS low power board that was read-out by a HX7 11 24 Bit AD-converter with an amplification of 128. The data was sent per RF24 to a router and from there transferred to the BayEOS server by BayEOS gateway.
After the breakthrough of the drainage water samples were taken every hour in the beginning and later in larger intervals. The samples were filtered with 0.2 μm syringe filters and analyzed using an ion chromatograph with suppressor module (see above).
After each experiment the rate of irrigation was determined by fitting a linear model of the form y = mx to the weight data from the beginning of the experiment until the breakthrough. m is the irrigation rate, y is the weight, and x the is passed time.
Fifteen g of sand with 3% vol/vol ASi and 0% ASi for control were mixed with 30 ml of ultrapure water in 30 50 mL vials per treatment using a horizontal shaker (Edmund Bühler GmbH, SM 30) with a frequency of 125 min–1 at room temperature (replication of three). At each time step (after 0, 1, 2, 3, 8.5, 23.5, 30.5, 48.5, 96.5, and 168.5 h) three vials of each treatment were taken out and centrifuged for 3 min at 5,000 rpm (Thermo Scientific, Hareas Multifuge X3). The supernatant was then filtered using a 0.2 μm syringe filter and analyzed in the ion chromatograph and spectrophotometer by molybdenum blue method (see above).
Analysis of variance (ANOVA) was used to compare element concentrations between the different treatments using SPSS version 22.
Variably saturated flow conditions for the lysimeter experiments were represented with the numerical flow model HydroGeoSphere (HGS; Aquanty and Inc, 2015). HGS solves the Richard’s equation by applying a finite element/control volume discretization scheme. A computational grid was set up representing the dimensions of the lysimeter in 3D (Figure 2). The model domain was discretized using prismatic 6-node elements with a horizontal and vertical resolution of ∼2 cm and 1.5 cm, respectivley. Constant and variable rainfall application was implemented by assigning a specified flow boundary condition (type Neumann) to the upper elements of the model domain (Figure 2). A no flow boundary condition was assigned to the element interfaces representing the outer boundaries of the cylindrical lysimeter. A free drainage boundary condition was assigned to those elements at the lower boundary that represent the outlet of the lysimeter (Figure 1) to mimic percolating water. Soil retention functions for the pure sand and the sand containing 3% ASi (relative permeability vs. saturation and matrix potential vs. saturation as shown in Figure 2) as well as measured saturated hydraulic conductivities and effective porosities (Table 1) were adopted from Schaller et al. (2020). For the simulation of the breakthrough experiments the model was initialized by assigning a negative total head of -5 m to all computational nodes of the grid in order to represent the very dry initial state of the sand.
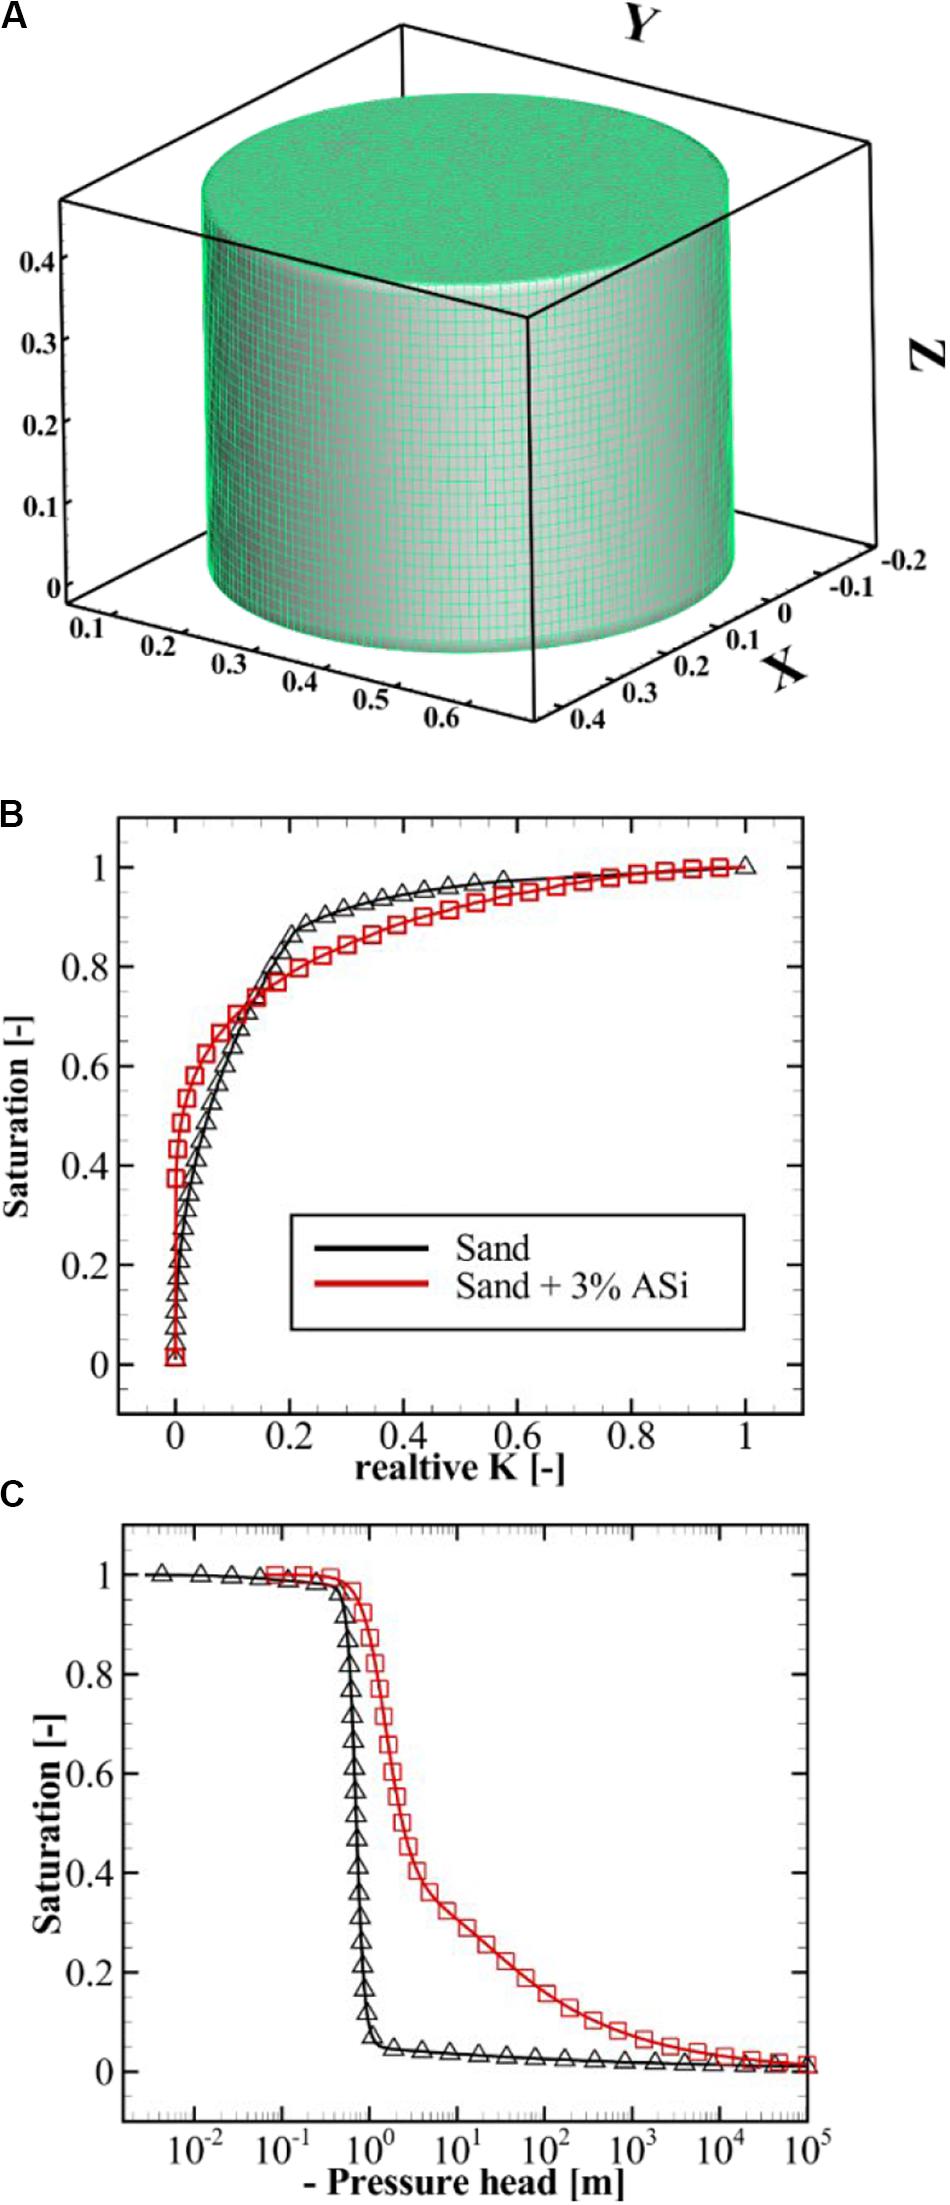
Figure 2. (A) Computational grid of the HGS model representing the cylindrical lysimeter. (B) Soil retention functions (relative permeability’s vs saturation) used to simulate variably saturated flow in the HGS model (adopted from Schaller et al., 2020). (C) Soil retention functions (pressure head vs saturation) used to simulate variably saturated flow in the HGS model (adopted from Schaller et al., 2020).
Saturated hydraulic conductivities for the pure sand and sand + 3% ASi were measured using a constant head darcy permeameter with 3 replica samples per soil types (mean values are listed in Table 1). As there usually is an uncertainty related to the measurement of soil properties including the transfer of those parameters obtained from laboratory experiments to the field scale (or in our case to the scale of the lysimeter experiments) we decided to additionally derive a parameter set for Ksat and θeff from model calibration. For this the model was run to represent the WSC for the pure sand and sand with 3% ASi using the measured soil characteristics (Table 1) as initial values for the calibration procedure. Based on the observed WSCm [M] and simulated WSCs [M] an objective function (Φ) [M2] was defined as a quantitative measure for the model performance:
A best fit parameter set for the pure sand and with 3% ASi was derived by locally minimizing the objective function in Eq. 1 using a manual calibration scheme.
The best fit parameter set as well as the measured ones subsequently were used for a yearly scenario using an observed rainfall record. For the yearly scenario the free drainage boundary was extended to all interface elements of the lower boundary to create realistic gravity driven percolation of water for the entire lower interface area. For both soil types the yearly simulations were initialized using a spin up run using the same yearly rainfall record and where the final head distributions at day 365 were used as initial conditions for the main run. The yearly rainfall data was measured for the water year 2018 (November 1st 2017 to October 31th 2018) for the area around the town of Müncheberg, an agriculturally dominated region in eastern Germany (Brandenburg) that is predominantly characterized by sandy soils. With a total of 434 mm rainfall the water year 2018 was very dry compared to the average precipitation of 545 mm in this area. The eastern parts of Germany are predicted to suffer from extended drought period in the future and a decline of average rainfall rates over the next 50 years (Fischer and Knutti, 2016). The yearly simulations were performed according to the guidelines of virtual experiments (Weiler and McDonnell, 2004). Here the simulations were not intended to provide realistic predictions for a specific field site rather we wanted to show how the altered soil properties of the sand containing 3% ASi are affecting the WSCs during a variably rainfall scenario. An error analysis for the four yearly scenarios was performed where the simulations were checked for their accuracies in closing the dynamical water balance.
The WSC of the soil profile increased with increasing soil ASi content (Figure 3). The high surface area of the ASi increases the adsorption of water films on the particle surfaces. In addition, the high porosity of the ASi may lead to the formation of silica gels which are known to have a water holding capacity of more than 500% (Iler, 1973). The finding that ASi is increasing the WSC of soils is in line with recent findings also showing an increase of soil WSC with increasing soil ASi content for the same material used (Schaller et al., 2020). However, compared to the 5 cm thick soil layer in the former study (Schaller et al., 2020) our current data showed little less WSC for 1% ASi and much higher WSC for the soil with 3% ASi. We conclude that ASi seems to be a highly important parameter for soil WSC, but the fundamental mechanisms of water storage are still poorly understood. The high WSC of the soil with 3% ASi is extremely high compared to that of clay minerals (Brady and Weil, 1999) or even Andosols (Hodnett and Tomasella, 2002), and are in the range of allophane (Fontes et al., 2004). It is clear that the different concentrations of ASi in soils in combination with different substrates have to be analyzed in future to obtain a more generalized picture on how ASi is affecting WSC of soils.
Amorphous silica was able to reduce phosphate binding to soil minerals. Phosphate was also mobilized by ASi from binding to soil minerals. We found significant (p < 0.001, df = 1, and F = 5685.959) increased mobilization of phosphate in the treatment with 3% ASi compared to the control without ASi addition in the mobilization experiment (Figure 4). This can be explained by the simultaneously occurring significant [p < 0.001, df = 1, and F = 5595.545 (p < 0.001, df = 1, and F = 5685.959)] higher dissolution of ASi to silicic acid in the 3% ASi treatment compared to the control (Figure 4). A strong relationship (R2 0.92, p < 0.001) between ASi silicic acid concentrations and phosphate mobilization from the soil minerals was found (Figure 5). Separated into the two experiments with 0% and 3% ASi addition the correlation between silicic acid and phosphate showed nearly the same relationship for the 3% ASi treatment with r 0.97 and p < 0.001 (Supplementary Figure S1). This strong relationship of silicic acid and phosphate mobilization is in accordance with recent studies showing an increased phosphate mobilization with increasing ASi availability (Schaller et al., 2019). The same pattern was found for the lysimeter experiments. The Si concentrations in the lysimeter seepage water was below 10 mg L–1 for the control treatment (0% ASi), ∼70 mg L–1 for the 1% ASi treatment and ∼80 mg L–1 for the 3% ASi treatment (Figure 6A). The phosphate concentration in the seepage water at lysimeter breakthrough was ∼2 mg L–1 for the control treatments with no ASi addition (0% ASi), ∼9 mg L–1 for the treatments with 1% ASi, and ∼7 mg L–1 for the treatment with 3% ASi. In the control treatment a slower increase in phosphate concentration was found, reaching ∼7 mg L–1 after 23 days (Figure 6B). In the treatment with 3% ASi the seepage water reached the phosphate concentration of the initial irrigation water of ∼12.5 mg L–1 after 12 days. The phosphate concentration in the treatment with 1% ASi reached 11.5 mg L–1 after 20 days. As the slope of the phosphate concentration in the treatments with 0% and 1% ASi was that low, the experiment was stopped before reaching the phosphate concentration of the initial irrigation water of ∼12.5 mg L–1 (Figure 6B).
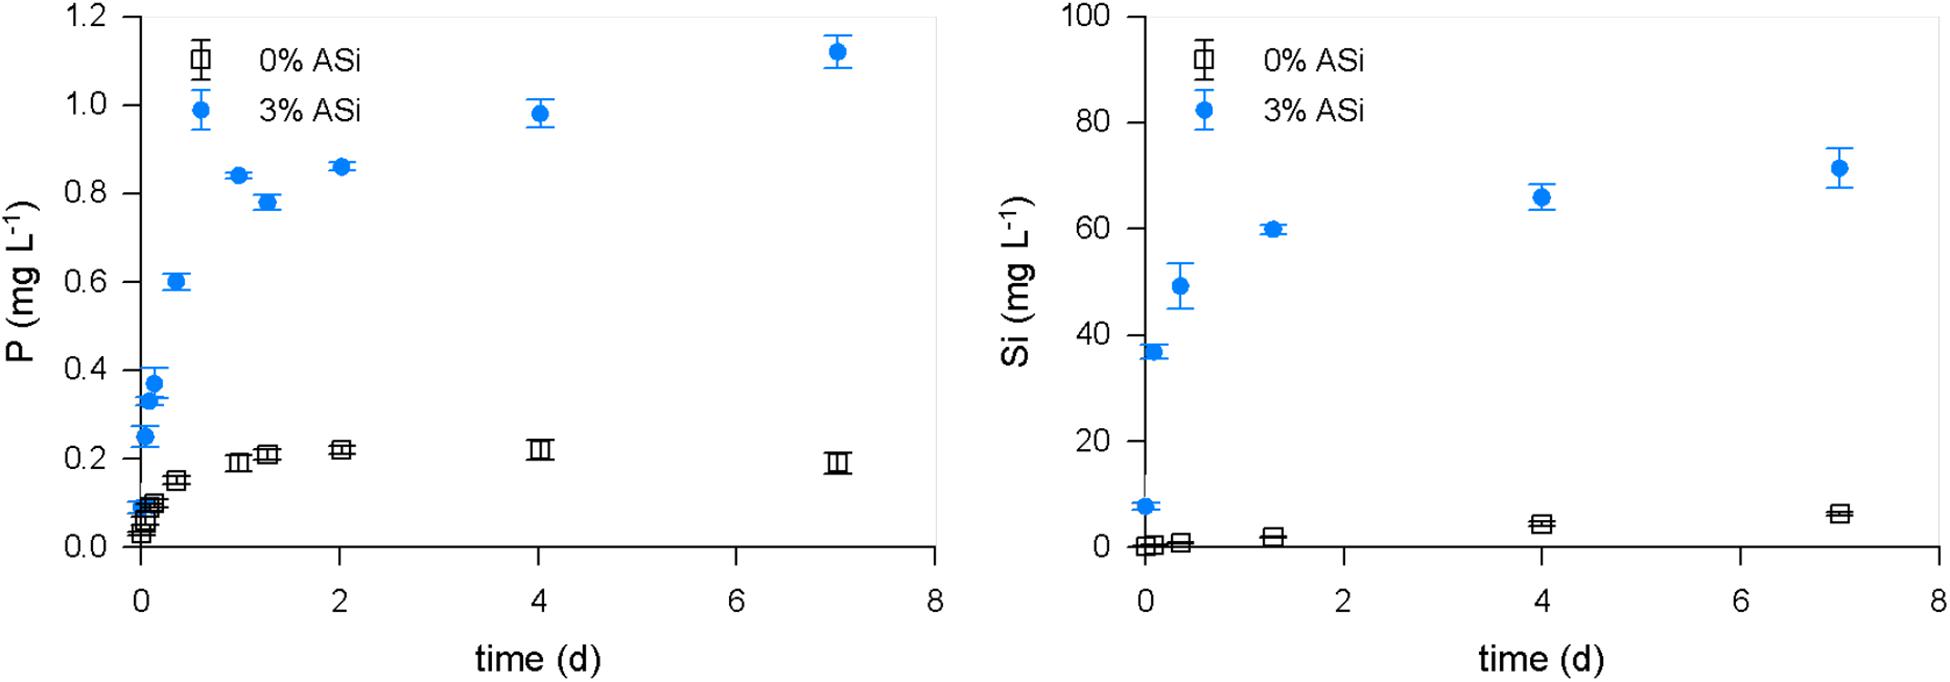
Figure 4. Mobilization of P and Si from soil with different ASi content collected from a mobilization experiment.
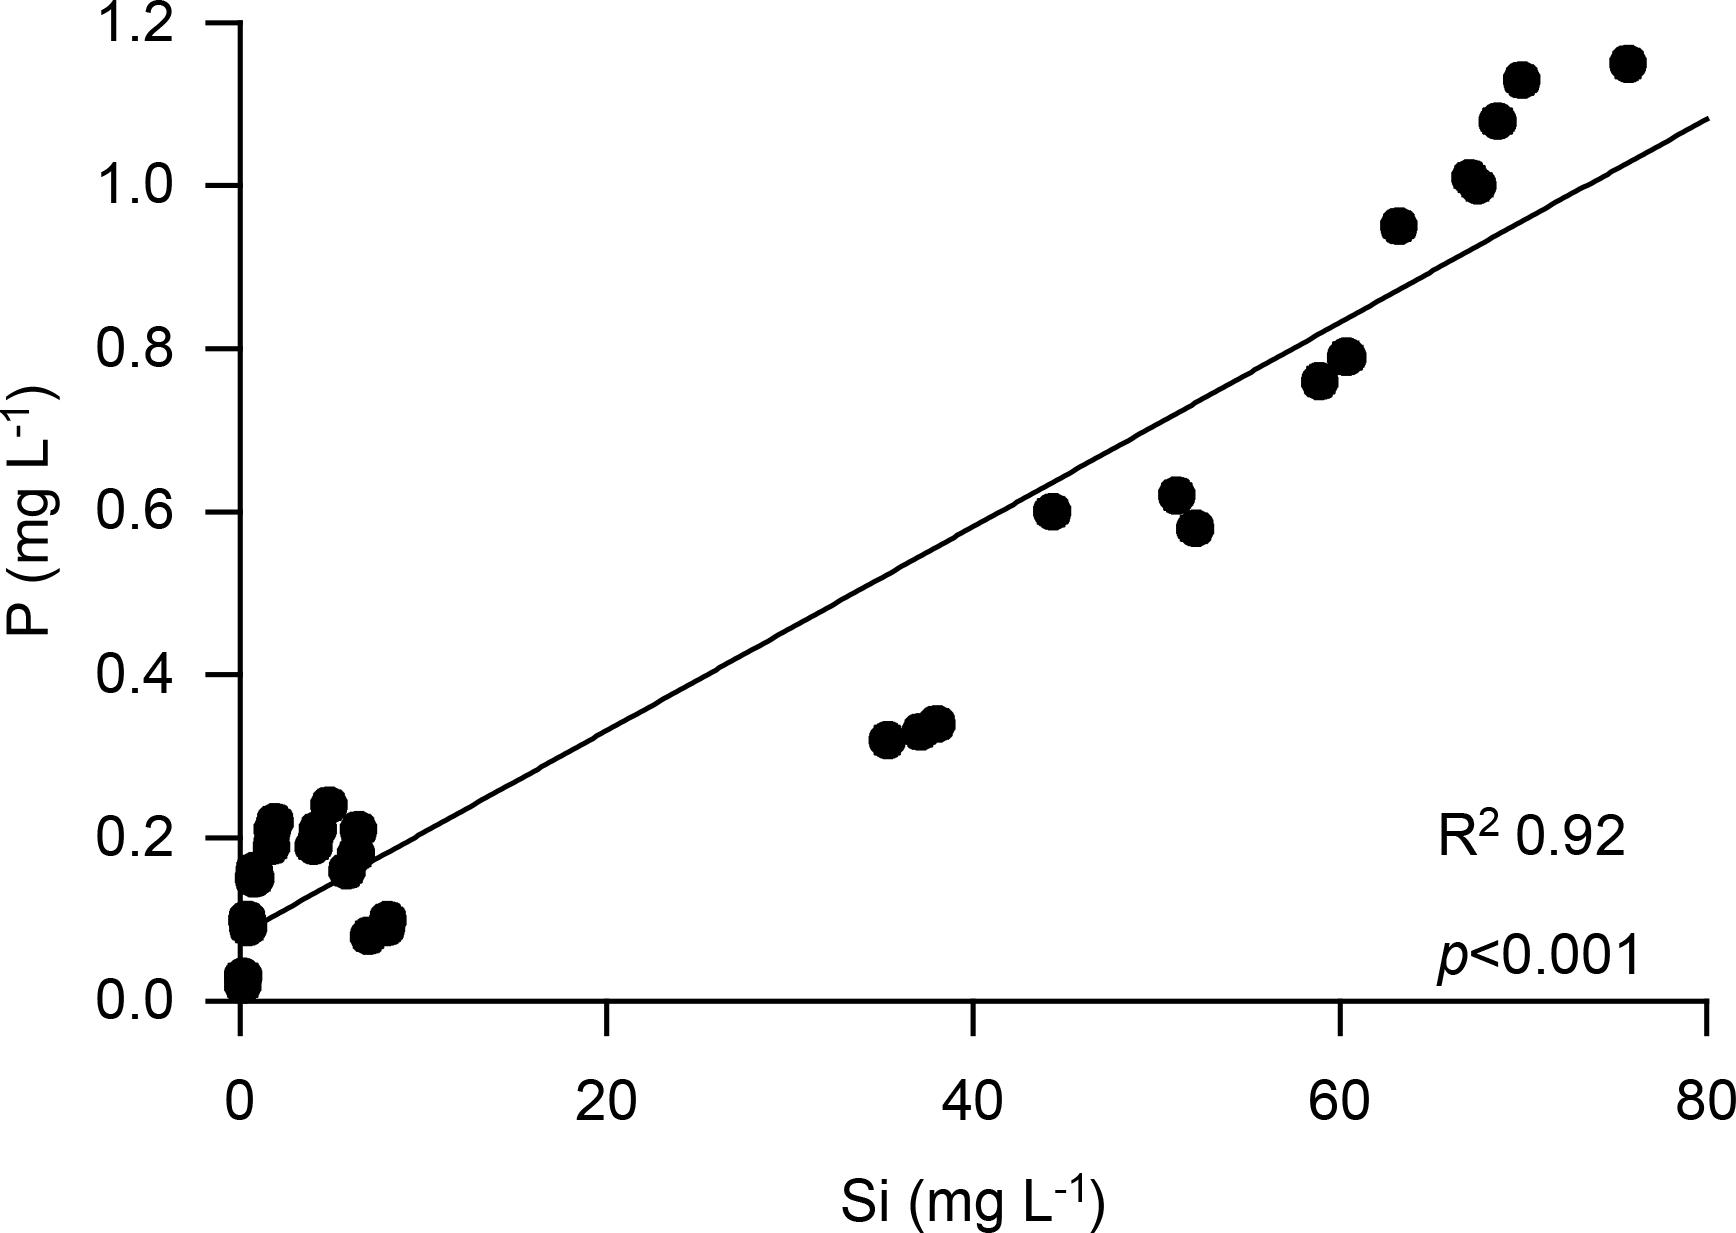
Figure 5. Correlation between P and Si mobilization from soil collected from a mobilization experiment.
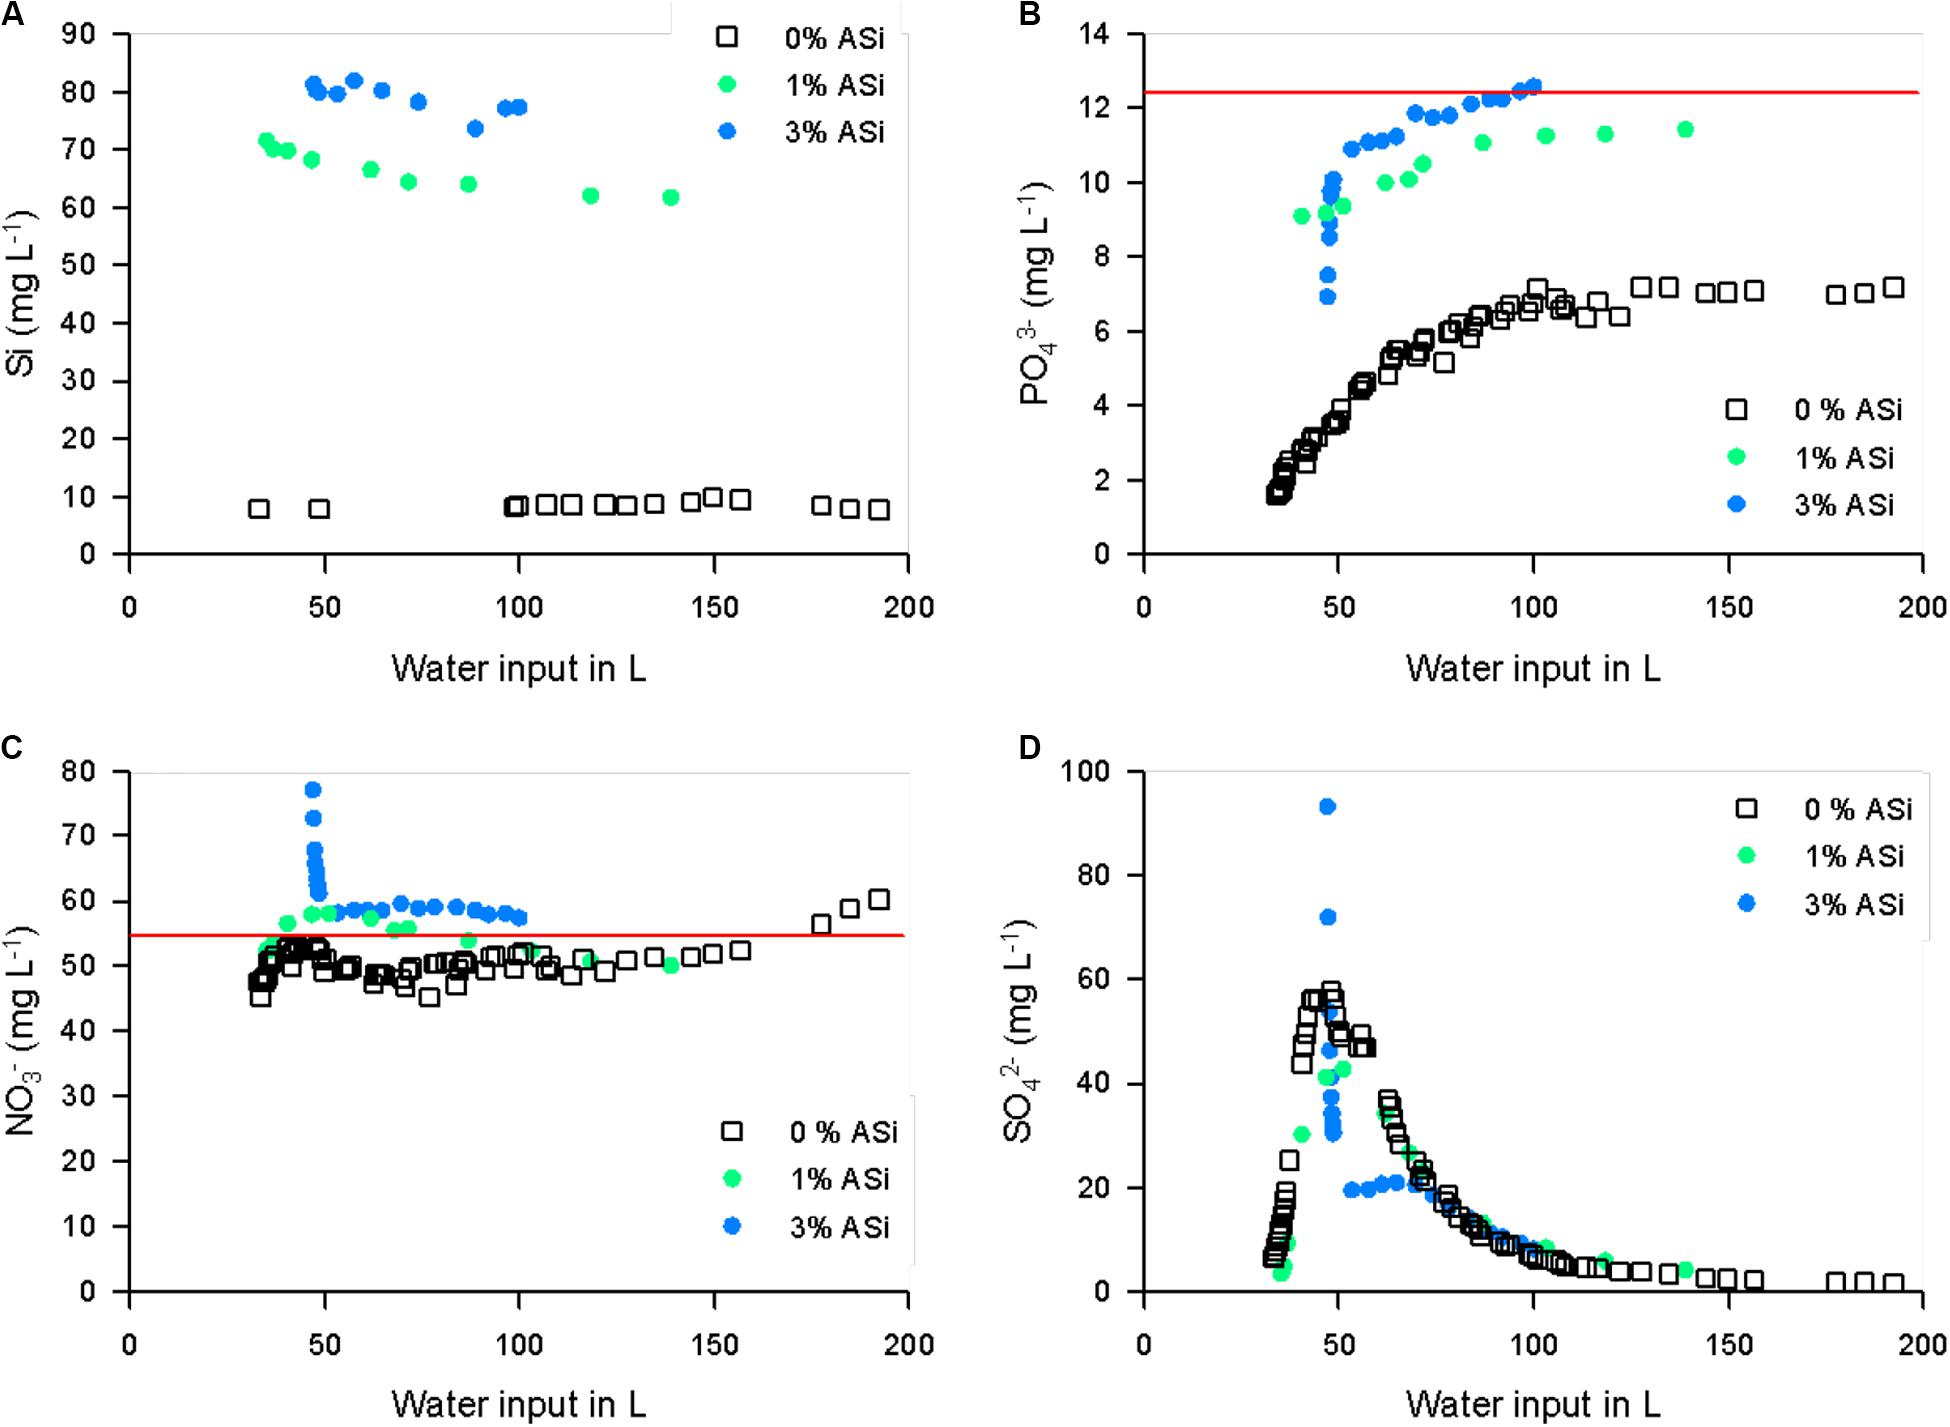
Figure 6. Silicon (A), phosphate (B), nitrate (C), and sulphate (D) concentration in the seepage water in relation to water input for different soil ASi content. The red line indicates the concentration of the irrigation water.
The temporal development of the phosphate breakthrough curves between the various experiments are consistent with our understanding of the competitive sorption of inner-sphere complexes to iron oxides. Silicic acid can be treated as a non-charged bidentate ligand at the experimental pH (<7; Taylor, 1995). This means that the H4SiO4 molecule complexes covalently to oxygen atoms at the corners of edge linked iron oxide octahedra by π bonding of their p orbitals (Swedlund et al., 2010; Dol Hamid et al., 2011; Noritake and Kawamura, 2015). Adsorption is in 2C coordination with ferrihydrite. In this coordination H4SiO4 is in direct competition for sorption sites with the monodentate and bidentate (depending on pH) ligands of the phosphate molecule (Figure 7; Taylor, 1995; Ahmed et al., 2019). In general the PO4 molecule has a stronger binding energy to iron oxides than the silicic acid (Taylor, 1995), however, the high pore water concentrations of H4SiO4 in the ASi amended soils favor both (1) displacement of sorbed phosphate, as observed in the kinetic extraction experiments, and (2) occupation of iron oxide sorption sites by H4SiO4 ligands in the lysimeter experiment.
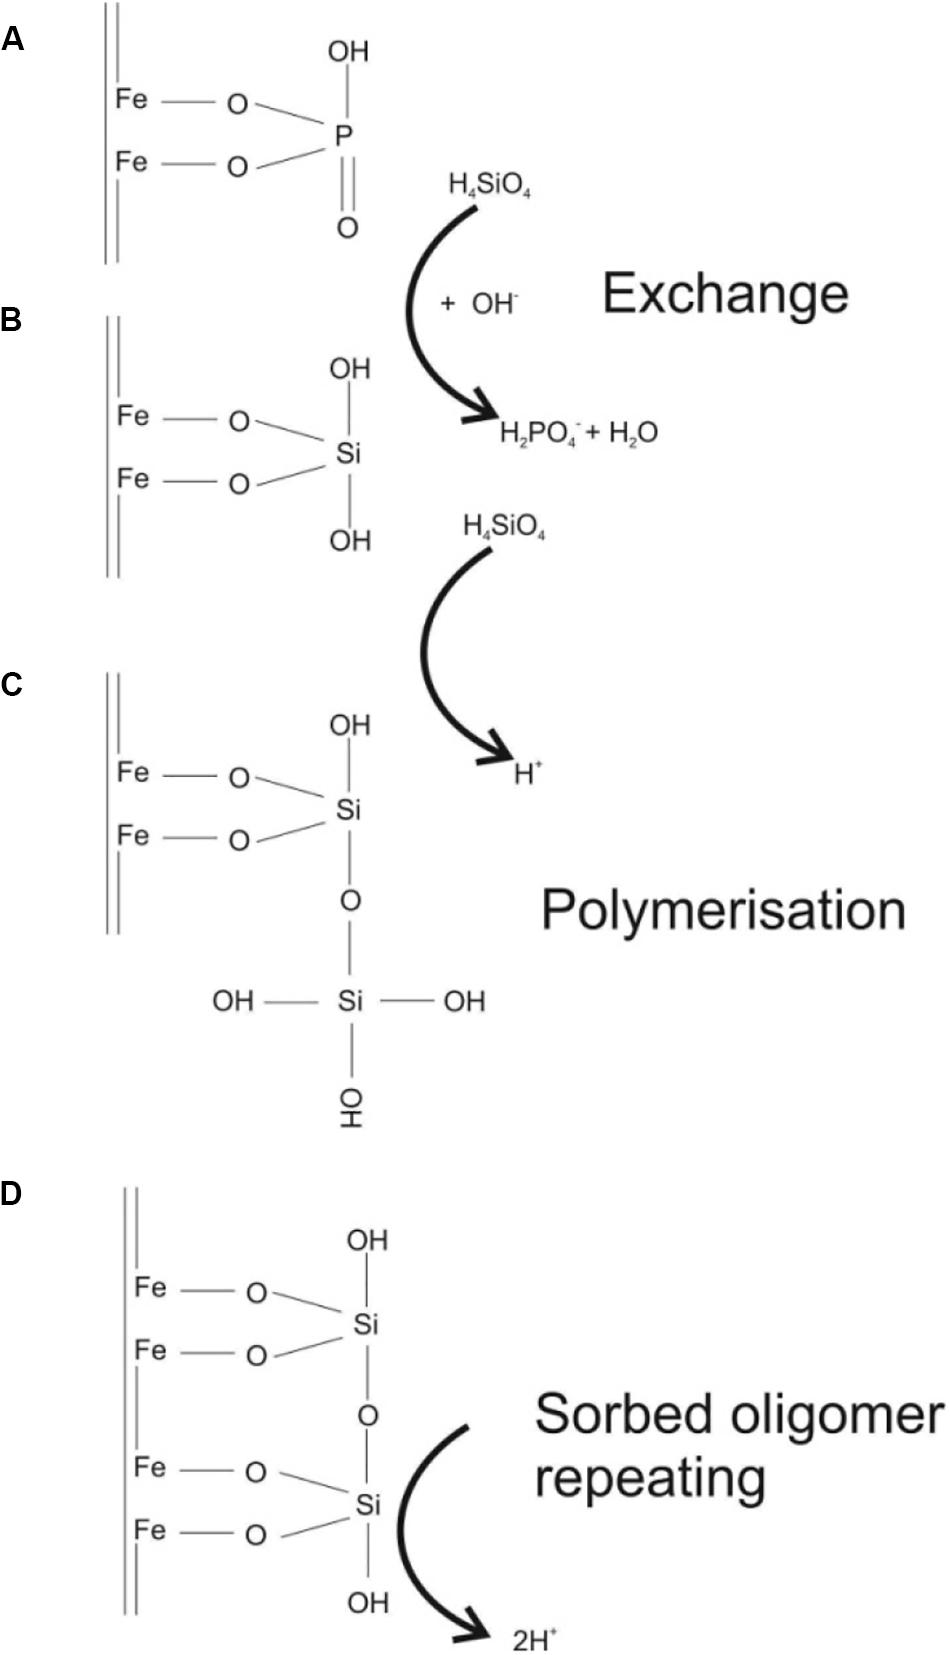
Figure 7. (A,B) substitution of a bidentate phosphate ligand on an iron oxide surface with the siliceous acid bidentate ligand, (C,D) polymerization of the siliceous acid and sorption of the oligomer to the iron oxide surface. Note the dimer shown represents Si-O-Si chains with a minimum length of 3 units. The monomer has seldom been observed in experiments.
One potentially important aspect of surface siliceous acid chemistry is the propensity of the H4SiO4 to polymerize at high concentrations both in solution and on iron oxide surfaces forming Si-O-Si oligomer chains (Pokrovski et al., 2003; Hiemstra et al., 2007; Dol Hamid et al., 2011). It has been shown that polymerization of Si-O-Si occurs between H4SiO4 adsorbed to the iron oxide surface and the solution phase H4SiO4 and that this is favored at low pH and high Si/Fe ratios (Swedlund et al., 2010). Reduced iron surfaces, such as that of magnetite, also favor polymerization over more oxidized surfaces such as ferrihydrite (Elgaroshi et al., 2019). Once the solid-solution phase oligomer is formed the solution phase molecule tends to also bind to the iron oxide octahedral, again with 2C coordination, increasing the coverage of H4SiO4 on the iron surface (Figure 7). The sorbed oligomer displays “condensed matter” properties with a pyroxene-like structure which may behave differently to the adsorbed monomer (Swedlund et al., 2010; Elgaroshi et al., 2019). The experiments conducted here had Si/Fe molar ratios of 0.53 which would favor the formation of condensed Si-O-Si oligomer surface structures on the iron oxides, especially in the 3 wt.% ASi experiment. While it is currently uncertain, we hypothesize that this condensed H4SiO4 surface oligomer will have a higher surface binding affinity to the iron oxides than the monomer alone because of the increased crystallinity of the tetrahedra chains, and thus reduce the probability of desorption as solution chemistry changes. In experiments studying sorption of CrO42– to iron oxide surfaces Zachara et al. (1987) noticed that H4SiO4 hindered the adsorption of CrO42–, and exchange was especially slow after iron oxides had been aged with H4SiO4. At the time of Zachara et al. (1987) polymerization, condensation and crystallization of the silica oxide complex at the iron oxide surface was not known, but it seems likely that this process reduced the rate of CrO42– exchange between the aqueous phase and the iron oxide surface. This may mean that once H4SiO4 is sorbed to iron oxide surfaces it will be a long-lasting hindrance to phosphate immobilization, and thus make phosphate bioavailable in soils for longer than expected based on simple monomer chemistry. However, it is also clear that more work needs to be conducted on the fundamental process of competitive binding between iron oxides, phosphate and silicic acid beyond the double layer model and how this is affected by surface Si-O-Si polymerization and crystallization in the presence of phosphate.
Nitrate concentrations of the control treatment (0% ASi) started at ∼45 mg L–1 followed by a period of values below the nitrate concentration of the irrigation water of ∼55 mg L–1 and after water input of about 175 L the nitrate concentration increased to values little bit higher than those of the irrigation water (Figure 6C). The nitrate concentration of the 1% ASi treatment started at values of 50 mg L–1. After water input of about 45 L the nitrate values in the seepage water were higher compared to the irrigation water until a water input of about 75 L. Afterwards, the nitrate concentration of the 1% ASi treatment decreased to values below the irrigation water (Figure 6C). The pattern of the nitrate concentration of the 3% ASi treatment was different with values of nearly 80 mg L–1 after a water input of about 50 L. This value dropped rapidly to values of ∼60 mg L–1 and remained at this concentration (Figure 6C). Additionally, we found a mobilization of nitrate from the soil in the mobilization experiment (Supplementary Figure S2). These results with ASi increasing nitrate mobility are in line with finding froma peatland experiment showing increased nitrogen mobilization into pore waters after ASi addition (Reithmaier et al., 2017).
The sulfate concentration of the irrigation water was 0 mg L–1 for all treatments. Hence, all sulfate analyzed in the seepage waters was mobilized from the soils. The sulfate concentrations of both the control (0% ASi) and 1% ASi followed the same pattern with a start of ∼5 mg L–1 followed by strong increase to values of 60 mg L–1 for the 0% ASi and 40 mg L–1 for the 1% ASi treatment. Afterwards, the sulfate values dropped for both treatments to values of ∼4 mg L–1 (Figure 6D). For the treatment with 3% ASi the sulfate concentration in the seepage water at lysimeter breakthrough was nearly 95 mg L–1 and dropped to values of 20 mg L–1 rapidly (Figure 6D). Afterwards, sulfate concentration in 3% ASi treatment decreased to values of the 0 and 1% ASi treatments. We also found a mobilization of sulfate from the soil in the shaker experiment (Supplementary Figure S2).
The chloride concentration followed the same pattern as for the sulfate. In all treatments the chloride concentration in the seepage water was always higher compared with the irrigation water (Figure 8, red line). The chloride concentration started at ∼30 mg L–1 for both the 0 and 1% ASi treatments, increasing to values of ∼45 mg L–1 and afterwards decreasing to values of ∼30 mg L–1 again. The chloride concentration in the seepage water of the 3% ASi treatments was at lysimeter breakthrough ∼75 mg L–1 and decreased rapidly to vales of ∼40 mg L–1 (Figure 8). Afterwards, chloride concentrations in 3% ASi treatment decreased to vales of ∼36 mg L–1. We found a tendency of increased mobilization of chloride from the soil by ASi in the mobilization experiment (Supplementary Figure S2).
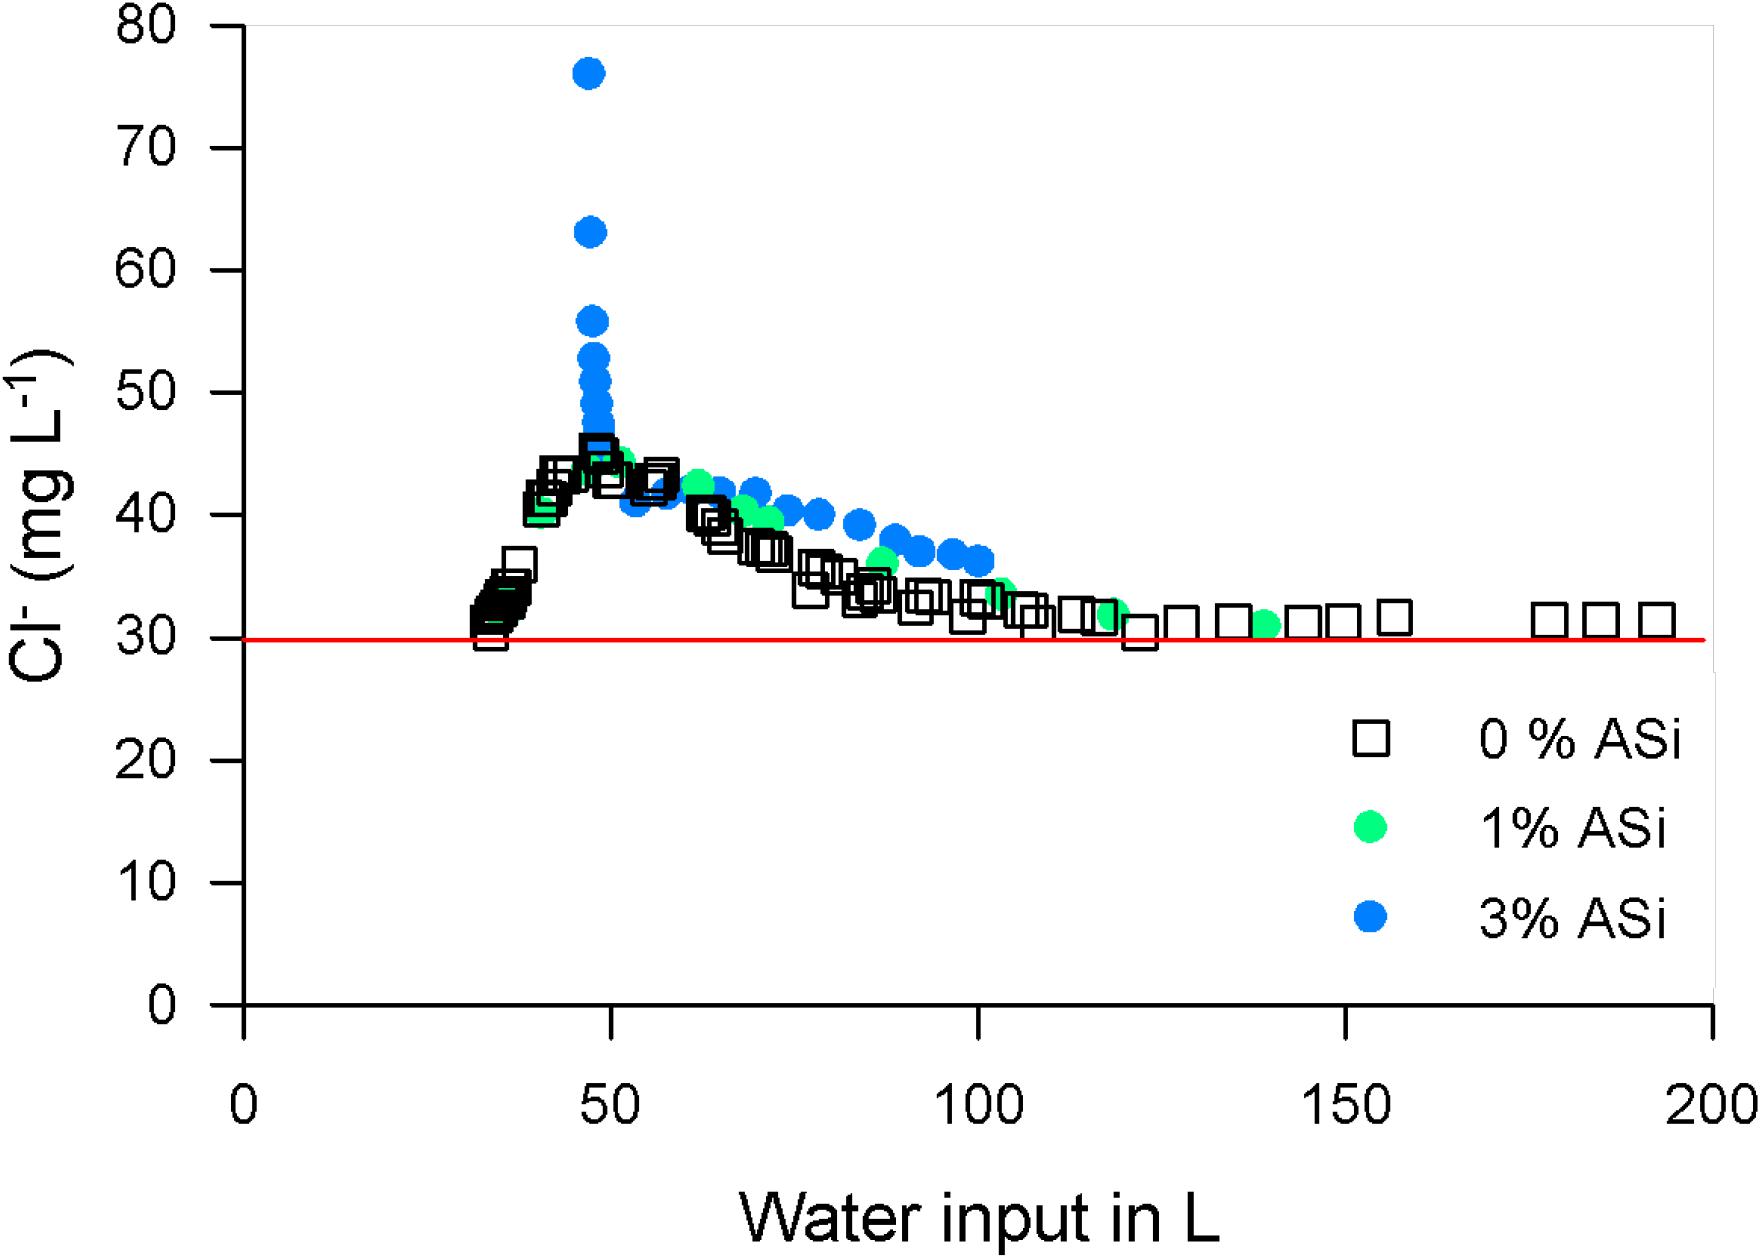
Figure 8. Chloride (Cl–) concentration in the seepage water in relation to water input for different soil ASi content. The red line indicates the concentration of the irrigation water.
The temporal trends in nitrate, sulfate and chloride concentrations in the lysimeter can be explained by dissolution of salts from the soil matrix, with relatively little effect of sorption in the soils profile (Tyler and Thomas, 1977; Appelo and Postma, 2005). This is mostly clearly seen in the breakthrough curve of sulfate, as it was not added to the experiment. The temporal trend in these ions in the control and the 1 wt.% ASi amendment was very similar due to the minimal difference in WSC between these two experiments. In these experiments the contact time and therefore flow path length and water/sand ratio was similar, leading to a comparable dissolution of the salts (Cl–, SO42–, and NO3–) from the sand matrix (Berezniak et al., 2018). In contrast, the 3 wt.% ASi experiment displayed a significantly longer water residence time in the lysimeter and a higher WSC than either of the other two experiments. This means that the water had a longer contact time with the sand matrix due to longer and more tortious flow paths through the soil profile. This decreased the water/sand ratio and concentrated salts in the first part of the breakthrough solution (Berezniak et al., 2018). In a real system the increased residence times in the soil profile are likely to have complex and possibly opposing effects (Raats, 1981; Lu et al., 2018). Increased water residence in the soil increases the contact time between redox sensitive elements such as nitrate and the organic substrate. This may favor chemical reduction and so loss (as N2 or N2O) of this nutrient from the soil (Jahangir et al., 2012). The longer residence time in the rooting zone may also lead to a higher availability of nutrients and uptake by vegetation before the nutrients are lost below the rooting zone, and ultimately into the groundwater (Zotarelli et al., 2008). This could have positive environmental effects as nitrate contamination of groundwater is a major concern for water resources and aquatic ecosystems. Overall there is little evidence that the ASi influences and sorptive behavior of these ions, but indirect effects such as increasing the WSC of the soil and increasing the residence time in the rooting zone has the potential for positive environmental outcomes.
For the measured soil parameter set (Table 1) simulated WSCs under stationary conditions, achieved at the end of the breakthrough experiments, reached 32.9 kg of water for the pure sand and 42.4 kg for the sand containing 3% ASi. Best fit parameters obtained from model calibration (Table 1) that locally minimize the corresponding objective functions (Figure 9) resulted in a simulated WSC of 29.7 kg (sand) and 45.19 kg (sand + 3% ASi), respectively. Observed WSC for the pure sand was 29.9 kg and 45.2 kg for the sand containing 3% ASi. Parameter sets derived from calibration reflect a strong a positive correlation between an increase in the effective porosity (0.38 to 0.6) and an increase in Ksat (1.2 m/d to 3.0 m/d) which is often described in literature (Suleiman and Ritchie, 2001; Urumović and Urumović Sr, 2014).
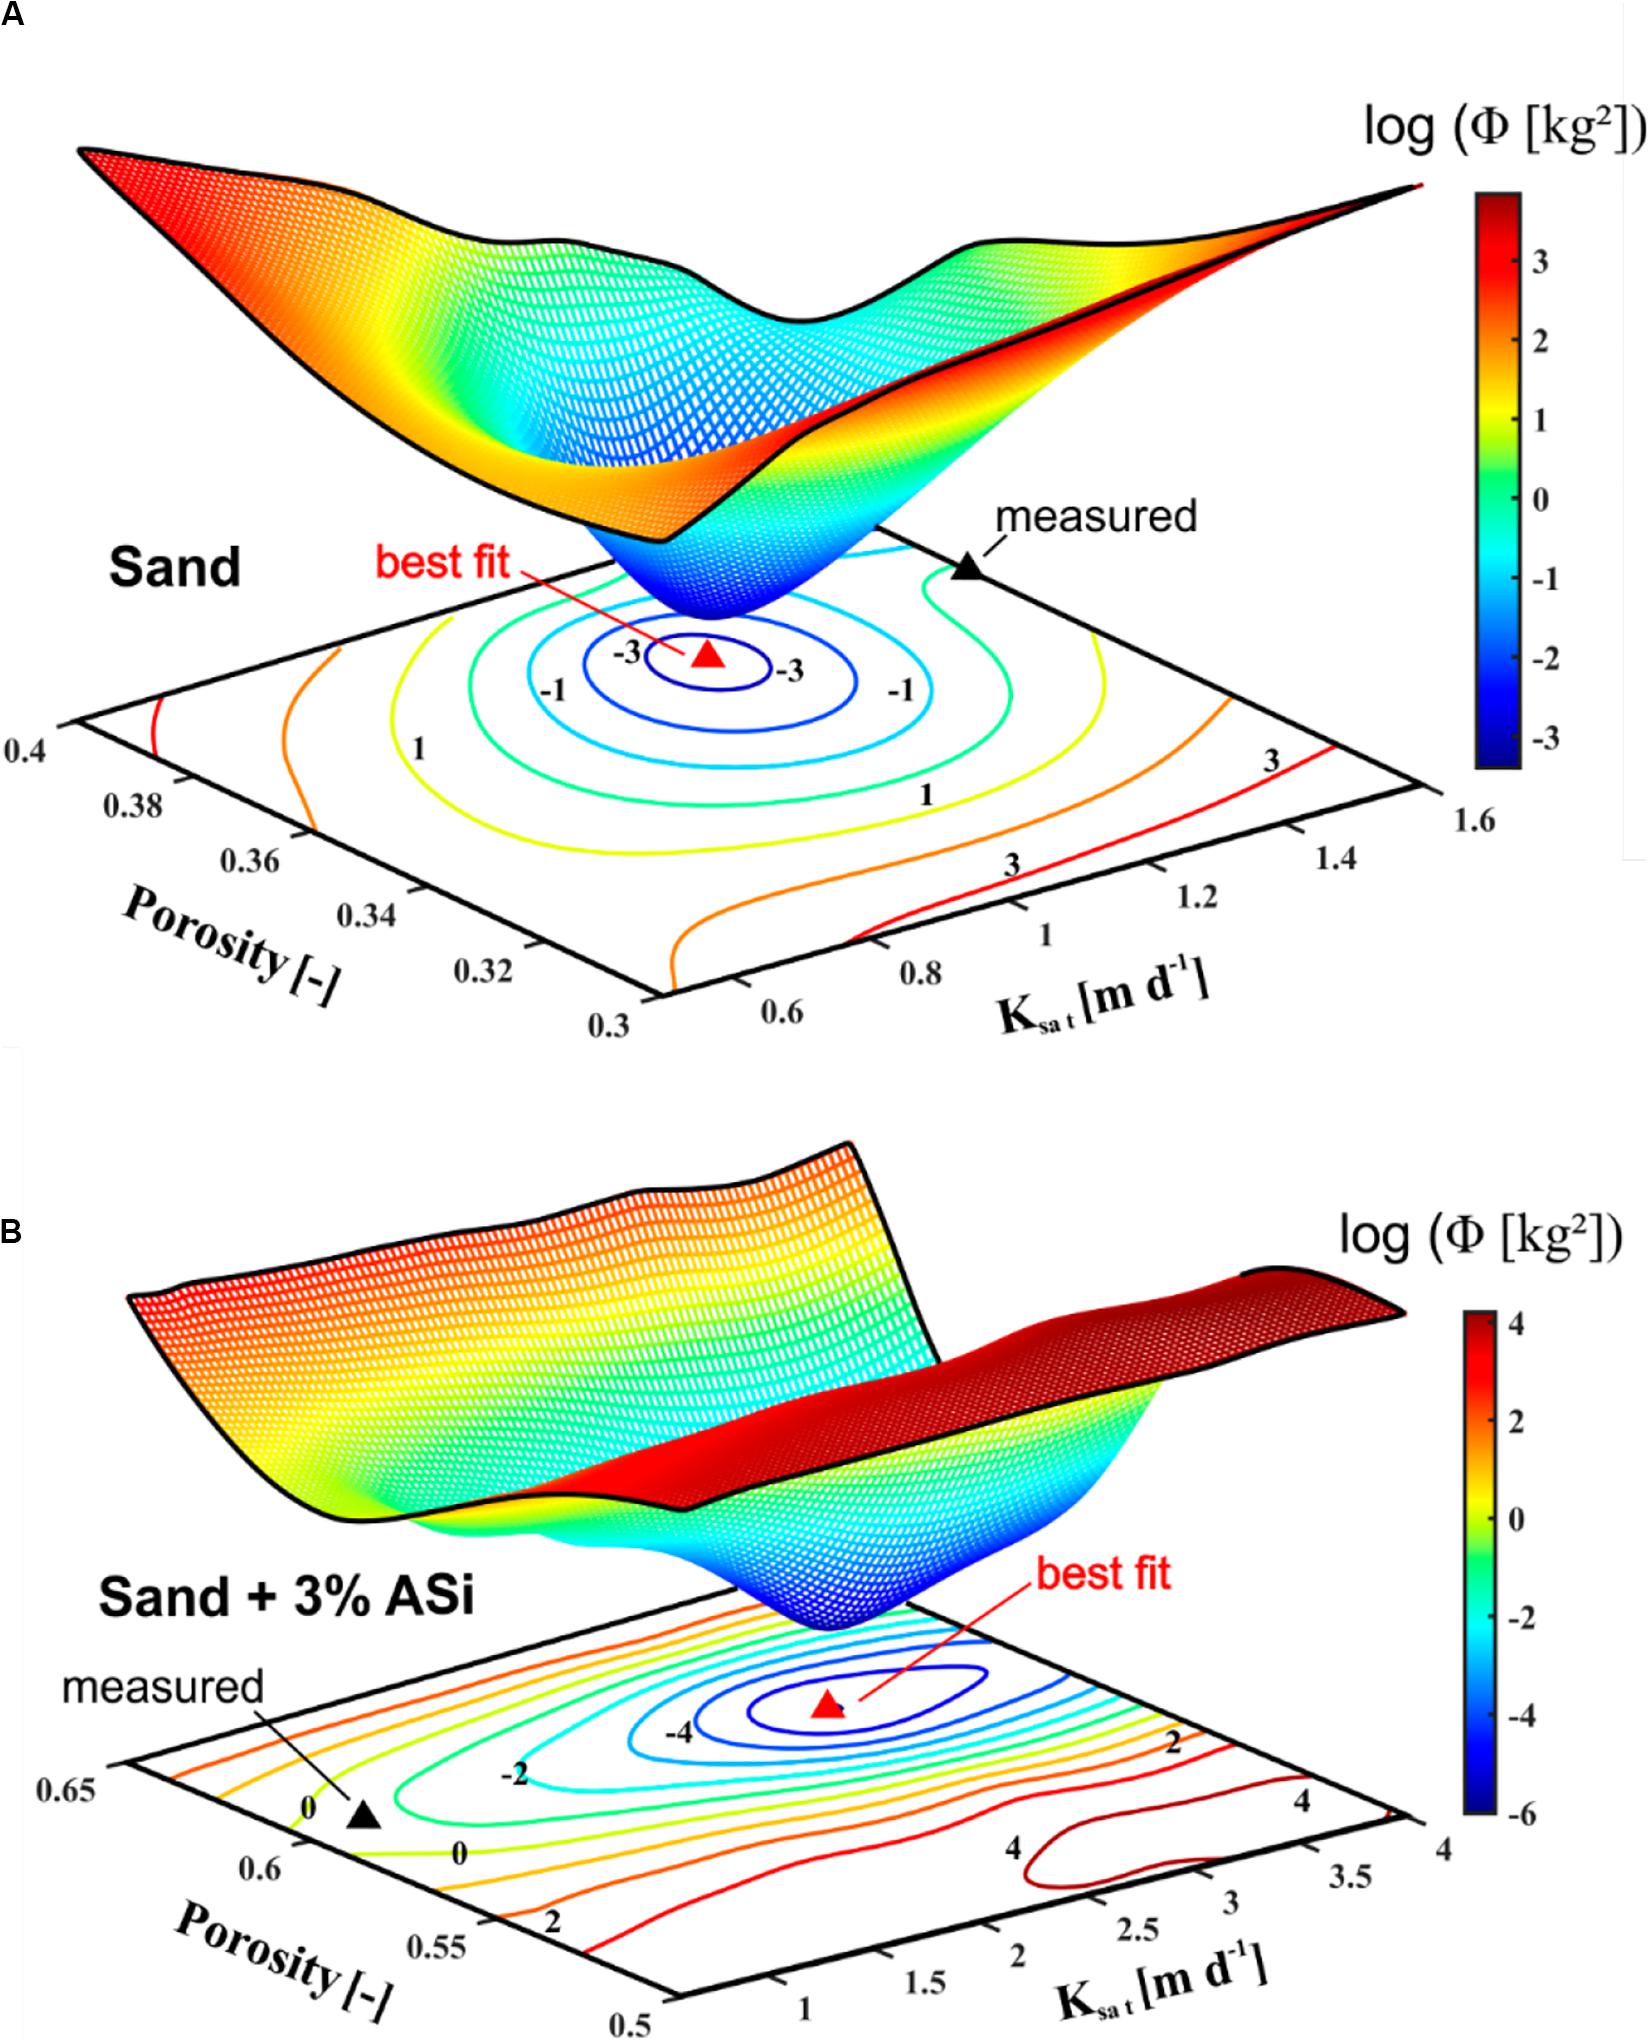
Figure 9. Objective function for the simulations representing the pure sand (A) and sand containing in 3% ASi (B) defined in the Ksat/porosity parameter space. Measured parameter sets are indicated by black triangles and best fit sets, minimizing the objective functions, by red triangles.
For the yearly scenarios using the measured and calibrated parameter sets, percolation (water that is leaving the model through the lower boundary) and rainfall rates are shown in Figure 10A. Maximum percolation rates for both parameter sets were simulated for the rainstorm event around day 250 and lowest rates for the extended drought period in-between day 100 and 130.
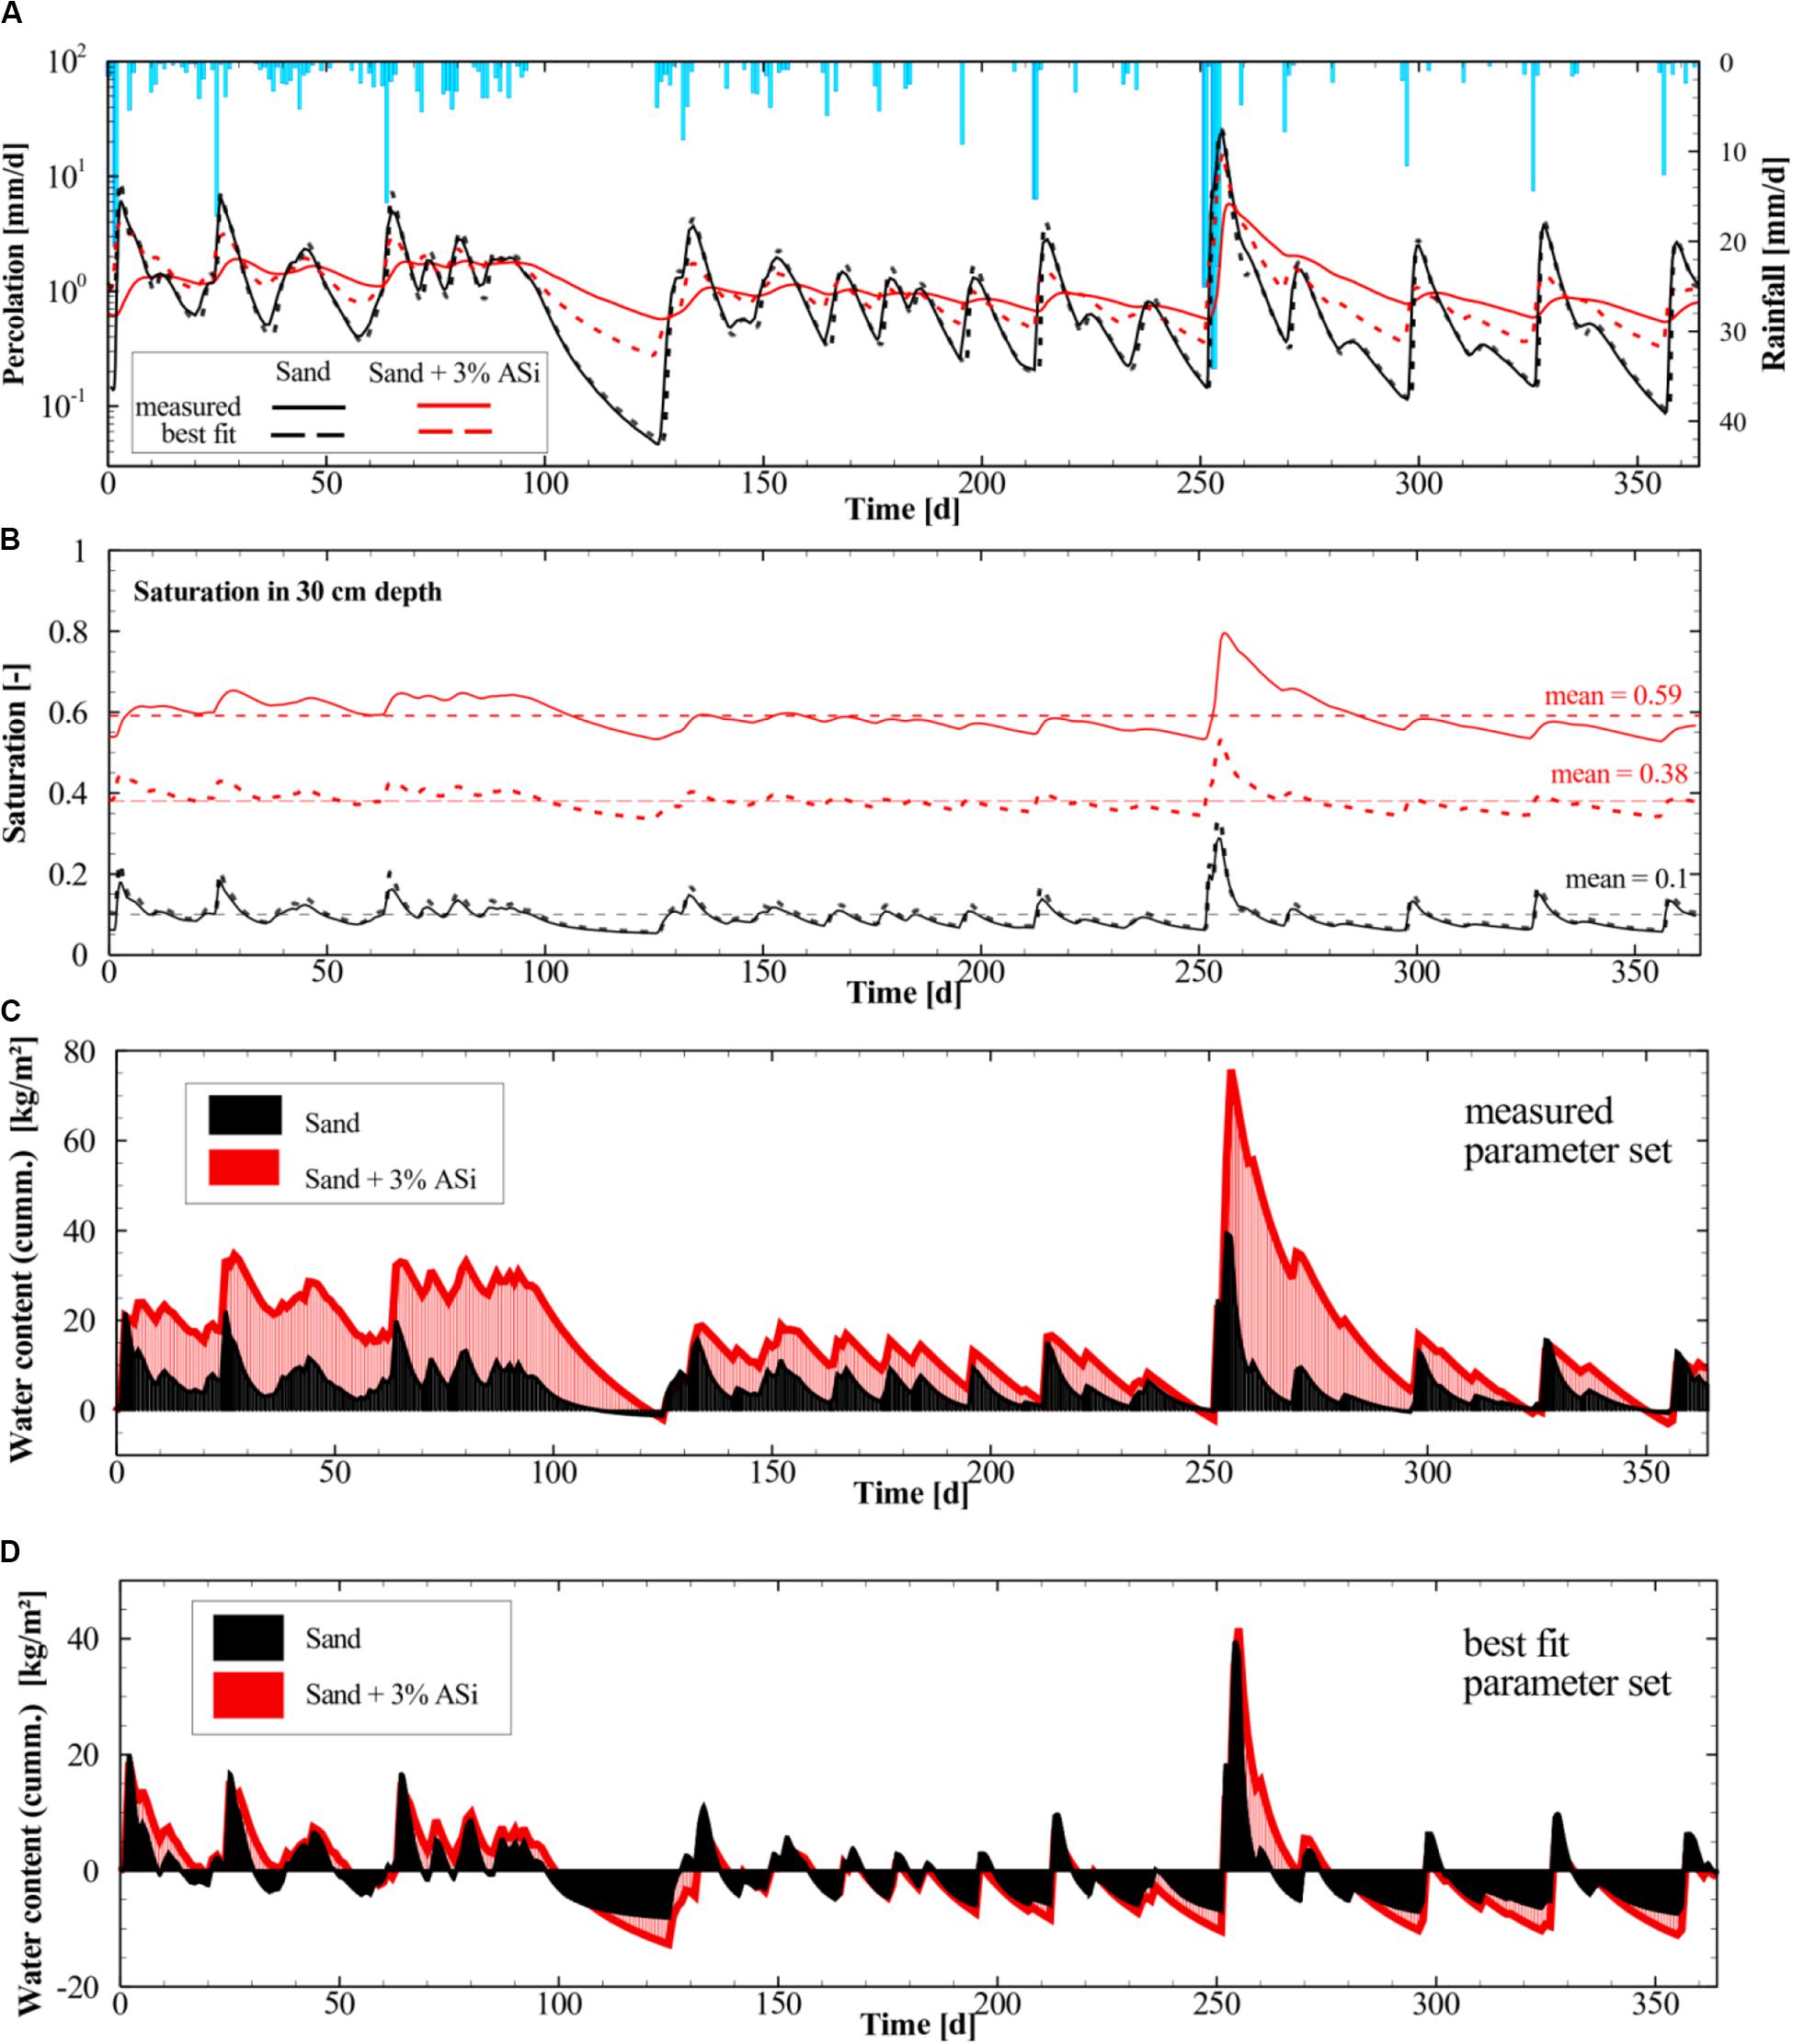
Figure 10. (A) Applied rainfall rates for the yearly simulation scenario (November 1st 2017 to October 31th 2018) and the modeled percolation rates for the pure sand and the sand with 3% ASi. (B) Simulated water saturation at 30 cm depth for the measured and best fit parameter set. (C) Simulated cumulative water uptake in kg per unit area for the sand and sand with 3% ASi for the measured parameter set listed in Table 1 (water uptake is relative to the initial water content; D) Simulated cumulative water uptake in kg per unit area for the sand and sand with 3% ASi for the best fit parameter set (water uptake is relative to the initial water content).
Simulations representing sand with 3% ASi (red solid and red dashed lines in Figure 10A) show higher percolation rates during dry conditions compared to the simulations for pure sand. Although, the effect was less distinct when the simulations were run using the calibrated parameter set compared to the measured ones (solid and dashed lines in Figure 10A). During rainfall events sand with 3% ASi is capable to store more water compared to the pure sand which can be seen for the measured parameter set (Figure 10C) and also to a lesser extend for the calibrated parameter set (Figure 10D). The effect of the ASi to store more water during rainfall events and simultaneously hold it for a longer periods of time during dry conditions result in a higher mean saturation (mean = 0.59 and 0.38, Figure 10B) throughout the year compared to the pure sand (mean = 0.1, Figure 10B). All simulations were assessed and tested for numerical accuracy in solving the transient water balance. Numerical errors were lowest for the measured parameter set (<1%) and slightly increased but still acceptable (<2%) for the calibrated parameters.
Although the effect of evapotranspiration was not explicitly considered in the HGS simulations, the simulations clearly indicated increased storage capacities of sand when mixed with ASi. This additional WSCs of sand containing ASi should have a positive effect on water availability for plants in the rooting zone of sandy soils which was indicated by the simulated higher mean annual saturation. A more realistic simulation scenario would require accounting for evapotranspiration using various vegetation types in the hydrological model. However, such simulations are beyond the scope of this study and probably will be performed in future once experimental data from field scale application of ASi is available.
The strong effect of ASi increasing the soil WSC and water availability for plants during drought periods may be used in future agriculture practices to mitigate plant stress due to water limitation and associated harvest losses. There may be a number of secondary effects of applying ASi that should be considered before widespread application, however. For example, an increase in WSC of soils may lead to lower groundwater recharge rates due to increased evapotranspiration, altering the water budget of stream systems connected to the regional aquifer. Also, the rapid increase in phosphorus mobility may lead to an excess of phosphate in the soil pore water. If plants uptake cannot quantitatively use this phosphate for growth there is the potential for increased phosphate levels in groundwater via leaching. There is, however, very little known about the potential side effects of ASi use, and they should be studied in the future at the plot scale. Despite these concerns, we feel that if done in a suitable manner the application of ASi can be considered a promising mitigating measure for increasing water and nutrient availability in agricultural systems. This may be particularly important in future as climate predictions are for increased extreme conditions, included more extreme, and longer duration of drought. It is expected that ASi will be especially effective in sandy soils where water storage capacities are low and interactions with organic carbon are less likely to compete with Si for sorption sites. Future work should look into more complex soil systems to understand interactions between soil solutions including organic matter and clay minerals, as this may be important for both the WSC and sorption of phosphate in non-sandy soils.
The raw data supporting the conclusions of this article will be made available by the authors, without undue reservation, to any qualified researcher.
JS, SF, and BG had the idea and designed the experiments. LR conducted the experiments and did the measurements. JS, SF, and BG wrote the manuscript. All authors discussed the results and commented on the manuscript.
This project was partly funded by the Bavarian Network for climate research bayklif (www.bayklif.de).
The authors declare that the research was conducted in the absence of any commercial or financial relationships that could be construed as a potential conflict of interest.
The Supplementary Material for this article can be found online at: https://www.frontiersin.org/articles/10.3389/fenvs.2020.00094/full#supplementary-material
Ahmed, A. A., Gypser, S., Leinweber, P., Freese, D., and Kühn, O. (2019). Infrared spectroscopic characterization of phosphate binding at the goethite–water interface. PCCP Phys. Chem. Chem. Phys. 21, 4421–4434. doi: 10.1039/c8cp07168c
Allen, C. D., Macalady, A. K., Chenchouni, H., Bachelet, D., McDowell, N., Vennetier, M., et al. (2010). A global overview of drought and heat-induced tree mortality reveals emerging climate change risks for. For orests. Ecol. Manag. 259, 660–684. doi: 10.1016/j.foreco.2009.09.001
Anjum, S. A., Xie, X.-Y., Wang, L.-C., Saleem, M. F., Man, C., and Lei, W. (2011). Morphological, physiological and biochemical responses of plants to drought stress. Afr. J. Agric. Res. 6, 2026–2032.
Appelo, C. A. J., and Postma, D. (2005). Geochemistry, Groundwater and Pollution. Geochemistry, Groundwater and Pollution. Leiden: A.A. Balkema Publishers.
Aquanty and Inc (2015). Hydrogeosphere. A Three-Dimensional Numerical Model Describing Fully-Integrated Subsurface and Surface Flow and Solute Transport. Waterloo, ON: Aquanty and Inc.
Beauchemin, S., Hesterberg, D., Chou, J., Beauchemin, M., Simard, R. R., and Sayers, D. E. (2003). Speciation of phosphorus in phosphorus-enriched agricultural soils using x-ray absorption near-edge structure spectroscopy and chemical fractionation. J. Environ. Qual. 32, 1809–1819. doi: 10.2134/jeq2003.1809
Berezniak, A., Ben-Gal, A., Mishael, Y., and Nachshon, U. (2018). Manipulation of soil texture to remove salts from a drip-irrigated root zone. Vadose Zone J. 17:170019. doi: 10.2136/vzj2017.01.0019
Brady, N. C., and Weil, R. R. (1999). The Nature and Properties of Soil, 12th Edn. Upper Saddle River, NJ: Prentice-Hall Inc.
Brady, N. C., and Weil, R. R. (2008). The Nature and Properties of Soils. Upper Saddle River, NJ: Prentice Hall.
Bünemann, E. K., Oberson, A., and Frossard, E. (2010). Phosphorus in Action: Biological Processes in Soil Phosphorus Cycling, Berlin: Springer Science & Business Media.
Carey, J. C., and Fulweiler, R. W. (2016). Human appropriation of biogenic silicon–the increasing role of agriculture. Funct. Ecol. 30, 1331–1339. doi: 10.1111/1365-2435.12544
Crews, T. E., Kitayama, K., Fownes, J. H., Riley, R. H., Herbert, D. A., Mueller-Dombois, D., et al. (1995). Changes in soil phosphorus fractions and ecosystem dynamics across a long chronosequence in Hawaii. Ecology 76, 1407–1424. doi: 10.2307/1938144
DeMaster, D. J. (1981). The supply and accumulation of silica in the marine environment. Geochim. Cosmochim. Acta 45, 1715–1732. doi: 10.1016/0016-7037(81)90006-5
Derry, L. A., Kurtz, A. C., Ziegler, K., and Chadwick, O. A. (2005). Biological control of terrestrial silica cycling and export fluxes to watersheds. Nature 433, 728–731. doi: 10.1038/nature03299
DIN-EN-13346 (2001). Bestimmung von Spurenelementen und phosphor, Extraktionsverfahren mit Königswasser. Berlin: Beuth.
DIN-EN-ISO-10305-1 (2008). Wasserbeschaffenheit – Bestimmung von Gelösten Anionen Mittels Flüssigkeits-Ionenchromatographie – teil 1: Bestimmung von Bromid, Chlorid, Fluorid, Nitrat, Nitrit, Phosphat und Sulfat (iso 10304-1:2007); Deutsche Fassung Pren iso 10304-1:2008. Berlin: Beuth.
Dol Hamid, R., Swedlund, P. J., Song, Y., and Miskelly, G. M. (2011). Ionic strength effects on silicic acid (h4sio4) sorption and oligomerization on an iron oxide surface: an interesting interplay between electrostatic and chemical forces. Langmuir 27, 12930–12937. doi: 10.1021/la201775c
Elgaroshi, S., Miskelly, G. M., and Swedlund, P. J. (2019). H4sio4 sorption and polymerization at the magnetite-aqueous interface: the influence of interfacial redox state. Appl. Geochem. 104, 146–157. doi: 10.1016/j.apgeochem.2019.03.010
Elser, J. J. (2012). Phosphorus: a limiting nutrient for humanity? Curr. Opin. Biotechnol. 23, 833–838. doi: 10.1016/j.copbio.2012.03.001
Elser, J. J., Bracken, M. E. S., Cleland, E. E., Gruner, D. S., Harpole, W. S., Hillebrand, H., et al. (2007). Global analysis of nitrogen and phosphorus limitation of primary producers in freshwater, marine and terrestrial ecosystems. Ecol. Lett. 10, 1135–1142. doi: 10.1111/j.1461-0248.2007.01113.x
Engelbrecht, B. M., Kursar, T. A., and Tyree, M. T. (2005). Drought effects on seedling survival in a tropical moist forest. Trees 19, 312–321. doi: 10.1007/s00468-004-0393-0
Fahad, S., Bajwa, A. A., Nazir, U., Anjum, S. A., Farooq, A., Zohaib, A., et al. (2017). Crop production under drought and heat stress: plant responses and management options. Front. Plant Sci. 8:1147. doi: 10.3389/fpls.2017.01147
Fischer, E. M., and Knutti, R. (2016). Observed heavy precipitation increase confirms theory and early models. Nat. Clim. Chang 6, 986–991. doi: 10.1038/nclimate3110
Fontes, J., Gonçalves, M., and Pereira, L. (2004). Andosols of terceira, azores: measurement and significance of soil hydraulic properties. Catena 56, 145–154. doi: 10.1016/j.catena.2003.10.008
Haynes, R. J. (2014). A contemporary overview of silicon availability in agricultural soils. J. Plant Nutr.’ Soil Sci. 177, 831–844. doi: 10.1002/jpln.201400202
Hiemstra, T., Barnett, M. O., and van Riemsdijk, W. H. (2007). Interaction of silicic acid with goethite. J. Colloid. Interface Sci. 310, 8–17. doi: 10.1016/j.jcis.2007.01.065
Hodnett, M., and Tomasella, J. (2002). Marked differences between van genuchten soil water-retention parameters for temperate and tropical soils: a new water-retention pedo-transfer functions developed for tropical soils. Geoderma 108, 155–180. doi: 10.1016/s0016-7061(02)00105-2
Hömberg, A., Obst, M., Knorr, K.-H., Kalbitz, K., and Schaller, J. (2020). Increased silicon concentration in fen peat leads to a release of iron and phosphate and changes in the composition of dissolved organic matter. Geoderma 374:114422. doi: 10.1016/j.geoderma.2020.114422
IPCC (2013). Climate Change 2013: The Physical Science Basis. Contribution of Working Group i to the Fifth Assessment Report of the Intergovernmental Panel on Climate Change, eds T. F. Stocker, D. Qin, and G.-K. Plattner (Cambridge, MA: Cambridge University Press).
Jahangir, M. M. R., Khalil, M. I., Johnston, P., Cardenas, L. M., Hatch, D. J., Butler, M., et al. (2012). Denitrification potential in subsoils: a mechanism to reduce nitrate leaching to groundwater. Agric. Ecosyst. Environ. 147, 13–23. doi: 10.1016/j.agee.2011.04.015
Kern, J. S. (1995). Geographic patterns of soil water-holding capacity in the contiguous united states. Soil Sci. Soc. Am. J. 59, 1126–1133. doi: 10.2136/sssaj1995.03615995005900040026x
Lehner, B., Döll, P., Alcamo, J., Henrichs, T., and Kaspar, F. (2006). Estimating the impact of global change on flood and drought risks in europe: a continental, integrated analysis. Clim. Change 75, 273–299. doi: 10.1007/s10584-006-6338-4
Lu, Y., Ma, D., Chen, X., and Zhang, J. (2018). A simple method for estimating field crop evapotranspiration from pot experiments. Water 10:1823. doi: 10.3390/w10121823
Mahe, G., Paturel, J.-E., Servat, E., Conway, D., and Dezetter, A. (2005). The impact of land use change on soil water holding capacity and river flow modelling in the nakambe river, burkina-faso. J. Hydrol. 300, 33–43. doi: 10.1016/j.jhydrol.2004.04.028
Mehlich, A. (1984). Mehlich-3 soil test extractant - a modification of mehlich-2 extractant. Commun. Soil Sci. Plant Anal. 15, 1409–1416. doi: 10.1080/00103628409367568
Michaelian, M., Hogg, E. H., Hall, R. J., and Arsenault, E. (2011). Massive mortality of aspen following severe drought along the southern edge of the canadian boreal forest. Glob. Change Biol. 17, 2084–2094. doi: 10.1111/j.1365-2486.2010.02357.x
Neu, S., Schaller, J., and Dudel, E. G. (2017). Silicon availability modifies nutrient use efficiency and content, c:N:P stoichiometry, and productivity of winter wheat (triticum aestivum l.). Sci. Rep. 7:40829.
Noritake, F., and Kawamura, K. (2015). The nature of si-o-si bonding via molecular orbital calculations. J. Comput. Chem. Japan 14, 124–130. doi: 10.2477/jccj.2015-0009
Pokrovski, G. S., Schott, J., Farges, F., and Hazemann, J.-L. (2003). Iron (iii)-silica interactions in aqueous solution: insights from x-ray absorption fine structure spectroscopy. Geochim. Cosmochim. Acta 67, 3559–3573. doi: 10.1016/s0016-7037(03)00160-1
Raats, P. A. C. (1981). “Residence times of water and solutes within and below the root zone,” in Developments in Agricultural Engineering, eds J. W. Holmes and T. Talsma (Amsterdam: Elsevier).
Rajan, S. (1975). Phosphate adsorption and the displacement of structural silicon in an allophane clay. Eur. J. Soil Sci. 26, 250–256. doi: 10.1111/j.1365-2389.1975.tb01949.x
Reithmaier, G. M. S., Knorr, K. H., Arnhold, S., Planer-Friedrich, B., and Schaller, J. (2017). Enhanced silicon availability leads to increased methane production, nutrient and toxicant mobility in peatlands. Sci. Rep. 7:8728.
Saccone, L., Conley, D. J., Koning, E., Sauer, D., Sommer, M., Kaczorek, D., et al. (2007). Assessing the extraction and quantification of amorphous silica in soils of forest and grassland ecosystems. Eur. J. Soil Sci. 58, 1446–1459. doi: 10.1111/j.1365-2389.2007.00949.x
Sauer, D., Saccone, L., Conley, D. J., Herrmann, L., and Sommer, M. (2006). Review of methodologies for extracting plant-available and amorphous si from soils and aquatic sediments. Biogeochemistry 80, 89–108. doi: 10.1007/s10533-005-5879-3
Saxton, K. E., and Rawls, W. J. (2006). Soil water characteristic estimates by texture and organic matter for hydrologic solutions Soil. Sci. Soc. Am. J. 70, 1569–1578. doi: 10.2136/sssaj2005.0117
Schaller, J., Cramer, A., Carminati, A., and Zarebanadkouki, M. (2020). Biogenic amorphous silica as main driver for plant available water in soils. Sci. Rep. 10:2424.
Schaller, J., Fauchere, S., Joss, H., Obst, M., Goeckede, M., Planer-Friedrich, B., et al. (2019). Silicon increases the phosphorus availability of arctic soils. Sci. Rep. 9, 449.
Struyf, E., and Conley, D. J. (2009). Silica: an essential nutrient in wetland biogeochemistry. Front. Ecol. Environ. 7:88–94. doi: 10.1890/070126
Struyf, E., Smis, A., Van Damme, S., Garnier, J., Govers, G., Van Wesemael, B., et al. (2010). Historical land use change has lowered terrestrial silica mobilization. Nat. Commun. 1:129.
Suleiman, A., and Ritchie, J. (2001). Estimating saturated hydraulic conductivity from soil porosity. Trans. ASAE 44:235.
Swedlund, P. J., Miskelly, G. M., and McQuillan, A. J. (2010). Silicic acid adsorption and oligomerization at the ferrihydrite- water interface: interpretation of atr-ir spectra based on a model surface structure. Langmuir 26, 3394–3401. doi: 10.1021/la903160q
Taylor (1995). Interactions of Silica With Iron Oxides: Effects on Oxide Transformations and Sorption Properties. Chalk River: Atomic Energy of Canada Ltd.
Tyler, D., and Thomas, G. W. (1977). Lysimeter measurements of nitrate and chloride losses from soil under conventional iand no-tillage corn. J. Environ. Q. 6, 63–66. doi: 10.2134/jeq1977.00472425000600010014x
Urumović, K., and Urumović Sr, K. (2014). The effective porosity and grain size relations in permeability functions. Hydrol. Earth Syst. Sci. Discuss. 11, 6675–6714. doi: 10.5194/hessd-11-6675-2014
Vandevenne, F., Struyf, E., Clymans, W., and Meire, P. (2012). Agricultural silica harvest: have humans created a new loop in the global silica cycle? Front. Ecol. Environ. 10:243–248. doi: 10.1890/110046
Weiler, M., and McDonnell, J. (2004). Virtual experiments: a new approach for improving process conceptualization in hillslope hydrology. J. Hydrol. 285, 3–18. doi: 10.1016/s0022-1694(03)00271-3
Zachara, J. M., Girvin, D. C., Schmidt, R. L., and Resch, C. T. (1987). Chromate adsorption on amorphous iron oxyhydroxide in the presence of major groundwater ions. Environ. Sci. Technol. 21, 589–594. doi: 10.1021/es00160a010
Keywords: amorphous silica, field capacity, nitrate, sulfate, water storage capacity
Citation: Schaller J, Frei S, Rohn L and Gilfedder BS (2020) Amorphous Silica Controls Water Storage Capacity and Phosphorus Mobility in Soils. Front. Environ. Sci. 8:94. doi: 10.3389/fenvs.2020.00094
Received: 30 March 2020; Accepted: 08 June 2020;
Published: 03 July 2020.
Edited by:
Jiang Helong, Nanjing Institute of Geography and Limnology (CAS), ChinaReviewed by:
Mahmud Hossain, Bangladesh Agricultural University, BangladeshCopyright © 2020 Schaller, Frei, Rohn and Gilfedder. This is an open-access article distributed under the terms of the Creative Commons Attribution License (CC BY). The use, distribution or reproduction in other forums is permitted, provided the original author(s) and the copyright owner(s) are credited and that the original publication in this journal is cited, in accordance with accepted academic practice. No use, distribution or reproduction is permitted which does not comply with these terms.
*Correspondence: Jörg Schaller, U2NoYWxsZXJAemFsZi5kZQ==; Sm9lcmcuU2NoYWxsZXJAemFsZi5kZQ==
Disclaimer: All claims expressed in this article are solely those of the authors and do not necessarily represent those of their affiliated organizations, or those of the publisher, the editors and the reviewers. Any product that may be evaluated in this article or claim that may be made by its manufacturer is not guaranteed or endorsed by the publisher.
Research integrity at Frontiers

Learn more about the work of our research integrity team to safeguard the quality of each article we publish.