- 1Institute for Hydrobiology and Aquatic Ecosystem Management, University for Natural Resources and Life Sciences, Vienna, Austria
- 2Institute of Geomatics, University for Natural Resources and Life Sciences, Vienna, Austria
- 3Department of Biological Sciences, Egerton University, Nakuru, Kenya
- 4Wassercluster Lunz, Lunz am See, Austria
- 5Institute for Sustainable Economic Development, University for Natural Resources and Life Sciences, Vienna, Austria
In East Africa, wetlands are steadily converted to agriculture for food security reasons. This study analyzed high spatial resolution panchromatic and color photographs in the Anyiko wetland in Kenya to reveal wetland conversions between 1966 and 2018. In addition, socio-economic determinants of land use/cover change are assessed in the Anyiko wetland. Socio-economic data was collected through a questionnaire survey of 226 households. A Chi-squared Automatic Interaction Detector (CHAID) decision tree approach is utilized to assess determinants of wetlands conversion. The results showed that between 1966 and 2018, the wetland area reduced by 55%, mostly attributed to agricultural development. Households were more likely to cultivate the wetland if they did not harvest papyrus for artisanal products, were male-headed and lacked alternative sources of income. The perceptions that wetland is “wasteland” and conversion to agriculture provides higher net monetary benefit did not influence wetland cultivation. Hence, the conversion of the wetland was determined by the socio-economic status of the households rather than perceptions on its value.
Introduction
Wetlands provide a wide range of ecosystem services (ESS) including provisioning (e.g., food, fresh water, biochemicals, genetic materials, fiber, and fuel), regulating (e.g., climate regulation, water purification and waste treatment, erosion and flood control), supporting (e.g., primary production, nutrient cycling, and soil formation), and cultural services (e.g., recreation, aesthetics, education, spiritual, and religious values) (MEA, 2005; Russi et al., 2013). These ESS are not only important in supporting livelihoods, but also human well-being (MEA, 2003, 2005). The significance of the ESS, however, vary between temperate and tropical regions (Rebelo et al., 2013). In tropical regions, wetlands mainly serve for provisioning ESS, spiritual and biodiversity purposes, and for biodiversity, recreational and educational purposes in temperate regions. Despite the importance of these ESS to many people, wetlands continue to be degraded and have been identified as one of the most threatened ecosystems globally (MEA, 2005). This is majorly attributed to drainage and conversion to agricultural land and increased withdrawal of water due to economic development and food demand (MEA, 2005). For instance, it is estimated that more than 50% of specific types of wetlands (i.e., coastal and inland marshes, peatlands, and emergent estuarine) in parts of North America, Europe, Australia, and New Zealand were converted to agriculture during the twentieth century while elsewhere, many estimates are speculative as reliable data is missing (Finlayson et al., 2005; MEA, 2005; Rebelo et al., 2009).
In sub-Saharan Africa, the use of wetlands for agricultural production is increasingly considered as a potential solution to food security challenges in the region (UNEP, 2008; Rebelo et al., 2010). According to Sakané et al. (2011), wetlands are characterized by nutrient rich-soils with high moisture contents, enabling smallholder farmers to produce crops all year round. Over the last decades, this potential has been progressively exploited by smallholder farmers as demand for food rises due to economic and demographic growth, climate change and decline in agricultural productivity of terrestrial landscape (Dixon and Wood, 2003). In East Africa, wetlands provide 10–40% of the annual food needs of the rural population (Schuyt, 2005). During periods of food shortage, wetlands can be the exclusive source of food for communities living around them (Rebelo et al., 2010). However, many wetlands in sub-Saharan Africa are increasingly being degraded and lost due to agricultural expansion by drainage and conversion (Dixon, 2002; Schuyt, 2005; Owino and Ryan, 2007; Rebelo et al., 2010; Adekola et al., 2012; Saunders et al., 2012). For instance, in Uganda, NEMA (2010) estimates that between 1999 and 2008, agricultural expansion in wetland areas averaged 410 ha/year. In Kenya, Owino and Ryan (2007) report 50% area loss in some papyrus wetlands over the period 1969–2000. Though these conversions of wetlands to cropland may enhance food provisioning ecosystem service in short term, regulating ESS may decline in the long term (Foley et al., 2005; Van Dam et al., 2013).
Inadequate understanding of wetland values to stakeholders due to lack of readily available data and information has been recognized as a major reason why wetlands conversions to other land uses take place (Schuyt, 2005; Mmopelwa, 2006). Traditionally, wetlands are perceived as “wastelands” and hence “such apparent waste can only be put to good use, if they are reclaimed for agriculture or human settlement” (Maltby, 2013, p. 9). When not considered as “wastelands,” wetlands are commonly perceived to have minimal value in comparison to other uses of their land that may produce more tangible, immediate and higher monetary benefits (Schuyt, 2005). Jogo and Hassan (2010), however, argue that although there is increased awareness on the values of wetlands, degradation and land use change continue to occur. This is evident in several case studies in East Africa such as Nakivubo wetland in Uganda (Emerton et al., 1999; Kansiime and Nalubega, 1999; Isunju and Kemp, 2016), Nyando and Yala wetlands in Kenya (Schuijt, 2002; Kipkemboi et al., 2007; Onywere et al., 2011; Khisa et al., 2013; Oduor et al., 2015). The conversion to agriculture is not only initiated by the local people, but also by governmental programmes (Swallow et al., 2007; Nabahungu and Visser, 2011). Hence, not only the perceptions of smallholders about wetlands and their monetary benefits in comparison to conversion to agriculture are important, but also other socio-economic determinants contributing to their conversion.
Studies explicitly quantifying spatio-temporal extents of wetlands encroachment by human activities in sub-Saharan Africa are limited (Mwita et al., 2013; Isunju and Kemp, 2016). Understanding the linkages between wetlands conversion to agriculture and socio-economic determinants including households' perceptions on their values is important. Therefore, this study analyzed socio-economic determinants of land use/cover change in wetlands at household level using the Anyiko wetland in Kenya as a case study. The objectives of this study were to: (1) determine spatio-temporal change of agriculture in the wetland, and (2) analyze socio-economic determinants of wetland utilization for agriculture. The land use/cover change in the wetland was analyzed by visual interpretation of high spatial resolution panchromatic and color photographs for 1966 and 2018, respectively. A household survey was conducted to gather information on household characteristics, wetland utilization status and perceptions on the ecosystem's value. A Chi-squared Automatic Interaction Detector (CHAID) decision tree analysis was performed to statistically examine the determinants influencing conversion of Anyiko wetland to agriculture.
The next section of the article describes the study site, land use/cover data and processing, household data collection, and the methods used for analyzing land use/cover change in the wetland and socio-economic characteristics influencing wetland use and households' perceptions. This is followed by results which are discussed, and conclusions drawn in the last section.
Materials and Methods
Description of the Anyiko Wetland
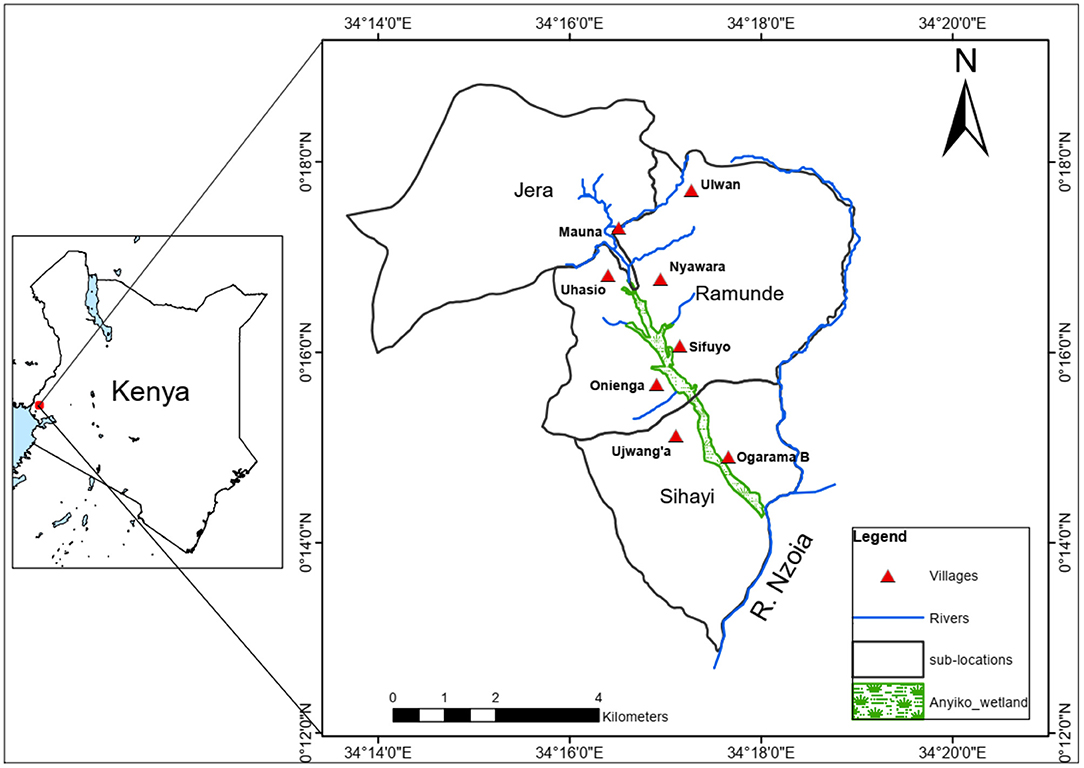
The Anyiko wetland is a permanent papyrus (Cyperus papyrus) dominated inland wetland in Ramunde and Sihayi sub-locations (administrative regions) of Siaya county in Kenya (Figure 1). The wetland covers an area of ~1 km2 and is situated within longitudes 34°16′30″E and 34°18′0″E and latitudes 0°16′0″N and 0°14′30″N in Nzoia River basin, which is the largest (12,696 km2) sub-basin of Lake Victoria in Kenya (MEMR, 2012). The wetland lies at an altitude between 1,050 and 1,300 m above sea level. It is fed by streams and springs and drains into the Nzoia River. Before drainage and conversion to agriculture, the wetland extended up to Jera sub-location.
The former and current wetland areas are surrounded by 18 villages consisting of 760 homesteads. The current (2017/18) number of households in the homesteads and population of people in the villages are not documented. The villages bordering the wetland downstream use the ecosystem mainly for rice irrigation and production, and papyrus mats production, while those upstream, obtain papyrus fiber, papyrus mats, and engage in vegetables, yams, and maize production. These provisioning ESS derived from the former and current wetland areas are used for subsistence and commercial purposes.
Anyiko wetland experiences a bimodal rainfall pattern with long rains in March-May and short rains in September-November. The average annual rainfall in the area is 1,556 mm and ranges from 813 to 2,417 mm annually with a minimum monthly rainfall of 40 mm and maximum of 231 mm (data based on Uholo weather station for the last 10 years (2007–2017). Generally, the average temperature in the area is 22°C with a maximum temperature of 30°C and minimum of 15°C (Climate-Data.org, n.d.).
Land Use/Cover Change in Anyiko Wetland
Data Acquisition, Processing and Analysis
Land use/cover change analysis is commonly achieved using satellite imagery such as the U.S. Geological Survey (USGS) Landsat satellite image data. However, due to the relatively low spatial resolution (60 m ground sampling distance for Landsat-2 and 30 m for Landsat-8) coupled with papyrus harvesting and dry season burning in the wetland, it was difficult to differentiate between the natural vegetation and crops farmed in the wetland. This implied that using the traditional pixel-based algorithms for automatic image classification and Landsat-like observations may lead to misclassification problems. High spatial resolution panchromatic photographs and color satellite image data for 1966 and 2016/18, respectively, were therefore used to quantify the spatiotemporal patterns of agricultural expansion in the Anyiko wetland.
A cloud-free panchromatic photograph of the wetland and its surrounding taken on 17th November 1966 was acquired from CORONA KH-4A declassified data. CORONA is the code name for a classified military satellite system launched successfully in space from the 1960s for reconnaissance and production of maps for U.S. intelligence agencies [USGS (n.d.)]. CORONA and other military satellite systems, such as ARGON and LANYARD data collected on Earth's surface between 1960 and 1972 were declassified by Executive Order 12,951 in 1995. This was because the images were no longer crucial to the U.S. national security and were likely of historical importance to global change study. The satellite photograph “DS1037-2138DA010” used in this study was published on 1st January 1995 by USGS Earth Resources Observation and Science (EROS) Center. The image frame, film type and ground resolution were 10, 70 mm Panoramic and 3 m, respectively.
The 1966 CORONA photograph was obtained as a digital image file and geo-referenced to the Google Earth data using a series of ground control points with a 1st order polynomial transformation. Using visual interpretation of the landscape in which the wetland was situated, the borders of the wetland and its surrounding were manually digitized from the 1966 image data. Polygons of different land use/cover occurring continuous in an area ≥1 acre (minimum mapping unit) were labeled into four land use/cover categories: wetland, wetland/close shrubland, open shrubland, and close shrubland. Characteristics used in the interpretation of the landscape included: pattern, size, texture, tone/color, association, and shape.
An image composite available in Google Earth at 0.5 m spatial resolution was used for 2018. The image data were taken on 13th June 2016 and 28th December 2018. The 1966 land use/cover vector map was overlaid on the 2016/18 image to update individual polygons through visual image interpretation. For the 2016/18 period, the land use/cover types were categorized into: wetland, farmland, close shrubland and open shrubland.
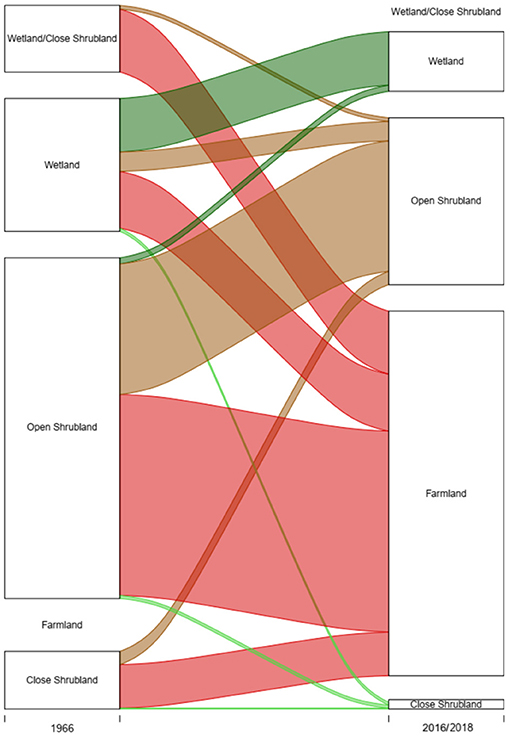
To estimate area covered by each land use/cover type for 1966 and 2016/18 periods, all polygons belonging to the same land use/cover category were selected using a spatial query function implemented in ArcGIS (ESRI). The total area (in acres) for the selected polygons were determined for each year. This was repeated for polygons belonging to other land use/cover types for both years. Land use/cover changes between 1966 and 2016/18 were calculated. Interclass conversions were calculated for 1966 and 2016/18 to quantify wetland extent loss or gain to farmland and other land use/cover types. Alluvial diagram showing changes from one land use/cover to another between 1966 and 2016/18 was created using the R package (https://cran.rproject.org/web/packages/alluvial/vignettes/alluvial.html). For other land use/cover types, which encroached the wetland by 2016/18, 1966 and 2016/18 layers were intersected to create a third layer to identify changes.
Wetland Socio-Economic Survey
Data on wetland utilization and households' perceptions on the ecosystem was collected between July and December 2017 by conducting a household survey. A questionnaire consisting of 23 questions were structured into four sections: (1) socio-economic characteristics of the respondent and household, (2) household's wetland utilization for provisioning ESS and the year it started, (3) household's perceptions on the wetland and their monetary benefits in comparison to conversion to agriculture, and (4) household sources of income and annual amount for 2017. The socio-economic characteristics were household size, age of the respondent, level of formal education of the respondent, marital status, gender of the respondent, and the village in which the household is situated. Section two of the questionnaire constituted a list of provisioning ESS derived from wetlands within Lake Victoria basin as indicated in literature and field observation. In the section, the respondents indicated whether their households were deriving the listed provisioning ESS from the wetland and the year they started using the wetland for the ESS. Households' perceptions on the wetland i.e., Anyiko wetland is a “wasteland” and conversion of the wetland to agriculture has a higher net monetary value than when used for papyrus artisanal products e.g., mat production among other provisioning ESS, were assessed using Likert scale (1 = Agree, 2 = Do not know, 3 = Disagree). Whether there was restriction on wetland utilization was also assessed using Likert scale (1 = Agree, 2 = Do not know, 3 = Disagree). Lastly, annual income from households in 2017 was assessed by asking questions on: whether any household member was formally employed, number of months worked and monthly income and whether any household member had other sources of income apart from formal employment such as from informal employment, business, upland crops sale, building rental, land rental, and remittances among others and their monthly or yearly income. As many rural households in Africa do not keep records, we focused on the current year (2017) of income sources and amount.
The questionnaire was pre-tested and afterwards administered face to face to 226 households out of a total of 489 households (339 homesteads) (Kothari, 2004) in eight randomly selected villages: Ujwang'a, Mauna, Ogarama B, Ulwan, Nyawara, Uhasio, Sifuyo, and Onieng'a (Figure 1). Village profiles were carried out using focus group discussion with the village heads. The selection ensured that the former and current wetland areas were covered. The respondents targeted with the questionnaire were household heads and in cases where they were not present at time of the interview, they were interviewed later in the day or the following day. The household survey was conducted with the support of respective village heads of the selected villages to ease access to households and prevent conducting the survey beyond the selected villages' boundaries.
In this study, wetlands were assumed to provide alternative sources of income. This was based on the argument that Anyiko wetland is a relatively small wetland (~1 km2) and hence, it is impossible to be the main source of income for the neighboring 18 villages and 760 homesteads. From the field observations we know that the local community is involved in small scale business, brick production among other income generating activities. Increasing dependence of local communities on wetlands provisioning ESS both for income generation and subsistence purpose has been reported in larger wetlands such as Nyando wetland in Kenya, which is ~42 km2 in size (Kipkemboi et al., 2007; Obiero et al., 2012; Khisa et al., 2013). Hence, income from the ecosystem itself were not included. For instance, income from the sale of crops grown in former wetland areas, papyrus mats and fiber. The income was reported in Kenya shillings (KES) and converted to US dollars ($) based on 2017 average exchange rate of 100 KES = 1$.
Data Analysis
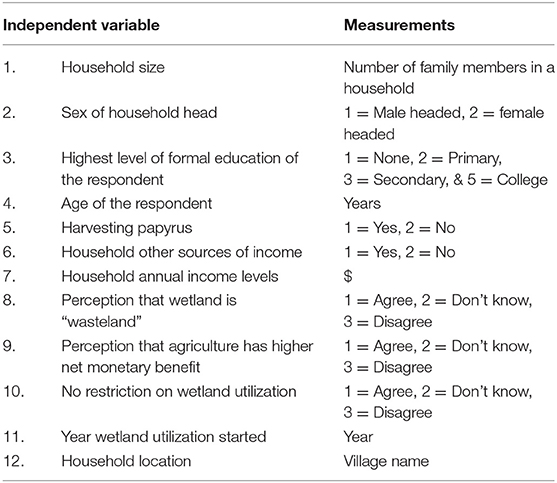
Questionnaire responses were coded and analyzed using IBM SPSS statistics 21 (USA). Using a CHAID decision tree model, 12 predictor independent variables were tested against the dependent variable of wetland cultivation status of the households (Table 1, see Supplementary Material on why the variables were selected). Both, decision tree and binary logistic regression are commonly used as predictive models. The decision tree model was chosen in this study, because some statistical requirements of a binary logistic regression were not met e.g., no multicollinearity (see Supplementary Material for the results). These requirements are not relevant for a decision tree model. CHAID decision tree is a non-parametric procedure and therefore, make no assumptions of the underlying data. Unlike logistic regression, the CHAID algorithm explicitly express patterns among variables in a graphical and easily understandable form using the “if-then” logic (Au et al., 2003). The method can also identify the most important predictor of the dependent variable (Milanović and Stamenković, 2016). Therefore, the CHAID decision tree model is suitable for identifying stepwise pathways to wetland conversion to agriculture that would otherwise go unnoticed when logistic regression is employed. Decision trees have been applied widely in fields such as customer churn (Hadden et al., 2007) and medical diagnosis (Rodríguez et al., 2016). Studies on determinants of wetland utilization for provisioning ESS particularly in sub-Saharan Africa have commonly applied logistic regression (Mwakubo and Obare, 2009; Taruvinga and Mushunje, 2010; Turyahabwe et al., 2013), probit model (Oladele and Wakatsuki (2008), and multiple linear regression (Kipkemboi et al., 2007).
In this study, Pearson's chi-squared test (χ2) was used to examine the relationships between the model variables in the terminal nodes. The CHAID analysis was run with parent and child nodes defined at 10 and 8, respectively, and significance set at (αmerge, αsplit, and P-value) ≤ 0.05. Descriptive statistics of the model variables was used to capture mean and percentages of wetland and non-wetland cultivating households. Pearson's chi-squared test was also conducted to assess the linkages between perceptions and the actual use of the wetland, categorized as: agriculture, wetland provisioning ESS, both agriculture and wetland provisioning ESS, and none.
CHAID Decision Tree
A CHAID decision tree is a symbolic learning technique that organizes information extracted from a training dataset in a hierarchical structure composed of nodes and ramifications (Quinlan, 1986). The nodes represent data groups and ramifications are the results of the tests. The CHAID procedure starts by finding independent variables that have a significant association with the dependent variable (Thomas and Galambos, 2004). The algorithm then determines how the independent variables, continuous and/or categorical, best combine to predict a binary outcome based on the “if then” rules. Each independent variable is recursively partitioned into homogenous groups along the path from the root node (dependent variable and entire data set) to the terminal node (the last node without output branch) (Milanović and Stamenković, 2016). The partitioning is based on a series of merging, splitting, and stopping steps based on user-specified criteria. The independent variable having the strongest association (highest CHI-squared value and lowest p-value) with the dependent variable becomes the first segment or branch in a tree. The partitioning continues until no more significant dependence relationships can be found between the dependent variable and the set of predictors.
In the merging step, using each independent variable, the CHAID merges non-significant categories as follows:
1. Perform cross-tabulation of the independent variable with the binary dependent variable.
2. If the independent variable has two categories, go to step six.
3. χ2-test is performed for each pair of categories of the independent variable in relation to the binary dependent variable using the χ2 distribution with significance (αmerge) set at 0.05. For non-significant outputs, the paired categories are merged.
4. For non-significant tests identified by αmerge > 0.05, the paired categories are merged into a single category. For tests reaching significance identified by αmerge ≤ 0.05, the pairs are not merged.
5. If any category has less than the user-specified minimum segment size, that pair is merged with the most similar other category.
6. The adjusted P-value for the merged categories using a Bonferroni adjustment is utilized to control for Type I error rate.
The splitting step occurs after determination of all possible merges for each independent variable. This step selects which independent variable is to be used to “best” split the node using the algorithm.
1. χ2-test for independence using an adjusted P-value for each independent variable.
2. The independent variable with the smallest adjusted P-value is split if the P-value less than the user-specified significance split level (αsplit) is set at 0.05; otherwise the node is not split and is then considered a terminal node.
The stopping step is conducted to assess the tree growing process using the following user-specified stopping rules.
3. If the tree reached the maximum depth as specified by the user, the tree process stops.
4. If the size of a node is less than the user-specified minimum node size, the node will be not split.
5. If the split of a node results in a child node whose node size is less than the user-specified minimum child node size value, the node will not be split.
6. The CHAID algorithm continues until all the stopping rules are met.
Results
Land Use/Cover Change in Anyiko Wetland and Its Surrounding
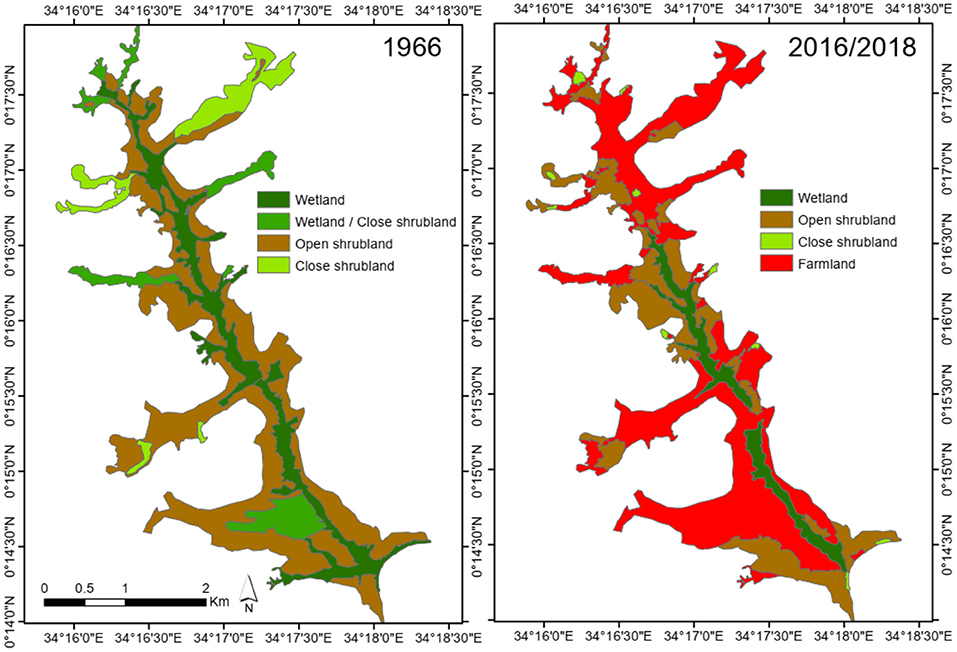
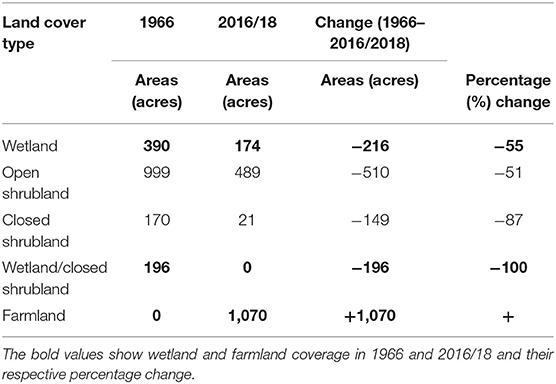
Comparing the 1966 to 2016/18 images of the wetland and its surrounding, conversion of the wetland, wetland/close shrubland, and open shrubland to farmland was clearly visible (Figures 2A,B). The land use/cover types as visually interpreted for 1966 and 2016/18 images are shown in Figure 2. In 1966, there was no visible agriculture in the wetland and its surrounding (Figure 3). The wetland was extensive but by 2016/18, there was a reduction in size. In addition, the wetland was fragmented into two parts due to conversion to farmland. By 2016/18, farmland occupied an area of 1,070 acres. The Anyiko wetland land cover type reduced by 55%, open shrubland by 51%, closed shrubland by 87%, while wetland/closed shrubland was totally lost (100%) (Table 2).
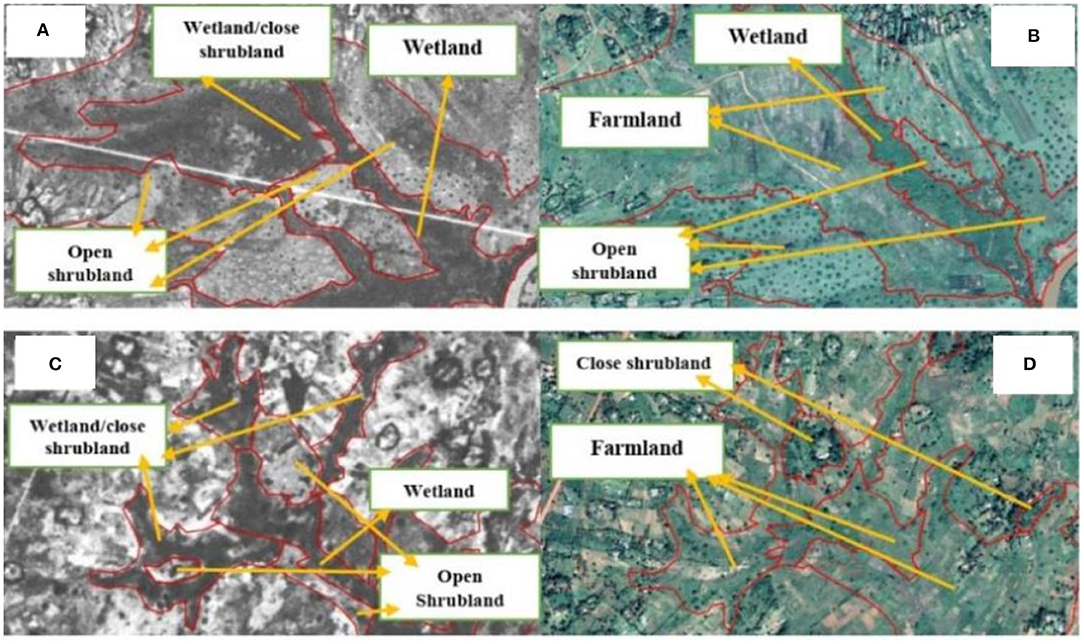
Figure 2. Land use/cover types of the wetland and its surrounding as visually interpreted for CORONA (A,C) for 1966 image and Google Earth true color image data (B,D) for 2016/18.
To quantify wetland extent loss or gain to farmlands and other land use/cover types, interclass changes were calculated for 1966 and 2016/18. By 2016/18, about 40% of the original 1966 wetland vegetation was still intact while the largest portion (43%) was converted to farmland, to open shrubland (15%), and to close shrubland (2%) (Table 3). Only 2% (18 acres) of open shrubland became wetland based on 2016/18 images. Wetland/close shrubland was converted to farmland (95%) and open shrubland (5%). The wetland and other land use/cover types were majorly converted to farmland over time (Figure 4).
Socio-Economic Determinants Influencing Wetland Utilization for Agriculture
Socio-Economic Characteristics of the Respondents and Households
Among the respondents, 58% were females and 42% males. Age distribution of the respondents ranged from 21 to 90 years with an average of 50 years. The marital status of the respondents comprised of 71, 28, and 1% for married, widowed and single, respectively. Most of the respondents had attained primary school education (57%), while those with no formal, secondary, and college education levels were 27, 14, and 2%, respectively. Each household had an average of 5 people with a minimum of 1 person and maximum of 12 people. Among the households, 86% (194 households) were deriving provisioning ESS such as crops, water for irrigation, aquaculture and livestock, papyrus mats and fiber, palm baskets and hats and pasture from the wetland. The remaining households (32 households) had never derived any provisioning ESS from the wetland. Average annual household income for the year 2017 from non-wetland activities was about $ 404 and ranged between $ 0 and $ 9,000. Additional information on the households are in Supplementary Material.
Comparing socio-economic characteristics between wetland cultivating and non-cultivating households, the results show that most households cultivating in the former wetland areas were male-headed (80%), did not have alternative sources of income (59%) and were not harvesting papyrus for artisanal products (87%) (Table 4).
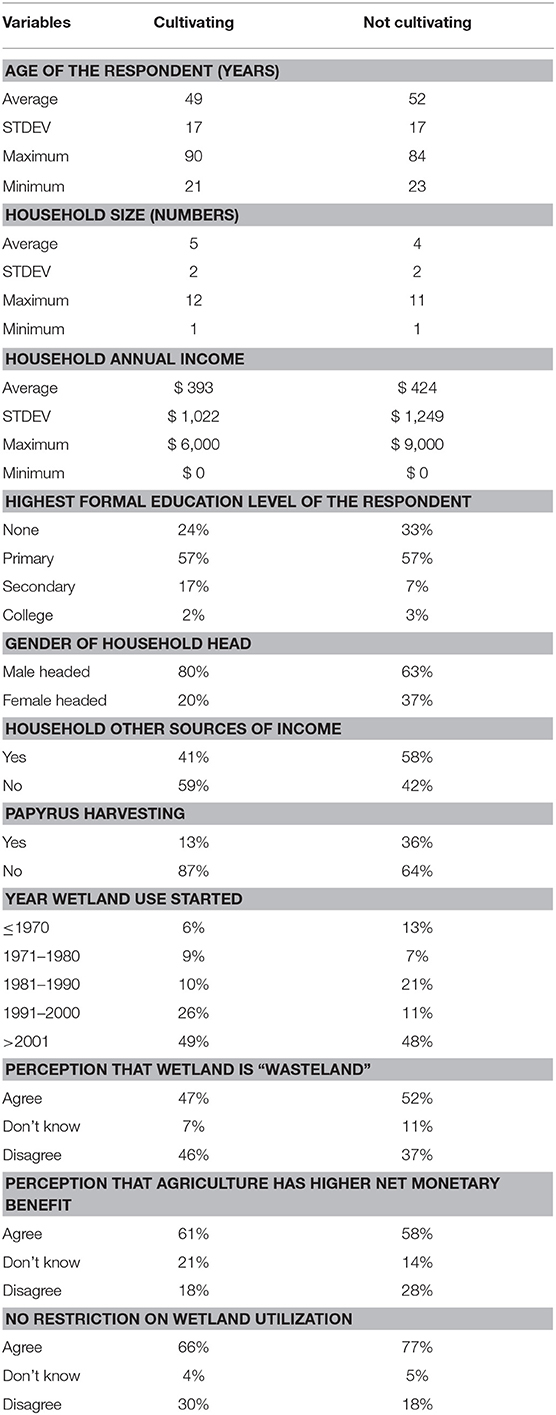
Table 4. Descriptive statistics for selected variables between wetland cultivating and non-cultivating households.
Determinants of Wetland Utilization for Agriculture
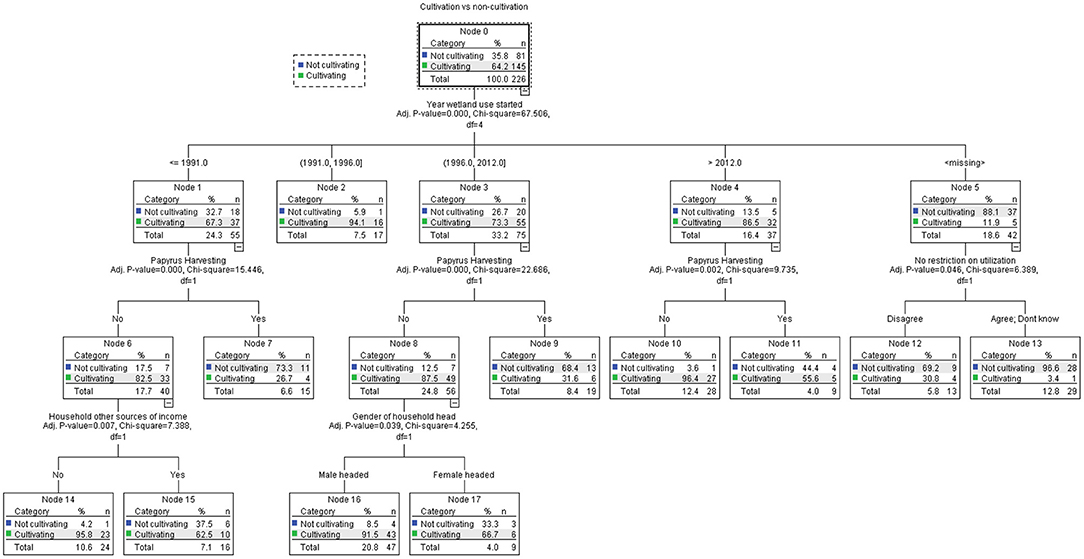
On the CHAID analysis, five predictors: year wetland use started, papyrus harvesting, gender of household head, lack of restriction on wetland utilization and household alternative sources of income reached significance for inclusion in the model (Figure 5). Age of the respondent and their highest formal education level, household size, household annual alternative income amount, the perception that wetland is “wasteland,” the perception that agriculture has higher net monetary benefit and location (village) of the household did not have a significant effect on wetland utilization for agriculture (p > 0.05). Hence, they are not included in further model development. The overall prediction percentage of the model was 84.5% with its ability to predict cultivating and non-cultivating households at 89.7 and 73.5%, respectively.
The tree analysis in Figure 5 shows a three-level CHAID tree with a total of 17 nodes, of which 10 are terminal nodes. The root node (Node 0) shows that majority, 64% (145 households) of the households surveyed, were cultivating in the former wetland areas. The model identified the year households started using the wetland as a strong predictor in wetland utilization for agriculture (CHI2 = 67.51; df = 4, p = 0.00). Five distinct categories of the year wetland use started emerged: ≤1991, 1991–1996, 1996–2012, >2012, and missing. In the period before 1991 to beyond 2012, majority of the households were cultivating in the former wetland areas (Figure 5). Contrarily, 88% of the households in the category “missing” were not cultivating in the former wetland areas. CHAID algorithm does not exclude missing data in analysis. The missing data is handled as a separate category which can be combined with other categories if they are statistically homogeneous (Thomas and Galambos, 2004).
The households that started using the wetland before 1991 were split into two segments according to the variable “papyrus harvesting” (CHI2 = 15.45; df = 1, p = 0.00), with one terminal node: households harvesting papyrus (Node 7) and one internal node, households not harvesting papyrus (Node 6) (Figure 5). Most (73%) households harvesting papyrus (Node 7) were not cultivating in the former wetland areas. Node 6 was split into two terminal nodes: node 14 and node 15 based on household alternative sources of income (CHI2 = 7.39; df = 1, p = 0.007), of which 96% of those households not harvesting papyrus (Node 6) and lacked alternative sources of income (Node 14) were cultivating in the former wetland areas.
Households that started using the wetland between 1996 and 2012 (Node 3) were split into two categories: those harvesting papyrus (Node 9) and those not harvesting papyrus (Node 8) (CHI2 = 22.69; df = 1, p = 0.00) (Figure 5). Like the households that started using the wetland before 1991, majority (68%) of the households harvesting papyrus (Node 9) were not cultivating in the former wetland areas. Households not harvesting papyrus (Node 8), of which 87.5% were cultivating in the former wetland areas, were split into two terminal nodes: male-headed (Node 16) and female-headed (Node 17), according to the “gender of the household head” (CHI2 = 4.26; df = 1, p = 0.039). The results show that 91.5% of the male-headed households (Node 16) were cultivating in the former wetland areas.
Like the households that started using the wetland before 1991 and between 1996 and 2012, majority (96%) of the households that started using the wetland beyond 2012 and were not harvesting papyrus, were cultivating in the former wetland areas (CHI2 = 9.74; df = 1, p = 0.002) (Figure 5). Households categorized as “missing” (Node 5) were split into two terminal nodes: node 12 and node 13 based on the variable “No restriction on utilization” (CHI2 = 6.37; df = 1, p = 0.046). Both households that agreed (69%) (Node 12) and disagreed/did not know (97%) (Node 13) that there was no restriction on wetland utilization were not cultivating in the former wetland areas (Figure 5).
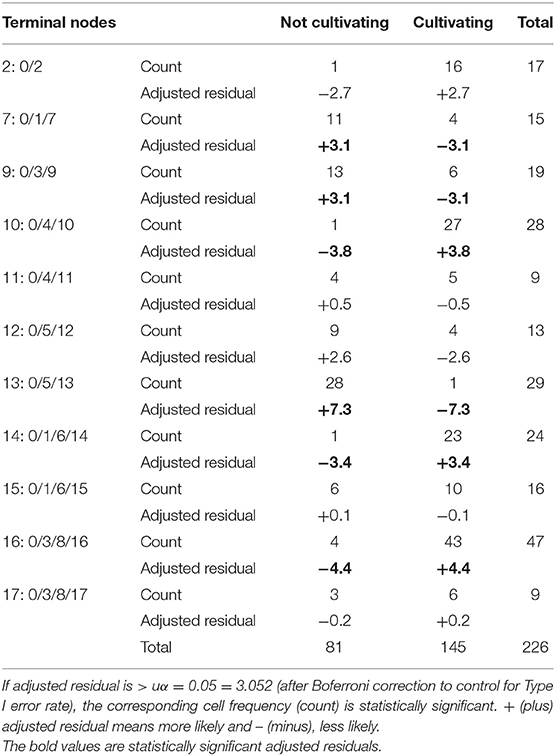
Decision routes to determinants of wetland conversion as presented in Table 5, show the “if-then” logic for each of the 10 terminal nodes. The decision routes were subjected to Pearson's chi-squared test to assess the association between the dependent and predictor variables and Boferroni correction to control for Type I error rate (Table 5). The decision route of node 0, 1, 6, and 14 show that households that started using the wetland before 1991, did not harvest papyrus for artisanal products and lacked alternative sources of income were significantly more likely to cultivate in the former wetland areas than not (CHI2 = 116.11; df = 10, p < 0.05; Cramer's V = 0.72) (Table 5). Contrarily, households that started using the wetland in the same period and harvested papyrus, were less likely to cultivate in the former wetland areas as illustrated in decision route node 0, 1, and 7 (CHI2 = 116.11; df = 10, p < 0.05; Cramer's V = 0.72) (Table 5).
Like decision route of node 0, 1, and 7, decision route of node 0, 3, and 9 showed that households that started using the wetland between 1996 and 2012 and harvested papyrus for artisanal products were significantly less likely to cultivate in the former wetland areas (CHI2 = 116.11; df = 10, p < 0.05; Cramer's V = 0.72) (Table 5). Contrarily, in the same period (Node 3), households that did not harvest papyrus for artisanal products (Node 9) and male-headed (Node 16) were significantly more likely to cultivate in the former wetland areas than not (CHI2 = 116.11; df = 10, p < 0.05; Cramer's V = 0.72) (Table 5). Among female-headed households (Node 17), there was no significant difference between those households that had or not cultivated in the former wetland areas (Table 5).
Beyond 2012 (Node 4), households that did not harvest papyrus for artisanal products (Node 10) were more likely to cultivate in the former wetland areas than not (CHI2 = 116.11; df = 10, p < 0.05; Cramer's V = 0.72) (Table 5). In relation to whether there were restrictions on wetland utilization, households that did not know or agreed that there were restrictions (Figure 5), were significantly less likely to cultivate in the former wetland areas (CHI2 = 116.11; df = 10, p < 0.05; Cramer's V = 0.72) (Table 5) as illustrated in the decision route of node 0, 5, and 14.
Interlinkages Between Perceptions and Wetland Use
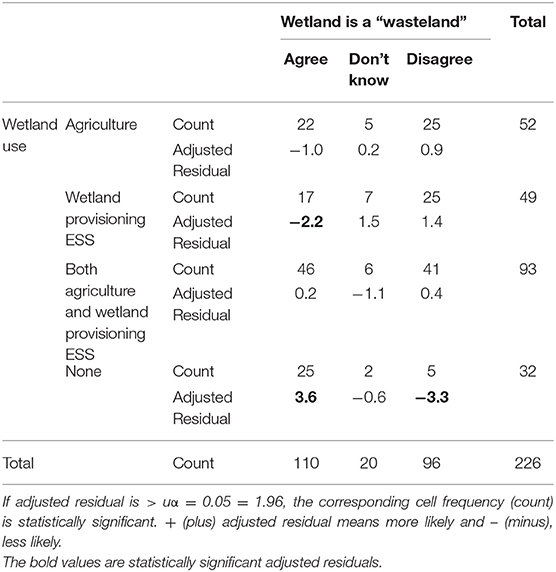
From the CHAID analysis, perceptions on wetlands value did not influence wetland conversion to agriculture. However, investigating the interlinkages between the perceptions and the actual use of the Anyiko wetland, households that neither derived provisioning ESS from the wetland nor cultivated in the former wetland areas (32 households), were more likely to view the wetland as a “wasteland.” Contrarily, households that exclusively derived provisioning ESS such as papyrus mats and fiber, palm baskets and hats, pasture, and water for livestock and aquaculture, were less likely to agree (CHI2 = 17.35; df = 6, p = 0.008; Cramer's V = 0.196) (Table 6). The households that exclusively derived provisioning ESS from the wetland were also more likely to disagree that conversion of the wetland to agriculture had a higher net monetary benefit than when conserved and used for artisanal products among other provisioning ESS (CHI2 = 11.111; df = 6, p < 0.05; Cramer's V = 0.157) (Table 7).
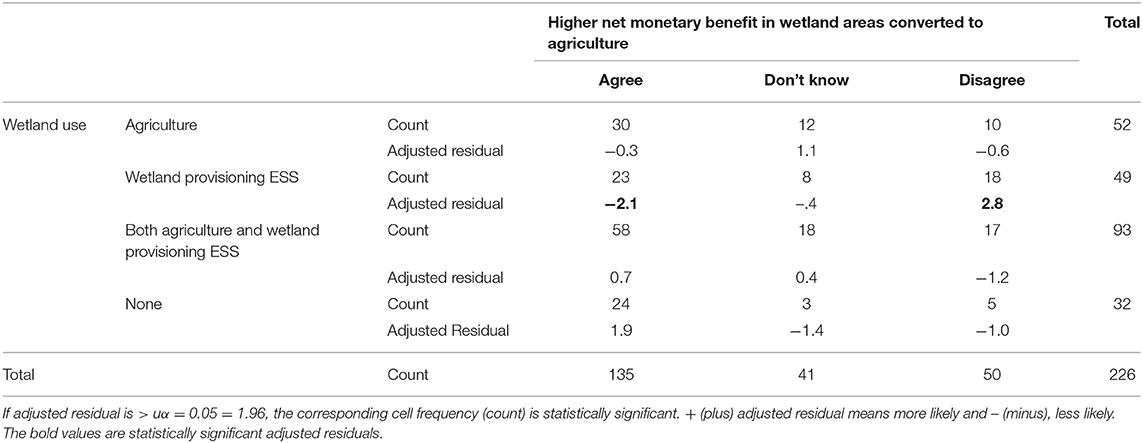
Table 7. Association between the perception that agriculture has higher net monetary benefit than wetland provisioning ESS and use of the wetland.
Discussion
Land Use/Cover Change in the Anyiko Wetland
Agricultural expansion through drainage of wetlands has led to loss or reduction of wetland's areal coverage globally (Zedler and Kercher, 2005). The demand for wetland provisioning ESS particularly crops correlates with land use change and is one of the most pressing challenge for many African wetlands (Rebelo et al., 2010). The Anyiko wetland reduced by 55%, from 390 to 174 acres, between 1966 and 2018 (Table 2), of which 43% was converted to farmland (Table 3). In the same period, the wetland/close shrubland was completely converted to farmland. Loss of wetlands to agriculture in sub-Saharan Africa have also been reported by other studies. For example, Isunju and Kemp (2016) reported 62% of the wetland vegetation loss in Nakivubo wetland in Uganda, between 2002 and 2014, 30% of which was due to drainage and conversions to farmland. In addition, Troy et al. (2007) reported 52% loss of Ga-Mampa wetland in South Africa between 1996 and 2004 to farmland. Elsewhere, for instance, China, Zhang et al. (2010) reported ~67% loss of wetlands in Sanjiang Plain between 1975 and 2004 due to agricultural land use.
The reduction in size of the Anyiko wetland was, however, not only because of farmland expansion, but also encroachment of open and close shrublands by 15 and 2%, respectively. This finding is consistent with the study of Isunju and Kemp (2016), which reported a loss of Nakivubo wetland in Uganda by 2% between 2002 and 2014 because of encroachment by trees and shrubs (shrubland). Typically, wetlands are inhabited by flood tolerant vegetation (Cronk and Fennessy, 2016) and therefore encroachment by shrubland indicate drying out of some parts of the wetland. This is usually initiated by human activities such as hydrological alterations through water channelization and drainages for farmland to allow crop production. The Anyiko wetland is used for rice and vegetable irrigation, whereby water is diverted from the wetland via canals and conveyed to cultivated land for irrigation. Moreover, several small canals are dug out within and around the wetland to increase water conveyance downstream. Reduced river discharge due to upstream diversions or abstraction for irrigation and conversions to agricultural land, which often includes removal of wetland vegetation and hydrological changes through channelization and drainage are noted by Osumba et al. (2010) and Owino and Ryan (2007) to be the main drivers of wetland loss in Kenyan wetlands. Hydrological connectivity between the wetland and the river (water bodies) is not only important for water supply to the ecosystem, but also nutrients and sediments, which are essential for growth of wetland vegetation and functioning of these systems (Lake et al., 2006; Khisa et al., 2013). Hence, prolonged limited lateral connectivity may result in substantial ecosystem loss (Boulton, 2003; Zhang et al., 2010).
Studies such as Van Dam et al. (2013) have reported existence of connection between flooding and conversion of wetlands to farmland in the Nyando wetland in Kenya. Flood recession agriculture is usually practiced in wetlands during the dry season, whereby the vegetation is partially cleared (no removal of below ground biomass) and crops planted. During the drier years, larger parts of the wetland are converted to farmland. Without structural changes to hydrology and removal of rhizomes, the papyrus vegetation re-grows when re-flooded. In the Anyiko wetland, the rhizomes are removed, and hydrology is altered resulting in no re-growth of papyrus and reduction of vegetated wetland area. Regrowth of papyrus (seed-based re-generation) in the wetland is, however, possible if hydrology is restored when the seed propagules are still viable (Boar, 2006).
The increase of the Anyiko wetland by 2% in open shrubland by 2018 may have been influenced by flooding of the downstream Nzoia river. Usually during a typical long rainy season (March to early June), the Nzoia river overtops its banks resulting in flooding of some parts of the wetland downstream, adjacent shrublands and farmlands, which may last up to July. Increase in riverine water levels result into flooding landward that can change dry land into a wetland (Ongwenyi et al., 1993; Kiwango and Wolanski, 2008). For instance, Khisa et al. (2013) reported wetland increase of 68% between 1950 and 1973 in the Nyando wetland in Kenya due to the periodic flood events experienced in the Lake Victoria region from 1961 to 1964. The study also reported decline of 40% between 1973 and 1986, 24% from 1986 to 2001, and 7% from 2001 to 2008 in the Nyando wetland, because of human induced hydrological alterations of the wetland leading to land cover conversions. In addition, drought in the early 1980s limited lateral connectivity between the River Nyando and the wetland and hence, contributed to the wetland loss. Therefore, change in land use/cover in wetlands may be caused by both natural (rainfall variability) and human induced hydrological alterations in the landscape. Climate change is also expected to contribute to wetland loss through hydrological alterations due to drought and changing rainfall patterns (Junk et al., 2013). Hence, climate change in combination with human induced hydrological alterations and conversion to agriculture, may further exacerbate the loss of Anyiko wetland.
Socio-Economic Determinants Influencing Wetland Utilization for Agriculture
Wetlands are more valuable than often perceived by many communities living around them (Schuyt, 2005). Stakeholders such as government ministries, policy makers and smallholder farmers frequently perceive drainage and conversion of wetlands to agriculture and human settlement surpass the benefits of their “wise use” (Schuyt, 2005; Ramsar Convention Secretariat, 2010). In this study, the perceptions that wetland is “wasteland” did not significantly influence its utilization for agriculture. The perception that conversion to agriculture had higher net monetary benefit than papyrus artisanal products among other provisioning ESS also did not significantly influence wetland utilization for agriculture. These indicates that conversion of the wetland to agriculture was not driven by these perceptions. Investigating the interlinkages between the perceptions and the actual use of the wetland, however, showed that the households which neither derived provisioning ESS from the wetland nor cultivated in former wetland areas were more likely to perceive the wetland as a “wasteland.” This perception was contrary to the households that exclusively derived provisioning ESS from the wetland, indicating that action molds perceptions (Jaswal, 2016). Perception-action link is considered relatively automatic, yet action also influences what is perceived (Vernon et al., 2015). Action provides opportunities for social learning and sharing of knowledge and experience among stakeholders which influences their perception. Changes in perception influences the behavioral patterns of the stakeholders to create actions (Kitolelei and Sato, 2016). Therefore, households exclusively deriving provisioning ESS from the wetland had experienced the importance of the wetland to their livelihoods particularly through cash income from the sale of papyrus artisanal products. This suggests that the perception that Anyiko wetland is “wasteland” by households that neither derived provisioning ESS nor cultivated in the former wetland areas was motivated by lack of economic gain from the wetland. The term “wasteland” therefore may have more underlying economic motivation than resulting from a traditional view as noted by Maltby (2013, p. 9). The economic gain may have also influenced households exclusively deriving provisioning ESS from the wetland that conversion to agricultural use did not have higher net monetary benefit. The households acknowledged higher cost of production for crops like rice as the basis for their view. Since perception action link is interdependent, it is expected that the perceptions of households exclusively deriving provisioning ESS influenced the households not to cultivate in the former wetland areas. Alternative sources of income, however had a significant influence on Anyiko wetland conversion to agriculture as shown in the CHAID analysis.
Households that started using the wetland before 1991, did not harvest papyrus for artisanal products and lacked alternative sources of income, were more likely to utilize the wetland for agriculture than not. This implied that conversion of the Anyiko wetland to agriculture for these households may be driven partly by the need to generate income. Crops grown in the wetland such as rice, collard greens, sugarcane, and coco yams are majorly for sale and therefore, generates income for the households. This supports Wood and van Halsema (2008) argument that partial or full conversion of wetlands for agriculture may be economically and financially motivated. The finding of the study is consistent with Turyahabwe et al. (2013) who report on wetlands in Kyoga plains agro-ecological zones in Uganda, where growing crops in wetlands is more dominant within households with limited sources of income. Kangalawe and Liwenga (2005) also reported crop production in wetlands as the main source of income in Kilombero Valley wetlands in Tanzania. The crops grown in the former wetland areas of the Anyiko wetland were also used for subsistence purposes and hence supplemented crop production from upland farms. Lack of alternative livelihood opportunities, however, is noted by Rebelo et al. (2010) to hinder prevention of wetland conversion to agriculture. Therefore, in the Anyiko wetland, if provision of alternative sources of income is not addressed in future, there is a likelihood of continuous conversion to agriculture to generate income.
Households harvesting papyrus for fiber and mats production were less likely to engage in wetland cultivation than not. This may be attributed to the labor intensive nature of production of papyrus artisanal products. For instance, households harvesting papyrus for mats production spend ~5 days in a week harvesting papyrus for 3 h (including splitting of culms and their transportation home when dry) and use 4 days a week and 4 h to make the mats at home. Farming in the former wetland areas is also labor intensive e.g., canal digging to minimize farm flooding and for rice and vegetables irrigation, bird scaring for rice farmers, farm expansions through wetland drainage and vegetation clearing etc. This implies that households may not be able to engage in both farming and papyrus harvesting for artisanal products due to the labor intensive nature of both livelihood activities. Harvesting of papyrus for artisanal products also serve as alternative source of income because products such as papyrus mats and fiber are mainly used for sale. This suggests that, apart from wetland cultivation and papyrus harvesting for artisanal products being labor intensive, these households had alternative source of income (papyrus products) unlike households that were not harvesting papyrus.
In such a case, whereby both farming and harvesting of papyrus is labor intensive, household size (with assumption of age, availability, and fitness) plays a significant role in provision of labor force. According to Taruvinga and Mushunje (2010) larger household sizes have benefits of labor force in wetland utilization. In addition, large household size has higher food consumption burden and greater dependence on wetlands not only for crop production, but also other provisioning ESS than small household size. In this study, however, household size did not significantly influence wetland utilization for agriculture. The average household size for wetland cultivating (5 ± 2 people) and non-cultivating (4 ± 2 people) households were not significantly different. Contrarily, using binary logistic regression, Taruvinga and Mushunje (2010) reported that household size had a significant influence on participation in wetland cultivation in Mashonaland East Province of Zimbabwe whereby larger household sizes were less likely to cultivate in the wetland than smaller household sizes. Zidana et al. (2007) also reported that household size significantly influenced cultivation of Lilongwe and Linthipe river banks in Malawi as larger household sizes were more likely to cultivate in the river banks than smaller household sizes.
In this study, male-headed households that were not harvesting papyrus were significantly more likely to cultivate in the wetland than not. This suggests that the limited alternative sources of income may have contributed to male-headed households to participate in wetland cultivation. Chinsinga (2007) points outs that wetland cultivation is predominantly feminine activity when other lucrative alternatives are available. Taruvinga and Mushunje (2010), however, reported no significant effect of gender of household head on wetland cultivation in Mashonaland East Province of Zimbabwe.
Households that either agreed or did not know that there were restrictions on wetland utilization were significantly less likely to cultivate in the wetland. Usually, wetlands are one resource with many interests and do not have clear property rights (Schuyt, 2005). This makes them prone to over-exploitation, degradation, and conversion to agriculture due to conflicting uses by stakeholders. In the Anyiko wetland, there are not any restrictions on deriving provisioning ESS from the wetland e.g., harvesting papyrus for artisanal products, grazing livestock, or withdrawing water for irrigation. However, cultivation in the wetland is restricted by households whose upland farms are adjacent to the wetland or had reclaimed some parts of the wetland for agriculture in the earlier years. Therefore, other households which do not own cropland in the former wetland areas may only grow crops in the converted areas or reclaim more of the wetland for agriculture, if leased out to them at a fee. This implied that the households could still hire wetland plots from the owners at a fee. Therefore, it may suggest that other factors other than restriction on cultivation hindering them from farming in the wetland. Unlike this study, in other findings in sub-Saharan Africa e.g., Adekola et al. (2012), Taruvinga and Mushunje (2010), and Rebelo et al. (2010), village heads/council were responsible for allocation of wetland plots for farming and putting of regulations e.g., size of plot per household among others.
Predictors such as age of the respondent and their highest formal education level, household annual alternative income amount and household location (village) did not have a significant effect on wetland utilization for agriculture. The average age of the respondent whose households were cultivating (49 ± 17 years) in the former wetland areas and those not cultivating (52 ± 17 years), were not significantly different and hence, may not have influenced whether a household utilized the wetland for agriculture. Study by Taruvinga and Mushunje (2010) though did not compare the age of cultivating and non-cultivating households, showed that the likelihood of wetland cultivation increased with increasing age of the household head. In relation to formal education, majority of the respondents, both from cultivating and non-cultivating households had attained primary school as their highest formal education level or had no formal education (Table 4). A small proportion such as 2% for cultivating and 3% for non-cultivating households had attained college education. This suggests that access to formal employment opportunities in Kenya are limited to majority of the respondents in both cultivating and non-cultivating households. Therefore, the low literacy level among the respondents may be an impediment to the households' access to alternative sources of income. Zidana et al. (2007) and Taruvinga and Mushunje (2010) reported that the more educated the household head was, the less likely were the household cultivating in the former wetland areas. Participation of less educated households on wetland cultivation was attributed to limited access to non-farming income. Kipkemboi et al. (2007) though did not categorize the households studied as wetland cultivating and non-cultivating reported that dependence of households on wetland provisioning ESS including crops in Nyando wetland in Kenya increased with increasing education level. The highest formal education level attained by most of the respondents, however, was primary and secondary level (78.5%). Average household annual alternative income amount between cultivating ($ 393 ± 1,022) and non-cultivating ($ 424 ± 1,249) households were not significantly different and hence, may have no influence on whether a household engaged on wetland utilization for agriculture. The non-significant effect of the village on wetland utilization for agriculture suggests that the wetland accessibility for cultivating and non-cultivating households was not dependent on household location. The households were not restricted to cultivate only on the wetland areas neighboring their respective villages.
Association among the variables in this study is neither correlation nor causation in all cases. Association is a general relationship: one variable provides information about another. Correlation is more specific: two variables are correlated when they show an increasing or decreasing trend (Altman and Krzywinski, 2015). Associations can arise between variables in the presence and absence of a causal relationship. Therefore, association does not imply causation while correlation implies association, but not causation. On the contrary, causation implies association, but not correlation.
Employed Methods and Limitations
Landsat satellite image and binary logistic regression are commonly used in sub-Saharan Africa for analysis of land use/cover change and determinants of wetlands utilization for agriculture, respectively. This study used panchromatic photographs and color satellite image data, and CHAID decision tree model. The studies on land use/cover change focused on relatively larger wetlands (>5 km2) compared to Anyiko wetland (0.7 km2) and hence, Landsat image spatial resolution were suitable for change analysis. Change analysis as well as identification of small wetlands (<5 km2) is noted by Mwita et al. (2013) as difficult on the Landsat images because of low spatial resolution. In this study, though the spatial resolutions of the images were very high (3 and 0.5 m for 1966 and 2018 images, respectively), the mapping unit of 1 acre may limit the existence and/or loss of the wetland and other land use/cover types smaller than 1 acre. Therefore, some land/use cover types in this study may be over-estimated or underestimated. This study also collected socio-economic data at household level by conducting questionnaire survey. Factors beyond household level may influence wetland conversion to agriculture and hence, other stakeholders (e.g., policy makers, local/regional authorities) should be included in future studies.
The CHAID decision tree model illustrates multilevel (segments in the decision tree arranged in a stepwise manner from the first split to the terminal nodes) interactions among socio-economic status of the households to identify stepwise pathways to wetland conversion to agriculture. This is not achievable with a binary logistic regression. This implies that the CHAID method can detect unique interactions among the independent variables within the studied households that would have gone unnoticed using a binary logistic regression. Nevertheless, the CHAID method requires a large sample size to produce reliable analysis due to its multiway splits (Milanović and Stamenković, 2016). Hence, future studies should consider a larger sample size. In addition, since there are several socio-economic determinants of wetlands utilization for agriculture at household level, future studies should include more independent variables. This is not only important in improving the model performance, but also in examining the research question at varying perspectives.
Conclusion and Policy Implication
The substantial reduction in areal coverage of Anyiko wetland explicitly showed the spatiotemporal extents of agricultural expansion in wetlands in East Africa. Though inadequate understanding of wetlands values to stakeholders (e.g., policy makers, government, local communities etc.) has been documented as a major contributor to wetlands conversion, other socio-economic status of the households play a significant role in land use/cover change of wetlands. A CHAID decision tree analysis illustrates interactions among the socio-economic determinants including households' perceptions on the value of the Anyiko wetland in stepwise pathways. Such interactions would have gone unnoticed while conducting conventional methods like a binary logistic regression. Therefore, this study concludes that:
1. Anyiko wetland area coverage has reduced by more than a half between 1966 and 2018, majority (43%) of which is due to conversion to farmland. Encroachment of shrubland has also contributed to a substantial loss (17%) of the wetland.
2. At household level, conversion of the wetland to farmland was not driven by the perceptions that it is a “wasteland” and agriculture has higher net monetary benefit than when conserved and used for artisanal products among other provisioning ESS. Household socio-economic determinants: not harvesting papyrus for artisanal products, lack of alternative sources of income and gender of household head however significantly influenced conversion of the wetland to farmland.
3. The CHAID decision tree through recursively partitioning of variables into homogenous groups from the root to terminal nodes allows identification of the interactions among the socio-economic determinants of wetland conversion in graphical pathways, unlike logistic regression.
There is need for a more effective institutional regulatory framework that will promote a balance between competing interests of food production and wetland conservation. This can be achieved through intersectoral collaboration geared toward resource use efficiency, wetland products value addition, promotion of livelihood activities that have potential to reduce the impacts on wetland properties such as ecotourism, zonation to regulate human activities in the wetland among many other initiatives. Incentives for wetland restoration and climate change adaptation should be integrated into the county development plans. Lastly, it is important note that whereas social dynamics may correlate with the observed changes in land use, there is need to unpack the wetland-specific complex causal factors that may contribute to loss of wetlands including direct and indirect drivers and the associated pressures.
Data Availability Statement
Socio-economic dataset generated for this study are included in the article/Supplementary Material.
Ethics Statement
This study was approved by the National Commission for Science, Technology & Innovation (NACOSTI) as per the national regulations of research in Kenya. Before the start of the household survey, local authorities (chiefs and village heads) were informed of the research and once they were sufficiently briefed, they also approved the study. An informed verbal consent was obtained from the household respondents prior to conducting the questionnaire survey.
Author Contributions
RO designed the study, collected and analyzed the data, and wrote the manuscript. FV gave guidance on land use/cover change analysis using CORONA and Google Earth images. NK and JK assisted in the manuscript write up. TH and EL offered statistical guidance. TH and ES offered guidance on the study design and write up of the manuscript.
Funding
This research has been funded by the Austrian Partnership Programme in Higher Education and Research for Development (APPEAR), a programme of the Austrian Development Cooperation (ADC), and implemented by the Austrian Agency for International Cooperation in Education and Research (OeAD-GmbH).
Conflict of Interest
The authors declare that the research was conducted in the absence of any commercial or financial relationships that could be construed as a potential conflict of interest.
Acknowledgments
The authors are indebted to Limnology and Wetland Management Programme (LWM) Egerton University and University of Natural Resources and Life Sciences Vienna (BOKU) and Doctoral School Human River Systems in the 21st Century (HR21) at BOKU for support (hr21.boku.ac.at). We are also grateful to Dr. Daniel Kyalo of Kenyatta University in Kenya for guidance on the questionnaire formulation, Zephaniah Ajode and Erick Owino for field assistance. Chief of North East Ugenya Location and assistant chiefs of Ramunde, Sihayi and Jera sub-locations for their support.
Supplementary Material
The Supplementary Material for this article can be found online at: https://www.frontiersin.org/articles/10.3389/fenvs.2019.00207/full#supplementary-material
References
Adekola, O., Morardet, S., de Groot, R., and Grelot, F. (2012). Contribution of provisioning services of the Ga-Mampa wetland, South Africa, to local livelihoods. Int. J. Biodivers. Sci. Ecosyst. Serv. Manag. 8, 248–264. doi: 10.1080/21513732.2012.671191
Altman, N., and Krzywinski, M. (2015). Points of significance: association, correlation and causation. Nat. Methods 12, 899–900. doi: 10.1038/nmeth.3587
Au, W. H., Chan, K. C., and Yao, X. (2003). A novel evolutionary data mining algorithm with applications to churn prediction. IEEE Trans. Evolut. Comput. 7, 532–545. doi: 10.1109/TEVC.2003.819264
Boar, R. R. (2006). Responses of a fringing Cyperus papyrus L. swamp to changes in water level. Aquatic Bot. 84, 85–92. doi: 10.1016/j.aquabot.2005.07.008
Boulton, A. J. (2003). Parallels and contrasts in the effects of drought on stream macroinvertebrate assemblages. Freshw. Biol. 48, 1173–1185. doi: 10.1046/j.1365-2427.2003.01084.x
Chinsinga, B. (2007). Hedging food security through winter cultivation: the agronomy of dimba cultivation in Malawi. Paper presented at the Education Development Conference. (Galway).
Climate-Data.org (n.d.). Climate Siaya. Available online at: https://en.climate-data.org/africa/kenya/siaya/siaya-11165/ (accessed May 20, 2019).
Cronk, J. K., and Fennessy, M. S. (2016). Wetland Plants: Biology and Ecology: Boca Raton, FL: CRC Press.
Dixon, A. B. (2002). The hydrological impacts and sustainability of wetland drainage cultivation in Illubabor, Ethiopia. Land Degrad. Dev. 13, 17–31. doi: 10.1002/ldr.479
Dixon, A. B., and Wood, A. P. (2003). Wetland cultivation and hydrological management in Eastern Africa: matching community and hydrological needs through sustainable wetland use. Paper presented at the Natural Resources Forum. (Oxford: Blackwell Publishing Ltd.).
Emerton, L., Iyango, L., Luwum, P., and Malinga, A. (1999). The Present Economic Value of Nakivubo Urban Wetland, Uganda. Kampala: IUCN—The World Conservation Union; Eastern Africa Regional Office; Nairobi and National Wetlands Programme; Wetlands Inspectorate Division; Ministry of Water, Land and Enviornment.
Finlayson, C. M., D'Cruz, R., Aladin, N., Barker, D., Beltram, G., Brouwer, J., et al. (2005). “Inland water systems,” in Ecosystems and Human Well-being: Current State and Trends, Vol. 1, eds R. Costanza, P. Jacobi, and F. Rijsberman (Washington, DC: Island Press), 551–583.
Foley, J. A., DeFries, R., Asner, G. P., Barford, C., Bonan, G., Carpenter, S. R., et al. (2005). Global consequences of land use. Science 309, 570–574. doi: 10.1126/science.1111772
Hadden, J., Tiwari, A., Roy, R., and Ruta, D. (2007). Computer assisted customer churn management: state-of-the-art and future trends. Comput. Operat. Res. 34, 2902–2917. doi: 10.1016/j.cor.2005.11.007
Isunju, J. B., and Kemp, J. (2016). Spatiotemporal analysis of encroachment on wetlands: a case of Nakivubo wetland in Kampala, Uganda. Environ. Monitor. Assess. 188:203. doi: 10.1007/s10661-016-5207-5
Jogo, W., and Hassan, R. (2010). Balancing the use of wetlands for economic well-being and ecological security: the case of the Limpopo wetland in southern Africa. Ecol. Econ. 69, 1569–1579. doi: 10.1016/j.ecolecon.2010.02.021
Junk, W. J., An, S., Finlayson, C. M., Gopal, B., Květ, J., Mitchell, S. A., et al. (2013). Current state of knowledge regarding the world's wetlands and their future under global climate change: a synthesis. Aquatic Sci. 75, 151–167. doi: 10.1007/s00027-012-0278-z
Kangalawe, R. Y., and Liwenga, E. T. (2005). Livelihoods in the wetlands of Kilombero Valley in Tanzania: opportunities and challenges to integrated water resource management. Phys. Chem. Earth Parts A/B/C 30, 968–975. doi: 10.1016/j.pce.2005.08.044
Kansiime, F., and Nalubega, M. (1999). Wastewater Treatment by a Natural Wetland: The Nakivubo Swamp, Uganda. Rotterdam: CRC Press.
Khisa, P., Uhlenbrook, S., van Dam, A., Wenninger, J., van Griensven, A., and Abira, M. (2013). Ecohydrological characterization of the Nyando wetland, Lake Victoria, Kenya: a state of system (SoS) analysis. Afr. J. Environ. Sci. Technol. 7, 417–434. doi: 10.5897/AJEST13.1426
Kipkemboi, J., Van Dam, A., Ikiara, M., and Denny, P. (2007). Integration of smallholder wetland aquaculture–agriculture systems (fingerponds) into riparian farming systems on the shores of Lake Victoria, Kenya: socio-economics and livelihoods. Geograph. J. 173, 257–272. doi: 10.1111/j.1475-4959.2007.00246.x
Kitolelei, J. V., and Sato, T. (2016). Analysis of perceptions and knowledge in managing coastal resources: a case study in Fiji. Front. Marine Sci. 3:189. doi: 10.3389/fmars.2016.00189
Kiwango, Y. A., and Wolanski, E. (2008). Papyrus wetlands, nutrients balance, fisheries collapse, food security, and Lake Victoria level decline in 2000–2006. Wetlands Ecol. Manag. 16, 89–96. doi: 10.1007/s11273-007-9072-4
Kothari, C. R. (2004). Research Methodology: Methods and Techniques. New Delhi: New Age International.
Lake, S., Bond, N., and Reich, P. (2006). Floods down rivers: from damaging to replenishing forces. Adv. Ecol. Res. 39, 41–62. doi: 10.1016/S0065-2504(06)39003-4
MEA (2003). Assessment: Ecosystems and Human Well-Being: A Framework for Assessment. (Washington, DC: Island Press).
MEA (2005). Ecosystems and Human Well-Being Wetlands and Water Synthesis. (Washington, DC: World Resources Institute).
Milanović, M., and Stamenković, M. (2016). CHAID decision tree: methodological frame and application. Econ. Themes 54, 563–586. doi: 10.1515/ethemes-2016-0029
Mmopelwa, G. (2006). Economic and financial analysis of harvesting and utilization of river reed in the Okavango Delta, Botswana. J. Environ. Manag. 79, 329–335. doi: 10.1016/j.jenvman.2005.07.010
Mwakubo, S. M., and Obare, G. A. (2009). Vulnerability, livelihood assets and institutional dynamics in the management of wetlands in Lake Victoria watershed basin. Wetlands Ecol. Manag. 17:613. doi: 10.1007/s11273-009-9138-6
Mwita, E., Menz, G., Misana, S., Becker, M., Kisanga, D., and Boehme, B. (2013). Mapping small wetlands of Kenya and Tanzania using remote sensing techniques. Int. J. Appl. Earth Observ. Geoinf. 21, 173–183. doi: 10.1016/j.jag.2012.08.010
Nabahungu, N. L., and Visser, S. M. (2011). Contribution of wetland agriculture to farmers' livelihood in Rwanda. Ecol. Econ. 71, 4–12. doi: 10.1016/j.ecolecon.2011.07.028
NEMA (2010). State of the Environment Report for Uganda 2010. Kampala: National Environment Management Authority (NEMA).
Obiero, K. O., Raburu, P. O., Okeyo-Owuor, J. B., and Raburu, E. A. (2012). Community perceptions on the impact of the recession of Lake Victoria waters on Nyando Wetlands. Sci. Res. Essays 7, 1647–1661. doi: 10.5897/SRE11.324
Oduor, F. O., Raburu, P. O., and Mwakubo, S. (2015). To conserve or convert wetlands: evidence from Nyando wetlands, Kenya. J. Dev. Agric. Econ. 7, 48–54. doi: 10.5897/JDAE2014.0617
Oladele, O. I., and Wakatsuki, T. (2008). Social factors affecting wetlands utilization for agriculture in Nigeria: a case study of sawah rice production. Rice Sci. 15, 150–152. doi: 10.1016/S1672-6308(08)60034-7
Ongwenyi, G., Denga, F., Abwao, P., and Kitheka, J. U. (1993). Impacts of Floods and Drought on the Development of Water Resources of Kenya: Case Studies of Nyando and Tana Catchments. (Yokohama: IAHS Publication).
Onywere, S. M., Getenga, Z. M., Mwakalila, S. S., Twesigye, C. K., and Nakiranda, J. K. (2011). Assessing the challenge of settlement in budalangi and yala swamp area in western kenya using landsat satellite imagery. Open Environ Eng J. 4, 97–104. Available online at: http://ir.mksu.ac.ke/handle/123456780/4177
Osumba, J., Okeyo-Owuor, J., and Raburu, P. (2010). Effect of harvesting on temporal papyrus (Cyperus papyrus) biomass regeneration potential among swamps in Winam Gulf wetlands of Lake Victoria Basin, Kenya. Wetlands Ecol. Manag. 18, 333–341. doi: 10.1007/s11273-010-9174-2
Owino, A. O., and Ryan, P. G. (2007). Recent papyrus swamp habitat loss and conservation implications in western Kenya. Wetlands Ecol. Manag. 15, 1–12. doi: 10.1007/s11273-006-9001-y
Ramsar Convention Secretariat (2010). “Wise use of wetlands: concepts and approaches for the wise use of wetlands,” in Ramsar Handbooks for the Wise Use of Wetlands, 4th Edn, Vol. 1, ed D. Pritchard (Gland: Ramsar Convention Secretariat), 6–19.
Rebelo, L.-M., Finlayson, C. M., and Nagabhatla, N. (2009). Remote sensing and GIS for wetland inventory, mapping and change analysis. J. Environ. Manage. 90, 2144–2153. doi: 10.1016/j.jenvman.2007.06.027
Rebelo, L.-M., Johnston, R., Hein, T., Weigelhofer, G., D'Haeyer, T., Kone, B., et al. (2013). Challenges to the integration of wetlands into IWRM: The case of the Inner Niger Delta (Mali) and the Lobau Floodplain (Austria). Environ. Sci. Policy 34, 58–68. doi: 10.1016/j.envsci.2012.11.002
Rebelo, L.-M., McCartney, M. P., and Finlayson, C. M. (2010). Wetlands of Sub-Saharan Africa: distribution and contribution of agriculture to livelihoods. Wetlands Ecol. Manag. 18, 557–572. doi: 10.1007/s11273-009-9142-x
Rodríguez, A. H., Avilés-Jurado, F. X., Díaz, E., Schuetz, P., Trefler, S. I., Solé-Violán, J., et al. (2016). Procalcitonin (PCT) levels for ruling-out bacterial coinfection in ICU patients with influenza: a CHAID decision-tree analysis. J. Infect. 72, 143–151. doi: 10.1016/j.jinf.2015.11.007
Russi, D., ten Brink, P., Farmer, A., Badura, T., Coates, D., Förster, J., et al. (2013). The Economics of Ecosystems and Biodiversity for Water and Wetlands. London and Brussels: IEEP.
Sakané, N., Alvarez, M., Becker, M., Böhme, B., Handa, C., Kamiri, H. W., et al. (2011). Classification, characterisation, and use of small wetlands in East Africa. Wetlands 31, 1103–1116. doi: 10.1007/s13157-011-0221-4
Saunders, M. J., Kansiime, F., and Jones, M. B. (2012). Agricultural encroachment: implications for carbon sequestration in tropical African wetlands. Glob. Chang. Biol. 18, 1312–1321. doi: 10.1111/j.1365-2486.2011.02633.x
Schuijt, K. (2002). Land and Water Use of Wetlands in Africa: Economic Values of African Wetlands. (Laxenburg: International Institute for Applied Systems Analysis).
Schuyt, K. D. (2005). Economic consequences of wetland degradation for local populations in Africa. Ecol. Econ. 53, 177–190. doi: 10.1016/j.ecolecon.2004.08.003
Swallow, B., Onyango, L., and Meinzen-Dick, R. (2007). “12 irrigation management and poverty dynamics: case study of the Nyando Basin in Western Kenya,” in Community-Based Water Law and Water Resource Management Reform in Developing Countries, eds B. van Koppen, M. Giordano, and J. Butterworth (Wallingford: CABI), 196–210.
Taruvinga, A., and Mushunje, A. (2010). “Socio-economic factors that influence households: participation in wetland cultivation: a binary logistic regression ofwetland cultivators and noncultivators,” Paper Presented at the Joint 3rd African Association of Agricultural Economists (AAAE) and 48th Agricultural Economists Association of South Africa (AEASA) (Cape Town).
Thomas, E. H., and Galambos, N. (2004). What satisfies students? Mining student-opinion data with regression and decision tree analysis. Res. High. Educ. 45, 251–269. doi: 10.1023/B:RIHE.0000019589.79439.6e
Troy, B., Sarron, C., Fritsch, J. M., and Rollin, D. (2007). Assessment of the impacts of land use changes on the hydrological regime of a small rural catchment in South Africa. Phys. Chem. Earth Parts A/B/C 32, 984–994. doi: 10.1016/j.pce.2007.07.049
Turyahabwe, N., Kakuru, W., Tweheyo, M., and Tumusiime, D. M. (2013). Contribution of wetland resources to household food security in Uganda. Agric. Food Secur. 2:5. doi: 10.1186/2048-7010-2-5
UNEP (2008). Africa: Atlas of our Changing Environment. Nairobi: United Nations Environment Programme (UNEP).
USGS (n.d.). USGS EROS Archive - Declassified Data - Declassified Satellite Imagery - 1. Available online at: https://www.usgs.gov/centers/eros/science/usgs-eros-archive-declassified-data-declassified-satellite-imagery-1?qt-science_center_objects=0#qt-science_center_objects
Van Dam, A. A., Kipkemboi, J., Rahman, M., and Gettel, G. M. (2013). Linking hydrology, ecosystem function, and livelihood outcomes in African papyrus wetlands using a Bayesian Network model. Wetlands 33, 381–397. doi: 10.1007/s13157-013-0395-z
Vernon, D., Lowe, R., Thill, S., and Ziemke, T. (2015). Embodied cognition and circular causality: on the role of constitutive autonomy in the reciprocal coupling of perception and action. Front. Psychol. 6:1660. doi: 10.3389/fpsyg.2015.01660
Wood, A. P., and van Halsema, G. E. (2008). Scoping Agriculture–Wetland Interactions: Towards a Sustainable Multiple-Response Strategy, Vol. 33. Food and Agriculture Organization of the United Nations (FAO).
Zedler, J. B., and Kercher, S. (2005). Wetland resources: status, trends, ecosystem services, and restorability. Annu. Rev. Environ. Resour. 30, 39–74. doi: 10.1146/annurev.energy.30.050504.144248
Zhang, J., Ma, K., and Fu, B. (2010). Wetland loss under the impact of agricultural development in the Sanjiang Plain, NE China. Environ. Monit. Assess. 166, 139–148. doi: 10.1007/s10661-009-0990-x
Keywords: CORONA, ecosystem services, agriculture, livelihoods, wetlands
Citation: Ondiek RA, Vuolo F, Kipkemboi J, Kitaka N, Lautsch E, Hein T and Schmid E (2020) Socio-Economic Determinants of Land Use/Cover Change in Wetlands in East Africa: A Case Study Analysis of the Anyiko Wetland, Kenya. Front. Environ. Sci. 7:207. doi: 10.3389/fenvs.2019.00207
Received: 03 October 2019; Accepted: 31 December 2019;
Published: 22 January 2020.
Edited by:
Erik Andersson, Stockholm University, SwedenReviewed by:
Jean Hugé, Université Libre de Bruxelles, BelgiumAthanasios Votsis, Finnish Meteorological Institute, Finland
Copyright © 2020 Ondiek, Vuolo, Kipkemboi, Kitaka, Lautsch, Hein and Schmid. This is an open-access article distributed under the terms of the Creative Commons Attribution License (CC BY). The use, distribution or reproduction in other forums is permitted, provided the original author(s) and the copyright owner(s) are credited and that the original publication in this journal is cited, in accordance with accepted academic practice. No use, distribution or reproduction is permitted which does not comply with these terms.
*Correspondence: Risper Ajwang' Ondiek, b25kaWVrLnJpc3BlcjdAZ21haWwuY29t
 Risper Ajwang' Ondiek
 Francesco Vuolo
 Julius Kipkemboi
 Nzula Kitaka
 Erwin Lautsch1
 Thomas Hein