
94% of researchers rate our articles as excellent or good
Learn more about the work of our research integrity team to safeguard the quality of each article we publish.
Find out more
ORIGINAL RESEARCH article
Front. Environ. Sci., 03 September 2019
Sec. Interdisciplinary Climate Studies
Volume 7 - 2019 | https://doi.org/10.3389/fenvs.2019.00127
This article is part of the Research TopicUse of Earth Observations for Actionable Decision Making in the Developing WorldView all 17 articles
Information is a critical resource in disaster response scenarios. Data regarding the geographic extent, severity, and socioeconomic impacts of a disaster event can help guide emergency responders and relief operations, particularly when delivered within hours of data acquisition. Information from remote observations provides a valuable tool for assessing conditions “on the ground” more quickly and efficiently. Here, we evaluate the social value of a near real-time flood impact system using a disaster response case study, and quantify the Value of Information (VOI) of satellite-based observations for rapid response using a hypothetical flooding disaster in Bangkok, Thailand. MODIS imagery from NASA's Land, Atmosphere Near real-time Capability for EOS (LANCE) system is used to produce operational estimates of inundation depths and economic damages. These rapid Earth observations are coupled with a decision-analytical model to inform decisions on emergency vehicle routing. Emergency response times from vehicles routed using flood damage data are compared with baseline routes without the benefit of advance information on road conditions. Our results illustrate how the application of near real-time Earth observations can improve the response time and reduce potential encounters with flood hazards when compared with baseline routing strategies. Results indicate a potential significant economic benefit (i.e., millions of dollars) from applying near real-time Earth observations for improved flood disaster response and management.
Natural disasters like floods can have devastating societal impacts. Direct damages from flooding, such as the loss of human life or the destruction of infrastructure have immediate social ramifications, while indirect impacts like reduced business production or loss of income can lead to more protracted socioeconomic effects (Haraguchi and Lall, 2015). This is especially true in regions like the Lower Mekong River Basin (LMRB), where its combination of high population density, seasonal monsoons, and low-lying topography make it particularly susceptible to flooding (Gale and Saunders, 2013) (Figure 1a).
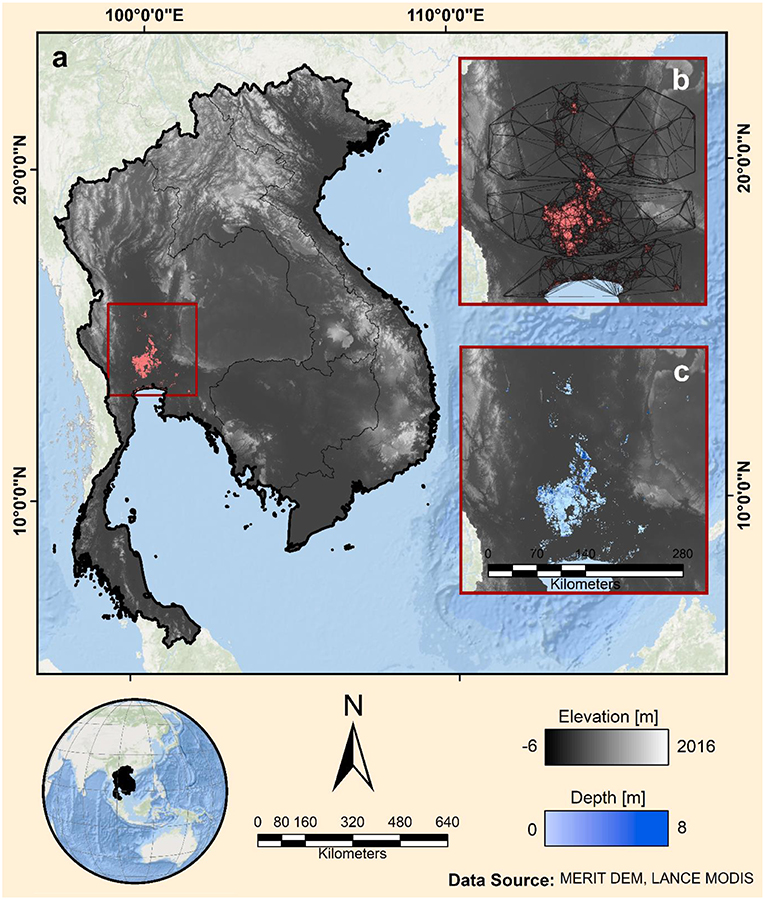
Figure 1. (a) Map of Lower Mekong River Basin countries with flood extent from 2011 event (pink shaded region). (b) Study extent showing results of the triangular interpolated network (TIN) produced by extracting land elevations from around the perimeter of the flood extent. (c) Resulting inundation depth raster produced by flood impact analysis.
Managing flood hazards in such a flood-prone region requires an acute understanding of the risk of future events. Flood risks are defined by the function of the probability of occurrence, the exposure (e.g., population and assets subject to flooding), and vulnerability, which is a measure of the society's ability to cope with an event (Koks et al., 2015). Emergency management operations are typically divided into four phases: Preparedness, Response, Recovery, and Mitigation (Altay and Green, 2006). Preparedness refers to the capacity-building period before a disaster strikes. After the onset of an event, the Response phase focuses on saving lives and averting additional damages. Post-event activities include Recovery, in which communities seek to return to pre-flood capabilities, and Mitigation, which refers to resiliency initiatives meant to strengthen the community from future events (Howden, 2009).
Each stage in the disaster management cycle presents its own set of challenges, with the highest uncertainties occurring in the Response phase immediately after a disaster strikes (Okuyama, 2003; Ortuño et al., 2013). A single flood event can impact multiple interdependent systems, such as telecommunications, transportation, and power infrastructure, thereby hindering coordination between decision makers, emergency responders, and populations in need (Comfort et al., 2004).
In such situations, information about the extent, severity, and impacts of flooding becomes a time-critical resource. The 2005 World Disasters Report notes that in disaster response scenarios, information can be considered as vital a form of aid as “…water, food, medicine, or shelter,” with respect to its ability to save lives and extend resources (Walter, 2005). Due to the high uncertainties and dynamic nature of the disaster response phase, information is most valuable when obtained as soon after the flood event as possible. In a survey of 52 Emergency Management Agencies, 82% expressed a need for flood impact information within 24 h of the event (Hodgson et al., 2009).
Geospatial technologies like remote sensing, aerial footage, or volunteered geographic information (VGI) provide a valuable way of obtaining useful intelligence at broader scales and with shorter latency than traditional methods (Hodgson et al., 2009; Goodchild and Glennon, 2010; Haworth and Bruce, 2015). These Earth-observing technologies have been widely incorporated into the emergency management cycle, from providing early warning systems for flood preparation (Koriche and Rientjes, 2016) to improving hazard mapping to inform long-term planning and mitigation strategies (Shivaprasad Sharma et al., 2017). Yet despite the obvious benefits of Earth observations, comparatively little research has been done to quantify the value that these data provide, particularly in the Response phase (Hodgson et al., 2009).
To this end, there remain several questions regarding the extent to which satellite-based information can aid in disaster management and planning, rapid response cases, and in improving the allocation of resources. To investigate the utility of operational Earth observations during a flood, we present a simple decision-analytical model based on a hypothetical flood response scenario. We use a Value of Information (VOI) framework to identify management objectives that could benefit from applied satellite data, and determine the potential time and cost savings achieved when incorporating geospatial information into emergency vehicle routing. In this context, routing is defined as the turn-by-turn navigation from a predefined dispatch center to a location of potential need. We accomplish this by coupling flood inundation estimates from an operational near real-time (NRT) satellite-based flood monitoring system with an open-source routing platform to evaluate how management objectives perform both in the presence and absence of advance flood information. In doing so we attempt to address the following main questions:
(1) How does the presence of NRT flood impact information affect the response times of emergency vehicles when compared to baseline routes?
(2) What model parameters are most important in determining vehicle response times?
(3) What is the potential social value of rapid earth observations when applied to a disaster response scenario?
Thus, the objective of this study is not to assess the performance of the flood monitoring system against other flood monitoring methods or products. Rather, we aim to get a better understanding of the value of these or similar satellite-based NRT observations and quantify to what degree they can potentially improve and support disaster risk management and response decisions. The following sections introduce the concept of VOI and review its application to geospatial data. We then describe the model design using the 2011 Southeast Asia Floods as an illustrative example. Finally, we present the results and discuss the broader impacts from the analysis.
In a decision making context it is important to understand how the introduction of new information can improve a given strategy. VOI methodologies were originally presented in economics literature as a way to quantify the marginal benefits produced by reducing model uncertainties (Howard, 1966, 1968). In economic terms, the VOI describes the amount of money a rational agent would be willing to pay for new information before making a decision (Alfonso et al., 2016). While these concepts have been widely implemented in the field of decision analysis, they have become increasingly common in Earth science applications. Some recent examples include investigations into learning about potential climate thresholds (Keller et al., 2007), petroleum engineering (Bratvold et al., 2009), or drought monitoring (Bernknopf et al., 2017). Here, we extend the VOI concept to a flood-related disaster management scenario.
Since the creation of the first weather satellites, global Earth-observing technologies have raised new questions about the benefits of geospatial data (Mjelde et al., 1989; Obersteiner et al., 2017). Macauley (2006) provides a broad overview of the concept of VOI in decision making using a simple crop harvesting scenario (Figure 2). In this example, a farmer has a choice whether to harvest the crop immediately or to harvest over the course 2 days. Harvesting over 2 days would net a higher payout, yet there is a chance that if it rains, part of the harvest could be ruined. Improved information about the probability of rain would be valuable to the farmer, and the information is of the most value when the farmer's subjective uncertainty is highest. In the diagram describing this decision problem, the vertical dashed line represents this threshold where the farmer's subjective belief about the probability of rain is the most uncertain (in this case, p = 5/22.5, or ~22%). At this point, the most the farmer would be willing to pay is $3,888; above that, the expected costs of improved weather information outweigh its benefits. This simple approach can be applied in numerous ways to help quantify and convey the VOI for informing decisions. In this analysis, access to satellite-based maps of inundated regions serve as a proxy for information on the current state of the world.
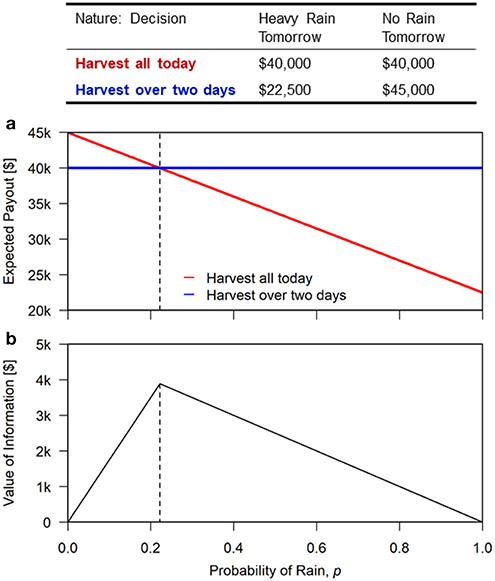
Figure 2. Illustration of Value of Information based on the decision whether or not to harvest crops. Table shows the expected payout matrix for the decision of when to harvest. (a) Expected payout based on the subjective probability of heavy rain in the future. (b) Expected Value of Information for improved rain forecast. The dashed vertical line represents the point at which the farmer's uncertainty is highest, representing the highest value of information. Figure adapted from Macauley (2006).
In the field of Emergency Response operations, improvements to satellite spatial resolution and latency have led to a wide adoption of geospatial informatics. Some data, such as those provided through NASA's Land, Atmosphere Near real-time Capability for EOS (LANCE) system, can commonly be made available within 3 h of overpass, making it suitable for NRT applications (Davies et al., 2015). Examples of such initiatives include NASA's NRT Flood Mapping (Ahamed et al., 2017; Fayne et al., 2017; Policelli et al., 2017), UMD's Global Flood Monitoring System (GFMS, Wu et al., 2014), and the Dartmouth Flood Observatory (DFO, Brakenridge and Anderson, 2006).
In the LMRB, several recent studies have demonstrated how rapid Earth observations can be used operationally to inform flood management. Ahamed and Bolten (2017) produced automatic flood extents by applying a dynamic surface water classifier to data from the Moderate-resolution Imaging Spectroradiometer (MODIS) sensors on the Aqua and Terra satellites. Oddo et al. (2018) then demonstrated how the resulting flood extents can be combined with socioeconomic data to produce rapid estimates of flood impacts using depth-damage curves for different types of land cover and infrastructure. This study attempts to determine how the flood detection and impact assessment metrics produced by the preceding analyses can be further applied to emergency response (Figure 3).
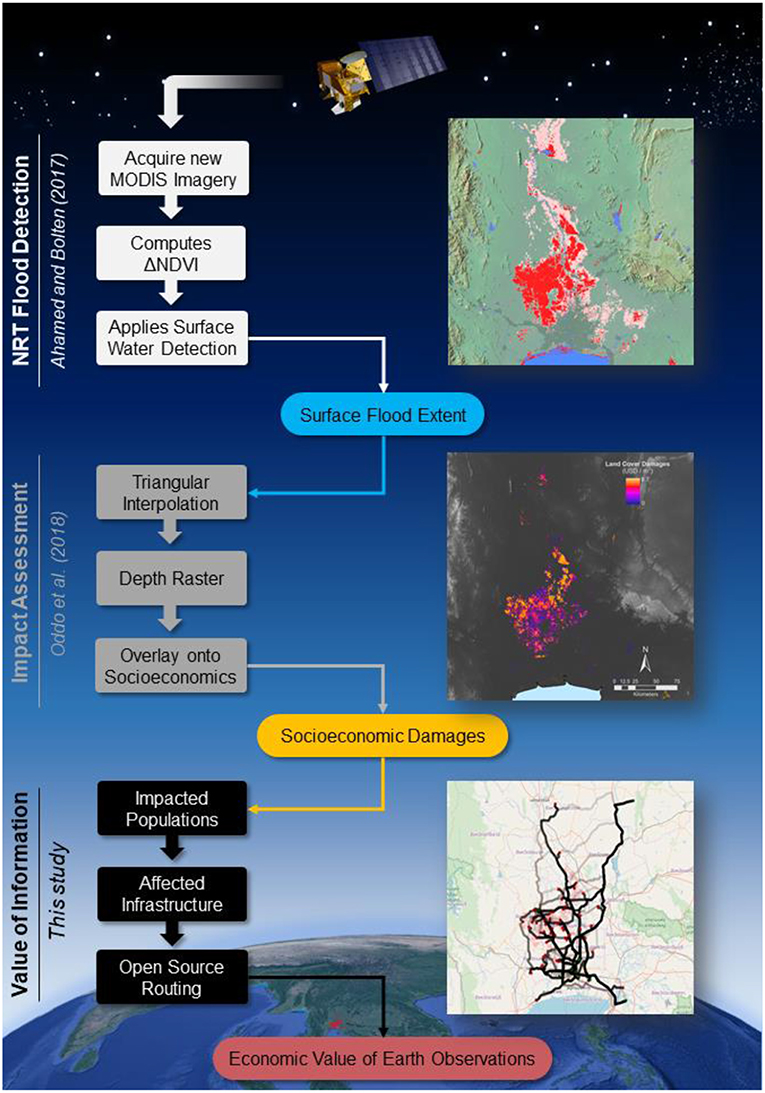
Figure 3. Workflow for generating near real-time (NRT) routing information from Earth observations. MODIS imagery is ingested from LANCE server to produce surface water extents. Extents are digitized and used to estimate flood depths and damage estimates. Finally, these damages can be incorporated into the value of information analysis for emergency response.
To investigate how applied Earth observations can be used to improve flood response operations, we consider a hypothetical emergency response scenario based on the 2011 Southeast Asia Floods. In this scenario, we use the output of the previously described flood damage assessment to identify a number of population sites that may have been impacted and require emergency attention. Emergency response vehicles stationed at dispatch centers are routed to each of the population sites and their response times and navigation details are evaluated in the presence and absence of information on flood conditions. The following sections outline these steps in more detail.
The 2011 Southeast Asia Floods resulted in the highest-ever insured losses of any freshwater flood disaster (Gale and Saunders, 2013). In parts of Thailand, rainfall increase of up to 143% combined with land subsidence to produce widespread flooding in the region around Bangkok (Haraguchi and Lall, 2015). A surface flood extent raster for this 2011 flood was obtained through the DFO, which maintains an archive of historical events. Imagery collected by NASA's MODIS sensor shows the extent of surface inundation between December 24, 2011 and January 2, 2012 at a spatial resolution of 250-m (Brakenridge et al., 2011) (Figure 1a). The flood extent was vectorized using QGIS software and a triangular interpolated network (TIN) was generated by sampling land surface elevations around the perimeter (Figure 1b). The resulting TIN serves as an estimate of flood surface elevation across the detected extent. Subtracting the underlying digital elevation model (“Multi-Error-Removed Improved-Terrain”—MERIT DEM) produces a raster of estimated flood depths (Figure 1c) (Yamazaki et al., 2017). For a more detailed discussion of the methodology and limitations of this approach, see sections 3 and 5 of Oddo et al. (2018).
Estimated flood depths were intersected with a land use/land cover map produced by NASA SERVIR's Regional Land Cover Monitoring System (https://rlcms-servir.adpc.net/en/landcover/). Land cover classifications were derived from atmospherically-corrected imagery from Landsat 4, 5, 7, and 8 to produce a map of the entire LMRB at ~30-m ground resolution. Damages to specific land cover types were assessed using regionally-derived depth-damage functions (Oddo et al., 2018). Additionally, damages to populations and infrastructure were estimated by intersecting flood depths with population data from NASA's Socioeconomic Data and Applications Center (SEDAC) and open-source infrastructure data from OpenStreetMap (OSM), respectively (CIESIN, 2016; OpenStreetMap Contributors, 2019).
The resulting socioeconomic damage map (Supplementary Figure 1) was used to identify a total of 75 potential population sites that may have been most highly impacted by the flooding. Emergency response dispatch sites were chosen as ambulance and fire station locations in OSM (n = 10). Finally, estimated flood depths were used to delineate areas that were considered Highly Flooded to average vehicles. The threshold for Highly Flooded areas was identified as 300 mm of inundation, according to the modeled relationship between flood depth and vehicle speed in Pregnolato et al. (2017) (Figure 4). This was found to be the average depth at which a passenger vehicle would begin to float, signifying areas that would cause the most significant delays to emergency vehicles. Regions within the flood extent that exceed this threshold were exported as a GeoJSON object using QGIS for use in the routing model. Those areas that impacted yet were below the 300-mm threshold were identified as simply Flooded.
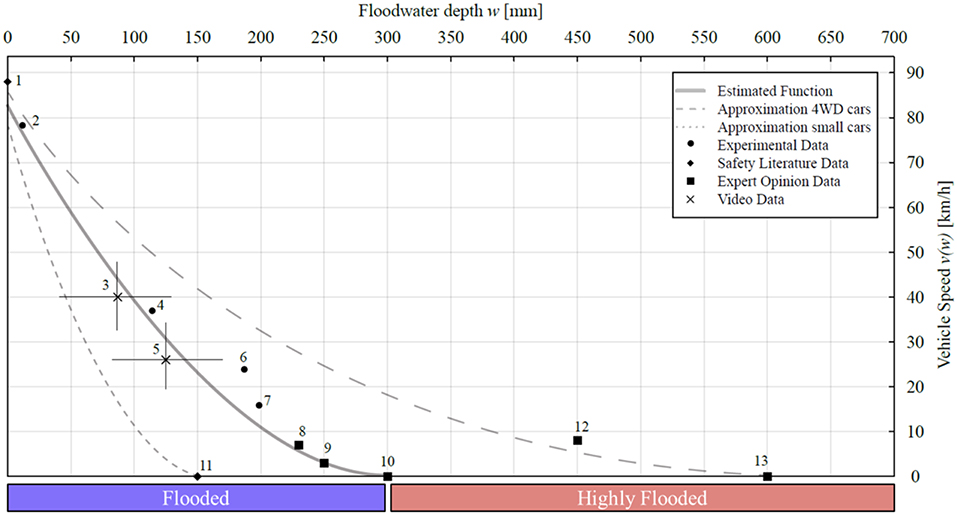
Figure 4. Modeled relationship between flood depth and vehicle speed. Estimated function was used to determine extent of Highly Flooded zones for routing. Figure adapted from Pregnolato et al. (2017).
The coordinate locations of the dispatch and populations sites were used as endpoints for the vehicle routing model, which was built using the open-source OpenRouteService (ORS) navigation service. ORS provides free location based-services generated from user-defined geographic data from OSM. In addition to providing travel routes and navigation information via a graphical front-end, ORS also provides an application program interface (API) for the directions service with a variety of customizable parameters. Among these parameters is an “avoid_polygon” option, which allows users to identify the coordinates of polygon vertices to avoid when calculating the optimal routes (Figure 5). Route information is returned as a GeoJSON object, which includes information on distance (meters), travel time (seconds), and velocity (meters/second) for each segment along the route. Average velocities across an entire route were calculated for use in the decision analytical model by averaging the travel time and distance across each individual segment (see section Decision Analytical Model).
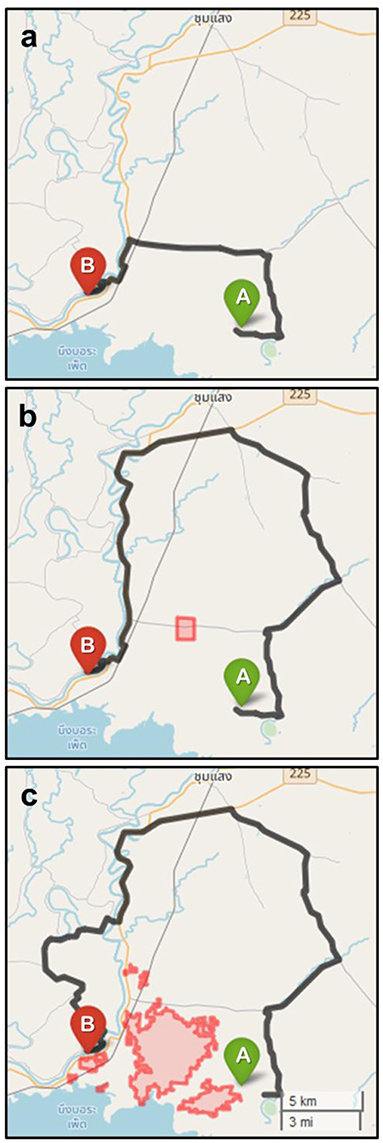
Figure 5. (a) Demonstration of OpenRouteService routing API from origin point A to destination point B. (b) Example of “avoid_polygon” parameter in which the system will route around a user-specified roadblock. (c) Coordinates of the flood vertices used as “avoid_polygon” feature to simulate Highly Flooded areas.
Vehicle routes were generated under both baseline conditions, and in the presence of flood information. Baseline routing simply used the coordinate locations from each of the 10 dispatch centers and found the optimal route to each of the 75 population sites for a total of 750 routes. Of these, a number of the routes resulted in an unsuccessful API response (i.e., no viable route found) and did not return an accompanying GeoJSON. Possibilities for undetermined routes could be due to incomplete road segments not attached to the full network or the lack of a geolocated address at either the start or end points. These were removed from the analysis, resulting in a total of 518 valid routes.
We contrast the baseline routes against those generated using the NRT flood information. In this scenario, we assume the vehicles have been given some advance warning of potentially adverse road conditions and choose to circumvent the most highly impacted regions. Here, we assign the coordinates of the Highly Flooded polygon to the “avoid_polygon” parameter when calculating routes (Figure 5c). Routes which intersect flooded regions are assumed to experience a decrease in velocity for the duration of the impacted road segment. A velocity reduction coefficient, derived from the empirical relationship between flood depth and vehicle velocity, is used to impose slower speeds on impacted routes (Figure 6). Routes which intersect Highly Flooded regions are assumed to experience more severe reductions, modeled here as reductions greater or equal to the 75th percentile of the coefficient distribution.
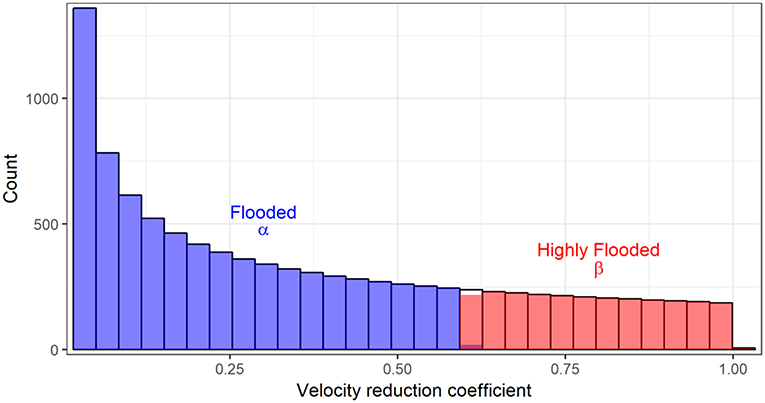
Figure 6. Rate reduction coefficient used to adjust velocity of flooded road segments. Distribution derived from empirical relationship between water depth and vehicle velocity outlined in Figure 4.
For each of the 518 valid route combinations, we evaluate how emergency response vehicles perform both under baseline conditions and with the benefit of NRT Earth observations. To do this we identify the following management objectives:
1. Minimize the length of impacted roads relative to the total route length (O1). The objective function is:
where DF is the “flooded” length, DHF is the Highly Flooded length, and DT is the total route length for each route, r.
1. Minimize the expected value of emergency response time (O2). The objective function is:
In this formulation, μ represents the average velocity for each route, r, while α and β are stochastic rate reduction coefficients which reduce the average velocity by a specified percentage according to the degree of flooding. The E[ ]N notation refers to the expected value for each of r routes over 10,000 uncertain states-of-the-world. We focus on the expected (average) outcome due to its emphasis on classic decision theory, which states that a rational agent will seek to optimize expected utility (Von Neumann and Morgenstern, 1945).
Finally, we perform a one-at-a-time sensitivity analysis to determine how variations in the model parameter inputs affect the objective outcomes (Hamby, 1994). Sensitivity analyses can serve as useful diagnostic tools to identify the parameters that may require additional calibration and to identify potential knowledge gaps. The one-at-a-time method is known as a local sensitivity analysis because it quantifies the extent to which individual parameters influence model output. We perform this analysis by varying individual parameters in isolation while holding all others constant. The isolated parameters are sampled from the 1st to 99th percentile of its prior distribution (Supplementary Figure 2). The results of this analysis then serve to rank the parameters in order of their impact to model variance (Saltelli, 2002).
The geographic distribution of baseline routes differed significantly from the routes that avoided the Highly Flooded areas (Figure 7a). Without any forewarning of possible flood conditions, baseline routes optimized the route for fastest arrival, often taking the most geographically direct path. Doing so, however caused many of the baseline routes to unknowingly intersect Flooded and Highly Flooded road segments. Routes that avoided Highly Flooded areas were an average of 11.1 km longer across all 518 route combinations. That said, by avoiding the Highly Flooded areas, the routes utilizing the satellite-based maps of flood inundation also incidentally avoided much of the less severe Flooded regions. Baseline routes contained an average of 16.6 km of impacted roadway (DF + DHF), while the avoidance routes by definition encountered no Highly Flooded areas (Figure 7b), and contained an average of 8.7 km of Flooded roadway.
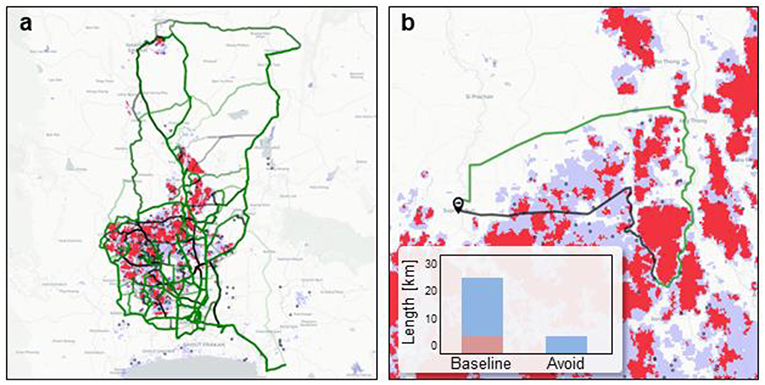
Figure 7. (a) Geographic distribution of routes under baseline conditions (black) and with advance Earth observations (green) with opacity indicating density of routes. (b) Example of single route combination. Inset graph shows relative lengths of Flooded and Highly Flooded roads (blue and red shading, respectively).
The response times for the baseline and avoidance routes showed similar distributions. Baseline routes results had lower minimum and maximum response times than the corresponding avoidance routes, yet the median, mean (expected), and third quartile response times of the avoidance routes were lower than the baseline counterparts (Figure 8). When evaluating for the expected response time over each uncertain SOW, routes that avoided the Highly Flooded regions (and thereby much of the Flooded region as well), were on average ~9 min faster.
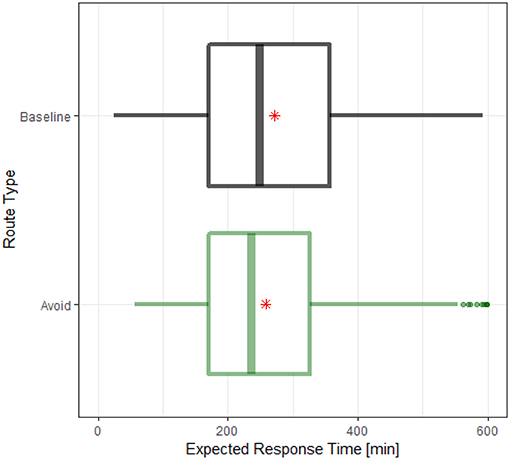
Figure 8. Boxplots of expected (mean) response times across 10,000 states-of-the-world for 518 routes. Red star shows mean values.
The results of the one-at-a-time sensitivity analysis demonstrate which parameters exert the largest influence on the response time objective (Figure 9). The left pane shows the percent of the total model variance attributable to each of the individual parameters, with the width of the colored bars representing the magnitude of the influence. Similarly, the vertical displacement of the curves in the right pane indicate the degree of sensitivity as parameters are varied from the 1st to the 99th percentile of their prior distribution. We see that the rate reduction coefficient for Flooded road segments, α, has the highest degree of influence over the response time objective. The comparatively smaller influence of the Highly Flooded coefficient, β, may be explained by the fact that, on average, Highly Flooded segments only comprised about 2.3% of the total route length. Flooded segments comprised an average of 14% of the total route length, indicating that vehicles were roughly six times more likely to encounter roads that were Flooded but not necessarily ones that were Highly Flooded.
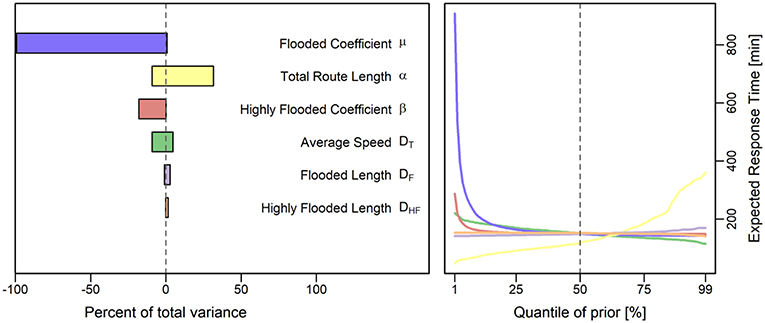
Figure 9. One-at-a-time (OAT) sensitivity analysis for the emergency response time objective. Width of the bars and steepness of curve inclines indicate the degree of sensitivity to each model parameter.
The disaster response scenario described in this study represents a theoretical example of how NRT Earth observations can potentially be used to inform a disaster management decision. When evaluating the social value of that decision, we can relate our management objectives to an established economic metric. In a review of Thai emergency services, Jaldell et al. (2014) investigated the relationship between ambulance response time and mortality to quantify the social benefits of improved emergency operations. They found the value of a 1-min decrease in response time for each dispatch over the course of a year totaled 1.6 billion Thai baht (~$50,500,000 US). While Jaldell et al. (2014) doesn't explicitly consider explore flood disaster scenarios, they found that the greatest monetary savings occurred during medical emergency and traffic accident calls—both scenarios being likely results of extreme flooding. The potential time savings demonstrated in this analysis are highly dependent on the fidelity of the inundation estimates and the choice of velocity reduction coefficient. Yet while the apparent improvements may appear small initially (~9 min, on average), when viewed in aggregate, the economic value of the improved information can result in substantial cost reductions and potential lives saved.
An important component of a NRT flood mapping system, as demonstrated here, is how readily it can be deployed to produce potentially useful information. While geospatial data is increasingly commonplace in disaster response and humanitarian logistics, only a small fraction of studies operationally integrate real- or near-real time data (Özdamar and Ertem, 2015; Yagci Sokat et al., 2016). Some of the variables discussed in this analysis have non-trivial uncertainties (e.g., the depth raster and resulting damage map (see section Caveats and Future Research Needs for a discussion of these limitations). That said, imperfect information—delivered operationally and at a latency determined by regional service providers and disaster responders—may often outweigh more reliable information that comes too late (Eidsvik et al., 2015).
We find that emergency response times are highly dependent on the detected flood inputs, as well as the relationship between estimated inundation depths and vehicle speeds. When accounting for parametric uncertainties and evaluating for model objectives over different route combinations, we find that routes which circumvent the most impacted regions (i.e., Highly Flooded) also avoid additional Flooded regions, resulting in shorter expected response times. The social value of these Earth observations, particularly when evaluated in the context of potential lives saved, can be on the order of millions of dollars annually.
While the results presented here demonstrate the potentially high value of applied satellite information, the analysis has some notable caveats and limitations. One such limitation is the resolution and availability of the data used to generate the flood detection and impact analysis. Because time is a critical factor in any emergency response situation, MODIS imagery was selected to produce the flood detection due to its fast revisit time (twice daily) and low latency (~3 h). An important tradeoff is that the imagery is only of moderate resolution (250-m) and is unable to penetrate cloud cover, making it not as suited for applications requiring high-resolution flood maps. Future implementations of the analysis could feasibly utilize any flood extent—regardless of the sensor used to generate it—providing that imagery is available immediately following the event.
The impact assessment portion of the analysis also includes non-trivial uncertainties. Depth estimates were generated using the MERIT DEM, which improves on many of the sources of error in other global elevation datasets (e.g., vegetation biases, striping, and speckling), yet still has significant errors in vertical accuracy (Yamazaki et al., 2017). The use of open-source materials, including the OpenRouteService routing platform and infrastructure data from OpenStreetMap provide important benefits for accessibility and scalability, yet they often present the challenge of being incomplete and potentially inconsistent. Therefore, the socioeconomic damage map used to identify the potential population sites (Supplementary Figure 1) also has associated uncertainties. Despite this, we find that the provisional damage estimates can still be instructive for identifying areas that may be most highly impacted [for more detail, see the discussion section 5.2—Damage Estimate Validation in Oddo et al. (2018)].
Another broad limitation of this analysis is how it models the complex geophysical and behavioral dynamics inherent in a real-world disaster response scenario. The flood extent used here is currently treated as static. In reality, floods are highly dynamic phenomena, causing inundated areas to change over time. Furthermore, in a real-life scenario there could be a number of compounding factors that could affect vehicle response times during flood conditions. Congestion from other cars due to evacuations, for instance, would likely be a significant factor, particularly in a densely populated area like Bangkok. This analysis only considers road impediments due to flood inundation, whereas other factors (e.g., fallen trees, construction, or downed power lines) would likely also occur.
On the behavioral side, the model contains several simplifying assumptions for how individuals respond to the potentially chaotic conditions during a flood event. For one, it is assumed that the satellite data is the only source of information on regional road conditions, and that this information is able to be communicated readily to emergency responders. In reality, there may be other sources of intelligence available (i.e., radios, satellite phones, or aerial imagery) and the ability to process and transmit flood maps may be impaired. We also make assumptions for how emergency responders utilize the satellite data. Currently, once a driver decides on a specified route (either the most direct route under baseline conditions or when avoiding the Highly Flooded regions), they do not deviate over the course of the trip. A more realistic portrayal would allow a rational driver to continue until encountering an impediment before subsequently choosing to re-route. Finally, we only consider ground transportation as a mechanism for emergency response, whereas a coordinated flood operation would likely involve support through other means (e.g., helicopters or boats).
Due to the assumptions described here, this analysis is not intended to be prescriptive in how to route emergency vehicles in a real-world flood situation. Rather, the results are intended to serve as a didactic example of how applied Earth observations can be operationally combined with econometric data to produce insights for decision-making. Future refinements to this system could include routes constrained by actual emergency vehicle observations, more advanced behavior on the part of the drivers, and a more dynamic treatment of how flooded areas change through time.
The datasets generated for this study are available on request to the corresponding author.
PO and JB conceived and designed the broader research objectives. PO performed the analysis, analyzed the data, and wrote the manuscript. JB provided the funding support, project administration, reviewing/editing, and supervision.
Funding for this work was graciously provided by the NASA Applied Sciences Program.
The authors declare that the research was conducted in the absence of any commercial or financial relationships that could be construed as a potential conflict of interest.
The authors would like to sincerely thank Aakash Ahamed, Joseph Spruce, and members of the Bolten Research Group for exploratory research and thoughtful discussion of this work. The authors would also like to gratefully thank G. Robert Brackenridge for providing a clean version of the flood extent used to produce the study location maps. Support for this study provided by the NASA Applied Sciences Program and SERVIR-Mekong, with data and cooperation from the Asian Disaster Preparedness Center (ADPC).
The Supplementary Material for this article can be found online at: https://www.frontiersin.org/articles/10.3389/fenvs.2019.00127/full#supplementary-material
Ahamed, A., Bolten, J., Doyle, C., and Fayne, J. (2017). “Near real-time flood monitoring and impact assessment systems,” in Remote Sensing of Hydrological Extremes Springer Remote Sensing/Photogrammetry, ed V. Lakshmi (Cham: Springer International Publishing), 105–118. doi: 10.1007/978-3-319-43744-6_6
Ahamed, A., and Bolten, J. D. (2017). A MODIS-based automated flood monitoring system for southeast asia. Int. J. Appl. Earth Obs. 61, 104–117. doi: 10.1016/j.jag.2017.05.006
Alfonso, L., Mukolwe, M. M., and Di Baldassarre, G. (2016). Probabilistic flood maps to support decision-making: mapping the value of information. Water Resour. Res. 52, 1026–1043. doi: 10.1002/2015WR017378
Altay, N., and Green, W. G. (2006). OR/MS research in disaster operations management. Eur. J. Oper. Res. 175, 475–493. doi: 10.1016/j.ejor.2005.05.016
Bernknopf, R., Brookshire, D., Kuwayama, Y., Macauley, M., Rodell, M., Thompson, A., et al. (2017). The value of remotely sensed information: the case of a GRACE-enhanced drought severity index. Weather Clim. Soc. 10, 187–203. doi: 10.1175/WCAS-D-16-0044.1
Brakenridge, G. R., Kettner, A., Policelli, F., and Slayback, D. (2011). NASA-MODIS Rapid Response Record of 2011 Flooding in Thailand. Dartmouth Flood Observatory. Available online at: http://floodobservatory.colorado.edu/RapidResponse/2011ThailandRR.html (accessed January 23, 2019).
Brakenridge, R., and Anderson, E. (2006). “MODIS-based flood detection, mapping and measurement: the potential for operational hydrological applications,” in Transboundary Floods: Reducing Risks Through Flood Management, eds J. Marsalek, G. Stancalie, and G. Balint (Dordrecht: Springer), 1–12. doi: 10.1007/1-4020-4902-1_1
Bratvold, R. B., Bickel, J. E., and Lohne, H. P. (2009). “Value of information in the oil and gas industry: past, present, and future,” in SPE Annual Technical Conference and Exhibition (Anaheim, CA: Society of Petroleum Engineers).
CIESIN (2016). Gridded Population of the World, Version 4 (GPWv4): Population Density. Available online at: http://dx.doi.org/10.7927/H4NP22DQ (accessed November 7, 2018).
Comfort, L. K., Ko, K., and Zagorecki, A. (2004). Coordination in rapidly evolving disaster response systems: the role of information. Am. Behav. Sci. 48, 295–313. doi: 10.1177/0002764204268987
Davies, D. K., Murphy, K. J., Michael, K., Becker-Reshef, I., Justice, C. O., Boller, R., et al. (2015). “The use of NASA LANCE imagery and data for near real-time applications,” in Time-Sensitive Remote Sensing, eds C. D. Lippitt, D. A. Stow, and L. L. Coulter (New York, NY: Springer New York), 165–182. doi: 10.1007/978-1-4939-2602-2_11
Eidsvik, J., Mukerji, T., and Bhattacharjya, D. (2015). Value of Information in the Earth Sciences: Integrating Spatial Modeling and Decision Analysis. Cambridge, UK: Cambridge University Press.
Fayne, J. V., Bolten, J. D., Doyle, C. S., Fuhrmann, S., Rice, M. T., Houser, P. R., et al. (2017). Flood mapping in the lower Mekong River Basin using daily MODIS observations. Int. J. Remote Sens. 38, 1737–1757. doi: 10.1080/01431161.2017.1285503
Gale, E. L., and Saunders, M. A. (2013). The 2011 Thailand flood: climate causes and return periods. Weather 68, 233–237. doi: 10.1002/wea.2133
Goodchild, M. F., and Glennon, J. A. (2010). Crowdsourcing geographic information for disaster response: a research frontier. Int. J. Digit. Earth 3, 231–241. doi: 10.1080/17538941003759255
Hamby, D. M. (1994). A review of techniques for parameter sensitivity analysis of environmental models. Environ. Monit. Assess. 32, 135–154. doi: 10.1007/BF00547132
Haraguchi, M., and Lall, U. (2015). Flood risks and impacts: a case study of Thailand's floods in 2011 and research questions for supply chain decision making. Int. J. Disaster Risk Reduct. 14, 256–272. doi: 10.1016/j.ijdrr.2014.09.005
Haworth, B., and Bruce, E. (2015). A review of volunteered geographic information for disaster management: a review of VGI for disaster management. Geogr. Compass 9, 237–250. doi: 10.1111/gec3.12213
Hodgson, M. E., Davis, B. A., and Kotelenska, J. (2009). “Remote sensing and GIS data/information in the emergency response/recovery phase,” in Geospatial Techniques in Urban Hazard and Disaster Analysis Geotechnologies and the Environment, eds P. S. Showalter and Y. Lu (Dordrecht: Springer), 327–354. doi: 10.1007/978-90-481-2238-7_16
Howard, R. A. (1966). Information value theory. IEEE Trans. Syst. Sci. Cybern. 2, 22–26. doi: 10.1109/TSSC.1966.300074
Howard, R. A. (1968). The foundations of decision analysis. IEEE Trans. Syst. Sci. Cybern. 4, 211–219. doi: 10.1109/TSSC.1968.300115
Howden, M. (2009). “How humanitarian logistics information systems can improve humanitarian supply chains: a view from the field,” in Proceedings of the 6th International ISCRAM Conference (Gothenburg).
Jaldell, H., Lebnak, P., and Amornpetchsathaporn, A. (2014). Time is money, but how much? the monetary value of response time for thai ambulance emergency services. Value Health 17, 555–560. doi: 10.1016/j.jval.2014.05.006
Keller, K., Kim, S.-R., Baehr, J., Bradford, D. F., and Oppenheimer, M. (2007). “What is the economic value of information about climate thresholds?,” in Human-Induced Climate Change: An Interdisciplinary Assessment, eds M. Schlesinger, H. Kheshgi, J. Smith, F. de la Chesnaye, J. M. Reilly, T. Wilson, et al. (Cambridge, UK: Cambridge University Press), 343–354. doi: 10.1017/CBO9780511619472.033
Koks, E. E., Jongman, B., Husby, T. G., and Botzen, W. J. W. (2015). Combining hazard, exposure and social vulnerability to provide lessons for flood risk management. Environ. Sci. Policy 47, 42–52. doi: 10.1016/j.envsci.2014.10.013
Koriche, S. A., and Rientjes, T. H. M. (2016). Application of satellite products and hydrological modelling for flood early warning. Phys. Chem. Earth Parts ABC 93, 12–23. doi: 10.1016/j.pce.2016.03.007
Macauley, M. K. (2006). The value of information: Measuring the contribution of space-derived earth science data to resource management. Space Policy 22, 274–282. doi: 10.1016/j.spacepol.2006.08.003
Mjelde, J. W., Sonka, S. T., and Peel, D. S. (1989). The Socioeconomic Value of Climate and Weather Forecasting: A Review. Champaign, IL: Illinois State Water Survey.
Obersteiner, M., Balkovič, J., Böttcher, H., Bouma, J. A., Fritz, S., Fuss, S., et al. (2017). “The value of global earth observations,” in Satellite EarthObservations and Their Impact on Society and Policy, eds M. Onoda and O. R. Young (Singapore: Springer Singapore, 137–142.
Oddo, P. C., Ahamed, A., and Bolten, J. D. (2018). Socioeconomic impact evaluation for near real-time flood detection in the lower mekong river basin. Hydrology 5:23. doi: 10.3390/hydrology5020023
OpenStreetMap Contributors (2019). OpenStreetMap. Available online at: https://www.openstreetmap.org/ (accessed November 7, 2017).
Ortuño, M. T., Cristóbal, P., Ferrer, J. M., Martín-Campo, F. J., Muñoz, S., Tirado, G., et al. (2013). “Decision aid models and systems for humanitarian logistics. a survey,” in Decision Aid Models for Disaster Management and Emergencies, eds B. Vitoriano, J. Montero, and D. Ruan (Paris: Atlantis Press), 17–44. doi: 10.2991/978-94-91216-74-9_2
Özdamar, L., and Ertem, M. A. (2015). Models, solutions and enabling technologies in humanitarian logistics. Eur. J. Oper. Res. 244, 55–65. doi: 10.1016/j.ejor.2014.11.030
Policelli, F., Slayback, D., Brakenridge, B., Nigro, J., Hubbard, A., Zaitchik, B., et al. (2017). “The NASA global flood mapping system,” in Remote Sensing of Hydrological Extremes Springer Remote Sensing/Photogrammetry, ed. V. Lakshmi (Cham: Springer International Publishing), 47–63. doi: 10.1007/978-3-319-43744-6_3
Pregnolato, M., Ford, A., Wilkinson, S. M., and Dawson, R. J. (2017). The impact of flooding on road transport: a depth-disruption function. Transp. Res. Part Transp. Environ. 55, 67–81. doi: 10.1016/j.trd.2017.06.020
Saltelli, A. (2002). Sensitivity analysis for importance assessment. Risk Anal. 22, 579–590. doi: 10.1111/0272-4332.00040
Shivaprasad Sharma, S. V., Roy, P. S., Chakravarthi, C., Srinivasarao, G., and Bhanumurthy, V. (2017). Extraction of detailed level flood hazard zones using multi-temporal historical satellite data-sets – a case study of Kopili River Basin, Assam, India. Geomat. Nat. Hazards Risk 8, 792–802. doi: 10.1080/19475705.2016.1265014
Von Neumann, J., and Morgenstern, O. (1945). Theory of games and economic behavior. Bull. Amer. Math. Soc. 51, 498–504. doi: 10.1090/S0002-9904-1945-08391-8
Walter, J. (Ed). (2005). World Disasters Report 2005: Focus on Information in Disasters, 1st Edn. Dordrecht; Norwell, MA: Kumarian Press.
Wu, H., Adler, R. F., Tian, Y., Huffman, G. J., Li, H., and Wang, J. (2014). Real-time global flood estimation using satellite-based precipitation and a coupled land surface and routing model. Water Resour. Res. 50, 2693–2717. doi: 10.1002/2013WR014710
Yagci Sokat, K., Zhou, R., Dolinskaya, I. S., Smilowitz, K., and Chan, J. (2016). Capturing real-time data in disaster response logistics. J. Oper. Supply Chain Manag. 9:23. doi: 10.12660/joscmv9n1p23-54
Keywords: value of Information, near real-time, emergency response, applied Earth observations, socioeconomic
Citation: Oddo PC and Bolten JD (2019) The Value of Near Real-Time Earth Observations for Improved Flood Disaster Response. Front. Environ. Sci. 7:127. doi: 10.3389/fenvs.2019.00127
Received: 01 June 2019; Accepted: 16 August 2019;
Published: 03 September 2019.
Edited by:
Daniel Eric Irwin, Marshall Space Flight Center (NASA), United StatesReviewed by:
Guy Jean-Pierre Schumann, University of Bristol, United KingdomCopyright © 2019 Oddo and Bolten. This is an open-access article distributed under the terms of the Creative Commons Attribution License (CC BY). The use, distribution or reproduction in other forums is permitted, provided the original author(s) and the copyright owner(s) are credited and that the original publication in this journal is cited, in accordance with accepted academic practice. No use, distribution or reproduction is permitted which does not comply with these terms.
*Correspondence: Perry C. Oddo, cGVycnkub2Rkb0BuYXNhLmdvdg==
Disclaimer: All claims expressed in this article are solely those of the authors and do not necessarily represent those of their affiliated organizations, or those of the publisher, the editors and the reviewers. Any product that may be evaluated in this article or claim that may be made by its manufacturer is not guaranteed or endorsed by the publisher.
Research integrity at Frontiers

Learn more about the work of our research integrity team to safeguard the quality of each article we publish.