 Athanasios Votsis
 Riina Haavisto
- Socio-economic Impact Research Group, Finnish Meteorological Institute, Helsinki, Finland
The concept of urban DNA has been frequently utilized to describe how a set of urban growth parameters may encode the manner in which cities evolve in space and the spatial forms they assume as they do so. The five growth coefficients of the SLEUTH (Slope, Land-use, Exclusion, Urban, Transport, Hillshade) cellular automaton model of land use change and urban growth are often seen as an operationalization of urban DNA. For both theoretical urban studies and applied urban modeling, it is important to further develop this concept by understanding whether main urban DNA classes relate to distinct outcomes in terms of livability and sustainability. This study initiates this line of research by gathering empirical evidence about urban DNA and livability-sustainability indicators across a global sample of cities. It produces a behavioral taxonomy of cities according to their urban DNA and performance in livability and sustainability indices and indicators, and attempts a further link with the concept of urban commons. The results show that, notwithstanding variation across cities, it is possible to distinguish six such types of cities with relatively distinct behaviors and performances: multinodal, dispersed cities, with mixed outcomes (type A); multinodal, contiguous, slow-growing (type B); transport-oriented, dispersed, fast-growing (type C); large, buzzy, constrained (type D); dense, contiguous, fast-growing (type E); and transport-oriented, contiguous, interactive (type F) cities.
Introduction
In 2018, almost 55 percent of the world's population lived in urban areas and the number is projected to 68 percent in 2050 (UN DESA, 2018). As cities will most likely continue to be the home of the majority of people, it is important to ensure that they are as livable as possible also for the future generations, whereas the extent to which the twenty-first century will be sustainable largely depends on the sustainability of cities (Ahern, 2011). Various spatial planning approaches offer guidance to sustainable cities (e.g., Jabareen, 2006; Ahern, 2011; Shen et al., 2011; Calthorpe, 2013; Hajer et al., 2015) and empirical models are valuable in assessing whether the normative elements of those approaches have the intended effects in practice (Echenique et al., 2012; Geertman et al., 2013; Pelzer et al., 2014). However, there are numerous challenges in bridging normative with empirical urban models (Batty, 2004; Brooks et al., 2012; Pelzer et al., 2015), as well as in the policy integration of multiple sustainability objectives (Shen et al., 2011; Le Blanc, 2015).
This paper utilizes “urban DNA,” an integrative notion that bridges empirical urban modeling with normative urban inquiries, in order to understand whether there are kinds of cities—and spatial planning strategies—that lead to distinct outcomes with respect to livability and sustainability. The paper aims to develop a behavioral taxonomy of cities by operationalizing their urban DNA and exploring the performance of city types in a variety of livability and sustainability indicators and indices. The paper also aims to provide support in transitioning from empirical but overly technical planning approaches toward ones that are still empirical but consider wider sustainability and livability perspectives, therefore facilitating normative but evidence-based discussions about urban sustainability. We also include elements of management of the urban commons, as the consideration of governance in sustainable planning is lacking (see e.g., Shen et al., 2011). The rest of sections Introduction, Theory and Assumptions discuss urban DNA, livability, and sustainability from the aforementioned perspectives. Section Methods and Data overviews the data and methods, while sections Results and Discussion, Concluding Remarks discuss the resulting taxonomy.
Livability is a relative (subjective) concept often measured with quality of life (QoL) indicators that account for well-being, although there seems to be no universal definition for livability. Another important aspect in urban evolution is sustainability. While it is argued that cities cannot be sustainable, they are still key to sustainability (Rees and Wackernagel, 1996; Ahern, 2011). Sustainability is often explained by the three pillars concept, in which social, economic, and environmental aspects determine a system's sustainability and how it ensures that the becoming generations are served as well [US Environmental Protection Agency (EPA), 2012]. Furthermore, The United Nations (2015) defines sustainable development holistically by considering the social, economic, and environmental dimensions of sustainability and the planetary boundaries to support the needs of present and future generations. Most nations are indeed committed to the 17 sustainable development goals (SDG's) that aim to end poverty and hunger as well as reach responsible production and consumption by 2030, with SDG 11 being explicit about making “cities and human settlements inclusive, safe, resilient, and sustainable” (with cities being fora for other SDG's, too). As sustainable development needs to consider different values and goals by a great variety of stakeholders, critique and debates are essential part of the evolution of the concept (Kates et al., 2005). It can be argued that sustainability (and/or sustainable development) can be seen as one cross-cutting element contributing to urban livability, because its fundamental aim, regardless of the debates on its definition, is still to ensure that there are enough resources to assure well-being in near and farther future, as well as consider a wide range of aspects contributing to QoL in cities. Kates et al. (2001) suggest that sustainability science research “must be focused on the character of nature-society interactions” and “on our ability to guide those interactions along sustainable trajectories.” Thinking about the urban context, cities face economic, ecological, political, and cultural crises that all have a role to play in sustainability discussions, and there are many paradoxical elements that are driving quick solutions rather than planning for long term sustainability (James, 2014). In order to make good urban places, urban planning needs to be equally broad and well-considered, at least from the economics, ecology, politics and culture perspectives (James, 2014).
Several of the resources provided to people by cities can be common pool resources, which in economics are defined as goods that can be used by several users simultaneously, but the amount or availability of the resource to other users, diminishes by every unit that an individual user subtracts. Common pool resources are usually managed jointly by a group of users. In urban contexts, common pool resources might be roads and other infrastructure or parks and other green spaces that are accessible to all citizens. They might also be indoor spaces, cars, or city bikes that are used collectively by citizens or specific user groups. Furthermore, the urban atmosphere made by people of the city can also be an urban commons (Borch and Kornberger, 2015). The classical issue affiliated to common pool resources is free-riding, leading to a “tragedy of commons” (Hardin, 1968); this is not always the case, however, as common resources can also be managed jointly and sustainably in social-ecological systems (SES) (Ostrom, 2007, 2009). While common pool resources have typically been addressed in natural resource management, they can also be applied, to some extent, in urban contexts, since they can have both subtractive and non-subtractive characteristics (Hess and Ostrom, 2007) and in the case of urban commons they can be collectively managed (Foster, 2011). For instance, the right to manage urban green space is a key element of urban green commons regardless of the ownership domain of the land (Colding et al., 2013). While it is fair to say that urban commons are more complex than small SES developed around a single natural resource use, the governance aspects of considering sustainable and livable city development should not be overlooked (cf. Shen et al., 2011; Hajer et al., 2015). The urban commons and their relation to the common pool resource frameworks of Hardin (1968) and Ostrom (2007, 2009) have been critically subject in recent literature (e.g., Borch and Kornberger, 2015; Foster and Iaione, 2015). Yet urban open-access resources in fixed locations (e.g., streets and sidewalks) could still be managed cooperatively without excessive propertization (Garnett, 2011). Recent research has also considered, for instance, urban social-ecological innovations, more specifically the collective (and spontaneous) approaches (e.g., civic ecology and urban community gardens), as a new form of urban governance, which are a valuable resource allowing production and adaptive management of local ecosystems such as green spaces (Dennis and James, 2018). Governance of the urban commons requires considerations of sustainability, because the aim is to save the resource also for the next user. In practice, the governance may be arranged in different ways, but is often guided by cultural and social norms, meaning for example social acceptability and pressure on not to overuse the resource. In particular, the emergence of urban green commons supports cities in their transformation toward sustainability and livability because they help to reconnect people and environment and facilitate both reorganization of cities and dealing with societal crises (Colding et al., 2013). Planning of livable and sustainable cities could benefit from adding one extra layer to the planning process: by thinking how the urban commons are managed and allowing for other than top-down approaches, the cities may have better chances to increase their own livability in light of multicultural and versatile citizen groups.
The notion of urban DNA linked with livability and sustainability indicators helps to explore how fundamental spatial development drivers may result in different livability and sustainability conditions. As planning systems have a notable influence through local political networks that are shaping urban policy (Mazza and Rydin, 1997), such knowledge allows to explore what characteristics enable sustainable/livable urban trajectories. Urban (or sometimes regional) DNA is an analogy to biological DNA: it consists of urban growth coefficients, similar to how proteins compose biological DNA. It is a theoretical, but operationalizable, construct that, together with outside pressures such as planning regimes, will result in varying livability and sustainability outcomes. Urban DNA was initially discussed in the contexts of urban growth and quantitative urban modeling (e.g., Batty and Longley, 1994; Silva, 2004; Wilson, 2008), but the notion has recently found resonance also in normative spatial design (D'Acci, 2014). Batty and Longley (1994) discuss that urban growth processes encode rules that dictate how the organization and repetition of elementary socio-spatial entities achieves certain urban forms and urban functions across scales. Wu and Silva (2011) discuss that a hypothetical urban DNA should include both spatial and non-spatial genes, and that it should reflect both drivers of urban growth and institutional responses to it. With respect to the latter, Marshall (2007) notes that, unlike how biological DNA plays out in natural selection, biological variation and evolution, urban DNA will have a pronounced feature of deliberate intervention. D'Acci (2014) takes a somewhat different approach, focusing not on how growth drivers and institutional behavior constructs urban DNA, but on how spatial planners could synthesize a genotype that equalizes disparities in the spatial distribution of the benefits and negative externalities of urban agglomerations. D'Acci furthermore notes that a pronounced feature of urban DNA should be the balancing of cooperation and competition, a theme that is common in governance of the commons; cf., for instance, Haavisto et al. (2018) about the role of regulation, cooperation, and competition in land use and natural resource management. Urban DNA has been operationalized via a widely used planning support system, the SLEUTH (Slope, Land-use, Exclusion, Urban, Transport, Hillshade) cellular automaton model of urban growth and land use change, by describing how different mixes of modeled urban growth coefficients encode how a growing city interacts with its environment to produce different urban forms. This approach can bridge the gap between technocratic models of land use, growth, and infrastructure on one hand, and social inquiries into the experienced urban environment on the other, therefore helping to assess a more complete view of the effects of planning paradigms and interventions on urban sustainability and livability.
Theory and Assumptions
Urban form, urban growth, and the spatial arrangement of resources and activities are central in planning sustainable cities (Ahern, 2011; Echenique et al., 2012; Calthorpe, 2013). How those elements are handled by markets and planning institutions have been shown to affect various aspects of living conditions on which the SDG's are focusing, from socioeconomic conditions to the production and consumption of resources and the state of the urban environment (see e.g., Glaeser and Gottlieb, 2009; Brueckner, 2011; Perino et al., 2014). Empirical urban models can serve as support systems that guide planners in understanding how their practices affect sustainability in actuality (Echenique et al., 2012; Geertman et al., 2013). This section provides a theoretical discussion that links the modeling of urban spatial dynamics to the notion of urban DNA and to indicators of livability and sustainability.
Operationalizing Urban DNA
The growth and densification of cities is facilitated by the social and economic benefits that people (households and firms) achieve when locating near to each other. These are usually termed agglomeration benefits and, although they are not a clearly defined set of indicators (Mills et al., 2000), they stem from the sharing of common infrastructure, proximity of specialized labor to employers and of consumers to firms, sharing of knowledge and innovations, safety, and social-cultural diversity. Knowledge and resource spillovers seem to be the binding feature of agglomeration economies (cf. Mills et al., 2000). In that context, the growth of an urban area, horizontally (i.e., urban expansion) and vertically (i.e., increased density), as well as its land use patterns, have been shown to be driven by a few market fundamentals. Population size, income level, interest rates, taxation, and risks drive demand for the use of space and its rent, asset prices, and supply of new buildings (DiPasquale and Wheaton, 1996; Brueckner, 2011). At finer scales, the way overall growth is distributed in geographical space is further driven by factors such as the transport network, services, environmental, cultural, and historical amenities, as well as the level of negative externalities (DiPasquale and Wheaton, 1996; Brueckner et al., 1999). Urban growth behavior at the macro- and micro-scale is further influenced (regulated, facilitated, or constrained) by urban governance. In fact, governance is typically seen as the key factor in the successful handling of the negative consequences of urban growth, that is, negative externalities such as noise, air pollution, congestion, loss of green spaces, and socio-spatial inequality (Brueckner, 2011).
Attempts to operationalize urban DNA circle around a few common elements that echo the urban economic view: connectivity, accessibility, and mobility; land use and natural amenities; geographical distribution of socioeconomic costs and benefits, as well as of capital stock, infrastructure, resources, and activities (e.g., Wu and Silva, 2011; D'Acci, 2014). The most empirically-oriented urban DNA studies have focused on the five growth coefficients of the SLEUTH cellular automaton model as the clearest operationalization of urban DNA (Silva and Clarke, 2005; Gazulis and Clarke, 2006) or, at least, as components of it (Wu and Silva, 2011), which appears reasonable, given that the model captures the urban economic view in a way that is enough flexible and assumption-free to offer an attractive framework for translating the theoretical concept of urban DNA to operationalizable parameters. In this case, the parallelism with biological DNA stems from the fact that a given numerical mixture of the five coefficients encodes how a city will interact with natural and manmade factors as it grows, so as to produce particular urban forms. Additionally, Gazulis and Clarke (2006) showed that urban DNA, operationalized via the SLEUTH coefficients, can be used to produce a behavioral taxonomy of cities, the classes of which exhibit consistent temporal and spatial growth patterns.
The SLEUTH model is a spatially and temporally resolved cellular automaton model that takes into account elements of the aforementioned behavior of growing cities, and can be trained to reproduce the past amount and form of urban growth and produce forecast scenarios of it (Clarke et al., 1997; Clarke and Gaydos, 1998; Candau, 2002; Jantz et al., 2003). The model operationalizes four types of growth: diffusive, new spreading center, edge, and transport-influenced. Diffusive, or spontaneous, growth simulates the appearance of new urban cells unrelated and non-contingent to pre-existing infrastructure, while new spreading center growth simulates the likelihood of those spontaneous urban cells expanding. Edge growth simulates the urbanization of non-urban cells that are contingent to existing urban areas, while road influenced growth simulates the spreading of urban areas along major transport corridors. These four types of urban growth are controlled by five growth coefficients that range from 0 to 100: the diffusion (D), breed (B), spread (S), slope resistance (SR), and road gravity (RG) coefficients.
• The diffusion, or dispersion, coefficient controls the frequency that a cell will be randomly selected for possible urbanization due to spontaneous growth.
• The breed coefficient controls the probability that a cell that became urban due to spontaneous growth will also become a new spreading center.
• The spread coefficient controls the probability that a new spreading center will generate additional urban areas.
• The slope resistance coefficient affects all five growth types and controls the extent to which urbanization overcomes areas with steep topography or is contained within relatively flat topographies.
• The road gravity coefficient controls road influenced growth and relates to the area of influence of transport infrastructure as an urbanization driver.
It should be noted that these coefficients and types of growth they imply echo the considerations in research about the influence of spatial planning on sustainability; compare, for instance, the parameters evaluated in Echenique et al. (2012), Shen et al. (2011), or Jabareen (2006).
Livability and Sustainability Indicators
Indicators are qualitative or quantitative measures that aim to inform us about the state and development of political, economic, social, technological, legal, and environmental systems. They can be used for monitoring changes in the surrounding systems and to inform decisions, for example in urban planning and policy making (see e.g., Shen et al., 2011; Hiremath et al., 2013 for sustainability indicators in urban planning). In this paper we look especially into livability and sustainability of cities.
Livability is often measured with QoL indicators accounting for well-being. Quality of life can be approached from different perspectives such as lives and capabilities (e.g., health), tradition, relativism, and objectivity (e.g., social meaning), women's lives and gender justice (e.g., norms) and policy assessment and welfare economics (e.g., standard of living) (Nussbaum and Sen, 1993). For instance, a strategic urban planning process that includes participatory methodology is an important way to enhance quality of living in cities (Khalil, 2012). Livability is also addressed in city planning and urban design, for instance as part of community development (Hoch et al., 2000), land use planning (Kaiser et al., 1995), street design (Appleyard, 1981), and local economic development planning (Blair, 1995). Jane Jacobs' paradigm-setting work (Jacobs, 1961; Campbell and Fainstein, 2003) was an attack on technocratic planning, calling for a refocus of the planning discipline to the lived experience of cities and urban space.
As sustainability is often understood via the three pillars concept, sustainability indicators are then measures of environmental, social, or economic aspects relevant for the continuation of human and environmental well-being [US Environmental Protection Agency (EPA), 2012]. Sustainability indicators can be important for informing processes of learning and adaptation (note: adaptation in this context does not refer to climate change) in urban governance (Pupphachai and Zuidema, 2017) as well as for informing the urban planning (Shen et al., 2011). Sustainability indicators also help to reveal the differences across cities regarding the specific goals (Hiremath et al., 2013). They are manifestations of local processes' interconnections and they have potential to expand our understanding of local sustainability (Turcu, 2013). Furthermore, the sustainability indicators can support adaptive governance if they are accessible and understandable, focus on policy performance and watching trends, and are communicated within and outside government organizations (Pupphachai and Zuidema, 2017). In her integrated set of urban sustainable indicators (Turcu, 2013, p. 707) considers the institutional dimension as one addition to the three pillars (social, economic, environmental) of sustainability.
While indicator is a measure of a specific factor, index is a combination (or a mathematical formula) of a variety of factors. Kaklauskas et al. (2018) list various systems for assessing the sustainability of a city, e.g., Monocle's QoL Survey, Mercer's Quality of Living Ranking (Quality of Living Index), EIU's Global Liveability Ranking, European Green City Index, City Blueprint, European Green Capital Award, Global City Indicators Programme and Quality of Life Index. In addition, there is also the Sustainable Society Index (SSI) which consists of indicators accounting for economic, environmental, and human well-being (Sustainable Society Foundation, 2017). As the list shows, livability and sustainability indicators can overlap but also have common ground, at least when it comes to the social aspect of sustainability.
For this study, we selected the following indices for representing the different dimensions of livability and sustainability in cities (Table 1). In case of national indices each city had a value of its country.
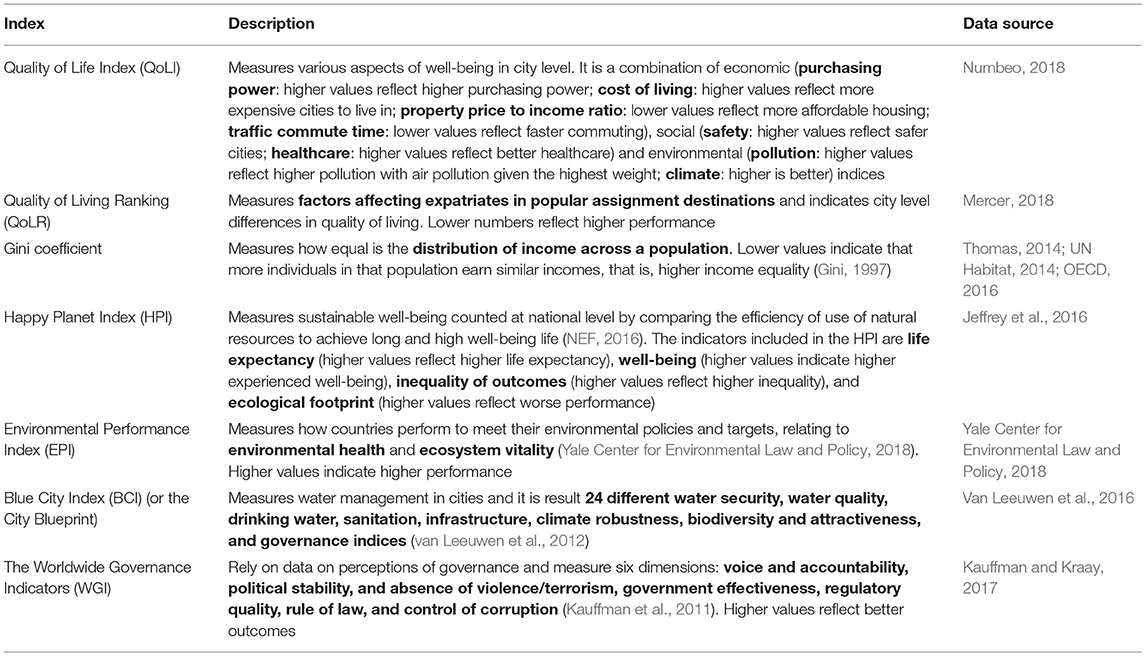
Table 1. Livability and sustainability indices used in the analysis.
Urban DNA and Sustainability-Livability
The urban economic mechanisms captured in SLEUTH are formed by more fundamental social drivers, such as societal values and moral outlooks, habits, and beliefs (Toivonen and Viitanen, 2015). Calibrated SLEUTH coefficients can reproduce the consequences of those latent factors, as seen in patterns of growth and of use of space. This red thread from latent social drivers, to growth drivers, and finally to consequences of how growth is realized allows the study of two distinct elements: firstly, an association of distinct growth behaviors (classes) to distinct performances in sustainability and livability (indicators) and, secondly, a more theoretical association of growth behaviors to attitudes toward the urban commons.
More specifically, if our understanding of urban DNA allows the notion of its modification over time, what is clear from sections Operationalizing Urban DNA, Livability and Sustainability Indicators is that urban DNA can encode both the physical manner in which a city grows in space and the social attitudes and responses—individual or institutional—to evolving urban agglomerations (cf. Batty and Longley, 1994; Gazulis and Clarke, 2006; Wu and Silva, 2011; D'Acci, 2014; Votsis, 2017). If we see the latter as referring to governance of urban commons, then it is clear that urban DNA communicates something about growth patterns in urban space and at the same time gives hints about the governance of urban commons. Such a viewpoint is grounded in long-standing theories in human geography and urban-architectural studies, holding that social norms and values affect the production and use of urban space, and in turn (but not in that order) urban space influences social norms and values (Eco, 1986; Hillier and Hanson, 1988; Habraken, 1998; Toivonen and Viitanen, 2015). It is also grounded in operational planning support systems, which focus on the co-evolution of land use, infrastructure, and urban economic activity (e.g., Anas, 2013; Echenique et al., 2013; Geertman et al., 2013). A behavioral taxonomy of cities (cf. Gazulis and Clarke, 2006) can be thus constructed by relating SLEUTH's urban growth coefficients to the indicators discussed in section Livability and Sustainability Indicators. This would serve the purpose of moving beyond a mere description of urban shapes and their drivers, firstly, toward an understanding of how different modes of growth associate to experienced urban space and, secondly, toward a better understanding of how different models of growth relate to different attitudes toward governance of the urban commons. This line of inquiry enhances the idea of urban DNA, because it enables urban planners to understand how operational planning support tools can be used to evaluate a richer set of implications of simulated scenarios. It furthermore enables to explore empirically the hypothesis that different types of cities might be inherently (by behavior) related to different sustainability profiles. Lastly, it adds a social behavioral dimension to the capacity of cellular automata urban models to reproduce known city forms and optimize those forms (Batty, 1997).
Methods and Data
The approach of this study is to develop clusters that are statistically driven (see section Cluster Analysis), via the SLEUTH coefficients as an operationalization of urban DNA, and subsequently interpret those clusters via several livability and sustainability indicators, so that a behavioral taxonomy of cities can be developed (see section Development of the Behavioral Taxonomy). More specifically, this study follows Silva and Clarke (2005); Gazulis and Clarke (2006) and elements of Wu and Silva (2011) by operationalizing urban DNA as the five coefficients of the SLEUTH model. Although their prevailing name is “growth” coefficients, the specifications of the model (see Clarke and Gaydos, 1998; Candau, 2002) show that when calibrated to reproduce observed urbanization, they—in addition to driving modeled growth—capture a wider set of underlying market and planning behaviors (Votsis, 2017). In other words, the information contained in the calibrated SLEUTH coefficients is diverse enough (a feature found in other artificial intelligence approaches, too; see Chollet, 2018) to produce a wider classification of how cities may behave as they grow, which can serve as a ground for a taxonomy. Sustainability and livability indicators do not determine in this study the classification, but are used as external information to interpret the clusters' livability and sustainability; thus arriving at a behavioral taxonomy.
Cluster Analysis
Gazulis and Clarke (2006) developed an “urbanization behavioral taxonomy” by applying the growth coefficients of a sample of 20 cities around the world to an experimental setup (a single pixel along a road line on a sloping valley with predefined constraints) and clustering the resulting urban forms after 100 years of simulated growth. They note that their classification represent clusters of cities with sufficient urbanization similarities and similar growth rates in each cluster. Their study reports representative cities for each class, but does not mention in full what cities belong to each of their taxonomy classes. They described their classes as follows. Transportation network dependent growth (e.g., Oahu), which exhibits exponential decay in growth rates but has pronounced annual variability during the first 30 years. Little to no growth regions (e.g., Houston and San Joaquin Valley), with pronounced annual variation in growth rates. Slope resistant growth regions (e.g., Tampa/S Florida) with exponential decay of growth that, however, does not reach zero by the end of the simulation period. Full built-out growth (e.g., Santa Barbara), also mentioned as sprawling in the paper, with exponential decay the first 75 years of growth and leveling-off afterwards. A few types in the taxonomy produced in this paper echo these classes.
This paper builds on the approach of Gazulis and Clarke (2006) but produces a classification of cities according to their mix of growth coefficients (the operationalization of urban DNA), without evaluating the impact of those coefficients on an idealized experimental setup. The reason is that the behavior implied by the concept of urban DNA is wider than that reflected in urban growth alone, and the mix of growth coefficients reflects a wider set of behaviors than growth. The method used is to first produce a taxonomy of cities by applying a k-means clustering algorithm (Forgy, 1965; Lloyd, 1982; Pedregosa et al., 2011) to their five growth coefficients, so that clear clusters of urban DNA can be identified. The k-means algorithm divides a set of N observations X into K clusters C, so that the squared deviation of a cluster's members from the cluster's mean is minimized through the objective function where J is the objective function being minimized, j is the number of clusters, is observation i in cluster j, and cj the mean of cluster j. The produced clusters were validated through an analysis of variance for the cluster means vs. the whole sample means for each of the five SLEUTH coefficients.
Development of the Behavioral Taxonomy
The next step is to interpret the produced clusters by exploring how each of them stands out from the rest in terms of livability and sustainability measures (see sections Livability and Sustainability Indicators and Data). The interpretation of the first step's k-means classification in this second step produces a behavioral taxonomy of cities, which is near to the original concept of Gazulis and Clarke (2006), but includes an enriched understanding of urban behavior. The behavioral taxonomy is therefore developed without letting the livability and sustainability indicators influence the classification process described in section Cluster Analysis, but interpreting the classification through the information represented in the indicators. This sequential approach follows the mentality found in machine learning applications, which is to minimize information flows between training and testing (Chollet, 2018).
Data
The analysis has used a sample of 21 cities around the world (Table 2), sourced from the SLEUTH repository (Gigalopolis, 2018); the coefficients from Helsinki were sourced from Votsis (2017). The criteria for selecting those cities were, firstly, that their growth coefficients calculated by SLEUTH (urban DNA) are published in peer-reviewed articles or in non-peer-reviewed research reports and, secondly, that livability and sustainability indicators or indices are available specifically for each city, or in some cases (HPI, EPI, WGI) for the national level.
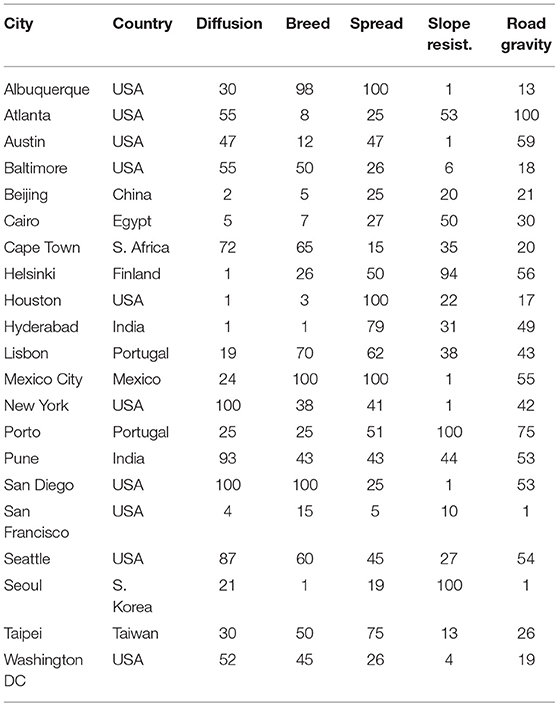
Table 2. The analyzed cities and their SLEUTH coefficients.
QoLI, QoLR, Gini, and a number of additional measures of growth (population growth rate), size (population), and use of space (population density, meters of street per person, average street length) were selected to represent city-specific performance surrounding livability, well-being, and sustainability, whereas HPI, EPI, and WGI represent the national context. Table 1 in section Livability and Sustainability Indicators describes these indicators and Table A in the Supplementary Material provides summary statistics for the sample. A two-axis classification heuristic was also used in the interpretation. This was developed so that the x-axis represents the deviation of each city i from the sample's average meters of street per person, formally , whereas the y-axis represents the deviation of each city from the sample's average population density in persons/km2, formally . This produced four categories, representing four combinations of street-efficient/inefficient and dense/sparse cities. This heuristic was not let to influence the k-means clustering procedure, but the represented information was instead used during the process of interpreting the clusters, together with the indicators mentioned in sections Livability and Sustainability Indicators and Table A, due to its capacity to separate the cities in a rather clear-cut manner.
Results and Discussion
Clusters
The k-means clustering of SLEUTH's growth coefficients produced six clusters, each of which exhibits largely consistent behavior in terms of diffusion, breed, spread, slope resistance, and road gravity. Table 3 describes the mix of coefficient values for each cluster. An analysis of variance (ANOVA) for the five coefficients verified the statistically significant separation of clusters, yielding the following p-values: 0.000 for diffusion; 0.000 for breed; 0.000 for spread; 0.017 for slope resistance; and 0.010 for road gravity.
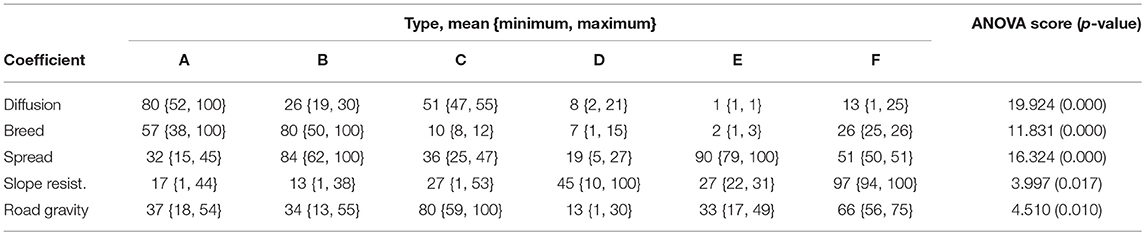
Table 3. Growth coefficient statistics for each city type.
Species of Cities
The classification of cities according to their mix of SLEUTH coefficients and subsequent association of the clusters with livability, sustainability, spatial form, growth, size, and use of space indicators produced a behavioral taxonomy of six city types. These are described below, whereas Table 4 and Figure 1 summarize their main features.
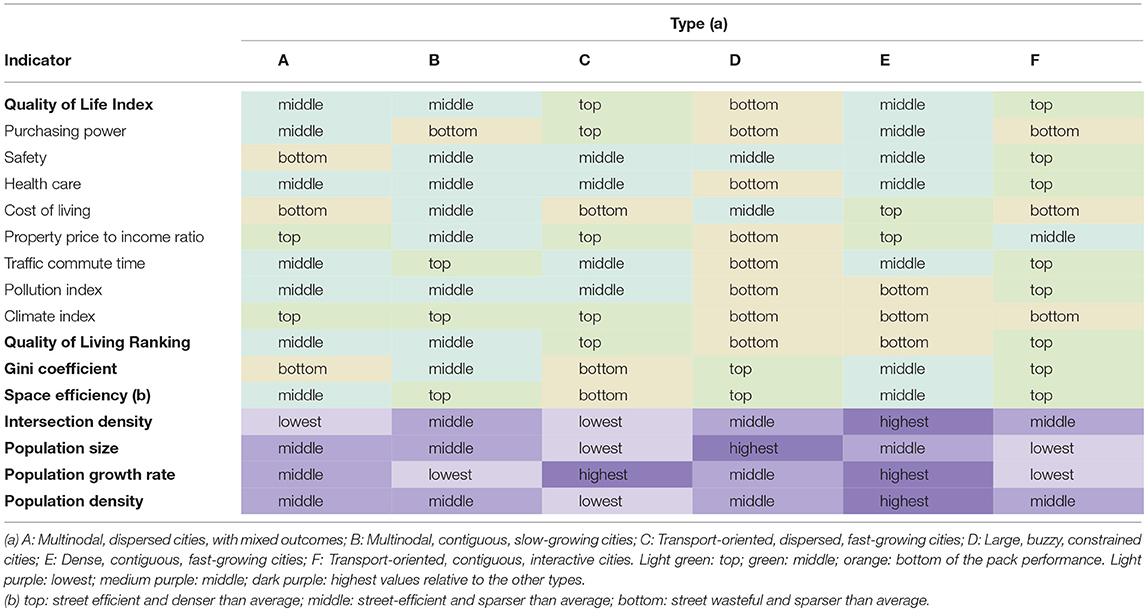
Table 4. Livability, sustainability, and spatial form statistics for each city type.
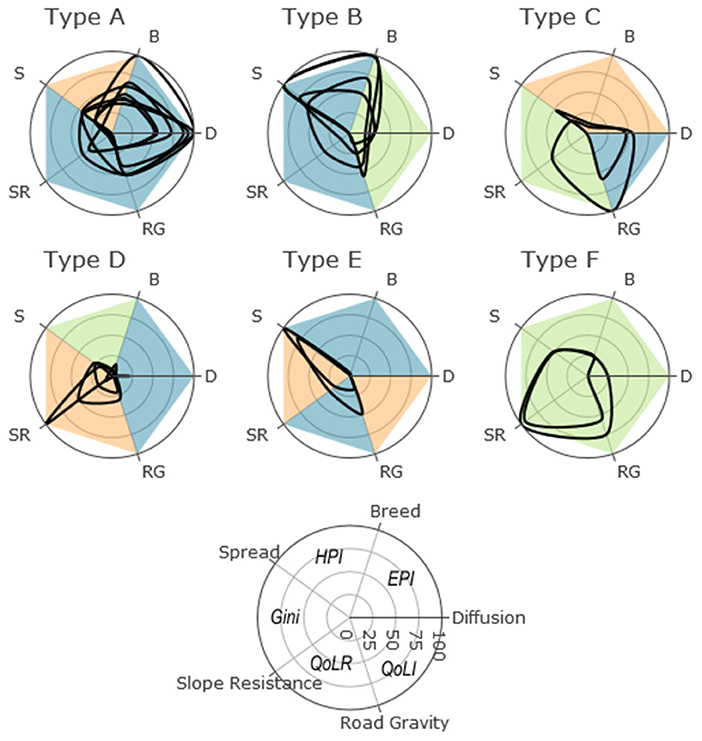
Figure 1. Urban DNA mixture in each city type of the taxonomy. The black spider-web lines represent the DNA of the cities of each type; D, diffusion; B, breed; S, spread; SR, slope resistance; RG, road gravity. The colored background layers represent how each cluster manages in five indicators, starting from D counterclockwise: QoLI, QoLR, Gini, HPI, and EPI; orange: bottom, blue: middle, green: top of the pack.
Type A: Multinodal, dispersed cities, with mixed outcomes. Baltimore, Cape Town, New York, Pune, San Diego, Seattle, and Washington DC. Cities whose growth is driven by diffusion or a combination of diffusion and breed, which implies non-contiguous, multicentric spatial growth. This type ranks third in QoLI, distinguished by low safety and high cost of living indices (negative characteristics), but also by low property price to income ratio and high climate indices (positive characteristics). It ranks third also in the mean QoLR and exhibits high mean Gini coefficient (high income inequality). As a rule it has low space efficiency, meaning it is less dense than average with large length of streets per inhabitant.
Type B: Multinodal, contiguous, slow-growing cities. Albuquerque, Mexico City, Lisbon, Taipei. Cities whose growth is driven by breed and spread, which implies contiguous expansion with potential for multicentric growth. This type is characterized by low population growth rate and high space efficiency (denser than average with fewer meters of street per inhabitant). This type exhibits relatively high property price to income ratio index, but does not show clear distinguishing features in the rest of QoL indicators (large variance and mid-of-the-range mean values of the indicators). Its mean quality of living ranking is situated right in the middle of all groups, as is its Gini coefficient.
Type C: Transport-oriented, dispersed, fast-growing cities. Atlanta and Austin. Cities whose growth is strongly driven by road gravity and somewhat by diffusion, implying transport-oriented growth with potential sprawl. This type is characterized by low population size and density and by high population growth rate, as well as by space inefficiency (lower than average density and higher than average length of street per inhabitant) and low intersection density. It exhibits the highest mean QoLI, having the highest purchasing power, lowest property price to income ratio, and high climate indicators (positive features), but also high cost of living (negative feature). Its transport-oriented nature of growth does not appear to set it apart from the rest of the city types in terms of their traffic commute time and exhibits relatively low average pollution index. It ranks the second highest in QoLR and displays the second highest Gini coefficient.
Type D: Large, buzzy, constrained cities. Beijing, Cairo, San Francisco, and Seoul. Cities whose growth is driven by an equal but low participation of all coefficients, sometimes with high slope resistance, implying highly constrained or regulated growth. This type is characterized by large population size and mid-range population growth rate and density, as well as by street efficiency (smaller than average length of street per inhabitant and denser than average). It has the lowest mean QoLI in the taxonomy, having among the lowest purchasing power, health care, and climate indicators, and among the highest property price to income ratio, pollution, and commute time indicators (all negative characteristics). It exhibits the second lowest mean QoLR. It, however, also claims low income inequality, having the second lowest Gini coefficient.
Type E: Dense, contiguous, fast-growing cities. Hyderabad and Houston. Cities whose growth is driven by spread, which implies contiguous expansion. This type is characterized by high population density, population growth rate, and intersection density, but does not display any distinguishable pattern in terms of space efficiency. It exhibits the second lowest QoLI, having the second highest commute time index, highest pollution index, and lowest climate index (negative characteristics), but also having the lowest cost of living index and second lowest property price to income index (positive characteristics). It also exhibits the lowest mean QoLR and middle-of-the-pack Gini coefficient.
Type F: Transport-oriented, contiguous, interactive cities. Helsinki and Porto. Cities whose growth is driven by combination of high values of road gravity and spread, with very high slope resistance, meaning transport-oriented but contiguous expansion. This type is characterized by small population size and low population growth rate, as well as by high street efficiency (lower than average length of street per inhabitant and somewhat lower than average population density). It exhibits the second highest QoLI, having the second lowest purchasing power, cost of living, and commuting time indices, the highest safety index, as well as high healthcare index (positive features), but also second highest property price to income ratio index and low purchasing power index (negative features). It also exhibits the highest QoLR and lowest Gini coefficient.
In summary, type A stands out in terms of its highest income inequality in the taxonomy, although it is third best in home-owning affordability. Type B stands out with the second fastest commute time and the slowest population growth in the sample. Type C stands out as the top in QoLI, purchasing power, home-owning affordability, second lowest pollution, highest population growth, second highest income inequality, and smallest population size. Type D stands out as the last in QoLI, purchasing power, home-owning affordability, commute time, pollution, second worst QoLR, second best income equality, and large population size. Type E stands out as the second best in home-owning affordability, last in pollution, highest population growth, worst QoLR, and large population size. Type F stands out as the second best in QoLI, top in safety, commute time, pollution, income equality, and QoLR, second slowest population growth, and smallest population size.
Types C and F perform the best overall; they are both characterized by transport-oriented growth, which is interesting given the intense arguments, both pro and contra, concerning this mode of growth. What distinguishes the two types from each other is, the tendency to realize growth along transport routes in either a dispersed (type C) or contiguous (type F) manner and, furthermore, social features: income inequality, affordability, space efficiency. This may suggest that an urban form that encourages or discourages social contact in public space seems to be a distinguishing feature between the two, echoing commonly discussed distinctions between US and European planning paradigms. From these two types it can also be seen that success, in this case livability and sustainability, is reflected in the high cost of living there, which is in line with urban economic theory. Type B also performs rather well in all main indices, and the main characteristic is its middle of the pack or good performance, avoiding too bad or too good values. It echoes some characteristics of types C and F, namely moderate population size, slow population growth rate, and high space efficiency. Type D exhibits rather equal income distribution and high space efficiency, but is at the bottom of performance in more indicators than any other type. This may suggest that increased socioeconomic equality and social contact alone are not sufficient for achieving good livability or sustainability performance. However, it should also be noted that type D cities also capture great versatility in terms of indicator results as the variance is big in the majority of the indicators. Another interesting aspect of the results is the relationship between QoLI/QoLR and Gini coefficient. For instance, Type C ranks highest in QoLI and second highest in QoLR but has unequal income distribution on contrary to Type D having lowest QoLI and second lowest QoLR but still rather equal income distribution. This could be an indication of social cohesion: type C cities present more class society structure than type D. Concerning type A, it should be noted that New York City is perhaps an exception in city form metrics, as it is denser than the average description of that particular class. Given the fact that NYC does appear compatible with the other aspects of its type, this highlights the fact that a taxonomy should not be seen as implying identical cities; it rather indicates plurality among distinguishable clusters. Type E is standing out as the dense, fast-growing type that has good economic performance (low cost of living and affordable home-owning status), but average or low performance in the other aspects.
The above details illustrate that, when it comes to observed performance, there can be incompatibilities between some of the SDG's, notably those between dimensions of wealth and affordability and environmental dimensions. This echoes the results of Shen et al. (2011), who showed that comprehensive urban plans with high compliance with environmental sustainability indicators also exhibit low compliance with the social and economic dimensions (e.g., the plans of Mexico City and Barcelona). The notion of urban DNA adds an interesting aspect to this, because it implies that, although some cities perform overall better in sustainability and livability, a few structural incompatibilities may remain. As the idea of urban DNA implies, different types of cities originate from fundamentally different ways in which cities grow, and the resolution of such incompatibilities should not be taken as given. While progress has been made regarding SDG 11 and many national urban policies that support sustainable urbanization have been implemented (United Nations, 2018), in light of our results it seems that transitioning to sustainable cities will still entail difficult trade-offs, which is in line with Jabareen (2006) who demonstrated that a set of alternative sustainable city paradigms demonstrate non-trivial differences in key spatial planning choices. However, as Ahern (2011) notes, this is not necessarily a problematic aspect, as cities need to move from notions of fail-safe sustainability practices toward notions of diversity and redundancy (“safe-to-fail”).
The results also confirm a few key elements noted elsewhere in the literature concerning the relation of urban form to sustainability. Firstly, it appears that the notion of the compact city, although promising as a normative design concept (Calthorpe, 2013), is not enough to promote sustainable cities: type C is a high performer but has drivers that realize dispersed growth; whereas, although types F and B are high performers and grow in a contiguous manner, they are characterized by other important aspects, such as slow growth rate (in both cases), multinodal form (type B), or social interaction (in both cases). Thus, it can be noted, in line with Echenique et al. (2012) and Williams (2005), that the notion of compact cities is not unconditionally sustainable; additional factors have to be in place. Secondly, transport-oriented growth appears in this analysis to encourage good performance in a more clear-cut manner: the top performing types in the taxonomy are those with a pronounced influence of the transport network on the location and shape of urban growth. Interestingly, the analysis indicated that transport-oriented growth might affect positively sustainability-livability performance via a wider influence on spatial behavior than just commuting: a clear example is that type C is a transport-oriented type with long commuting times, but otherwise top performance in the other aspects; in other words, transport considerations in spatial planning for sustainability are essential (cf. Williams, 2005), because transport affects more than just commuting behavior. These highlight that the debate between compact vs. dispersed cities does not have a clear-cut winner concerning sustainability, since a lot of other aspects can render either spatial planning paradigm unsustainable or sustainable and livable or unlivable; see for instance similar discussions in Echenique et al. (2012) about compactness vs. dispersion policies and Anas (2012) about the potential efficiency of sprawl.
Lastly, while cultural and governance aspects are only latent in the city-level indicators, a few preliminary ideas about the urban commons can be drawn based on the results. High space efficiency, population density, and intersection density might enable and encourage interactions between people and thus result in greater number of social contact and more collective action regarding urban commons. Furthermore, public spaces and services are often located in intersections or otherwise accessible locations hinting greater possibilities for social interactions. We assume that economic mentality (private vs. public) of the city is also one denominator of urban commons. For example, sparsely populated and low space efficiency cities such as Type C have in addition, assumedly, strong sense of private ownership of space and hence not a strong urban commons mindset. These cities might also have low competition over land, which might also indicate that there is no pressure to arrange management of urban commons such as green spaces based on collective action. In turn, type B, D, and F cities have very different DNA but are top performers in space efficiency, middle in population density and middle in intersection density, which could imply them having good basis for urban commons even though the indicators of this study do not tell the whole story. These indications should be read in the context of literature that shows that bottom-up social factors are important achieving sustainable cities; on one hand, reflecting citizens' environmental priorities in urban plans (Shen et al., 2011) and, on the other hand, moving away from the idea that top-down planning can alone achieve cities that meet the SDG's (Hajer et al., 2015).
The National Context
Figure 2 summarizes the distribution of countries and continents in the taxonomy. Type C is fully composed by US cities, whereas type A is 70 percent composed by US cities. Type F is fully composed by European cities. The other types have more diverse members in terms of countries, although it can be noted that cities from Asia, Africa, and Central America are found only in types A, B, D, and E.
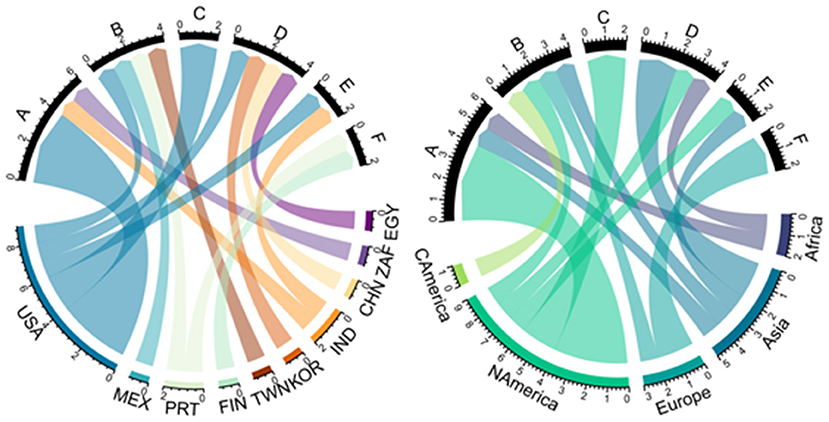
Figure 2. The distribution of countries (left) and continents (right) in the taxonomy.
The national indicators suggest that well-performing city types are found in countries with similarly good performance in livability and sustainability dimensions; for instance, types containing exclusively European and US cities rank the highest in most of the national indicators (Table 5). This is not so trivial, pointing to the notion of continuity in attitudes and performance across geographical scales: the national context matters in establishing well-performing urban areas, which may relate to top-down urban and regional policies, but also to the general attitudes of a country to human settlement. This confirms Le Blanc (2015) who calls for tight policy integration between the SDG's—in this case, policy integration of spatial hierarchies or levels of governance.
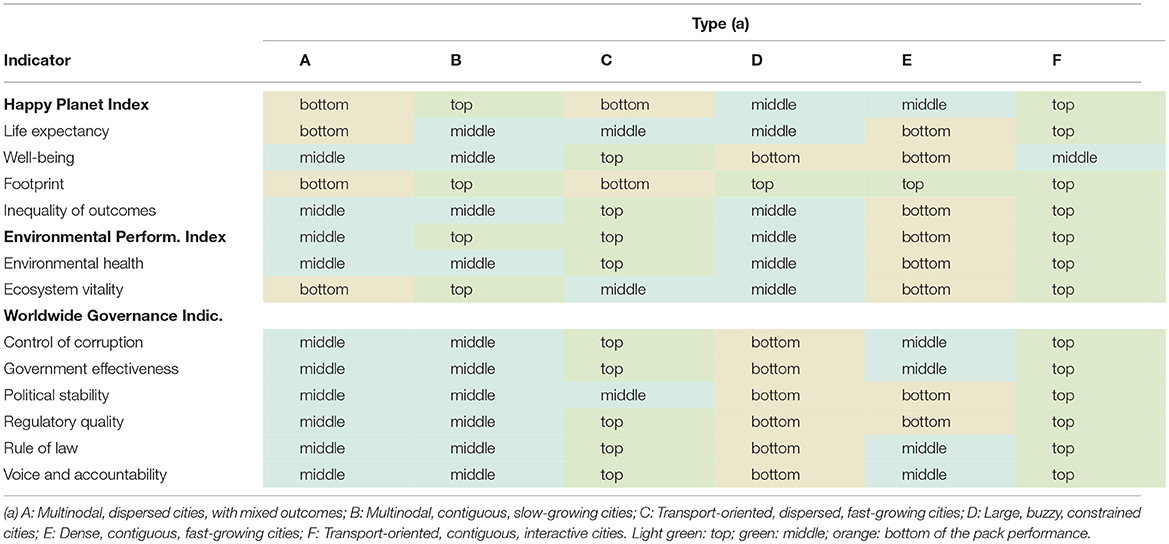
Table 5. Country-level indicators for the city types.
A few finer details are also discernible. Types C and F stand out from the rest in terms of their high ranking in the overall EPI (and its environmental health component), in terms of corruption control, voice accountability and rule of law (parts of the WGI), and in terms of the lowest inequality index (component of the HPI). Type F is distinguished from type C by a number of features. Firstly, type F exhibits the highest ranking (together with type B) in the HPI, while type C, together with type A, the lowest ranking. Especially, type F stands out with the highest life expectancy component of the HPI. Secondly, type F ranks the highest in political stability (part of the WGI), whereas type C is located near the middle of the pack; furthermore, while both types rank the highest in voice accountability (also part of the WGI), type F is clearly higher than type C. On the other hand, type C stands out in terms of highest footprint but also highest well-being in the HPI. The rest of the types do not exhibit a clear differentiation. Type D does rank consistently low in the WGI, especially compared to types F and C. Types B, D, F rank somewhat higher in ecosystem vitality (component of the EPI), type C is clearly in the middle of the pack, and types E and A rank the lowest.
The country-level indicators describe governance and sustainability aspects in more detail than the city-level indicators. However, strong conclusions about urban commons are still difficult to draw. Intuitively thinking, at least footprint, ecosystem vitality, government effectiveness, and voice and accountability might enable urban commons mentality or encourage bottom-up initiatives for managing the commons. For instance, small footprint (top performance) and high EPI might indicate that sustainability in general is to some extent considered in society and high performance in governance indicators as government effectiveness could imply good practices in management of commons—both bottom-up and top-down. Based on the city-level results it looked like Type B, D, and C could have a good basis for urban commons. As the country-level indicators for the Type B and F are mostly in middle or top categories, this idea gets support, but for Type D the national indicators are mostly bottom and middle. Furthermore, Type C cities have top performance in most country-level indicators, which could be a sign of urban commons mentality, on contrary to the thought based on city-level indicators.
Challenges and Limitations
This study confirms both the urban DNA and indicators literature that show a comparison between cities is limited by notable differences and variability amongst their dynamics and characteristics (see e.g., Kauffman et al., 2011; Wu and Silva, 2011), with Fox (2017/2013) showing that the challenges go deep at the levels of ontology and definition, measurement, and reproducibility. In SLEUTH the delineation of the modeled urban area is not standardized between studies, whereas it is fair to say that the indicators, although collected from official sources with published and robust methodologies, are likely affected by differences in measuring the same nominal variable in different cities, relating, for instance, to differences in data reporting and collection, as well as different ways of delineating the extents of the city. The main effect of variability in this study has been difficulty in clustering the cities and subsequently building a behavioral taxonomy around the clusters. The absence of local versions of some insightful indicators, as well as the unavailability of certain local indicators for some of the cities in our sample is also a limitation. Urban DNA/SLEUTH modeling and urban indicators have been evolving quite separately from each other. It is therefore challenging to firstly compile a sample of cities with reported data for both urban DNA and indicators; ideally, we would have liked a larger sample of cities to analyze, which would also be more balanced in terms of global geography. Similarly, the classification method can be improved with a larger sample available, although the current clusters are statistically significant (for instance, it would avoid the only supervised modification of the k-means clusters, the reassignment of Seoul). Secondly, Gini coefficients and Quality of Living Ranking for a few cities of the sample were not available; in the former case the missing observations were imputed with the national average, and in the latter case missing observations were left as is. Moreover, Blue City Index data for most of the sampled cities were not available, which severely limited understanding of how urban DNA might relate to aquatic ecosystems and water resource management. Nevertheless, notwithstanding the aforementioned limitations, the produced behavioral taxonomy does exhibit consistency between the different types and manages to reflect fundamental differences in both how cities grow in space and in their livability, well-being, or sustainability aspects. Although the number of urban DNA types and methodology of producing them can be approached in other ways than in this study, larger sample and more indicators will be able to further refine the produced knowledge. The discussed results should be approached by also keeping in mind, firstly, that a large part of the sample consists of US cities and, secondly, that many of the non-western cities of the sample are large- or megacities from developing countries. Moreover, the fact that many US and European cities are performing the highest in the discussed indicators should be approached by keeping in mind a possible bias of such indicators toward western viewpoints regarding urban living. Lastly, not being able to assess urban commons precisely with the selected indicators is a limiting factor, but should be also seen as a result: indicators should be developed that measure how people connect and interact in physical and social urban space, as well as how they manage urban commons.
Concluding Remarks
Planning support systems are helpful tools toward sustainable cities (Geertman et al., 2013; Pelzer et al., 2014); in particular, spatially and temporally resolved models that can empirically reproduce observed urban processes and simulate the effects of policy interventions on these processes (Batty, 1997; Echenique et al., 2012). However, it has also been noted that such tools ought to incorporate (sociopolitical) planning aspects as thoroughly as they reflect more technical aspects (Pelzer et al., 2015). Moreover, from the viewpoint of urban theory and planning practice, one needs to understand how optimizing urban processes via technical models affects objectives of livability and sustainability, as well as whether there are kinds of cities that are inherently more sustainable or livable than others. In other words, planning sustainable and livable cities will benefit from planning support systems that have more interpretive power. This study has aimed to enrich the concept of urban DNA by discussing what different species of cities entail for livability and sustainability, as well as the governance of urban commons. To accomplish that, six clusters of cities were produced according to their mix of SLEUTH growth coefficients, which is an operationalization of urban DNA. These clusters were then associated to various livability and sustainability indicators in order to move toward a behavioral taxonomy of different species of cities. The results show that, although classifying cities is a challenge due to diversity in both drivers and indicators, a separation of cities by their growth coefficients does lead to a taxonomy with distinguishable performances in various indicators. Empirical evidence therefore confirms the importance of looking into the details of urban form and urban growth for planning sustainable cities (Echenique et al., 2012) and encourages the discussion of urban DNA that, while based on growth dynamics, tells also something about the effect that these dynamics may have on livability and sustainability.
In summary, the analysis has identified a behavioral taxonomy of six city types: multinodal, dispersed cities, with mixed outcomes (type A) and multinodal, contiguous, slow-growing cities (type B), transport-oriented, dispersed, fast-growing (type C), and transport-oriented, contiguous, interactive cities (type F), large, buzzy, constrained cities (type D), and dense, contiguous, fast-growing cities (type E). Types C and F are top performers in livability and sustainability; they are both characterized by transport-oriented growth, but differ in social cohesion parameters, presumably connected to differences between US and European planning paradigms. Small sized cities with controlled population growth seem to be favoring livability and sustainability, whereas large, fast growing, and oftentimes affordable cities do not seem to perform as well. The above is in line with urban economic theory showing that successful cities tend to be expensive to live in, and—in the absence of a good urban commons mentality—need good planning interventions to prevent this from becoming detrimental to their success. Similarly, it can be suggested from the analysis that there are types of cities that have a pronounced conflict in “behavioral identity,” in the sense that they either perform well in some indicators and bad in others (notably environmental vs. socioeconomic), or they do not show any distinguishable performance; this aspect of performance trade-offs is in line with comprehensive planning trade-offs as found in Shen et al. (2011). In terms of urban commons, it is clear that additional indicators are needed to capture cultural and governance aspects more accurately. However, the study does indicate that urban forms that encourage or discourage social contact (proxied here through population density, share of street length per inhabitant, and intersection density) may be a relevant parameter in the discussion of urban commons and contributes to the development of the taxonomy (cf. Shen et al., 2011; Hajer et al., 2015 about the importance of bottom-up social dynamics in achieving SDG's). An open methodological question remains about the operationalization of urban DNA. As noted in earlier sections, some studies have seen the SLEUTH's five growth coefficients as the urban DNA, other studies have seen urban DNA as a mix of consequences of growth and SLEUTH's five coefficients, while other studies have discussed urban DNA as a mixture of properties of the society living in a city. This analysis shows that a sequential approach is promising, that is, starting from drivers of urban evolution to classify cities, and only afterwards moving on to interpreting the consequences of those drivers. Which drivers of urban evolution comprise urban DNA is a matter of argumentation, but SLEUTH offers advantages, because it captures a comprehensive set of drivers that echo urban theory, are easily implementable in diverse empirical contexts, and are compatible with concepts discussed in sustainability research.
Overall, the analysis shows that (i) handling particular trade-offs, (ii) considering socio-spatial aspects, and (iii) fine-tuning the drivers of urban growth and form have the capacity to render different planning paradigms sustainable or unsustainable and livable or unlivable. Without looking at these details, debates about generic paradigms such as compact vs. dispersed cities do not offer something substantial to the urban sustainability debate. The notion of urban DNA offers an evidence-based framework to help planners assess the effects of fine-tuning such details, but in order to further integrate the concept into urban theory and urban planning research, future studies on this concept will need to strengthen the link between drivers of growth and corresponding performance in livability and sustainability dimensions. To achieve this, firstly, a larger amount of empirical data needs to be collected that capture both urban DNA and city-scale indicators for a greater number of cities than currently available. Secondly, a greater diversity of locally measured, city-scale indicators is needed in order to capture additional aspects of livability and sustainability. Lastly, it is crucial that research on urban DNA distinguishes causes of growth from their effects, better connecting the concept to available knowledge in environmental and urban economics.
Author Contributions
All authors listed have made a substantial, direct and intellectual contribution to the work, and approved it for publication.
Funding
Project URCLIM is part of ERA4CS, an ERA-NET initiated by JPI Climate, and funded by FORMAS (SE), DLR (DE), BMWFW (AT), IFD (DK), MINECO (ES), ANR (FR), Finnish Academy (FI) with co-funding by the European Union (Grant 690462).
Conflict of Interest Statement
The authors declare that the research was conducted in the absence of any commercial or financial relationships that could be construed as a potential conflict of interest.
Supplementary Material
The Supplementary Material for this article can be found online at: https://www.frontiersin.org/articles/10.3389/fenvs.2019.00004/full#supplementary-material
References
Ahern, J. (2011). From fail-safe to safe-to-fail: sustainability and resilience in the new urban world. Landsc. Urban Plan. 100, 341–343. doi: 10.1016/j.landurbplan.2011.02.021
Anas, A. (2012). “The efficiency of sprawl,” in The Oxford Handbook of Urban Economics and Planning, eds N. Brooks, K. Onaghy, and G. J. Knaap (New York, NY: Oxford University Press), 123–149.
Anas, A. (2013). A summary of the applications to date of RELU-TRAN, a microeconomic urban computable general equilibrium model. Environ. Plan. B Plan. Des. 40, 959–970. doi: 10.1068/b38206
Batty, M. (1997). Cellular automata and urban form: a primer. J. Am. Plan. Assoc. 63, 266–274. doi: 10.1080/01944369708975918
Batty, M. (2004). Dissecting the streams of planning history: technology versus policy through models. Environ. Plan. B Plan. Des. 31, 326–330. doi: 10.1068/b3103ed
Batty, M., and Longley, P. (1994). Fractal Cities. A Geometry of Form and Function. London: Academic Press.
Blair, J. P. (1995). Local Economic Development: Analysis and Practice. Thousand Oaks, CA: Sage Publications Inc.
Borch, C., and Kornberger, M. (eds.). (2015). Urban Commons: Rethinking the City. New York, NY: Routledge.
Brooks, N., Donaghy, K., and Knaap, G.-J. (2012). The Oxford Handbook of Urban Economics and Planning. New York, NY: Oxford University Press.
Brueckner, J. K., Thisse, J.-F., and Zenou, Y. (1999). Why is central Paris rich and downtown Detroit poor? An amenity-based theory. Eur. Econ. Rev. 43, 91–107. doi: 10.1016/S0014-2921(98)00019-1
Campbell, S., and Fainstein, S. (2003). Readings in Planning Theory. Malden, MA: Blackwell Publishing.
Candau, J. T. (2002). Temporal Calibration Sensitivity of the SLEUTH Urban Growth Model. Master's thesis, University of California, Santa Barbara.
Clarke, K. C., and Gaydos, L. (1998). Loose-coupling a cellular automaton model and GIS: long-term urban growth prediction for San Francisco and Washington/Baltimore. Int. J. Geogr. Info. Sci. 12, 699–714. doi: 10.1080/136588198241617
Clarke, K. C., Gaydos, L., and Hoppen, S. (1997). A self-modifying cellular automaton model of historical urbanization in the San Francisco Bay area. Environ. Plan. B 24, 247–261. doi: 10.1068/b240247
Colding, J., Barthel, S., Bendt, P., Snep, R., van der Knaap, W., and Ernstson, H. (2013). Urban green commons: insights on urban common property systems. Glob. Environ. Change 23, 1039–1051. doi: 10.1016/j.gloenvcha.2013.05.006
D'Acci, L. (2014). Urban DNA for cities evolutions. Cities as physical expression of dynamic equilibriums between competitive and cooperative forces. arXiv:1408.2874 [cs.CY].
Dennis, M., and James, P. (2018). Urban social-ecological innovation: implications for adaptive natural resource management. Ecol. Econ. 150, 153–164. doi: 10.1016/j.ecolecon.2018.04.005
DiPasquale, D., and Wheaton, W. C. (1996). Urban Economics and Real Estate Markets. Englewood Cliffs, NJ: Prentice Hall.
Echenique, M. H., Grinevich, V., Hargreaves, A. J., and Zachariadis, V. (2013). LUISA: a land-use interaction with social accounting model; presentation and enhanced calibration method. Environ. Plan. B Plan. Design 40, 1003–1026. doi: 10.1068/b38202
Echenique, M. H., Hargreaves, A. J., Mitchell, G., and Namdeo, A. (2012). Growing cities sustainably. J. Am. Plan. Assoc. 78, 121–137. doi: 10.1080/01944363.2012.666731
Eco, U. (1986). “Function and sign: semiotics of architecture,” in The City and the Sign: An Introduction to Urban Semiotics, eds M. Gottdiener and A. Lagopoulosm (New York, NY: Columbia University Press), 55–86.
Forgy, E. W. (1965). Cluster analysis of multivariate data: Efficiency versus interpretability of classifications. Biometrics 21, 768–769.
Fox, M. S. (2017/2013). “A foundation ontology for global city indicators,” in Global Cities Institute Working Paper No.3, (University of Toronto). Available online at: http://eil.mie.utoronto.ca/wp-content/uploads/2015/06/GCI-Ontology-v10.pdf.
Gazulis, N., and Clarke, K. (2006). Exploring the DNA of our regions: classification of outputs from the SLEUTH model. ACRI 2006, 462–471. doi: 10.1007/11861201_54
Geertman, S., Stillwell, J., and Toppen, F. (eds.). (2013). Planning Support Systems for Sustainable Urban Development. Berlin: Springer.
Gigalopolis (2018). SLEUTH Applications (Repository). Available online at: http://anteater.geog.ucsb.edu/gig/SLEUTHapplications.html (Accessed December 12, 2018).
Glaeser, E. L., and Gottlieb, J. D. (2009). The wealth of cities: agglomeration economies and spatial equilibrium in the United States. J. Econ. Lit. 47, 983–1028. doi: 10.1257/jel.47.4.983
Haavisto, R., Santos, D., and Perrels, A. (2018). Determining payments for watershed services by hydro-economic modeling for optimal water allocation between agricultural and municipal water use. Water Res. Econ. doi: 10.1016/j.wre.2018.08.003. [Epub ahead of print].
Hajer, M., Nilsson, M., Raworth, K., Bakker, P., Berkhout, F., de Boer, Y., et al. (2015). Beyond cockpit-ism: four insights to enhance the transformative potential of the sustainable development goals. Sustainability 7, 1651–1660. doi: 10.3390/su7021651
Hardin, G. (1968). The tragedy of the commons. Science 162, 1243–1248. doi: 10.1126/science.162.3859.1243
Hess, C., and Ostrom, E. (2007). Understanding Knowledge as a Commons. Cambridge, MA: The MIT press.
Hillier, B., and Hanson, J. (1988). The Social Logic of Space. Cambridge, UK: Cambridge University Press.
Hiremath, R. B., Balachandra, P., Kumar, B., Bansode, S. S., and Murali, J. (2013). Indicator-based urban sustainability—a review. Energy Sustain. Dev. 17, 555–563. doi: 10.1016/j.esd.2013.08.004
Hoch, C. J., Dalton, L. C., and So, F. S. (2000). The Practice of Local Government Planning. Washington, DC: International City/County Management Association.
Jabareen, Y. R. (2006). Sustainable urban forms: their typologies, models, and concepts. J. Plan. Educ.Res. 26, 38–52. doi: 10.1177/0739456X05285119
James, P. (2014). Urban Sustainability in Theory and Practice: Circles of Sustainability. New York, NY: Routledge. doi: 10.4324/9781315765747
Jantz, C. A., Goetz, S. J., and Shelley, M. K. (2003). Using the SLEUTH urban growth model to simulate the impacts of future policy scenarios on urban land use in the Baltimore-Washington metropolitan area. Environ. Plan. B Plan. Design 30, 251–271. doi: 10.1068/b2983
Jeffrey, K., Wheatley, H., and Abdallah, S. (2016) The Happy Planet Index: 2016. A Global Index of Sustainable Well-Being. London: New Economics Foundation.
Kaiser, E. J., Godschalk, D. R., and Chapin, F. S. (1995). Urban Land Use Planning. Urbana; Chicago, IL: University of Illinois Press.
Kaklauskas, A., Zavadskas, E. K., Radzeviciene, A., Ubarte, I., Podviezko, A., Podvezko, V., et al. (2018). Quality of city life multiple criteria analysis. Cities 72, 82–93. doi: 10.1016/j.cities.2017.08.002
Kates, R. W., Clark, W. C., Corell, R., Hall, J. M., Jaeger, C. C., Lowe, I., et al. (2001). Sustainability science. Science 292, 641–642 doi: 10.1126/science.1059386
Kates, W. R., Parris, T. M., and Leiserowitz, A. A. (2005). What is sustainable development? Goals, indicators, values, and practice. Environ. Sci. Policy Sustain. Dev. 47, 8–21. doi: 10.1080/00139157.2005.10524444
Kauffman, D., and Kraay, A. (2017). The Worldwide Governance Indicators, 2017 Update. Aggregate Governance Indicators 1996-2016. Available online at: http://info.worldbank.org/governance/wgi/index.aspx#home (Accessed August 8, 2018).
Kauffman, D., Kraay, A., and Mastruzzi, M. (2011). The worldwide governance indicators: methodology and analytical issues. Hague J. Rule Law 3, 220–246. doi: 10.1017/S1876404511200046
Khalil, H. A. E. E. (2012). Enhancing quality of life through strategic urban planning. Sustainable Cities Soc. 5, 77–86. doi: 10.1016/j.scs.2012.06.002
Le Blanc, D. (2015). “Towards integration at last? The sustainable development goals as a network of targets,” in DESA Working Paper 141 (New York, NY: United Nations Department of Economic and Social Affairs).
Lloyd, S. P. (1982). Least squares quantization in PCM. IEEE Trans. Inf. Theory 28, 129–137. doi: 10.1109/TIT.1982.1056489
Marshall, S. (2007). “Urbanism in evolution: New urbanism and beyond,” in Proceedings of the Congress for the New Urbanism (Austin, TX). Available online at: https://www.cnu.org/sites/default/files/smarshall_cnu16.pdf (Accessed December 20, 2018).
Mazza, L., and Rydin, Y. (1997). Urban sustainability: discourses, networks and policy tools. Prog. Plan. 1, 1–74. doi: 10.1016/S0305-9006(96)00006-2
Mercer (2018). MercerQuality of Living Ranking 2018. Available online at: https://mobilityexchange.mercer.com/Portals/0/Content/Rankings/rankings/qol2018l852963/index.html (Accessed October 23, 2018).
Mills, E. S., Epple, D., and Oates, W. E. (2000). A thematic history of urban economic analysis. Brookings Warton Papers Urban Affairs 1–52. doi: 10.1353/urb.2000.0008
NEF (2016). Happy Planet Index 2016: Methods Paper. Available online at: https://happyplanetindex.org/s/Methods-paper_2016-48te.pdf (Accessed October 23, 2018).
Numbeo (2018). Quality of Life Index 2018. Available online at: https://www.numbeo.com/quality-of-life/rankings.jsp (Accessed October 23, 2018).
Nussbaum, M., and Sen, A. (eds.). (1993). The Quality of Life. Oxford: Clarendon Press. doi: 10.1093/0198287976.001.0001
OECD (2016) Making Cities Work for All: Data and Actions for Inclusive Growth. Paris: OECD Publishing.
Ostrom, E. (2007). A diagnostic approach for going beyond panaceas. Proc. Natl. Acad. Sci. U.S.A. 104, 15181–15187. doi: 10.1073/pnas.0702288104
Ostrom, E. (2009). A general framework for analyzing sustainability of social-ecological systems. Science 325, 419–422. doi: 10.1126/science.1172133
Pedregosa, F., Varoquaux, G., Gramfort, A., Michel, V., Thirion, B., Grisel, O., et al. (2011). Scikit-learn: machine learning in python. J. Mach. Learn. Res. 12, 2825–2830.
Pelzer, P., Arciniegas, G., Geertman, S., and Leneferink, S. (2015). Planning support systems and task-technology fit: a comparative case study. Appl. Spat. Anal. 8, 155–175. doi: 10.1007/s12061-015-9135-5
Pelzer, P., Geertman, S., Van der Heijden, R., and Rouwette, E. (2014). The added value of planning support systems: a practitioner's perspective. Comp. Environ. Urban Syst. 48, 16–27. doi: 10.1016/j.compenvurbsys.2014.05.002
Perino, G., Andrews, B., Kontoleon, A., and Bateman, I. (2014). The value of urban green space in Britain: a methodological framework for spatially referenced benefit transfer. Environ. Res. Ecol. 57, 251–272. doi: 10.1007/s10640-013-9665-8
Pupphachai, U., and Zuidema, C. (2017). Sustainability indicators: a tool to generate learning and adaptation in sustainable urban development. Ecol. Indic. 72, 784–793. doi: 10.1016/j.ecolind.2016.09.016
Rees, W., and Wackernagel, M. (1996). Urban ecological footprints: why cities cannot be sustainable—and why they are a key to sustainability. Environ. Impact Assess. Rev. 16, 223–248. doi: 10.1016/S0195-9255(96)00022-4
Shen, L.-Y., Ochoa, J. J., Shah, M. N., and Zhang, X. (2011). The application of urban sustainability indicators–A comparison between various practices. Habit. Int. 35, 17–29. doi: 10.1016/j.habitatint.2010.03.006
Silva, E. A. (2004). The DNA of our regions: artificial intelligence in regional planning. Futures 36, 1077–1094. doi: 10.1016/j.futures.2004.03.014
Silva, E. A., and Clarke, K. (2005). Complexity, emergence and cellular urban models: Lessons learned from applying SLEUTH to two Portuguese cities. Eur. Plan. Stud. 13, 93–115. doi: 10.1080/0965431042000312424
Sustainable Society Foundation (2017) Sustainable Society Index - Your Compass to Sustainability. Available online at: http://www.ssfindex.com/ssi/framework/ (Accessed December 20, 2018).
Thomas G. S. (2014) Gini Indexes of Income Inequality in 102 Major Markets. Available online at: https://www.bizjournals.com/bizjournals/news/2014/01/31/gini-indexes-of-income-inequality-in.html (Accessed December 20, 2018).
Toivonen, S., and Viitanen, K. (2015). Forces of change shaping the future commercial real estate market in the Helsinki metropolitan area in Finland. Land Use Policy 42, 471–478. doi: 10.1016/j.landusepol.2014.09.004
Turcu, C. (2013). Re-thinking sustainability indicators: local perspectives of urban sustainability. J. Environ. Plan. Manage. 56, 695–719. doi: 10.1080/09640568.2012.698984
UN DESA (2018) World Urbanization Prospects: The 2018 Revision, Key facts. New York:NY. Available online at: https://population.un.org/wup/Publications/ (Accessed December 20, 2018).
UN Habitat (2014). Table 3.1: Gini Coefficients for Selected Cities and Provinces. Available online at: https://unhabitat.org/wp-content/uploads/2014/03/Table-3.1-Gini-Coefficient-for-Selected-Cities-and-Provinces.pdf (Accessed December 20, 2018).
United Nations (2015) Transforming Our World: the 2030 Agenda for Sustainable Development. Resolution Adopted by the General Assembly on 25 September 2015. Available online at: http://www.un.org/ga/search/view_doc.asp?symbol=A/RES/70/1andLang=E (Accessed December 20, 2018).
United Nations (2018). The Sustainable Development Goals Report 2018. New York, NY. Available online at: https://unstats.un.org/sdgs/report/2018 (Accessed January 14, 2019).
US Environmental Protection Agency (EPA) (2012). A Framework for Sustainability Indicators at EPA. Available online at: https://www.epa.gov/sites/production/files/2014-10/documents/framework-for-sustainability-indicators-at-epa.pdf (Accessed October 11, 2018).
van Leeuwen, C. J., Frijns, J., van Wezel, A., and van de Ven, F. H. (2012). City blueprints: 24 indicators to assess the sustainability of the urban water cycle. Water Resour. Manage. 26, 2177–2197. doi: 10.1007/s11269-012-0009-1
Van Leeuwen, C. J., Koop, S. H. A., and Sjerps, R. M. A. (2016). City blueprints: baseline assessments of water management and climate change in 45 cities. Environ. Dev. Sustain. 18, 1113–1128. doi: 10.1007/s10668-015-9691-5
Votsis, A. (2017). Utilizing a cellular automaton model to explore the influence of coastal flood adaptation strategies on Helsinki's urbanization patterns. Comput. Environ. Urban Syst. 64, 344–355. doi: 10.1016/j.compenvurbsys.2017.04.005
Williams, K. (ed.). (2005). Spatial Planning, Urban Form and Sustainable Transport. New York, NY: Routledge.
Wilson, A. (2008). “Urban and regional dynamics – 3: ‘DNA' and ‘genes' as a basis for constructing a typology of areas,” in CASA Working Paper 130, Centre for Advanced Spatial Analysis (London: UCL).
Wu, N., and Silva, E. A. (2011). Urban DNA: Exploring the Biological Metaphor of Urban Evolution With DG-ABC Model. Salt Lake City: AGILE Conference.
Yale Center for Environmental Law Policy (2018). 2018 Environmental Performance Index: Global Metrics for the Environment: Ranking Country Performance on High-Priority Environmental Issues. Available online at: https://epi.envirocenter.yale.edu/downloads/epi2018policymakerssummaryv01.pdf (Accessed October 23, 2018).
Keywords: urban DNA, livability, sustainability, SLEUTH model, urban growth, urban commons, cities
Citation: Votsis A and Haavisto R (2019) Urban DNA and Sustainable Cities: A Multi-City Comparison. Front. Environ. Sci. 7:4. doi: 10.3389/fenvs.2019.00004
Received: 08 November 2018; Accepted: 07 January 2019;
Published: 24 January 2019.
Edited by:
Ioan Cristian Ioja, University of Bucharest, RomaniaReviewed by:
Mihai Razvan Nita, University of Bucharest, RomaniaChristopher Swan, University of Maryland, United States
Copyright © 2019 Votsis and Haavisto. This is an open-access article distributed under the terms of the Creative Commons Attribution License (CC BY). The use, distribution or reproduction in other forums is permitted, provided the original author(s) and the copyright owner(s) are credited and that the original publication in this journal is cited, in accordance with accepted academic practice. No use, distribution or reproduction is permitted which does not comply with these terms.
*Correspondence: Athanasios Votsis, YXRoYW5hc2lvcy52b3RzaXNAZm1pLmZp