 Makiko Nakata
 Sonoyo Mukai
 Masayoshi Yasumoto
- 1Faculty of Applied Sociology, Kindai University, Higashi-Osaka, Japan
- 2The Kyoto College of Graduate Studies for Informatics, REESIT, Kyoto, Japan
The atmospheric aerosol distribution in Asia is complex because it is influenced by both natural phenomena and human activities. In this article, multifaceted approach using satellite observations and numerical model simulation shows seasonal and regional variations of the aerosol distribution over Asia. Asia covers a large area; however, this article is limited to East and Southeast Asia. The aerosol optical thickness (AOT) in the inland desert area is normally high in spring and dusty aerosols are widely spread with the wind. The AOT values are high in summer over East Asia. A high AOT caused by biomass burning plumes is observed in autumn over Southeast Asia and in spring over Siberia and heavy air pollution occurs in Beijing in winter, a very well-known phenomenon. These phenomena caused by heavy aerosol concentration were determined based on Aqua/MODIS data and aerosol characteristics retrievals and estimated the aerosol characteristics. Furthermore, the impact of aerosols on the climate assessed by numerical model simulations suggest that aerosols reduce solar radiation and therefore the Earth's surface temperature. In addition to these influences on the radiation budget, aerosols have a significant potential to change the circulation fields.
Introduction
Satellites and ground remote sensing have led to a growing interest in the Earth's environment in the last two decades. It has been reported that large-scale air pollution becomes severe due to both the increasing emissions of anthropogenic aerosols and the complicated behavior of natural aerosols. It is known that atmospheric aerosols play an important and complex role in the Earth's radiation budget, having both a direct and indirect effect (Pérez et al., 2006; Kahn, 2012), and in air quality, which causes severe public health problems (Wang et al., 2013; Tomasi et al., 2016). Nevertheless, aerosols are highly variable components of the atmosphere. Therefore, our comprehension of the role of atmospheric aerosols in the Earth–atmosphere system is still limited. In other words, the retrieval of aerosol properties, such as the particle size distribution and refractive index, is important.
The aerosol distribution in Asia is very complex due to both natural factors and human activities. Asia covers a large area; however, in this work, we focus on East and Southeast Asia. Roughly speaking, two typical aerosol events occur in these regions: (1) dust storms (often called yellow sand) originating in the inland desert area and then widely spread with the wind around East Asia (Littmann, 1991; Wang et al., 2010); and (2) biomass burning plumes generated by large forest and agriculture fires in autumn in Southeast Asia, that is, Indonesia, Malaysia, and Singapore (Feng and Christopher, 2013; Reid et al., 2013). Large forest fires in China and at the Russian boarder, usually called Siberia foresee fires, also provide a large quantity of biomass burning aerosols, especially in spring (Zhao et al., 2015). Furthermore, anthropogenic particulate matter (PM) pollution is well-known to occur around Beijing in winter (Wang et al., 2015). These types of air pollution severely occur in particular seasons or regions and sometimes interact with each other (Li et al., 2010). In this work, we aim to investigate the aerosol pollution in Asia to better understand it from a variety of perspectives.
The remainder of this work is organized as follows.
In section Seasonal variation of aerosol pollutions over Asia, the seasonal variation of aerosol pollution over Asia is interpreted using a combination of the satellite data, ground measurements, and numerical results from model simulations.
In section Aerosol retrieval based on radiation simulations, algorithms for aerosol retrieval from space are investigated based on our radiative transfer (RT) simulations involving a simplification of aerosol characteristics descriptions. Our RT method of successive order of scattering (MSOS) is available for an optically semi-infinite atmosphere (Mukai et al., 2012). The aerosol properties are then derived from the measurements by NASA/MODIS (MODerate resolution Imaging Spectroradiometer) board on the satellite Aqua over case study areas selected to be suitable for the examination of the seasonal and regional variation of Asian air pollution.
In Section Impact of climate on Asian aerosols, the impact of the climate on Asian aerosols is investigated. The atmospheric aerosol distribution in Asia is complex; it is influenced by both natural phenomena and human activities. Urban areas are dominated by fine anthropogenic aerosols that are released from diesel-powered vehicles and industrial activities. Because of their short life spans, the aerosol concentration is highest over the source regions and the climatic impacts of aerosols are therefore most pronounced in these regions. The impact of aerosols on the climate is assessed in this study using numerical model simulations.
Finally, a summary is presented in Section Summary.
Seasonal Variation of Aerosol Pollutions Over Asia
Figure 1 presents the seasonally averaged aerosol optical thickness (AOT) at a wavelength of 0.55 μm over Asia in 2003. The left column represents the products from NASA/Terra/MODIS (MOD08_M3 Collection 6). The seasonal variation of the AOT shows that the region with large AOT extends from southwestern to northern China and to Japan in summer, whereas the enhanced AOT is limited to the source area in winter. The increase of the sulfate aerosol concentration due to photochemical reactions likely caused the high AOT during summer. The spring dust event increased the levels of pollution around the Taklimakan Desert. In autumn, high AOT values were generated by agricultural burns in Southeast Asia.
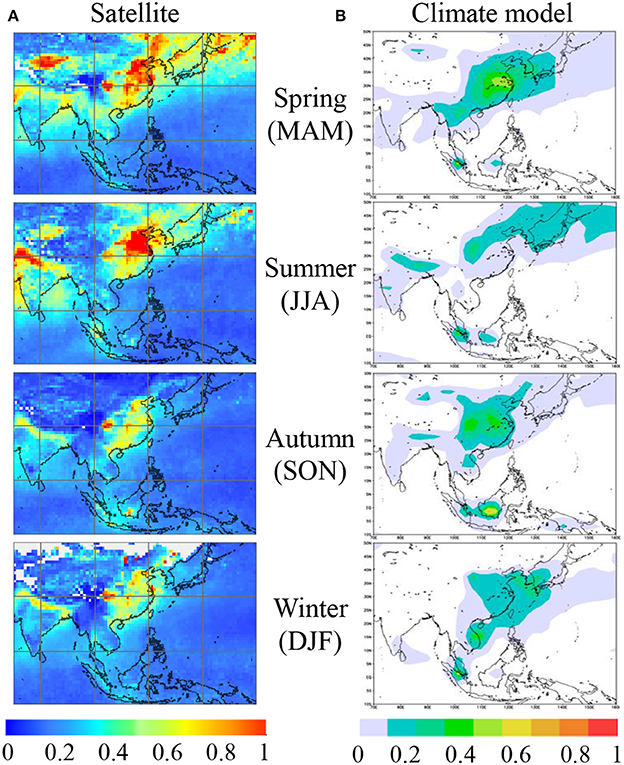
Figure 1. Seasonally averaged AOT (0.55 μm) in 2003 from climate model simulations and NASA/Terra/MODIS (MOD08_M3 Collection 6). The MODIS products in this image are cited according to the citation rules of NASA. No further permission is required for the image reproduction.
Similar seasonal characteristics are evident in the numerical simulation results of AOT (0.55 μm) in the right column in Figure 1. We used a numerical model named “MIROC-ESM” (Watanabe et al., 2011). It is based on a global climate model, Model for Interdisciplinary Research on Climate (MIROC), developed by the University of Tokyo, National Institute for Environmental Studies (NIES), and Japan Agency for Marine-Earth Science and Technology (JAMSTEC; K-1 model developers, 2004). An aerosol module in MIROC, Spectral Radiation-Transport Model for Aerosol Species (SPRINTARS), predicts the main tropospheric aerosols including carbonate, sulfate, dust, and sea salt (Takemura et al., 2005).
Figure 2 shows the monthly mean AOT (0.55 μm) over each area from A to D (refer to the geometrical map on the right) in Asia from 2003 to 2016 averaged based on NASA/Aqua/MODIS measurements (MYD08_M3 Collection 6). The results in Figure 2 coincide with the seasonal and regional variations shown in Figure 1. Figure 2 shows that the AOT values depend on the month and location and that Beijing (C) has higher values than other locations throughout the year. The seasons with the highest AOT value are: spring in Taklimakan Desert (A), May and September in Siberia (B), summer (June and July) in Beijing (C), and autumn (September and October) in Indonesia.
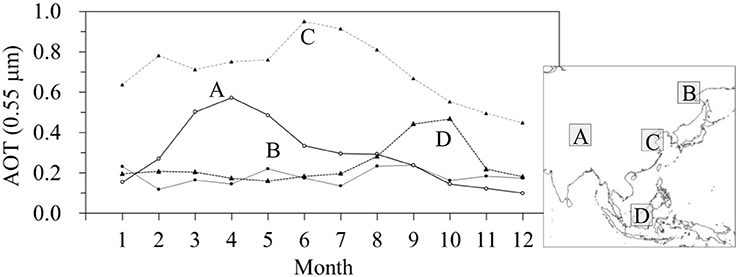
Figure 2. Monthly mean AOT at a wavelength of 0.55 μm from 2003 to 2016 derived from NASA/Aqua/MODIS (MYD08_M3 Collection 6) averaged over each region A to D denoted in the map on the right. The MODIS products in this image are cited according to the citation rules of NASA. No further permission is required for the image reproduction.
Aerosol Retrieval Based on Radiation Simulations
Aerosol Retrieval From Space
Algorithms for aerosol retrieval with remote sensing data are divided into three parts: (1) satellite data analysis, (2) aerosol modeling, and (3) multiple light scattering calculations in the Earth atmosphere model, called radiative transfer simulations, considering the scattering by atmospheric particles and reflection by the Earth surface. Thus, the aerosol properties are estimated by comparing satellite measurements with numerical values of radiation simulations. The precise simulation of multiple light scattering processes is necessary and requires a long computation time, especially on the global scale. Therefore, efficient algorithms for radiative transfer problems are indispensable to retrieval aerosols from space. Figure 3 represents a block flow for the aerosol retrieval from satellite measurements on a global scale. Among various issues to be interpreted in detail, four subjects are selected and explained in the following sections Aerosol Model to Impact of Climate on Asian Aerosols.
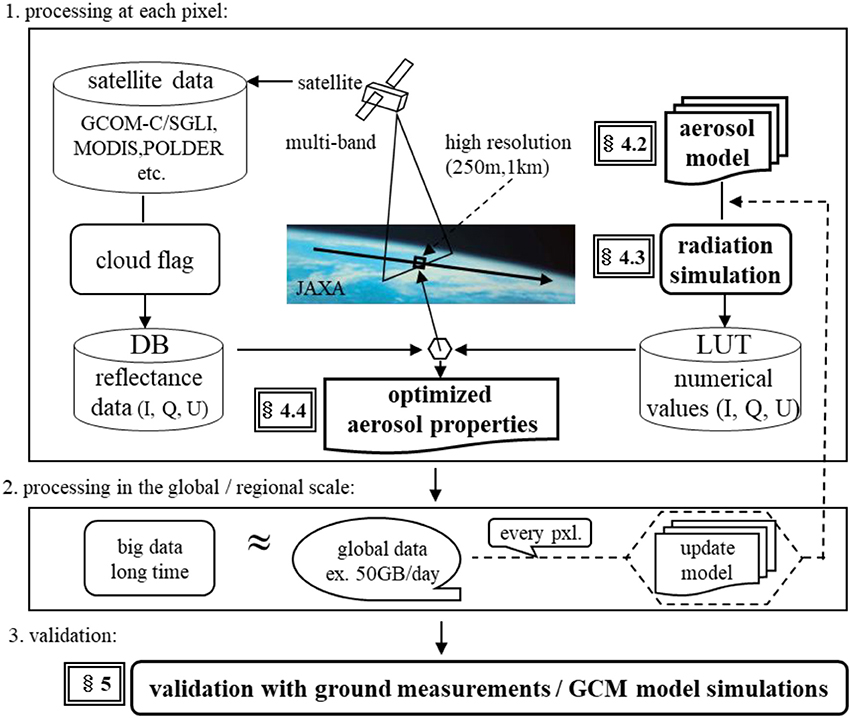
Figure 3. A block flow chart for the aerosol retrieval from satellite measurements on a global scale.
Aerosol Model
Based on the automatic classification of accumulated NASA/AERONET data, atmospheric aerosols are classified into six categories (Dubovik et al., 2002; Omar et al., 2005):
1) Biomass burning (BB) aerosols consisting of soot and organic carbon
2) Rural (RU) aerosols referred to as a clean continental aerosol
3) Continental pollution (CP) of anthropogenic aerosols
4) Dirty pollution (DP); the same as CP but at significantly higher levels
5) Desert dust (DD)
6) Polluted marine PM consisting of sea salt with traces of CP (PM)
Because we focus on continental aerosols in this work, PM aerosols are excluded.
The former four aerosols types (BB, RU, CP, and DP) can be expressed in simple size distribution form defined by a unique variable for the fine particle fraction (f) of the volume concentration (Mukai et al., 2016):
Although aerosols are considered to be a mixture of various aerosol types existing in nature, we adopted simple internal homogeneous mixing of two components using the Maxwell–Garnett mixing (MGM) rule (Chýlek and Srivastava, 1977; Bohren and Wickramasinghe, 1983). The MGM rule provides a complex refractive index that can be calculated as follows:
where ε denotes the electricity, the subscripts m and j represent the matrix and inclusion, respectively, and g is the volume fraction of the inclusions. The present aerosol retrieval is based on visible and near-infrared (NIR) band data because the refractive index is assumed to be independent of the wavelength in these spectral regions. We assumed that the matrix and inclusions for applications using visible and NIR band data were 1.410 – 0.004i and 1.520 – 0.035i, respectively. In short, aerosol models are more simply represented by two parameters (f, g; Mukai et al., 2016). That is, the size of the aerosols is represented by an approximate bimodal log-normal distribution defined by the fine particle fraction (f), as given by Equation (1), and the refractive index is induced from the internal mixing of aerosol types with the volume fraction of the inclusions (g) using Equation (2).
Desert dust (DD) can also be expressed by two parameters (f, g), in the same manner as mentioned above. However, the size distribution function takes the following form:
The refractive index of DD-type aerosols is calculated using Equation (2), where the matrix and inclusions are 1.4520 – 0.0036i and 1.520 – 0.035i, respectively (Omar et al., 2005). Note that the shape of the dust aerosols should be taken into account.
Radiative Transfer in the Case of Heavy Aerosol Concentrations
Spaceborne sensors measure upwelling radiance at the top of the atmosphere (TOA). It is known that incident solar light multiply interacts with atmospheric particles. Function I (τ, Ω) is defined as specific intensity at the optical depth τ in the direction of Ω, given by Ω = (μ, φ) and dΩ = dμ dφ, where μ is the cosine of the zenith angle θ (i.e., μ = cos θ) and φ is the azimuth angle. Also, P (Ω, Ω′) is the phase function of μ, μ′, φ, and φ′ for single scattering, similarly defined quantities of incident and scattered rays. Hereafter, we use Ω as abbreviation for (μ, φ). The basic physical concept is simple. The I(τ, Ω) is reduced by e−dτ after traversing over an optical thickness dτ at a certain wavelength. The radiative transfer equation describes this circumstance as (Chandrasekhar, 1960):
The parameter ζ in Equation (1) represents a single scattering albedo. The boundary conditions for the standard problem are: (1) at the top of the medium, τ = 0, there is no radiation, except in direction –μ0; and (2) at the bottom of the medium, τ = τ0, there is no radiation incident on the medium (free surface) for the finite medium there is a semi-infinite case (τ0 ≈ ∞).
The impact of air pollution on social activities and human health increases with the aerosol concentration. A very high AOT can be assumed under severe air pollution because AOT is proportional to the amount of aerosol in the atmosphere. Radiative transfer simulations for such extremely high AOT (≈∞) cases are therefore considered here. The procedure is named MSOS. It can effectively calculate the reflected intensity of radiance [R(Ω, Ω0): Reflectance] at the TOA in the optically semi-infinite atmosphere model (Mukai et al., 2012, 2014). The idea of a successive order of scattering is fundamentally related to the probabilistic approach to the theory of radiative transfer (Sobolev, 1963) and has demonstrated to be feasible for the radiation field reflected from the optically semi-infinite atmosphere model (van de Hulst, 1963; Uesugi and Irvine, 1970). The MSOS concept is the following:
where n is the number of scattering. The matrix R(n:Ω, Ω0) is the nth order reflection describing the radiation emerging from the TOA after scattering n times within the atmosphere. That is, the reflectance R(Ω, Ω0) can be calculated as the Neumann series of the nth order reflection R(n:Ω, Ω0).
Case Study for Aerosol Retrieval During Air Pollution Events Over Asia
The RT method MSOS mentioned in the previous section can be used during aerosol events in areas A to D discussed in Section Seasonal Variation of Aerosol Pollutions over Asia. In particular, based on the measurements from ground and space, following events were feasible for aerosol retrieval using Aqua/MODIS measurements: April 23, 2012, in the Taklimakan Desert (A); July 28, 2011, in Siberia (B); June 21, 2012, and January 13, 2013, in Beijing (C); and October 19, 2015, in Indonesia (D; see small red open circles in Figure 4).
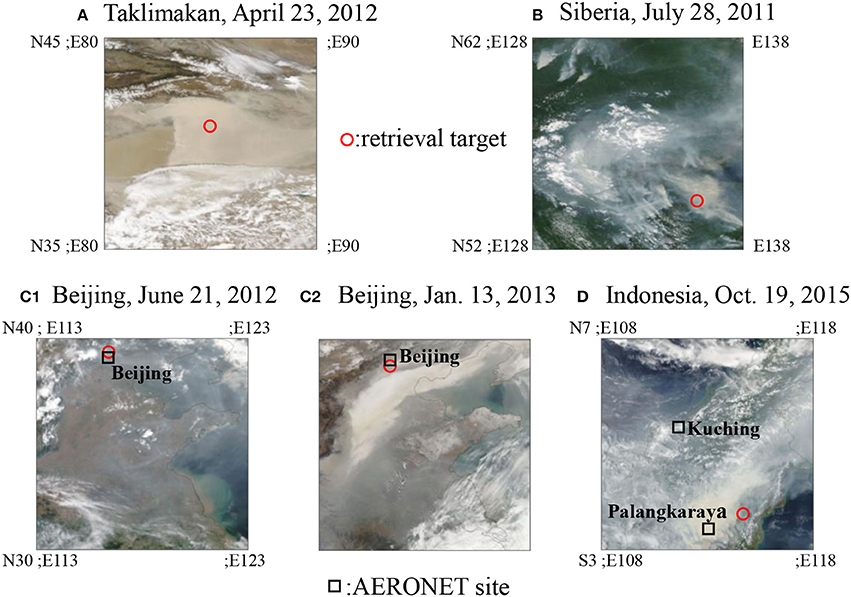
Figure 4. True color composite images consisting of Aqua/MODIS bands 1, 4, and 3 (MYD02 Collection 6) for RGB color space over (A) the Taklimakan Desert, (B) Siberia, (C1,C2) Beijing, and (D) Indonesia. The small red circles denote the targets for aerosol retrieval case studies and the small black squares in (C1,C2,D) indicate the NASA/AERONET sites.
The reasons for the selection of these five target areas are briefly discussed below. Areas A and C are representative for desert dust aerosols and the Beijing PM problem, respectively. In urban areas, increased emissions of small anthropogenic particles cause increased concentrations of harmful air pollutants, for example, the well-known PM2.5 suspended in the atmosphere (Nakata et al., 2015). Figure 5 shows the AOT values (0.44 μm) observed at the Beijing NASA/AERONET site and PM2.5 measured by the U.S. Department of State Air Quality Monitoring Program (http://www.stateair.net/web/post/1/1.html; accessed on November 15, 2011) in July 2012 and January 2013. The figure shows that Beijing was covered with dense aerosols on June 21, 2012, and January 13, 2013. The data for these 2 days are marked with a light pink shadow. Note that January 13, 2013, was the day on which the Beijing winter PM problem was first widely broadcasted (Yang et al., 2015).
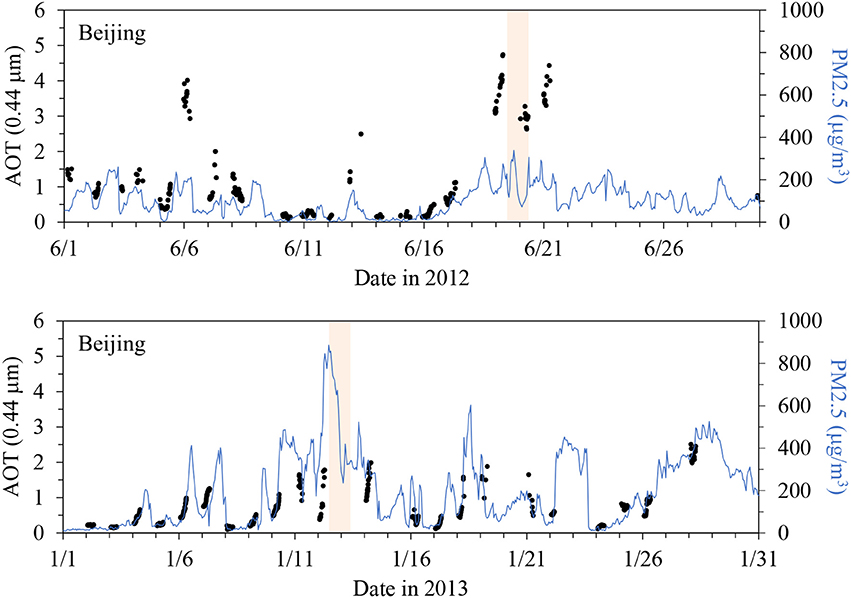
Figure 5. The values of AOT at a wavelength of 0.44 μm (black dots) observed at the Beijing NASA/AERONET site and PM2.5 (blue solid curves) in July 2012 and January 2013. The PM measurements are obtained from the U.S. Department of State Air Quality Monitoring Program (http://www.stateair.net/web/post/1/1.html; accessed on November 15, 2011).
Targets B and D are typical biomass burning aerosols derived from severe forest fires. Biomass burning plumes due to large-scale forest fires and agriculture burns have caused severe air pollution (Crutzen and Andreae, 1990; Crounse et al., 2009). Figure 6 presents NASA/AERONET/AOT (0.44 μm) data measured at two sites, Palangkaraya (Indonesia) and Kuching (Malaysia), in Southeast Asia in September and October 2015 (Holben et al., 1998). Moreover, Figure 7 presents the regional distribution of hot spots denoted by red dots observed by NASA/Aqua/MODIS (MYD14 Collection 6) (Justice et al., 2002; Giglio et al., 2003) superposed on true color composite images consisting of MODIS bands 1, 4, and 3 (MYD02 Collection 6) for red–green–blue (RGB) color space over Siberia (Area B in Figure 2) from July 25–28, 2011, and Indonesia (Area D in Figure 2) from October 16–19, 2015, respectively. Several hot spots and dense haze in the upper images in Figure 7 indicate the occurrence of large forest fires 4 days ago on July 28, 2011, over Area B in Siberia. The lower images in Figure 7 indicate thick smoke haze due to severe fires, too thick to observe hot spots from space.
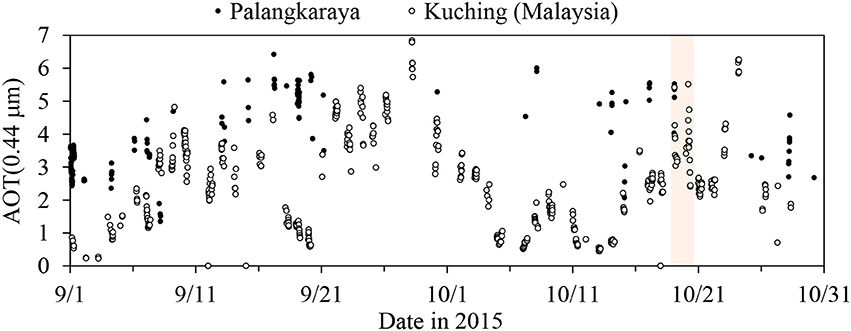
Figure 6. The values of AOT at a wavelength of 0.44 μm at NASA/AERONET sites Palangkaraya (Indonesia) and Kuching (Malaysia) in Southeast Asia in September and October 2015, denoted by the black dots and open circles, respectively.
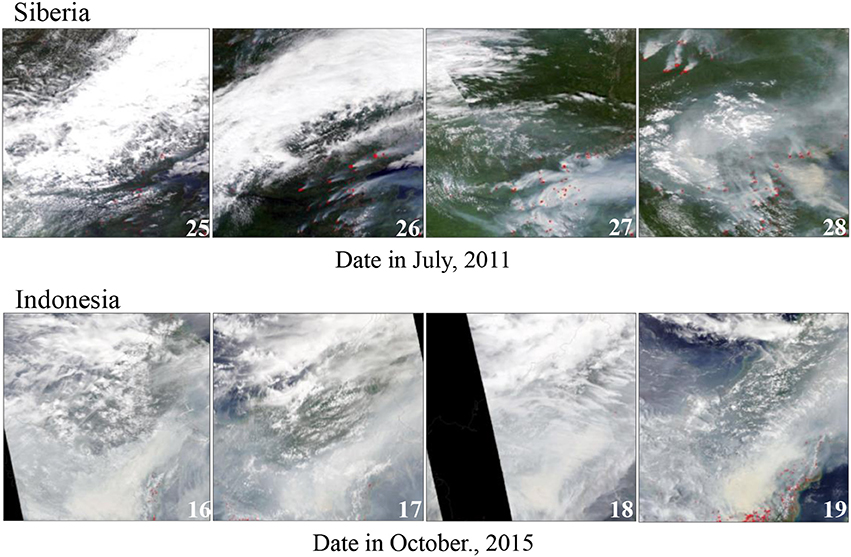
Figure 7. Regional distribution of hot spots from NASA/Aqua/MODIS (MYD14 Collection 6) superposed on true color composite images consisting of MODIS bands 1, 4, and 3 (MYD02 Collection 6) for RGB color space over Siberia (Area B in Figure 4) from July 25–28 in 2011, and Indonesia (Area D in Figure 4) from October 16–19 in 2015.
Bases on this, we selected five candidates indicated by red circles in Figure 4: April 23, 2012, in the Taklimakan Desert (A); July 28, 2011, in Siberia (B); June 21, 2012 and 13 January, 2013, in Beijing (C); and October 19, 2015, in Indonesia (D). These events satisfied conditions, such as dense concentrations of aerosols, for our case studies based on the RT method of MSOS.
Assuming that AOT ≈ ∞, noted in Section Radiative Transfer in the Case of Heavy Aerosol Concentrations, the aerosol characteristics can be described by only two parameters (i.e., f and g). According to the aerosol retrieval flow chart in Figure 3, the MODIS data were compared with the reflected intensity values simulated in a two-channel diagram with wavelengths of 0.46 and 0.55. The aerosol characteristics are summarized in Table 1. Site A took the smallest size parameter (f = 0.25) and the largest value of the real part of the refractive index among the five targets; a rather weak absorption (m = 1.46 – 0.006 i) was observed. Therefore, aerosols over the Taklimakan Desert might indicate the dust particle characteristics. An irregular shape should be considered for dust aerosol particles (Ishimoto et al., 2012) and the results for target A have to be changed.
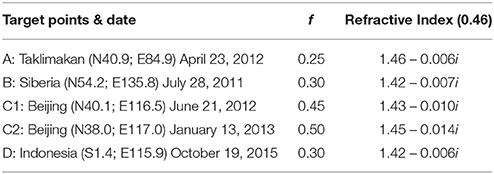
Table 1. Retrieval results for the aerosol characteristics (refer to Figure 4).
Other size parameters (f) in Table 1 suggest that small particles correspond to the aerosol component (AE) values of ~1.5 to 2.0. The size parameter values (f) and refractive index (m) obtained at the targets B and D are very similar. These aerosol properties in Siberia (B) and Indonesia (D) suggest the presence of biomass burning aerosols. The presence of large forest fires in these areas was confirmed at neighbor NASA/AERONET (Aerosol Robotic NETwork) sites (see Figure 5). On the other hand, the C1 and C2 cases around Beijing indicate very small (f = 0.45 or 0.50) and absorbing (m = 1.43 – 0.010i, 1.45 – 0.014i) aerosols, which suggests the mixture of dense anthropogenic and natural aerosols (Wang et al., 2015).
In summary, based on the limited case studies, Asian air pollution can be classified into three types: dust aerosols called yellow sand in spring in the desert area, as shown in case A; biomass burning aerosols due to severe forest or agriculture fires in cases B and D; and anthropogenic air pollution around Beijing in cases C1 and C2. In addition, based on our previous work, target C1 seems to be a mixture of anthropogenic aerosols (Mukai et al., 2015) and biomass burning aerosols from agriculture burns and target C2 represents the renown Beijing PM phenomenon (Mukai et al., 2014; Yang et al., 2015).
It is impossible to compare the retrievals in Table 1 with the ground measurements because the current simulations were restricted to AOT ≈ ∞ and ground measurements were not available in such hazy cases. For the validation of our results, reproduction calculations of the MSOS were performed using the aerosol parameters in Table 1 and compared with the MODIS measurements. The maximum error is within 3% in all cases. An example of the numerical model simulations shown in the next section may be available for the validation of the present results.
Impact of Climate on Asian Aerosols
Earth systems are significantly impacted by aerosols, while increasing atmospheric greenhouse gas concentrations represent the largest contributor to global warming. A significant amount of research has shown that aerosols and their interactions with clouds offset a substantial portion of the global mean forcing from greenhouse gases. However, they continue to contribute the largest uncertainty to estimations of the Earth's energy budget (IPCC, 2013). Generally, aerosols influence the climate directly by scattering and absorbing solar radiation and indirectly by acting as cloud condensation and ice nuclei, which modify the optical properties and lifetimes of clouds. In addition to the radiation budget change, aerosols have a significant potential to alter clouds and precipitation.
Asia has the highest concentrations of aerosols in the world. Emissions of anthropogenic aerosols have been increasing with economic growth and air pollution in Asian megacities has become a serious problem (Lee and Kim, 2010). The major source of anthropogenic aerosols, such as sulfate and carbonaceous aerosols, is fuel combustion. Biomass burning also significantly contributes to anthropogenic concentrations of aerosols. We used an earth system model, called “MIROC-ESM” (Watanabe et al., 2011), which is based on a global climate model, MIROC (Model for Interdisciplinary Research On Climate), developed by the University of Tokyo, NIES (National Institute for Environmental Studies), and JAMSTEC (Japan Agency for Marine-earth Science and Technology) (K-1 model developers, 2004). An aerosol module in MIROC, SPRINTARS, predicts the main tropospheric aerosols including carbonaceous, sulfates, dust, and sea salt aerosols (Takemura et al., 2005). The proportion of each aerosol species relative to the total AOT in each area (A to D) in Figure 4 is estimated by numerical model simulations (Figure 8). Dust aerosols are dominant over the Taklimakan Desert in April. Carbonaceous aerosols represent a large part of the AOT over Siberia in July and over Indonesia in October. The concentration of sulfate aerosols is high over Beijing in June. These features are consistent with the retrieved results shown in Table 1.
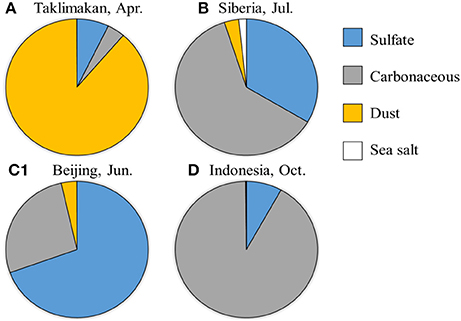
Figure 8. The contribution of each aerosol species to AOT at a wavelength of 0.55 μm averaged from 2001 to 2005 based on climate model simulations.
To estimate aerosol effects, two long-term simulations using a numerical model were for the period from 1850 to 2005 and a set of external forcings recommended by Coupled Model Intercomparison Project phase 5 (CMIP5) (Watanabe et al., 2011). Spectral changes in solar irradiance are considered according to Lean et al. (2005). Historical changes in volcanic stratospheric aerosols are given by the optical thickness (Sato et al., 1993). Atmospheric concentrations of well-mixed greenhouse gases are provided by Meinshausen et al. (2011). Surface emission flux of tropospheric aerosols and ozone precursors are provided by Lamarque et al. (2010).
One simulation, named historical simulation, exclusively used external forcing. The other, named No Aerosol Forcing Simulation, used fixed values of the anthropogenic aerosol (sulfate and carbonaceous aerosols) emission flux for 1850; the other external forcing used was the same as that of the historical simulation (Table 2). The difference between the two simulations indicates the effects of aerosols on the climate.
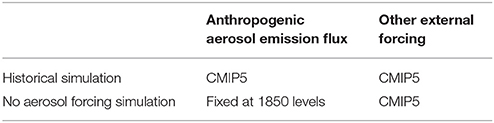
Table 2. Experimental design for historical simulation and no aerosol forcing simulation.
Based on the historical simulation, the global mean AOT (0.55 μm) increases from 1850 to the 1980s and then decreases (Figure 9). On the other hand, the AOT has rapidly increased since the mid-twentieth century in Asia. Emissions of anthropogenic aerosols have increased since the industrial revolution, while the largest source of anthropogenic aerosol emissions shifted from Europe to Asia during the second half of the twentieth century. With economic growth and air pollution in megacities, aerosol concentrations in Asia have become a serious problem and are now the highest in the world. No clear trend of the AOT is observed in any of the aerosol forcing simulations using fixed values of anthropogenic aerosols.
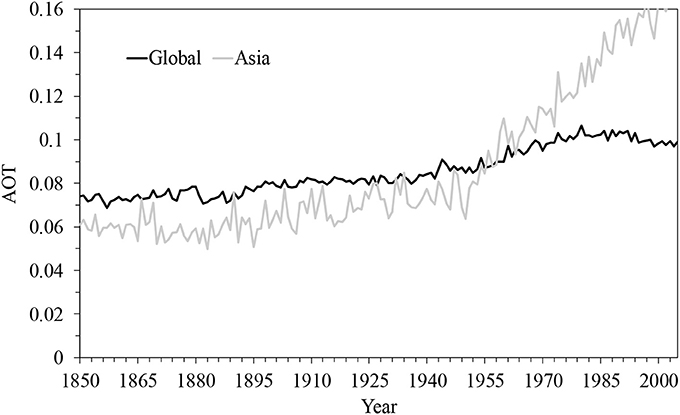
Figure 9. Global and East Asia (20°N−50°N, 100°E−150°E) mean AOT at a wavelength of 0.55 μm from 1850 to 2005 for the historical simulation.
Figure 10 shows the distribution of the difference between 5-year mean values of AOT (0.55 μm) averaged from 2001 to 2005 for the historical simulation and those for the simulation without aerosol forcing over Asia, indicating the increase of anthropogenic aerosols such as sulfate and carbonaceous aerosols. A large increase of AOT is evident around East Asia, especially in eastern China. The AOT also increased over Southeast Asia. The direct and indirect effects of aerosols can be estimated based on the decreasing annual mean surface change of the shortwave radiation flux. Figure 11 presents the distribution of the 5-year mean values of aerosol effects averaged from 2001 to 2005 over Asia. Aerosol direct effects are estimated from the decreasing annual mean surface change of shortwave radiation flux in the clear sky. The comparison between Figures 4, 5A indicates strong direct effects around the area with the greatest AOT increase. The distribution of direct effects is similar to the distribution of the AOT change. The distribution of indirect effects differs from the change of aerosols because indirect effects correlate with the change of cloud properties. The indirect effects in this simulation include not only ordinary aerosol indirect effects but also general circulation effects. Direct aerosol effects synchronize with the change of the anthropogenic aerosol amount. On the other hand, indirect aerosol effects are influenced by the general circulation and therefore are more complex than the direct ones. This fact suggests that aerosols sufficiently affect not only near-emission source areas but also remote areas.
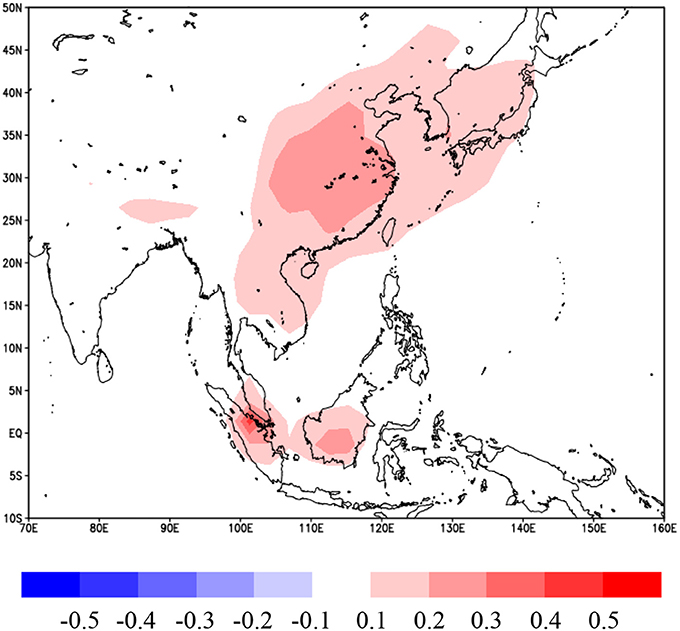
Figure 10. Distribution of the difference between 5-year mean of AOT (0.55 μm) averaged from 2001 to 2005 estimated by subtracting no aerosol forcing simulation from historical simulation.
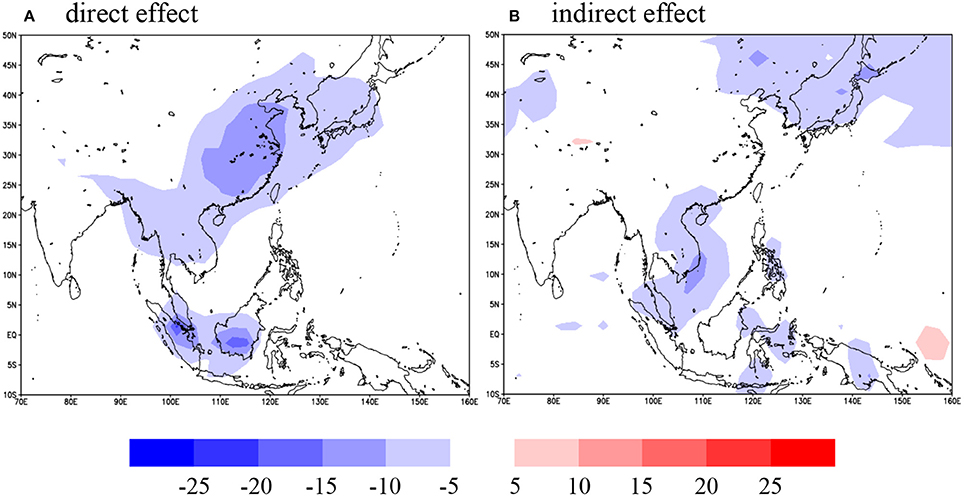
Figure 11. Distribution of the 5-year mean of aerosol effects (W/m2) averaged from 2001 to 2005 estimated by subtracting no aerosol forcing simulation from historical simulation. The left figure (A) shows the direct aerosol effect, which indicates a change in the shortwave radiation flux (clear sky). The right figure (B) shows the indirect aerosol effect, which indicates the shortwave radiation flux (whole sky minus clear sky).
Summary
Increasing emissions of aerosols lead to severe air pollution. Therefore, the AOT was adopted as a characteristic parameter for air pollution here. It is well-known that the distribution of atmospheric aerosols in Asia is complex. Air pollution is caused by various aerosol sources in Asia. We aimed to analyze the air pollution in Asia in this work, focusing on East and Southeast Asia, and its influence on the environment. Findings of this work is described below.
First, we demonstrated that satellite observations and numerical model simulations show seasonal and regional variations of the aerosol distribution over Asia. The AOT is high from spring to summer over East Asia and high AOT values associated with biomass burning plumes were observed in autumn over Southeast Asia. Five cases of heavy air pollution in different seasons over Asia were selected based on measurements from ground and space. The aerosol retrieval for these five cases of air pollution events was then obtained with the RT simulations named MSOS. Based on the retrieved aerosol characteristics, air pollution in Asia can be classified into three types: dust aerosols in spring in the desert area, biomass burning aerosols due to severe forest or agriculture fires, and anthropogenic air pollution around megacities. The proportion of each aerosol species simulated by the numerical model is consistent with the retrieved results.
Secondly, the impact of aerosols on the climate was assessed by numerical model simulations. The simulated results show that direct aerosol effects correlate with the change of the aerosol amount. On the other hand, indirect aerosol effects are influenced by the general circulation and therefore are more complex. Because of their short life spans, the concentration of aerosols is the highest over the source regions and, hence, the climatic impact of aerosols is most pronounced in these regions. However, the impact of aerosols on the climate due to the change of circulation is irreducibly complex. This study indicates that heavy aerosol pollution affects not only near-emission source areas but also remote areas.
Author Contributions
SM: radiative transfer; MN: numerical model simulation; MY: satellite data analysis.
Conflict of Interest Statement
The authors declare that the research was conducted in the absence of any commercial or financial relationships that could be construed as a potential conflict of interest.
The reviewer, IV, and handling editor declared their shared affiliation.
Acknowledgments
The authors thank NASA for providing valuable AERONET and MODIS data. The MODIS products have been cited according to the citation rules of NASA (https://earthdata.nasa.gov/earth-observation-data/data-citations-acknowledgements). This work was supported in part by the Global Change Observation Mission - Climate project by JAXA (grant no. JX-PSPC-434796), Global Environment Research Fund of the Ministry of Environment, Japan (S-12), and JSPS KAKENHI (grant no. 15K00528).
References
Bohren, C. F., and Wickramasinghe, N. C. (1983). On the computation of optical properties of heterogeneous grains. Astrophys. Space Sci. 50, 461–472. doi: 10.1007/BF00641750
Chýlek, P., and Srivastava, V. (1977). Dielectric constant of a composite inhomogeneous medium. Phys. Rev. B 27, 5098–5106. doi: 10.1103/PhysRevB.27.5098
Crounse, J. D., DeCarlo, P. F., Blake, D. R., Emmons, L. K., Campos, T. L., Apel, E. C., et al. (2009). Biomass burning and urban air pollution over the Central Mexican Plateau. Atmos. Chem. Phys. 9, 4929–4944. doi: 10.5194/acp-9-4929-2009
Crutzen, P. J., and Andreae, M. O. (1990). Biomass burning in the tropics: impact on atmospheric chemistry and biogeochemical cycles. Science 250:1669. doi: 10.1126/science.250.4988.1669
Dubovik, O., Holben, B., Eck, T. F, Smirnov, A., Kaufman, King, Y. J., Slutsker, M., et al. (2002). Variability of absorption and optical properties of key aerosol types observed in worldwide locations. J. Atmos. Sci. 59, 590–608. doi: 10.1175/1520-0469(2002)059<0590:VOAAOP>2.0.CO;2
Feng, N., and Christopher, A. A. (2013). Satellte and surface-based remote sensing of Southeast Asian aerosols and their radaitive effects. Atmos. Res. 122, 544–554. doi: 10.1016/j.atmosres.2012.02.018
Giglio, L., Descloitres, J., Justice, C. O., and Kaufman, Y. J. (2003). An enhanced contextual fire detection algorithm for MODIS. Remote Sens. Environ. 87, 273–282. doi: 10.1016/S0034-4257(03)00184-6
Holben, B. N., Eck, T. F., Slutsker, I., Tanré, D., Buis, J. P., Setzer, A., et al. (1998). AERONET - a federated instrumentnetwork and data archive for aerosol characterization. Remote Sens. Environ. 66, 1–16. doi: 10.1016/S0034-4257(98)00031-5
IPCC (Intergovernmental panel on climate change) (2013). Climate change. The Physical science basis, Contribution of Working Group 1 to the Fifth Assessment Report of the IPCC. Cambridge University Press, Cambrige.
Ishimoto, H., Masuda, K., Mano, Y., Orikasa, N., and Uchiyama, A. (2012). Irregularly shaped ice aggregates in optical modeling of convectively generated ice clouds. JQSRT 113, 632–643. doi: 10.1016/j.jqsrt.2012.01.017
Justice, C. O., Giglio, L., Korontzi, S., Owens, J., Morisette, J. T., Roy, D., et al. (2002). The MODIS fire products. Remote Sens. Environ. 83, 244–262. doi: 10.1016/S0034-4257(02)00076-7
K-1 model developers (2004). K-1 Coupled GCM (MIROC) Description, K-1 Technical Report No.1, Center for Climate System Research (Univ. of Tokyo). National Institute for Environmental Studies and Frontier Research Center for Global Change.
Kahn, R. A. (2012). Reducing the uncertainties in direct aerosol radiative forcing. Surv. Geophys. 33, 701–721. doi: 10.1007/s10712-011-9153-z
Lamarque, J.-F., Bond, T. C., Eyring, V., Granier, C., Heil, A., van Vuuren, D. P., et al. (2010). Historical (1850-2000) gridded anthropogenic and biomass burning emissions of reactive gases and aerosols: methodology and application. Atmos. Chem. Phys. 10, 7017–7039. doi: 10.5194/acp-10-7017-2010
Lean, J., Rottman, G., Harder, J., and Kopp, G. (2005). SORCE contributions to new understanding of global change and solar variability. Sol. Phys. 230, 27–53. doi: 10.1007/s11207-005-1527-2
Lee, K. H., and Kim, Y. J. (2010). Satellite remote sensing of Asian aerosols: a case study of clean, polluted and dust storm days. Atmos. Meas. Tech. 3, 1771–1784. doi: 10.5194/amt-3-1771-2010
Li, W. J., Shao, L. Y., and Buseck, P. R. (2010). Haze types in Beijing and the influence of agricultural biomass burning. Atmos. Chem. Phys. 10, 8119–8130. doi: 10.5194/acp-10-8119-2010
Littmann, T. (1991). Dust storm frequency in Asia: Climatic control and variability. Int. J. Climatol. 11, 393–412. doi: 10.1002/joc.3370110405
Meinshausen, M., Smith, S. J., Calvin, K. V., Daniel, J. S., Kainuma, M., Lamarque, J.-F., et al. (2011). The RCP greenhouse gas concentrations and their Extension from 1765 to 2300. Climate. Change 109, 213–241. doi: 10.1007/s10584-011-0156-z
Mukai, S., Nakata, M., Yasumoto, M., Sano, I., and Kokhanovsky, A. (2015). A study of aerosol pollution episode due to agriculture biomass burning in the east-central China using satellite data. Front. Environ. Sci. 3:57. doi: 10.3389/fenvs.2015.00057
Mukai, S., Sano, I., and Nakata, M. (2016). Improvement of retrieval algorithms for severe air pollution. Proc. SPIE 10008:1000811. doi: 10.1117/12.2240485
Mukai, S., Yasumoto, M., and Nakata, M. (2014). Estimation of biomass burning influence on air pollution around Beijing from an aerosol retrieval model. Sci. World J. 2014:649648. doi: 10.1155/2014/649648
Mukai, S., Yokomae, T., Sano, I., Nakata, M., and Kohkanovsky, A. (2012). Multiple scattering in a dense aerosol atmosphere. Atmos. Meas. Tech. Discuss. 5, 881–907. doi: 10.5194/amtd-5-881-2012
Nakata, M., Sano, I., and Mukai, S. (2015). Air Pollutants in Osaka (Japan). Front. Environ. Sci. 3:18. doi: 10.3389/fenvs.2015.00018
Omar, A. H., Won, J. G., Winker, D. M., Yoon, S. C., Dubovik, O., McCormick, M. P., et al. (2005). Development of global aerosol models using cluster analysis of Aerosol Robotic Network (AERONET) measurements, J. Geophys. Res. 110, D10S14, 1–14. doi: 10.1029/2004JD004874
Pérez, C., Nickovic, S., Pejanovic, G., Baldasano, J. M., and Özsoy, E. (2006). Interactive dust-radiation modeling: a step to improve weather forecast. J. Geophys. Res. 111:D16206. doi: 10.1029/2005JD006717
Reid, J. S., Hyer, E. J., Johnson, R. S., Holben, B. N., Yokelson, R. J., Zhang, J., et al. (2013). Observing and understanding the Southeast Asian aerosol system by remote sensing: an initial review and analysis for the Seven Southeast Asian Studies (7SEAS) program. Atmos. Res. 122, 403–468. doi: 10.1016/j.atmosres.2012.06.005
Sato, M., Hansen, J. E., McCormick, M. P., and Pollack, J. B. (1993). Stratospheric aerosol optical depth 1850-1990, J. Geophys. Res. 98, 22987–22994. doi: 10.1029/93JD02553
Sobolev, V. V. (1963). A treatise on radiative transfer, (translated by S.I.Gaposchkin. van Nostlsnd, Princeton, NJ).
Takemura, T., Nozawa, T., Emori, S., Nakajima, T., and Nakajima, T. (2005). Simulation of climate response to aerosol direct and indirect effects with aerosol transport-radiation model. J. Geophys. Res. 110:D02202. doi: 10.1029/2004JD005029
Tomasi, C., Fuzzi, S., and Kokhanovsky, A. (2016). Atmospheric Aerosols: Life Cycles and Effects on Air Quality and Climate. Hoboken, NJ: John Wiley & Sons, Inc., 704.
Uesugi, A., and Irvine, W. M. (1970). Multiple scattering in a plane-parallel atmosphere. I. Successive scattering in a semi-infinite medium. Astrophys. J. 159, 127–135
van de Hulst, H. C. (1963). A New Look at Multiple Scattering. New York, NY: NASA Institute for Space Studies.
Wang, J., Liu, Q., Ying, N., Wang, X., and Ma, J. (2013). Air quality evaluation on an urban scale based on MODIS satellite images. Atmos. Res. 132, 22–34. doi: 10.1016/j.atmosres.2013.04.011
Wang, J., Xu, X., Spurr, R., Wang, Y., and Drury, E. (2010). Improved algorithm for MODIS satellite retrievals of aerosol optical thickness over land in dusty atmosphere: implications for air quality monitoring in China. Remote Sens. Environ. 114, 2575–2583. doi: 10.1016/j.rse.2010.05.034
Wang, L., Liu, Z., Sun, Z., Ji, D., and Wang, Y. (2015). Long-range transport and regional sources of PM2.5 in Beijing based on long-term observations from 2005 to 2010, Atmos. Res. 157, 37–48. doi: 10.1016/j.atmosres.2014.12.003
Watanabe, S., Haijima, T., Sudo, K., Nagashima, T., Okajima, H., Nozawa, T., et al. (2011). MIROC-ESM 2010: model description and basic results of CMIP5-20c3m experiment. Geosci. Model Dev. 4, 845–872. doi: 10.5194/gmd-4-845-2011
Yang, Y., Liu, X., Qu, Y., Wang, J., An, J., Zhang, Y., et al. (2015). Formation mechanism of continuous extreme haze episodes in the megacity Beijing, China, in January 2013, Atmos. Res. 155, 192–203. doi: 10.1016/j.atmosres.2014.11.023
Keywords: air pollution, climate model, MODIS, aerosol retrieval, radiative transfer
Citation: Nakata M, Mukai S and Yasumoto M (2018) Seasonal and Regional Characteristics of Aerosol Pollution in East and Southeast Asia. Front. Environ. Sci. 6:29. doi: 10.3389/fenvs.2018.00029
Received: 25 November 2017; Accepted: 30 April 2018;
Published: 23 May 2018.
Edited by:
Leonidas Ntziachristos, Aristotle University of Thessaloniki, GreeceReviewed by:
Eduardo Landulfo, Instituto de Pesquisas Energéticas e Nucleares (CNEN), BrazilIlias Vouitsis, Aristotle University of Thessaloniki, Greece
Copyright © 2018 Nakata, Mukai and Yasumoto. This is an open-access article distributed under the terms of the Creative Commons Attribution License (CC BY). The use, distribution or reproduction in other forums is permitted, provided the original author(s) and the copyright owner are credited and that the original publication in this journal is cited, in accordance with accepted academic practice. No use, distribution or reproduction is permitted which does not comply with these terms.
*Correspondence: Sonoyo Mukai, c19tdWthaUBrY2cuYWMuanA=