 Michelle Y. Quigley
 Mark L. Rivers2
 Alexandra N. Kravchenko
95% of researchers rate our articles as excellent or good
Learn more about the work of our research integrity team to safeguard the quality of each article we publish.
Find out more
ORIGINAL RESEARCH article
Front. Environ. Sci. , 29 May 2018
Sec. Soil Processes
Volume 6 - 2018 | https://doi.org/10.3389/fenvs.2018.00028
This article is part of the Research Topic Elucidating Microbial Processes in Soils and Sediments: Microscale Measurements and Modeling View all 24 articles
With the advent of computed microtomography (μCT), in situ 3D visualization of soil at micron scale became easily achievable. However, most μCT-based research has focused on visualization and quantification of soil pores, roots, and particulate organic matter (POM), while little effort has been put in exploring the soil matrix itself. This study aims to characterize spatial heterogeneity of soil matrix in macroaggregates from three differing long term managements: conventionally managed and biologically based row-crop agricultural systems and primary successional unmanaged system, and explore the utility of using grayscale gradients as a proxy of soil organic matter (SOM). To determine spatial characteristics of the soil matrix, we completed a geostatistical analysis of the aggregate matrix. It demonstrated that, while the treatments had the same range of spatial correlation, there was much greater overall variability in soil from the biologically based system. Since soil from both managements have the same mineralogy and texture, we hypothesized that greater variability is due to differences in SOM distributions, driven by spatial distribution patterns of soil pores. To test this hypothesis, we applied osmium (Os) staining to intact micro-cores from the biologically based management, and examined Os staining gradients every 4 μm from 26 to 213 μm from pores of biological or non-biological origin. Biological pores had the highest SOM levels adjacent to the pore, which receded to background levels at distances of 100–130 μm. Non-biological pores had lower SOM levels adjacent to the pores and returned to background levels at distances of 30–50 μm. This indicates that some of the spatial heterogeneity within the soil matrix can be ascribed to SOM distribution patterns as controlled by pore origins and distributions. Lastly, to determine if the grayscale values could be used as a proxy for SOM levels, gradients of grayscale values from biological and non-biological pores were compared with the Os gradients. Grayscale gradients matched Os gradients for biological pores, but not non-biological pores due to an image processing artifact. Grayscale gradients would, therefore, be a good proxy for SOM gradients near biological origin pores, while their use for non-biological pores should be conducted with caution.
The use of computed microtomography (μCT) has allowed for the in situ characterization of the physical structure of soil, specifically, positions, size distributions, and shapes of soil pores (Gibson et al., 2006; Chun et al., 2008; Peth et al., 2008; Papadopoulos et al., 2009; Kravchenko et al., 2011; Wang et al., 2012). It also enabled identification of large organic fragments, including particulate organic matter (POM) (Kravchenko et al., 2014a) and intact plant roots (Mooney et al., 2012). These advances led to quantitative insights into the contribution of pore characteristics to residue decomposition, carbon protection, and spatial patterns of bacterial distributions (De Gryze et al., 2006; Ananyeva et al., 2013; Wang et al., 2013; Kravchenko et al., 2014b; Negassa et al., 2015). However, little focus has been given to μCT information regarding mineral soil matrix, that is, solid material containing no pores or organic fragments visible at the μCT image resolution. Of particular interest is how characteristics of the solid material may relate to soil organic matter (SOM) dynamics, specifically SOM protection.
Solid material is represented in μCT images by a range of grayscale values that are correlated to the attenuation of x-rays, which is controlled by the density and atomic number (Z) of the elements occurring within an image voxel (Ketcham, 2005; Peth, 2010). Voxels that contain primarily low Z elements, such as nitrogen, carbon, and oxygen, have lower grayscale values (appear darker) on μCT images, while voxels containing higher Z elements, such as iron, silicon, and aluminum, have higher grayscale values (appear brighter). A voxel's overall grayscale value is the average attenuation of the elements occurring within that voxel. Spatial variability in grayscale values of the solid material originates from multiple sources, including variations in mineralogy, presence of pores with sizes below image resolution, and SOM distribution patterns. The first two of these factors are important drivers of SOM protection, while the third one is an indicator of where such protection has occurred. Mineralogy influences SOM protection by affecting organic matter binding via electrostatic forces. Small pores can contribute to SOM protection by a combination of restricting decomposers' access and retardation of decomposition due to anaerobic conditions prevalent in these pores (Bailey et al., 2017; Keiluweit et al., 2017). Thus, overall SOM distribution patterns are likely controlled by a combination of mineralogy and pore architecture, i.e., pore size and connectivity (Dungait et al., 2012; Kravchenko et al., 2015).
Soil pores function as the soil transport network; regulating the flow of nutrients, microorganisms, oxygen, and organic material (Young and Crawford, 2004; De Gryze et al., 2006; Kuzyakov and Blagodatskaya, 2015; Negassa et al., 2015). Soil pores are created through either biological or non-biological means. Biological pores are formed by macrofauna, such as earthworms, or through action of roots and root hairs as they spread and grow. Non-biological pores are primarily produced in a course of wetting/drying and freeze/thaw cycles and are controlled by soil texture, specifically clay content. Biological and non-biological pores also play different roles in the cycling of organic matter within the soil. Biological pores are generally thought of as a source of new carbon inputs, either through direct organic addition, such as decaying roots, or through ancillary organic matter additions, such as root exudates. Organic matter that then diffuses out from biological pores typically occurs as dissolved organic matter (DOM). DOM can be bound to minerals by electrostatic forces (Kiem and Kögel-Knabner, 2002; Six et al., 2002; Dungait et al., 2012), where, due to the electrostatic force being greater than the enzyme binding energy, it can be protected from microbial attack and results in SOM protection (Dungait et al., 2012). While biological origin pores are sources of organic matter and SOM protection, they also compress adjacent solid material as roots push through the soil resulting in denser material closer to root pores (Bengough et al., 2011; Aravena et al., 2014). Thus, the net effect of biological pores on proximate densities is uncertain. Formation of non-biological pores, on the other hand, created through the shrinking and swelling of clay minerals, can expose previously inaccessible carbon to microbial attack, resulting in a net carbon loss (Sørensen, 1974; Denef et al., 2001; Smucker et al., 2007). However, quantitative data on how presence, abundance, and characteristics of pores of different origins influence SOM accrual and protection is currently lacking. Falconer et al. (2015) noted that despite identical bulk characteristics, including average porosity, POM turnover rate varied widely due to micro-scale properties. Their results indicated that an understanding of micro-scale pore properties may be vital to achieve more accurate modeling of soil carbon dynamics.
The grayscale values of the solid material in μCT images could potentially provide insights into spatial patterns of SOM and the associations between such patterns and pores of different origins. As noted previously, a voxel's overall grayscale value is the average attenuation of the elements occurring within that voxel. While mineralogy plays the largest role in the spatial characteristics of the solid material and would normally override any spatial characteristics from distribution of SOM and presence of pores with below image resolution sizes, samples with similar mineralogy would allow for the spatial patterns caused by these other factors to be observed. There is some experimental evidence that, in samples with similar mineralogy, grayscale values of μCT images and SOM are correlated (Ananeyva, personal communications).
Studies have shown that geostatistics is helpful for describing the spatial characteristics of pores and, therefore, can be expected to also model well the spatial characteristics of the solid material (De Gryze et al., 2006; Feeney et al., 2006; Nunan et al., 2006). Therefore, to assess spatial patterns within the solid material, geostatistics will be used to quantify the range of spatial correlation, overall spatial variability, and the contribution of spatial variability that is below image resolution to the overall spatial variability.
Here we would like to explore the utility of using the spatial patterns of grayscale values in μCT images as a proxy for the spatial patterns of SOM distribution. As such, we will focus on SOM distribution patterns in the vicinity of soil pores of both non-biological and biological origin. This focus is driven by an expectation that, due to the role of biological pores in supplying new organic inputs and the role of non-biological pores in contributing to carbon losses, their comparison should yield contrasting gradients in SOM distributions. Identification of such gradients will indicate that grayscale values can provide useful information on SOM distribution patterns within intact soil samples.
To further verify the utility of grayscale values as indicators of SOM spatial patterns, we will compare the gradients of grayscale values from conventional μCT images with gradients of Osmium (Os) stained organic matter from Os dual-energy images. Os staining has been proposed as an effective tool to visualize organic matter in μCT images (Peth et al., 2014) and was applied to estimate SOM spatial patterns (Rawlins et al., 2016). Os strongly binds with carbon-carbon double bounds and its high atomic number increases the visibility of organic matter on μCT images. By taking images above and below the K-edge of Os, 3D maps of SOM within an intact soil sample can be constructed. From such maps we can then obtain direct measurements of SOM gradients in the vicinity of non-biological and biological soil pores.
Agricultural management is known to have an effect on overall SOM levels (Oades, 1984; Six et al., 2000; Syswerda et al., 2011; Paul et al., 2015), as well as on micro-scale SOM patterns (Ananyeva et al., 2013; Kravchenko et al., 2015). Since pores are known drivers of SOM protection, any change in the spatial pattern of pores would result in a change in SOM spatial patterns and potentially SOM levels. The distribution of non-biological and biological pores is known to be affected by agricultural management. Wang et al. (2012) and Kravchenko et al. (2014b) both that observed non-biological pores tended to dominate in systems with tillage, while pores of biological origin tended to dominate in conservation managements with little soil disturbance.
We hypothesize that areas dominated by non-biological pores will have relatively uniform microenvironmental conditions, thus relatively uniform SOM spatial distribution patterns. Together with lack of point sources of organic matter in such pores, this will lead to smaller SOM gradients in their vicinity. On the other hand, areas dominated by biological pores provide spatially variable SOM inputs as well as a more diverse range of microenvironmental conditions for microorganisms. Thus, we expect greater spatial variability in SOM, as well as greater SOM gradients, in the vicinity of biological pores. In addition, we hypothesize that agricultural management practices that lead to a greater presence of biological pores will increase SOM spatial variability and result in larger SOM gradients than the management practices with greater presence of non-biological pores.
The first objective of the study is to explore utility of grayscale values of solid material from μCT images to characterize SOM patterns by comparing grayscale value spatial patterns with Os spatial patterns. The second objective is to explore spatial characteristics of the solid material in μCT images of intact soil samples from three contrasting land use and management practices and to analyze relationships between the spatial characteristics and the SOM levels of these practices. Our third objective is to explore SOM and grayscale value gradients at distances from pores of different origins and in soils from different managements.
The studied soil was collected from three different managements at Kellogg Biological Station Long Term Ecological Research station, Hickory Corners, MI (42°24′N, 85°24′W). The three managements were a conventional corn-soybean wheat management maintained with current best management practices, a biologically based corn-soybean-wheat with rye cover after corn and red clover interseeded into wheat with no additional inputs and rotary tillage between rows for weed management, and a primary successional management, which is burned annually, but otherwise unmanaged. These management practices represent a management gradient with a highly managed system (conventional), a conservation management system (biologically based), and an unmanaged system (primary successional). Further details can be found in Kravchenko et al. (2015).
The soil (from 0 to 15 cm depth) was dry sieved and aggregates of 4–6.3 mm were collected for imaging. μCT images were obtained from beamline 13-BM-D of the GeoSoilEnvironCARS (GSECARS) at the Advanced Photon Source (APS), Argonne National Laboratory (ANL) in Argonne, Illinois. Two-dimensional projections were taken at 0.25° rotation angle steps with a 1 s exposure and combined into a three-dimensional image consisting of 520 slices with 696 by 696 pixels per slice for grayscale analysis and 1,200 slices with 1,920 by 1,920 pixels per slice for analysis of pores below image resolution. The voxel size of the images was 13 μm for grayscale analysis and 2 μm for analysis of pores below image resolution. Pores were identified using the indicator kriging method in 3DMA-Rock (Oh and Lindquist, 1999; Wang et al., 2011) for grayscale analysis and through simple thresholding with Otsu's method for analysis of pores below image resolution.
A total of 32 soil aggregate images were used in the geostatistical analysis, namely, 11 images from conventional and biologically based management and 10 images from primary successional management. On each image we identified 5 soil cubes, 130 × 130 × 130 μm in size (Figure 1). Positions of the cubes were initially randomly selected, with further adjustments made to avoid major overlaps with other cubes, coarse sand grains that would not reflect the overall spatial characteristics of the aggregate, and aggregate boundaries. Soil pores identified by 3DMA-Rock were removed from the cubes prior to geostatistical analysis allowing for analysis of spatial patterns in the solid material only. 3D variograms were obtained using the gstat package in R (Pebesma, 2004) run on the High Performance Computing Center at Michigan State University. Variograms (Supplementary Presentation 1) were fit with an exponential model using PROC NLIN in SAS 9.3 (SAS Inc, 2009). Spatial characteristics of the solid material can be determined from the components of the 3D variograms. The sill, where the variogram flattens out, indicates the total spatial variability within a sample. The range of a variogram, lag distance at which the sill occurs, is the distance for which spatial correlation exists in a sample. The nugget, the difference between the zero and the y-intercept, represents both measurement error and the variability at scales below the image resolution. The nugget to sill ratio describes the relative amount of spatial dependence at the voxel size.
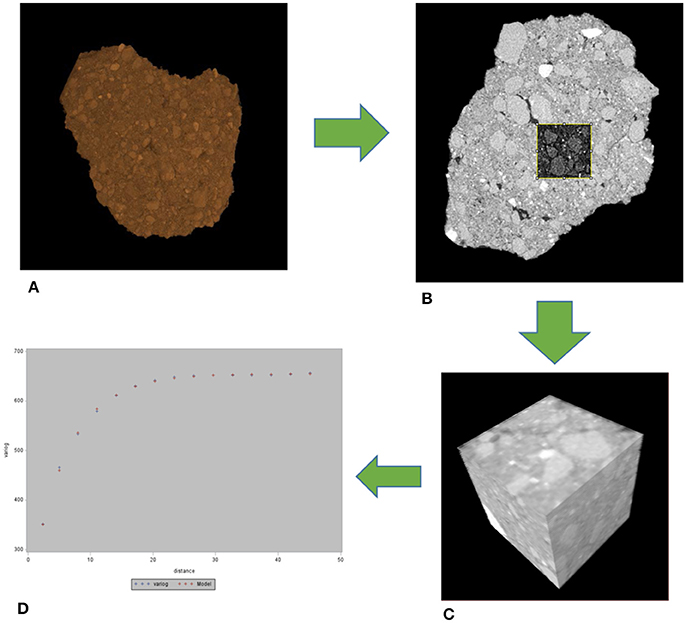
Figure 1. Workflow for the geostatistical analysis. From each whole aggregate (A), 5 cubes were selected (B,C) and then a 3D variogram obtained (D). The whole aggregate is 5 mm in size, while the cubes in the slice (B) and 3D (C) are 130 μm on a side.
Soil samples for Os analysis were taken as mini-cores. Only three mini-cores, all from the biological based management practice, were analyzed. The reason for the small number of samples used for this analysis is the very long image collection time for dual-energy Os scanning limiting the number of samples that could be processed. We choose biologically based management for these analyses, since we expected that pores of both non-biological and biological origin would be well represented in soil under this management. Samples were taken as mini-cores, as opposed to dry sieved aggregates, because of concerns that aggregates would be too fragile for the multiple handling steps required by this method.
The mini-cores were taken at 3.5–5 cm depth using a beveled 3 mL Luer-Lok polypropylene syringe with a 8 mm inner diameter (BD, Franklin Lakes NJ, USA). There was minimal interference with Os staining from polypropylene syringes as they contained almost no carbon-carbon double bounds. Cores were air dried and exposed to OsO4 gas in a fume hood for 1 week. This allowed ample time for the OsO4 gas to diffuse throughout the soil and to ensure maximum binding of Os to the soil organic material. The cores were then scanned at beamline 13-BM-D, GSECARS, APS ANL. Two-dimensional projections were taken at 0.25° rotation angle steps with a 2 s exposure and combined into a three-dimensional image consisting of 1,200 slices with 1,920 by 1,920 pixels per slice. Final images had a 4 μm resolution. Three energies were used for the scans, 74, 73.8, and 28 keV. These energies provided, respectively, an image above Os K-edge, an image below Os K-edge, and an image at an energy optimal for soil pore and POM identification. By taking the difference between the above and below K-edge images, a map of the stained soil organic materials was created (Figure 2). Using the 28 keV images, non-biological pores were identified using simple thresholding, while POM pieces of both root and non-root origin were visually identified by hand. POM of non-root origin was defined as stand-alone organic fragments of round or irregular shape that were not connected to any obvious root remains.
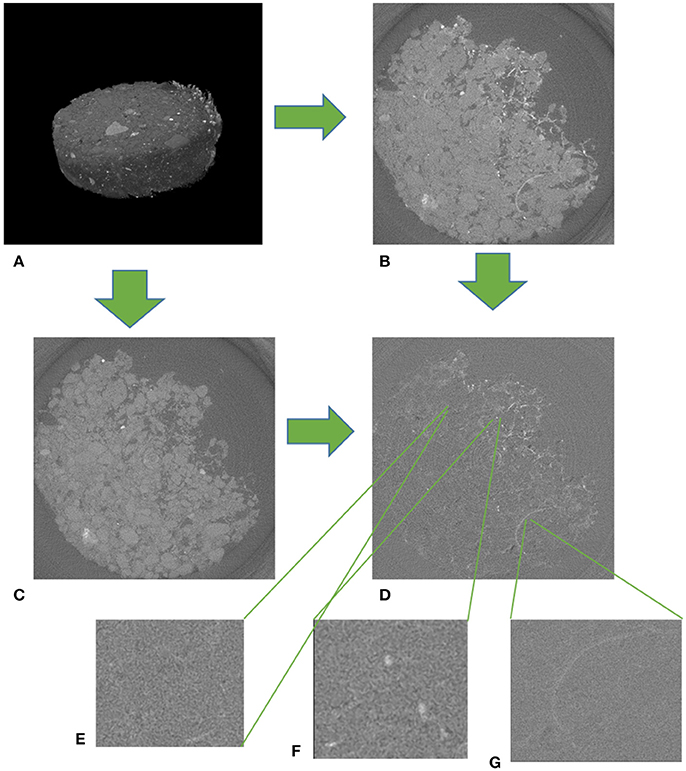
Figure 2. An example of a μCT image from an Os stained soil sample from biologically based management at 4 μm resolution. (A) A 3D scan of an entire Os stained sample. The thickness of the sample was 1 mm. (B) Image of a slice of an Os stained sample above the K-edge (74 keV). (C) Image of a slice of an Os stained sample below the K-edge (73.8 keV). (D) Difference between above and below K-edge images with non-biological pore (E), POM-NS (G), and POM-Root (F) expanded. Total image size is 8 × 8 mm for (B–D).
Two pores containing non-root derived POM (POM-NS), two pores containing root-derived POM (POM-Root) and four pores of non-biological origin were identified by hand for the analyses in each mini-core image (Figure 3). Identified pores varied in size from 20 to 300 μm. The identified pores were dilated by ~13 μm in all three dimensions to match the grayscale gradient results (described below). Then, a set of 4 μm layers were identified around each pore to a maximum distance of 213 μm. Grayscale values of the Os stained map were averaged for each 4 μm layer to obtain an Os gradient. The averages excluded the 0 value as that was the color of the image background. To ensure comparability among the mini-cores, the Os gradients were standardized by subtracting the Os map's average grayscale value from each mini-core.
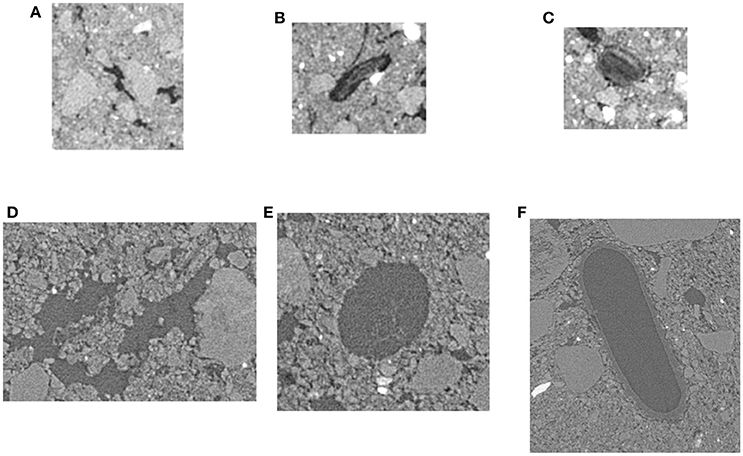
Figure 3. Examples of selected non-biological (A,D), POM-Root (B,E), and POM-NS pores (C,F) for 13 and 2 μm resolution. Non-biological pores were chosen so that no organic matter was visible in the pores and the pores were not round or oval in shape. POM-Root pores were chosen such that organic material was visible in the pores and were root shape, i.e., round or oval with an elongated shape. POM-NS was chosen such that organic material was visible within the pores and the pore did not have a root like shape.
From each of the 32 images used in the geostatistical analysis, we identified three POM-NS, three POM-Root, and five non-biological origin pores (Figure 3). Identified pores ranged in sizes from 40 to 300 μm. In order to remove partial volume effects, the identified pores were dilated by one voxel in all three dimensions, thus they did not include the layer of border voxels that contained both pore and solid material. The grayscale value gradients were obtained by averaging voxels from 13 μm layers around each pore to a maximum distance of 208 μm (Figure 4). Averages did not include the 0 and 255 grayscale values as the 0 value was the value of the image background and excluding the 255 value corrected for any overly dense material, such as iron minerals like magnetite or limonite, in the samples that might have skewed the grayscale averages. To enable direct comparisons between images, the grayscale value gradients were normalized so that the minimum grayscale value was 0 and the maximum grayscale value was 1 for each gradient. Calculation of the distance over which the gradient had influence was done by fitting the individual gradients using PROC NLIN in SAS 9.4 (SAS Inc, 2009) with the following non-linear model:
where x is distance from the pore, n is the y-intercept, s is the average grayscale value of the image, and d is the distance at which the pore stops affecting the grayscale values or effective distance of pore influence (EDPI).
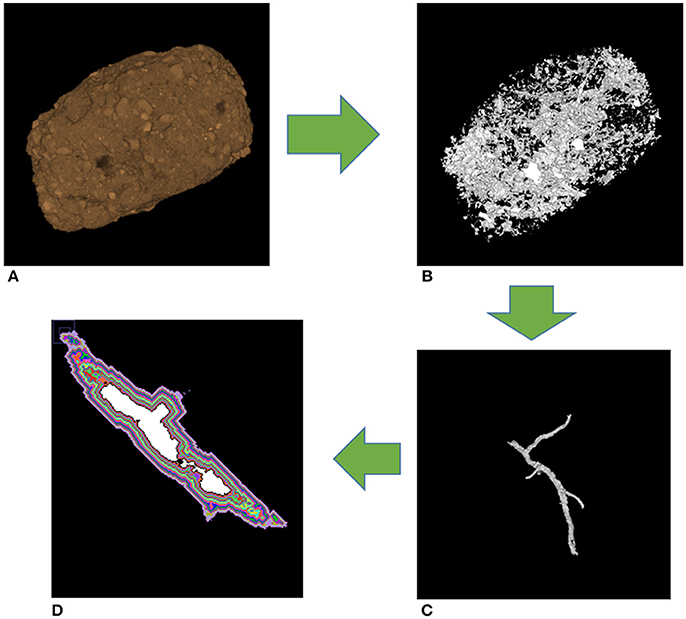
Figure 4. Workflow for grayscale gradients. The whole aggregate (A) has all pores identified (B). Individual pores are then identified (C). Layers are collected for analyses of grayscale gradients (D). Each color represents a different layer, while the white in the middle is the actual pore, and the black layer adjacent to white accounts for partial volume effects.
Presence of pores with sizes below the image resolution (<13 μm) can potentially affect gradients of grayscale values. If that were the case, then it would not be possible to attribute the observed gradients in grayscale values to SOM. In order to explore the potential effect of such pores on the studied grayscale gradients, we scanned six of the 32 studied aggregates at 2 μm resolution. Two aggregates from each management were scanned.
We explored the differences among the studied managements in terms of presence of 2–13 μm pores. The purpose of this analysis was to ensure that the observed differences among the management practices were driven by SOM and not by below-resolution pores. For that, four cubes, 140 × 140 × 140 μm in size, were selected, using a selection process identical to that described above for the geostatistical analysis. Using Otsu's method, the overall porosity of each cube was determined. Binning was then used to compress the cube image to ~13 μm voxel size (Figure 5). Overall porosity of the binned image was then determined using the same threshold as the 2 μm samples. Subtracting the porosity of the binned images from the un-binned images resulted in the 2–13 μm porosity, referred to hereafter as the below image resolution porosity.
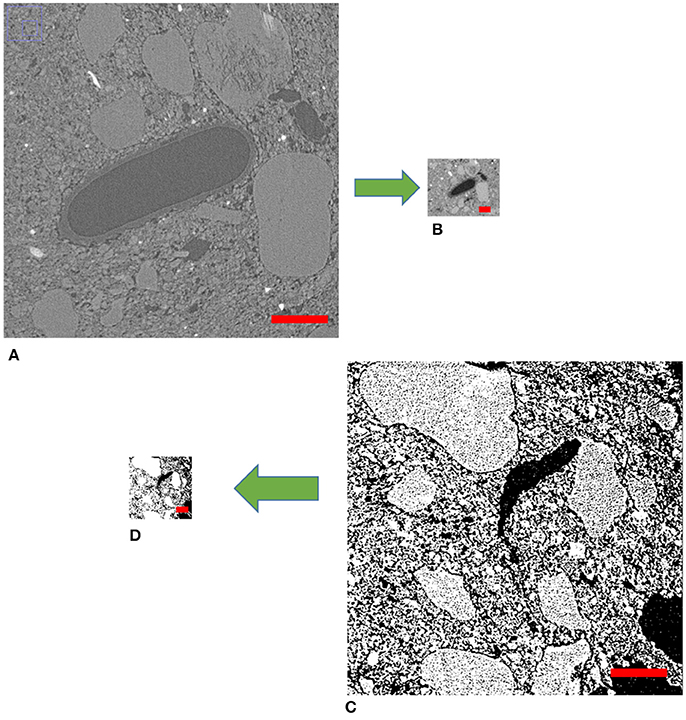
Figure 5. Example of a 2 μm image (A) and the same image reduced to 13 μm resolution (B). Example of thresholding with Otsu's method of the same image at 2 μm (C) and 13 μm (D).
Data analyses for all studied variables were conducted using the mixed model approach implemented in the PROC MIXED procedure of SAS Version 9.4 (SAS Inc, 2009). For comparisons of the geostatistical characteristics and total below image resolution porosity, the statistical model consisted of the fixed effect of management and the random effect of aggregates nested within management. For investigation of pore type and management effects on the grayscale gradients, the statistical model consisted of the fixed effects of management, pore types, distances from the pores, and their interactions, as well as the random effect of aggregates nested within management and the random effect of individual pores nested within respective pore types and aggregates. In this analysis, distance was treated as a repeated measure factor. Comparisons among pore types for the Os gradients were conducted using the statistical model with the fixed effects of pore type, distance, and their interaction and the random effects of soil core and soil core by pore type interaction. As with the grayscale gradients, the Os gradients distance factor was treated as a repeated measure. Comparisons among managements and pore types for the gradient influence distance were evaluated using the statistical model with the fixed effects of management, pore type, and the interactions between them and the random effect of aggregates nested within management. The normality of residuals in all analyses was visually assessed using normal probability plots and stem-and-leaf plots, while equal variances assumption was assessed using Levene's test. Results are reported as statistically significant at α = 0.05 level.
For all analyses, if the interactions were not significant, pairwise comparisons of the main effects using the LSMEANS statement were used. In the case where interactions were significant, slicing using the LSMEANS statement was employed. All distance graphs were created from slicing results. T-tests were conducted to determine if the mean values differed from zero.
Biologically based and primary successional managements had greater overall variability in grayscale values of the solid material than the conventional management system, as indicated by their higher sill values (Table 1). Spatial variations at distances greater than the image resolution (13 μm) accounted for more than 50% of the overall variability, as indicated by nugget-to-sill ratios ranging from 39% in biologically based management to 46 and 48% in primary successional and conventional managements. The three managements did not differ in terms of their nugget and range values, indicating similarities in terms of variabilities at distances <13 μm and of distances at which spatial correlation were present.
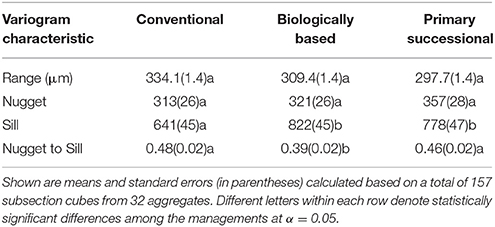
Table 1. Characteristics of the variograms of soil material containing no >13 μm pores in three studied land use and management practices.
The Os gradients were markedly different in pores of non-biological and biological origin (Figure 6). However, Os gradients did not differ between biological pores associated with POM-NS and POM-Root. Pores of biological origin had a large increase in Os labeled SOM immediately adjacent to the pores, which then slowly declined until returning to background levels at distances of 100–130 μm. Non-biological pores, on the other hand, had levels of Os labeled SOM that were statistically lower than background levels (P = 0.0454) at distances up to 30 μm from the pores.
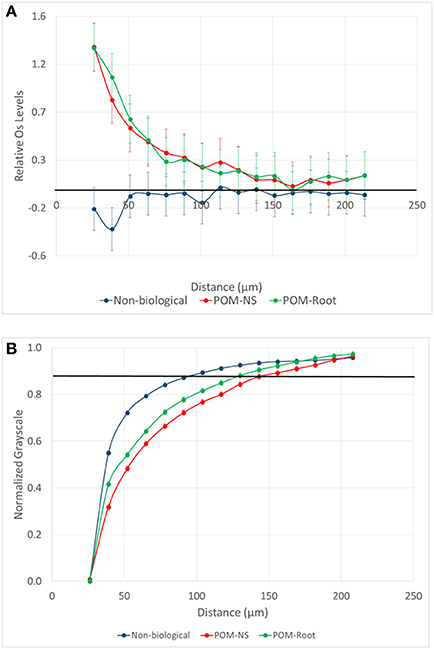
Figure 6. (A) Mean difference from the background level for Os stained samples as a function of distance from pores of biological origin with plant roots (POM-Root) and with non-root derived POM (POM-NS) and from non-biological pores (n = 6). The samples are from the biologically based system. Positive values indicate increased presence of Os labeled SOM, while negative values indicate a decrease in Os labeled SOM. (B) Normalized grayscale values for all three studied pore types from all three management practices. Dots are averages and the standard errors are equal to the size of the dots at each distance. The solid black lines represent the background Os labeled level (on A) and the background grayscale value (on B).
The grayscale gradients for all managements and pore types had decreased grayscale values closer to the pores that increased as distances from the pore increased (Figure 6). This was similar to the biological pore results from the Os gradients. For biological pores, the grayscale gradients matched the Os gradients almost identically. When both grayscale and Os gradients for POM-NS and POM-Root in biologically based management were normalized (Figure 7), the overlap between the relationships was almost perfect, indicating that Os and grayscale value gradients were equivalent.
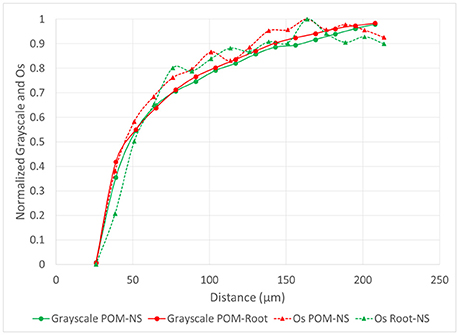
Figure 7. Normalized Os values from Os stained samples (n = 6) and grayscale values (n = 96) from non-stained samples as a function of distance from POM-NS and POM-Root pores in the soil of the biologically based management.
The grayscale levels in the solid material adjacent to non-biological pores were lower than the background grayscale values (average grayscale value of the whole aggregate). However, they increased much faster with increasing distance (Figure 6) and reached the background levels at much shorter distances than those of biological pores (Table 2). For POM-NS and POM-Root, grayscale values returned to background levels at 123 μm, while non-biological pores at 74 μm.
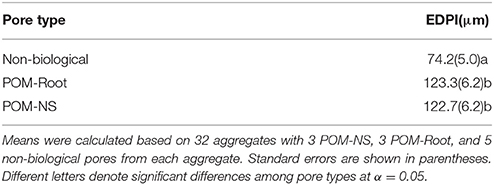
Table 2. Effective distance of pore influence (EDPI) for the three studied pore types averaged across all studied aggregates.
While no differences were observed between POM-NS and POM-Root grayscale gradients for biologically based and primary successional managements (P = 0.4217, 0.2311), POM-NS retained decreased grayscale values over longer distances than POM-Root in conventional management (P < 0.001; Figure 8). No significant differences were observed between managements for non-biological and POM-Root pores (P = 0.8516, 0.3629), but conventional management again showed a shallower POM-NS grayscale gradient than the other managements (P = 0.0096). EDPI only varied by pore type, indicating that management had no effect on this characteristic of grayscale value distributions (Table 2).
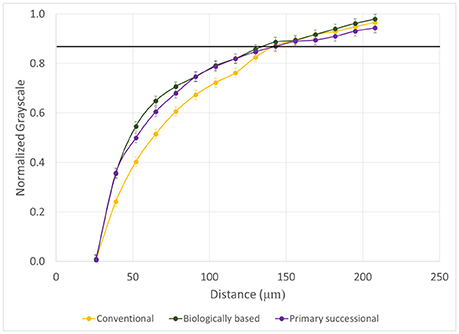
Figure 8. Normalized grayscale values as a function of distance from POM-NS pores for the three management practices (n = 96). Error bars represent standard errors. The solid black line represents the background grayscale value, i.e., the average grayscale value of the entire aggregate.
While the >2 μm and the >13 μm porosity differed among the managements (P = 0.0435), the below image resolution porosity (2–13 μm) was the same for all three managements (P = 0.4513; Figure 9). The >13 μm porosity and the >2 μm porosity were greater in the biologically based management than the conventional management, while the primary successional management was not significantly different from either management.
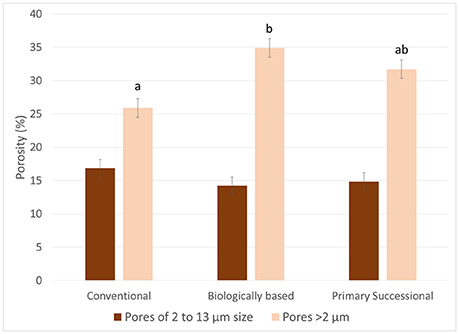
Figure 9. Percentage of 2–13 μm and >2 μm pores in aggregates of the three managements. Letters indicate significant differences between managements for >2 μm pores at α = 0.05. The differences in 2–13 μm pores were not statistically significant. Error bars represent standard errors.
Our findings indicate that grayscale values can be a useful proxy for SOM, however, caution needs to be exercised in such use. Specifically, in the studied soil, a reliable correspondence between SOM gradients as determined via Os staining and grayscale value gradients was achieved only for pores of biological origin. As can be seen from Figure 7, the Os and grayscale gradients corresponded to each other remarkably well, indicating that grayscale gradients can be used as a suitable proxy when exploring SOM patterns near pores of biological origin. It should be noted that the EDPI observed (123 μm) is consistent with previously reported ranges for SOM distributions in soil of 38–175 μm determined through the use of Os staining and geostatistical analyses, although these analyses were not correlated to pores specifically (Rawlins et al., 2016). Previous studies utilizing isotopically labeled materials have reported movement of decomposition products as far as 5–10 mm from carbon sources during soil incubations (Gaillard et al., 1999, 2003; Toosi et al., 2017). However, these studies do not specifically measure transport of DOM from individual pores, but overall transport of isotopic labeled materials from its source, which would account for the larger transport ranges seen in previous studies. Direct imaging of the spatial distribution of SOM near individual pores has previously been achieved using NanoSIMS, however, at spatial scales much lower (nm) than those used in this study. Mueller et al. (2012) showed that, in the 5 mm and <63 μm samples used in their study, DOM moved ~2 μm from a carbon source, but also found indications of possibly larger spatial ranges at larger spatial scales. The 123 μm distance may indicate the typical diffusion distance of DOM from biological pores into the soil matrix in similarly textured soils.
For non-biological pores, Os staining and grayscale value gradient trends did not match. The grayscale levels increased with the distance from the pore, which could be interpreted as increased SOM concentrations near the pore. Yet, the Os gradients clearly indicate lower SOM levels in immediate vicinity (<30 micron) of non-biological pores (Figure 6). This result was hypothesized to be due to increased <13 μm porosity closer to non-biological origin pores. However, no difference in <13 μm porosity was observed among pore types (Figure 10). A possible explanation for this discrepancy is an artifact of image processing via 3DMA. 3DMA uses indicator kriging as a thresholding method, while the distance measures were conducted using Otsu's method due to computational and time limits resulting from the smaller image resolution. Indicator kriging performs well for identifying pores well above the image resolution, but may misidentify pores of sizes at or only slightly larger than the image resolution (Figure 11). Thus, the decreases in the grayscale values might be due to such missed porosity in non-biological pores. For non-biological pores, indicator kriging fails to identify small visible connections between larger pores, that extend for several voxels between adjacent pores due to using the surrounding voxels to help determine if a voxel is pore or not, while Otsu's method correctly identifies these pores because it only uses the raw grayscale value to identify pores. This artifact is less pronounced in biological pores as biological pores have no such small connections and, therefore, the true extent of the pore was accounted for.
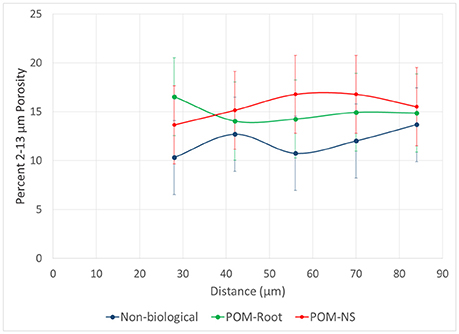
Figure 10. Percentage of 2–13 μm pores as a function of distance from pores of biological origin with plant roots (POM-Root) and with non-root derived POM (POM-NS) and from non-biological pores (n = 8). Error bars are standard errors at each distance.
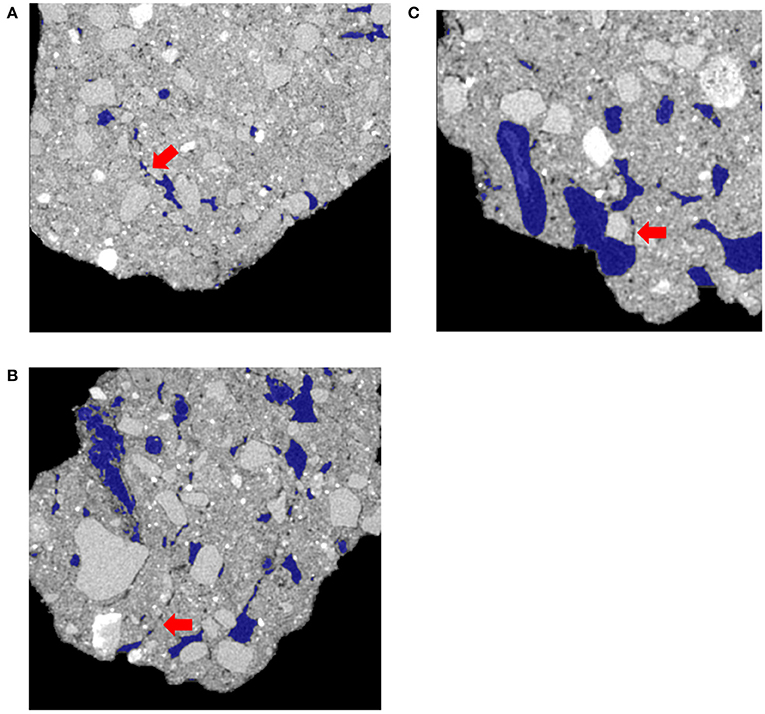
Figure 11. Examples from the three different managements of how 3DMA missed pore material adjacent to non-biological pores, but identifies POM-Root and POM-NS pores correctly. (A) is from the conventional management, (B) is from the biologically based, and (C) is from the primary successional. The blue outlines are the pores identified by 3DMA. Red arrows on each figure indicate an example of missed porosity on each figure.
The reason for this artifact to be present in pores of non-biological but not biological origin can be explained by the processes that create the pores of these two different types. Biological pores are created through the radial compression of the surrounding matrix as a root or macrofauna pushes through the soil and is then supported by organic binding agents, such as mucilage, mucus, and large amounts of DOM from decomposing organic matter, resulting in a clear boundary between pore and solid material (Gray and Lissmann, 1938; Greacen and Oh, 1972; Greacen and Sands, 1980; Czarnes et al., 2000; Ruiz et al., 2017). Additionally, Helliwell et al. (2017) found that while porosity near roots increased initially in sandy soils, which is similar to the texture of these soils, after 8 days of growth, porosity was found to decreased adjacent to roots at this image resolution. Non-biological pores are created through the shrinking and expanding of clays, resulting in neither clear nor stable boundaries (Peng et al., 2007). However, using a different thresholding method may overcome the artifact effect.
The nugget to sill ratio values of the studied samples indicate that approximately 50–60% of the spatial variability in grayscale values of the solid material is accounted for at >13 μm distances. This matches the porosity data, where approximately 50% of the porosity occurs at >13 μm (Figure 9). Biologically based management had the most porosity above 13 μm and the lowest nugget to sill ratio, while conventional management had the lowest porosity above 13 μm and the highest nugget to sill ratio. Since nugget to sill ratio indicates the relative amount of spatial dependence at voxel size, this may indicate a connection between spatial dependence and porosity at image scale. This would support our hypothesis that spatial variability in the solid material of similar mineralogy is driven by pores. However, more research would be necessary to confirm this connection.
The lack of difference in spatial correlation ranges among the aggregates from the three managements was surprising. Tillage, utilized both in conventional and biologically based management, homogenizes the soil, which, according to our expectations and previous findings (Garrett, 2009), should be manifested in greater spatial correlation range values. Lack of such an effect in our samples may indicate that the spatial correlation range in this soil is controlled more by the inherent mineralogy and/or texture, which are similar for the soil of all three managements, than by the management-driven SOM differences. The EDPI was much smaller than the spatial correlation range (123 vs. 312 μm) lending further support to the notion that the SOM distribution was not a driver of the spatial correlation range values. Rawlins et al. (2016) investigated the spatial ranges of SOM, pores, minerals, and bulk from μCT images. While the spatial ranges for SOM (38–175 μm) were greater than mineral and pores alone, the spatial ranges for bulk variograms were <250 μm, which is congruent with our results.
Observed similarity in the nugget values from the three studied managements was in agreement with the results of Nunan et al. (2006), who found similar nuggets between three different amendment managements. The lack of differences between nuggets corroborates the below image resolution porosity measurements where the below image resolution porosity was similar between all three managements (Figure 9). The differences observed in the overall porosity matched results previously reported for these aggregates with biologically based ≥ primary successional ≥ conventional (Kravchenko et al., 2015).
Greater overall spatial variability in conservational practices, i.e., biologically based and primary successional managements, manifested via greater sill values (Table 1), is likely a result of management-induced changes in SOM. As mentioned above, soil mineralogy and texture of the studied managements were very similar, as well as their below image resolution porosity values (Figures 9, 10). Yet, after almost 20 years of implementation, the biologically based and primary successional management practices resulted in higher SOM than the conventionally managed practice (Paul et al., 1999; Senthilkumar et al., 2009). Observed greater variability in grayscale values of biologically based and primary successional managements suggests that these SOM inputs were not uniformly distributed. This assertion is supported by previous findings of Ananyeva et al. (2013) who reported greater variability in soil carbon within the macro-aggregates from primary successional management as compared to conventional management practice; while Feeney et al. (2006) observed that active biota, in particular roots, increased spatial correlation of soil pores. Spatial gradients in SOM associated with pores of biological origin is one possible mechanism contributing to the increased variability.
The increased spatial variability observed in the grayscale values of the biologically based and primary successional managements, if driven by SOM distributions, would indicate increased occurrence of different microenvironments of either increased or decreased amounts of SOM, while conventional management would have less of these differing microenvironments. Greater presence of biological pores may result in an increased diversity of microenvironmental conditions, including different levels of microbial accessibility, nutrient availability, and potentially water and gas fluxes. Such microenvironmental differences affect microbial activities (Ekschmitt et al., 2005, 2008; Kravchenko and Guber, 2017); and greater SOM decomposition can be expected in microenvironments conducive to high microbial activity, while SOM protection in microenvironments where microbial activity is reduced. This increase in microenvironment heterogeneity, and therefore, greater presence of microsites where SOM might not be available to microbial decomposers and/or reduction of microbial decomposition due to anaerobic microsites (Keiluweit et al., 2016, 2017), may be reflective of the increased carbon protection/sequestration observed in the biologically based and primary successional managements as compared to conventional management (Paul et al., 1999; Senthilkumar et al., 2009).
Our Os results demonstrated that pores were the drivers of SOM's spatial variability in the studied soil (Figure 6). Biological pores, had a clear spatial gradient of SOM with highest levels in the vicinity of pores and decreasing when moving into the surrounding solid material. Biological pores are observed more frequently in biologically based and primary successional managements as biological pores tend to be <90 μm, which have a higher abundance in these managements. Non-biological pores, had a small decrease in SOM adjacent to the pores, but otherwise their presence was not related to SOM distribution patterns. Non-biological pores are observed more frequently in conventional management as non-biological pores tend to be 40–90 μm in size, which have a higher abundance in this management. Oxygen availability may control the decrease in SOM observed adjacent to non-biological pores. In the studied soil, <13 μm pores (below image resolution sizes) are water filled during most of the year. This would hamper the diffusion of oxygen and lead to dominance of anaerobic conditions, which can result in as much as a 10-fold decrease in decomposition rates (Keiluweit et al., 2017). The likely outcome is, thus, organic's decomposition near large (20–300 μm) pore boundaries, where oxygen is available, and organic's preservation in anaerobic (<13 μm pore) zones.
The effect of management on the SOM gradients as inferred from the grayscale gradient was unanticipated. There were no differences between managements observed for non-biological and POM-Root pores. However, there was observed differences between the managements in POM-NS pores. Biologically based and primary successional managements had no differences between POM-Root and POM-NS pores. Conversely, in conventional management, POM-NS gradients tended to retain decreased grayscale values over longer distances. It is inferred that this decrease would be related to an increase in SOM content. A possible explanation is that, per visual observations. POM-NS within conventional soil aggregates tended to be located closer to the interior of soil aggregates and/or away from pores of >13 μm size, while POM-NS in biologically based and primary successional managements were located closer to the aggregate exterior and/or nearer to pores of >13 μm size. Such isolation in conventional soil would result in restriction of microorganism, water, and oxygen access to POM-NS, resulting in incomplete decomposition. The incomplete decomposition produces decomposition products of a more hydrophobic nature. This hydrophobicity would decrease the ability of these products to be transported by water, resulting in a build-up of organic matter closer to the pore. Toosi et al. (2017) observed that as maximum pore size decreases the presence of SOM compounds with fewer oxygen functional groups and greater aromaticity increases; this observation supports our increased hydrophobicity explanation.
Analysis of grayscale gradients near pores of biological origin were found to be a useful proxy for assessing SOM spatial distribution patterns at micro-scale. Grayscale gradients of non-biological pores, in contrast, were found to be different from SOM gradients due to a pore identification artifact. Utilizing a different thresholding method may overcome this limitation.
Os and grayscale value gradients indicate increased SOM concentrations adjoining biological pores, decreasing to background levels as distance from the pore increases. The average distance of positive influence of biological pores on SOM levels was 123 μm. Os gradients indicate that SOM concentrations decreased in the direct vicinity of non-biological pores then returning to the background levels. The average distance of negative influence of non-biological pores on SOM levels was 30 μm.
Soil material without >13 μm pores was more variable in its grayscale values in biologically based and primary successional management than in conventional management practice. The greater variability is believed to be driven by SOM spatial distribution patterns, which reflect presence of soil pores, especially, pores of biological origin. This spatial variability likely results in greater variability of microenvironmental conditions for microbial functioning with possible implications for soil carbon protection.
MQ developed concepts, conducted data analyses and wrote the paper; MR contributed to research conduct; AK contributed to the development of research concepts, research conduct and writing.
Support for this research was provided in part by the USDA-NIFA, Award No. 2016-67011-24726 Using stable isotopes and computer tomography to determine mechanisms of soil carbon protection in cover crop based agricultural systems and by the US National Science Foundation Long-Term Ecological Research Program (DEB 1027253) at the Kellogg Biological Station and by Michigan State University AgBioResearch. Portions of this work were performed at GeoSoilEnviroCARS (The University of Chicago, Sector 13), Advanced Photon Source (APS), Argonne National Laboratory. GeoSoilEnviroCARS is supported by the National Science Foundation-Earth Sciences (EAR-1634415) and Department of Energy-GeoSciences (DE-FG02-94ER14466). This research used resources of the Advanced Photon Source, a U.S. Department of Energy (DOE) Office of Science User Facility operated for the DOE Office of Science by Argonne National Laboratory under Contract No. DE-AC02-06CH11357. We acknowledge support by the German Research Foundation and the Open Access Publication Funds of the Göttingen University.
The authors declare that the research was conducted in the absence of any commercial or financial relationships that could be construed as a potential conflict of interest.
The authors would like to thank the Center for Advanced Microscopy at Michigan State University and specifically, Amy Albin and Abigail Vanderberg, for their help with the Os staining and the two reviewers for their comments which improved this manuscript.
The Supplementary Material for this article can be found online at: https://www.frontiersin.org/articles/10.3389/fenvs.2018.00028/full#supplementary-material
Ananyeva, K., Wang, W., Smucker, A. J. M., Rivers, M. L., and Kravchenko, A. N. (2013). Can intra-aggregate pore structures affect the aggregate's effectiveness in protecting carbon? Soil Biol. Biochem. 57, 868–875. doi: 10.1016/j.soilbio.2012.10.019
Aravena, J. E., Berli, M., Ruiz, S., Suárez, F., Ghezzehei, T. A., and Tyler, S. W. (2014). Quantifying coupled deformation and water flow in the rhizosphere using X-ray microtomography and numerical simulations. Plant Soil. 376, 95–110. doi: 10.1007/s11104-013-1946-z
Bailey, V. L., Smith, A. P., Tfaily, M., Fansler, S. J., and Bond-Lamberty, B. (2017). Differences in soluble organic carbon chemistry in pore waters sampled from different pore size domains. Soil Biol. Biochem. 107, 133–143. doi: 10.1016/j.soilbio.2016.11.025
Bengough, A. G., McKenzie, B. M., Hallett, P. D., and Valentine, T. A. (2011). Root elongation, water stress, and mechanical impedance: a review of limiting stresses and beneficial root tip traits. J. Exp. Bot. 62, 59–68. doi: 10.1093/jxb/erq350
Chun, H. C., Giménez, D., and Yoon, S. W. (2008). Morphology, lacunarity and entropy of intra-aggregate pores: aggregate size and soil management effects. Geoderma 146, 83–93. doi: 10.1016/j.geoderma.2008.05.018
Czarnes, S., Hallett, P. D., Bengough, A. G., and Young, I. M. (2000). Root- and microbial-derived mucilages affect soil structure and water transport. Eur. J. Soil Sci. 51, 435–443. doi: 10.1046/j.1365-2389.2000.00327.x
De Gryze, S., Jassogne, L., Six, J., Bossuyt, H., Wevers, M., and Merckx, R. (2006). Pore structure changes during decomposition of fresh residue: x-ray tomography analyses. Geoderma 134, 82–96. doi: 10.1016/j.geoderma.2005.09.002
Denef, K., Six, J., Bossuyt, H., Frey, S. D., Elliot, T. E., Merckx, R., et al. (2001). Influence of dry-wet cycles on the interrelationship between aggregate, particulate organic matter, and microbial community dynamics. Soil Biol. Biochem. 33, 1599–1611. doi: 10.1016/S0038-0717(01)00076-1
Dungait, J. A. J., Hopkins, D. W., Gregory, A. S., and Whitmore, A. P. (2012). Soil organic matter turnover is governed by accessibility not recalcitrance. Global Change Biol. 18, 1781–1796. doi: 10.1111/j.1365-2486.2012.02665.x
Ekschmitt, K., Kandeler, E., Poll, C., Brune, A., Buscot, F., Friedrich, M., et al. (2008). Soil-carbon preservation through habitat constraints and biological limitations on decomposer activity. J. Plant Nutr. Soil Sci. 171, 27–35. doi: 10.1002/jpln.200700051
Ekschmitt, K., Liu, M., Vetter, S., Fox, O., and Wolters, V. (2005). Strategies used by soil biota to overcome soil organic matter stability–why is dead organic matter left over in soil? Geoderma 128, 167–176. doi: 10.1016/j.geoderma.2004.12.024
Falconer, R. E., Battaia, G., Schmidt, S., Baveye, P., Chenu, C., and Otten, W. (2015). Microscale heterogeneity explains experimental variability and non-linearity in soil organic matter mineralization. PloS ONE 10:e0123774. doi: 10.1371/journal.pone.0123774
Feeney, D. S., Crawford, J. W., Daniell, T., Hallett, P. D., Nunan, N., Ritz, K., et al. (2006). Three-dimensional microorganization of the soil-root-microbe system. Microb. Ecol. 52, 151–158. doi: 10.1007/s00248-006-9062-8
Gaillard, V., Chenu, C., and Recous, S. (2003). Carbon mineralization in soil adjacent to plant residues of contrasting biochemical quality. Soil Biol. Biochem. 35, 93–99. doi: 10.1016/S0038-0717(02)00241-9
Gaillard, V., Chenu, C., Recous, S., and Richard, G. (1999). Carbon, nitrogen and microbial gradients induced by plant residues decomposing in soil. Eur. J. Soil Sci. 50, 567–578. doi: 10.1046/j.1365-2389.1999.00266.x
Garrett, R. G. (2009). Relative spatial soil geochemical variability along two transects across the United States and Canada. Appl. Geochem. 24, 1405–1415. doi: 10.1016/j.apgeochem.2009.04.011
Gibson, J. R., Lin, H., and Bruns, M. A. (2006). A comparison of fractal analytical methods on 2- and 3-dimensional computed tomographic scans of soil aggregates. Geoderma 134, 335–348. doi: 10.1016/j.geoderma.2006.03.052
Gray, J., and Lissmann, H. W. (1938). An apparatus for measuring the propulsive forces of the locomotory muscles of the earthworm and other animals. J. Exp. Biol. 15, 518–521.
Greacen, E. L., and Oh, J. S. (1972). Physics of root growth. Nat. New Biol. 235, 24–25. doi: 10.1038/newbio235024a0
Greacen, E. L., and Sands, R. (1980). Compaction of forest soils. A review. Aust. J. Soil. Res. 18, 163–189. doi: 10.1071/SR9800163
Helliwell, J. R., Sturrock, C. J., Mairhofer, S., Craigon, J., Ashton, R. W., Miller, A. J., et al. (2017). The emergent rhizosphere: imaging the development of the porous architecture at the root-soil interface. Sci. Rep. 7:14875. doi: 10.1038/s41598-017-14904-w
Keiluweit, M., Nico, P. S., Kleber, M., and Fendorf, S. (2016). Are oxygen limitations under recognized regulators of organic carbon turnover in upland soils? Biogeochemistry 127, 157–171. doi: 10.1007/s10533-015-0180-6
Keiluweit, M., Wanzek, T., Kleber, M., Nico, P., and Fendorf, S. (2017). Anaerobic microsites have an unaccounted role in soil carbon stabilization. Nat. Commun. 8:1771. doi: 10.1038/s41467-017-01406-6
Ketcham, R. A. (2005). Three-dimensional grain fabric measurements using high-resolution X-ray computed tomography. J. Struc. Geol. 27, 1217–1228. doi: 10.1016/j.jsg.2005.02.006
Kiem, R., and Kögel-Knabner, I. (2002). Refractory organic carbon in particle-size fractions of arable soils II: organic carbon in relation to mineral surface area and iron oxides in fractions <6 μm. Org. Geochem. 33, 1699–1713. doi: 10.1016/S0146-6380(02)00112-2
Kravchenko, A. N., and Guber, A. K. (2017). Soil pores and their contributions to soil carbon processes. Geoderma 287, 31–39. doi: 10.1016/j.geoderma.2016.06.027
Kravchenko, A. N., Negassa, W., Guber, A. K., and Schmidt, S. (2014a). New approach to measure soil particulate organic matter in intact samples using X-ray computed microtomography. Soil Sci. Soc. Am. J. 78, 1177–1185. doi: 10.2136/sssaj2014.01.0039
Kravchenko, A. N., Negassa, W. C., Guber, A. K., Hildebrandt, B., Marsh, T. L., and Rivers, M. L. (2014b). Intra-aggregate pore structure influences phylogenetic composition of bacterial community in macroaggregates. Soil Sci. Soc. Am. J. 78, 1924–1939. doi: 10.2136/sssaj2014.07.0308
Kravchenko, A. N., Negassa, W. C., Guber, A. K., and Rivers, M. L. (2015). Protection of soil carbon within macro-aggregates depends on intra-aggregate pore characteristics. Sci. Rep. 5:16261. doi: 10.1038/srep16261
Kravchenko, A. N., Wang, W., Smucker, A. J. M., and Rivers, M. L. (2011). Long-term differences in tillage and land use affect intra-aggregate pore heterogeneity. Soil Sci. Soc. Am. J. 75, 1658–1666. doi: 10.2136/sssaj2011.0096
Kuzyakov, Y., and Blagodatskaya, E. (2015). Microbial hotspots and hot moments in soil: concept & review. Soil Biol. Biochem. 83, 184–199. doi: 10.1016/j.soilbio.2015.01.025
Mooney, S. J., Pridmore, T. P., Heliwell, J., and Bennett, M. J. (2012). Developing X-ray computed tomography to non-invasively image 3-D root systems architecture in soil. Plant Soil 352, 1–22. doi: 10.1007/s11104-011-1039-9
Mueller, C. W., Kölbl, A., Hoeschen, C., Hillion, F., Heister, K., Herrmann, A. M., et al. (2012). Submicron scale imaging of soil organic matter dynamics using NanoSIMS–from single particles to intact aggregates. Org. Geochem. 42, 1476–1488. doi: 10.1016/j.orggeochem.2011.06.003
Negassa, W. C., Guber, A. K., Kravchenko, A. N., Marsh, T. L., Hildebrandt, B., and Rivers, M. L. (2015). Properties of soil pore space regulate pathways of plant residue decomposition and community structure of associated bacteria. PLoS ONE 10:e0123999 doi: 10.1371/journal.pone.0123999
Nunan, N., Ritz, K., Rivers, M., Feeney, D. S., and Young, I. M. (2006). Investigating microbial micro-habitat structure using X-ray computed tomography. Geoderma 133, 398–407. doi: 10.1016/j.geoderma.2005.08.004
Oades, J. M. (1984). Soil organic matter and structural stability: mechanisms and implications for management. Plant Soil 76, 319–337. doi: 10.1007/BF02205590
Oh, W., and Lindquist, W. B. (1999). Image thresholding by indicator kriging. IEEE Trans. Pattern Anal. Mach. Intell. 21, 590–602. doi: 10.1109/34.777370
Papadopoulos, A., Bird, N. R. A., Whitmore, A. P., and Mooney, S. J. (2009). Investigating the effects of organic and conventional management on soil aggregate stability using X-ray computed tomography. Eur. J. Soil Sci. 60, 360–368. doi: 10.1111/j.1365-2389.2009.01126.x
Paul, E. A., Harris, D., Collins, H. P., Schulthess, U., and Robertson, G. P. (1999). Evolution of CO2 and soil carbon dynamics in biologically managed, row-crop agroecosystems. Appl. Soil Ecol. 11, 53–65. doi: 10.1016/S0929-1393(98)00130-9
Paul, E. A., Kravchenko, A., Grandy, S., and Morris, S. (2015). “Soil organic matter dynamics: controls and management for sustainable ecosystem functioning,” in The Ecology of Agricultural Landscapes: Long-Term research on the Path to Sustainability, eds S. K. Hamilton, J. E. Doll, and G. P. Robertson (New York, NY: Oxford University Press), 104–134.
Pebesma, E. J. (2004). Multivariable geostatistics in S: the gstat package. Comput. Geosci. 30, 683–691. doi: 10.1016/j.cageo.2004.03.012
Peng, X., Horn, R., and Smucker, A. (2007). Pore shrinkage dependency of inorganic and organic soils on wetting and drying cycles. Soil Sci. Soc. Am. J. 71, 1095–1104. doi: 10.2136/sssaj2006.0156
Peth, S. (2010). “Applications of microtomography in soils and sediments,” in Developments in Soil Science, Vol. 34, eds B. Singh and M. Gräfe, (The Netherlands: Elsevier B. V), 73–101.
Peth, S., Chenu, C., Leblond, N., Mordhorst, A., Garnier, P., Nunan, N., et al. (2014). Localization of soil organic matter in soil aggregates using synchrotron-base X-ray microtomography. Soil Biol. Biochem. 78, 189–194. doi: 10.1016/j.soilbio.2014.07.024
Peth, S., Horn, R., Beckmann, F., Donath, T., Fischer, J., and Smucker, A. J. M. (2008). Three-dimensional quantification of intra-aggregate pore-space features using synchrotron-radiation-based microtomography. Soil Sci. Am. J. 72, 897–907. doi: 10.2136/sssaj2007.0130
Rawlins, B. G., Wragg, J., Reinhard, C., Atwood, R. C., Houston, A., Lark, R. M., et al. (2016). Three-dimensional soil organic matter distribution, accessibility and microbial respiration in macroaggregates using osmium staining and synchrotron X-ray computed tomography. Soil 2, 659–671. doi: 10.5194/soil-2-659-2016
Ruiz, S., Schymanski, S. J., and Or, D. (2017). Mechanics and energetics of soil penetration by earthworms and plant roots: higher rates cost more. Vadose Zone J. 16:8. doi: 10.2136/vzj2017.01.0021
Senthilkumar, S., Basso, B., Kravchenko, A. N., and Robertson, G. P. (2009). Contemporary evidence of soil carbon loss in the U.S. corn belt. Soil Sci. Soc. Am. J. 73, 2078–2086. doi: 10.2136/sssaj2009.0044
Six, J., Conant, R. T., Paul, E. A., and Paustian, K. (2002). Stabilization mechanisms of soil organic matter: implications for C-saturation of soils. Plant Soil 241, 155–176. doi: 10.1023/A:1016125726789
Six, J., Elliott, E. T., and Paustian, K. (2000). Soil macroaggregate turnover and microaggregate formation: a mechanism for C sequestration under no-tillage agriculture. Soil Biol. Biochem. 32, 2099–2103. doi: 10.1016/S0038-0717(00)00179-6
Smucker, A. J. M., Park, E.-J., Dorner, J., and Horn, R. (2007). Soil micropore development and contributions to soluble carbon transport within macroaggregates. Vadose Zone J. 6, 282–290. doi: 10.2136/vzj2007.0031
Sørensen, L. H. (1974). Rate of decomposition of organic matter in soil as influenced by repeated air drying-rewetting and repeated additions of organic material. Soil Biol. Biochem. 6, 287–292. doi: 10.1016/0038-0717(74)90032-7
Syswerda, S. P., Corbin, A. T., Mokma, D. L., Kravchenko, A. N., and Robertson, G. P. (2011). Agricultural management and soil carbon storage in surface vs. deep layers. Soil Sci. Soc. Am. J. 75, 92–101. doi: 10.2136/sssaj2009.0414
Toosi, E. R., Kravchenko, A. N., Mao, J., Quigley, M. Y., and Rivers, M. L. (2017). Effects of management and pore characteristics on organic matter composition of macroaggregates: evidence from characterization of organic matter and imaging. Eur. J. Soil Sci. 68, 200–211. doi: 10.1111/ejss.12411
Wang, W., Kravchenko, A. N., Johnson, T., Srinivasan, S., Ananyeva, K. A., Smucker, A. J. M., et al. (2013). Intra-aggregate pore structures and Escherichia coli distribution by water flow within and movement out of soil macroaggregates. Vadose Zone J. 12:4. doi: 10.2136/vzj2013.01.0012
Wang, W., Kravchenko, A. N., Smucker, A. J. M., Liang, W., and Rivers, M. L. (2012). Intra-aggregate pore characteristics: x-ray computed microtomography analysis. Soil Sci. Soc. Am. J. 76, 1159–1171. doi: 10.2136/sssaj2011.0281
Wang, W., Kravchenko, A. N., Smucker, A. J. M., and Rivers, M. L. (2011). Comparison of image segmentation methods in simulated 2D and 3D microtomographic images of soil aggregates. Geoderma 162, 231–241. doi: 10.1016/j.geoderma.2011.01.006
Keywords: microtomography, soil organic matter, geostatistics, spatial variability, particulate organic matter
Citation: Quigley MY, Rivers ML and Kravchenko AN (2018) Patterns and Sources of Spatial Heterogeneity in Soil Matrix From Contrasting Long Term Management Practices. Front. Environ. Sci. 6:28. doi: 10.3389/fenvs.2018.00028
Received: 01 February 2018; Accepted: 30 April 2018;
Published: 29 May 2018.
Edited by:
Denis Angers, Agriculture and Agri-Food Canada (AAFC), CanadaReviewed by:
Patricia Garnier, Institut National de la Recherche Agronomique (INRA), FranceCopyright © 2018 Quigley, Rivers and Kravchenko. This is an open-access article distributed under the terms of the Creative Commons Attribution License (CC BY). The use, distribution or reproduction in other forums is permitted, provided the original author(s) and the copyright owner are credited and that the original publication in this journal is cited, in accordance with accepted academic practice. No use, distribution or reproduction is permitted which does not comply with these terms.
*Correspondence: Michelle Y. Quigley, bXlxdWlnbGV5QGdtYWlsLmNvbQ==
Disclaimer: All claims expressed in this article are solely those of the authors and do not necessarily represent those of their affiliated organizations, or those of the publisher, the editors and the reviewers. Any product that may be evaluated in this article or claim that may be made by its manufacturer is not guaranteed or endorsed by the publisher.
Research integrity at Frontiers
Learn more about the work of our research integrity team to safeguard the quality of each article we publish.