- 1UNESCO-IHE, Delft, Netherlands
- 2Department of Water Technology and Environmental Engineering, Institute of Chemical Technology, Prague, Czech Republic
- 3Laboratory of Biophysics and Wageningen NMR Centre, Department of Agrotechnology and Food Sciences, Wageningen University, Wageningen, Netherlands
Description of processes such as bioaccumulation, bioavailability and biosorption of heavy metals in biofilm matrixes requires the quantification of their transport. This study shows 3D MRI measurements of the penetration of free (Fe2+, Co2+ and Gd3+) and complexed ([FeEDTA]2− and [GdDTPA]2−) metal ions in a single methanogenic granule. Interactions (sorption or precipitation) between free metals and the biofilm matrix result in extreme shortening of the spin-spin relaxation time (T2) and a decrease of the amplitude (A0) of the MRI signal, which hampers the quantification of the metal concentration inside the granular sludge matrix. MRI images clearly showed the presence of distinct regions (dead or living biomass, cracks, and precipitates) in the granular matrix, which influenced the metal transport. For the free metal ions, a reactive barrier was formed that moved through the granule, especially in the case of Gd3+. Chelated metals penetrated faster and without reaction front. Diffusion of [GdDTPA]2− could be quantified, revealing the course of its transport and the uneven (0.2–0.4 mmol·L−1) distribution of the final [GdDTPA]2− concentration within the granular biofilm matrix at equilibrium.
Introduction
Methanogenic granules are spherical biofilms, developed spontaneously without support material in bioreactors for anaerobic wastewater treatment, such us the Upflow Anaerobic Sludge Blanket (UASB) reactor (Hulshoff Pol et al., 2004). The interactions between methanogenic granules and heavy metals have been studied mainly in relation to limitation of the microbial activity by scarcity of essential metals (Fermoso et al., 2008) or as a method for metal removal from wastewaters (Steed et al., 2000; De Lima et al., 2001). Less is known about the speciation, spatial distribution and transport of metals within a biofilm, which is nevertheless essential for any research on metal-biofilm interactions (Van Hullebusch et al., 2003; Zandvoort et al., 2006).
Knowledge of metal transport in biofilms is mainly based on mathematical models. The data for validation of these models have been obtained from indirect measurements conducted in the bulk liquid (Beyenal and Lewandowski, 2004). Thus, an experimental tool for direct measurement of metal transport is required to confirm the validity of these models. Magnetic resonance imaging (MRI) is a non-destructive method that can be applied under in situ conditions to study metal transport in artificial biomatrixes (Nestle, 2002), in phototrophic biofilms (Phoenix and Holmes, 2008) and in methanogenic granules (Bartacek et al., 2009). In addition, MRI can be used to reveal the inner structure of the biofilm and to describe the transport properties (diffusivity) of the water contained in a biofilm matrix (Van As and Van Dusschoten, 1997; Lens and Hemminga, 1998; Van As and Lens, 2001).
Transport of various metals and their various chemical species has been measured using MRI in many different porous media such us sandy aquifers (Nestle et al., 2003; Moradi et al., 2008) or various biomatrixes (Donahue et al., 1994; Nestle and Kimmich, 1996; Bartacek et al., 2009). In a previous paper (Bartacek et al., 2009), we described the methodology for MRI measurements in single anaerobic granules using a mixture of Fe2+ and [FeEDTA]2−. Using this MRI methodology, the present study describes transport of various metals, i.e., cobalt, iron and gadolinium, in liganded or non-liganded form in methanogenic granules. Methanogenic granules of the same origin as those used in this study were previously shown to be trace metal deficient and rather homogeneous as for their microbial composition (Fermoso et al., 2008). The aim of the MRI experiments was to describe the influence of chemical speciation on the transport of trace metals and their interaction with the granular matrix during transport. These observations were correlated with the inner structure of the granules as well.
Materials and Methods
Source of Biomass
Mesophilic methanogenic granular sludge was obtained from a full-scale UASB reactor treating alcohol distillery wastewater at Nedalco (Bergen op Zoom, The Netherlands).
Experimental Set-Up and MRI
Single granules were fixed in a glass tube, through which demineralized or tap water was circulated to establish stabile conditions. At the start of each experiment, a certain concentration of the investigated metal compound (5 mM CoCl2, 1 mM FeCl2, 2 mM [FeEDTA]2−, 0.01 mM GdCl3, or 0.5 mM [GdDTPA]2−) was introduced in the water circuit. The metal concentrations used were chosen based on the relaxivity of each metal. Subsequently, the increase of the metal concentration inside the granule was measured using the 3D Turbo Spin Echo (TSE) imaging method developed previously by Mohoric et al. (2004) with a spatial resolution of 109 × 109 × 218 μm3 and a temporal resolution of 11 min as presented in Bartacek et al. (2009). The 3D TSE signal was spin-lattice relaxation time (T1) weighted applying a repetition time (TR) of 200 ms and an echo time (TE) of 4.53 μs (Bartacek et al., 2009).
The experiments consisted of a series (several tens to several hundreds) of TSE measurements. 3D T2 and amplitude (A0) maps of a single granule were acquired prior and upon termination of each experiment (TE 1 ms, 16,384 echoes, spatial resolution identical to the TSE measurement). The iron solution was always injected after taking several TSE images of the granule in demineralized water to document the situation at time zero. A series of 3D TSE measurements (30–400) was performed, always followed by a final 3D T2 map measurement. 3D T1 maps were acquired only occasionally due to their long acquisition time requirement (~ 160 min). The methodology, including calculation of the metal concentration inside the methanogenic biofilm matrix, was described previously by Bartacek et al. (2009).
MRI Imager
All MRI measurements were done at 30 (± 2)°C on a 0.7 T (30.7 MHz for protons) imager consisting of a Bruker Avance console (Bruker BioSpin, Karlsruhe, Germany), a Bruker electromagnet stabilized by an external 19F lock unit, a custom build solenoid RF-probe and an actively shielded gradient system with planar geometry (Gmax 1 T/m; Resonance Instruments Ltd, Witney, UK). The RF-probe had an inner diameter of 5 mm and was inductively coupled to avoid continuous retuning and matching of the RF-probe due to the change in loading by the iron, cobalt or gadolinium solution.
Scanning Electron Microscopy
For scanning electron microscopy (SEM), samples were fixed for 1 h in aqueous glutaraldehyde solution (2.5%), rinsed with water, and subjected to a series of ethanol washes (10, 30, 50, 70, 90, 100%; 20 min per step) before critical-point drying with carbon dioxide (CPD 020, Balzers, Liechtenstein). Samples were then fit on a brass sample holder with carbon adhesive tabs (Electron Microscopy Sciences, Hatfi eld, PA) and coated with carbon. An additional 5 nm platinum coating was applied by magnetron sputtering. Specimens were analyzed with a field emission scanning electron microscope (JEOL 6300 F, Tokyo, Japan) at room temperature at a working distance between 8 and 15 mm. All images were recorded digitally (Orion 6, E.L.I. sprl., Belgium) at a scan rate of 100 s (full frame) and at a size of 2528 × 2030.
Results
Inner Structure of Methanogenic Granules
The distribution of the amplitude (A0) values (measure of the water density) over the methanogenic granule was homogeneous. The granules contained regions with lower A0 (up to 30% of the average value) that always coincided with low T1 values (lower than 0.3 s). These regions are further referred to as Type I regions in this paper. While the T1 of the methanogenic granules typically ranged from 0.2 to 1.0 s, areas that had a T1 comparable with free water (~1.2 s) were rarely detected. These areas, possibly cracks, are further referred as Type II regions in this paper.
The granules under investigation often had a distinct core surrounded by an outer layer, both composed of biomass. The core usually had slightly higher T1 and T2 values. Both Type I and Type II regions were located only inside the core or were associated with the core of the granules (Figure 1). Type I and Type II regions were not present in the outer layer of the granules investigated. Besides the distinct layers, also cracks and voids were occasionally observed (Figure 2D). These were always localized in the core of the granules in accordance with the occurrence of Type II regions (Figure 1).
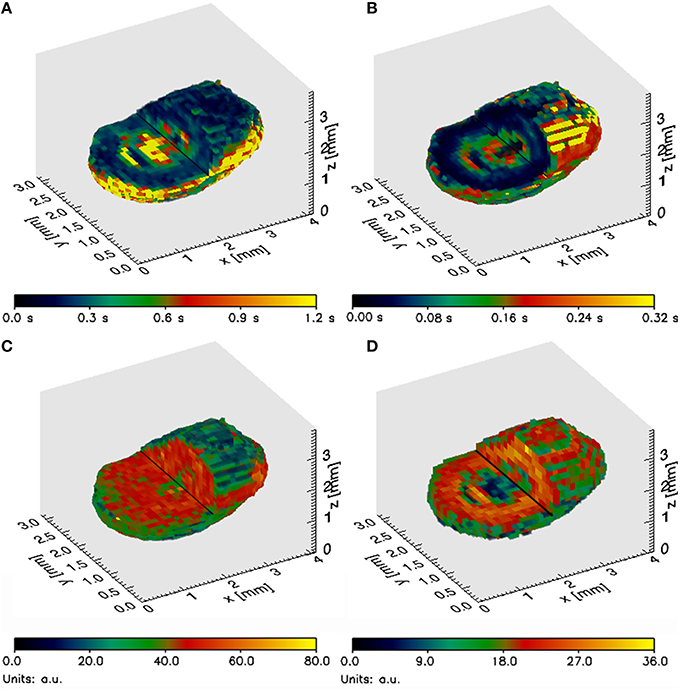
Figure 1. Partial cross section of a typical methanogenic granule under investigation representing (A) 3D T1 map, (B) 3D T2 map, (C) 3D A0 map and (D) 3D S map.
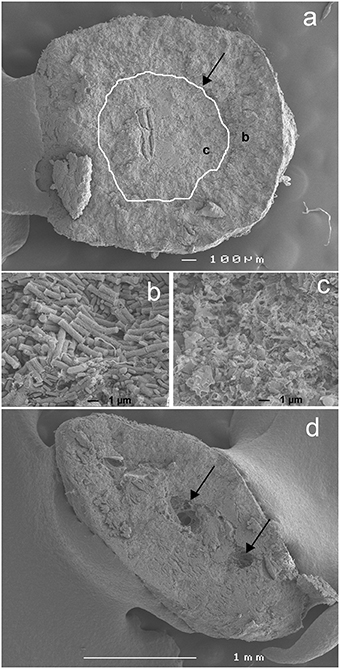
Figure 2. Scanning Electron Microscopy (SEM) pictures of a typical methanogenic granule investigated. (A) A cross section of a single granule with the border between the core and the outer layer highlighted (white curve and black arrow) and the position of the detailed pictures [letters (B) and (C)] indicated, (B) detail of the microbial population in the outer layer and (C) in the core and (D) a cross section of another granule (embedded in glue during SEM acquisition) with occurrence of cracks indicated by the black arrows.
The core and the outer layer could also be distinguished and visualized using SEM (Figure 2). Although the border between the core and the outer layer was not very apparent on the picture of the whole granule (Figure 2A), the detailed picture of the biomass matrix inside the outer layer (Figure 2B) and the core (Figure 2C) shows clear differences. The outer layer consisted mainly of apparently intact rod-shaped cells with a limited occurrence of damaged cells (Figure 2B). In contrast, the core contained mostly damaged (open) cells mainly of the same morphology as the cells found in the outer layer (Figure 2C). The change in occurrence of the damaged cells was quite abrupt (localized by the white curve in Figure 2A).
Transport of Gadolinium
GdCl3
A reactive barrier moving from the edge of the granule toward the core was clearly observed when the granule was exposed to 0.1 mmol·L−1 GdCl3 (Figure 3A). Massive precipitation occurred causing a major decrease of A0 and T2, hampering calculations of the gadolinium concentration. Thus, the calculated concentration values illustrated in Figure 3A are somewhat biased, the rate of the reaction barrier movement can nevertheless be reliably observed.
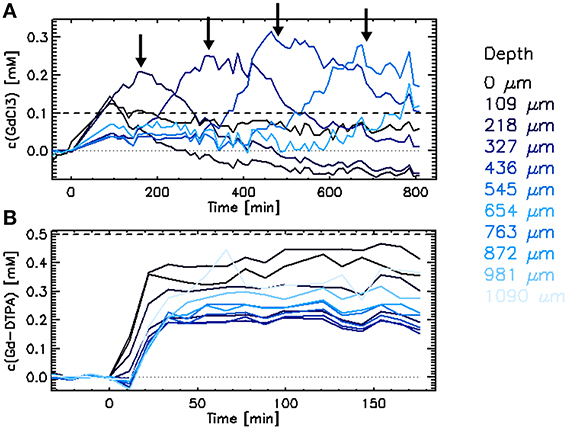
Figure 3. Increase of Gd concentration in a single methanogenic granule upon exposure to (A) 0.1 mmol·L−1 GdCl3 or (B) 0.5 mmol·L−1 [GdDTPA]2− solution. The arrows indicate the approximate time when the reactive barrier reached single layers.
[GdDTPA]2−
The increase of the gadolinium concentration upon exposure to the 0.5 mmol·L−1 [GdDTPA]2− solution was much faster than with GdCl3 (Figure 3). The process was as fast as the diffusion of free iron and cobalt (Figures 5C,D) and slightly faster than diffusion of the Fe2+/[FeEDTA]2− mixture as reported by Bartacek et al. (2009). The final gadolinium concentration inside the granule ranged from 0.05 to 0.50 mmol·L−1 (Figure 3B). When averaged over the layers of uniform depth, the concentration range was 0.15–0.45 mmol·L−1, with the highest values in the edge (0–218 μm) and in the center (872–1090 μm). The decrease of both T1 and T2 values (Figures 4A,B) corresponded to this [GdDTPA]2− concentration increase (Figure 4C) and no A0 decrease was observed (data not shown).
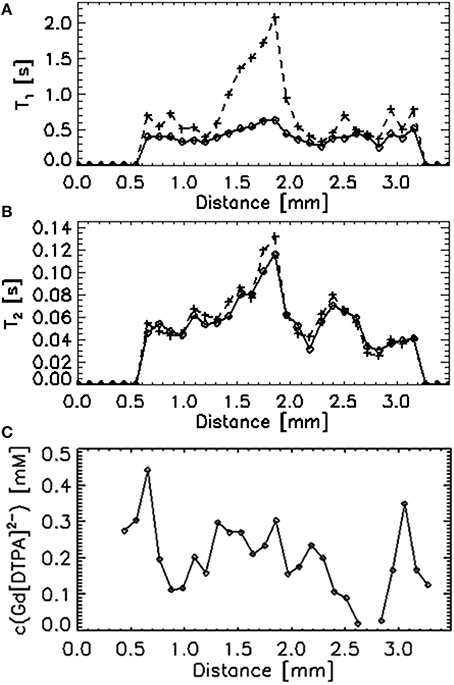
Figure 4. A single T1 (A), T2 (B), and final concentration (C) profile through a single granule comparing the initial values (+) with the values after exposure to a 0.5 mmol·L−1 [GdDTPA]2− solution (♢).
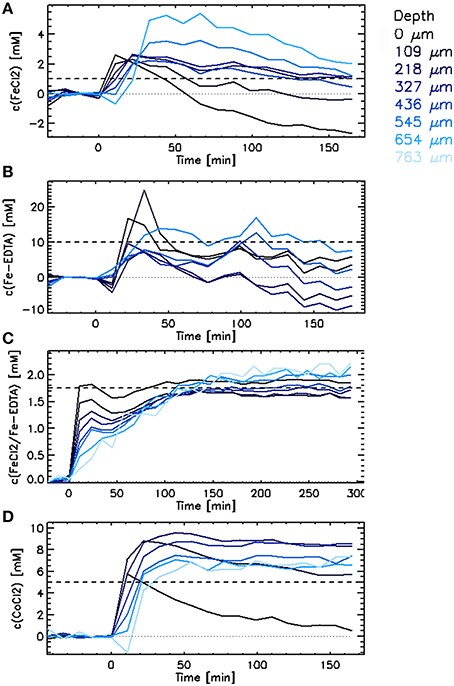
Figure 5. Penetration of iron as (A) FeCl2, (B) [FeEDTA]2−, and (C) FeCl2/[FeEDTA]2− (0.25:1), and (D) cobalt as CoCl2 into single methanogenic granules. Each curve depicts average values for a certain depth in the granule ranging from 0 μm (edge) to 763 μm (core). The dashed lines show the concentration of the given metal introduced into the liquid media at time zero.
Transport of Iron
FeCl2
Upon the injection of FeCl2 (1 mM), the observed concentration of iron increased in the outer layers within 11 min (Figure 5A). The increase of the iron concentration was slightly (11–22 min) delayed in the inner layers. The fast increase was followed by a slower decrease of the calculated iron concentration, associated with the increase of the T1 and T2 values of the granular matrix. It can be assumed that the increase of the relaxation times was caused by changes in the biofilm matrix, e.g., dissolution of EPS, as a drop following the raise of the iron concentration inside the granule is unlikely to occur. No A0 decrease was observed in these granules. Thus, there is no indication of iron precipitation inside the granule.
[FeEDTA]2−
The development of the calculated iron concentration after the [FeEDTA]2− injection was similar to that with a FeCl2 injection. The main difference was that the increase in iron concentration started simultaneously in all layers of the granule (Figure 5B). Again, the final T1 and T2 values of the granular matrix were higher than those measured at the beginning of the experiment (data not shown).
Transport of Cobalt
CoCl2
The increase of the cobalt concentration inside the granules exposed to 5 mM CoCl2 solution was as fast as the increase of the free iron concentration inside the granules when exposed to FeCl2 (Figure 5). Similarly to the FeCl2 case, the maximum cobalt concentration was reached in all layers of the granules within 50 min upon the CoCl2 injection. The delay in the increase of the cobalt concentration in the center of the granules indicates that a reactive barrier played a role in slowing the cobalt transport toward the center of the granule (Figure 5D).
The cobalt concentration inside the granule increased evenly in all directions (Figure 6A). The concentration values averaged over layers of specific depths (Figure 6B) and agreed well with the picture obtained by calculations per voxel (Figure 6A).
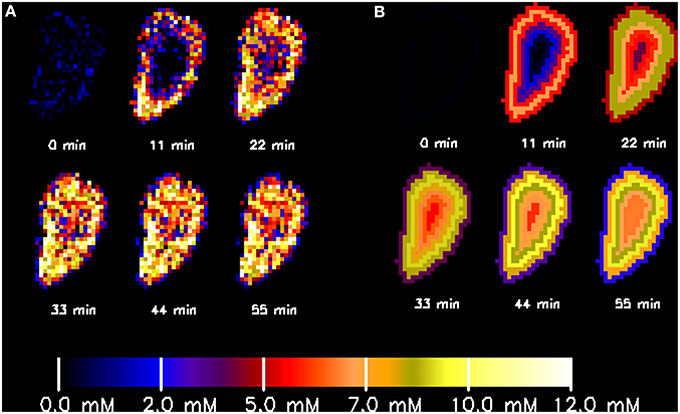
Figure 6. Spatially resolved increase of cobalt concentration inside a single methanogenic granule upon injection of a 5 mmol·L−1 CoCl2 solution at time zero as obtained by calculation at each single voxel (A) or averaged over layers of specific depths inside the granule (B).
In general, the decrease in T1 was equal or slightly larger than the values expected for 5 mmol·L−1 cobalt based on the calibration of the cobalt relaxivity in free liquid (Figure 7A). The final cobalt concentrations calculated inside the granule ranged from 6 to 9 mmol·L−1 (Figure 5D). The T2 decrease expected based on the cobalt relaxivity calibration was minor (Figure 7B), not influencing the TSE signal. However, the actually measured T2 decrease was large (theoretically corresponded to a cobalt concentration of at least 50 mmol·L−1), causing a significant decrease of the TSE signal and thus biasing calculations of the real cobalt concentration (apparent decrease in cobalt concentration). This phenomenon was accompanied by a decrease of A0 (water density), especially in the outer layers of the granule. The decrease of A0 contributed considerably to the apparent drop of the calculated cobalt concentration, occurring in the 2 outer layers of the granule investigated (Figure 5D). The A0 values were measured only at the start and upon conclusion of the experiments (the measurement took almost 2 h); hence it is impossible to describe the actual A0 decrease in time. Knowing the A0 values in time would allow to correct the calculated concentration values. When the final concentration value is calculated using the final values of A0 and T2, the final cobalt concentrations in the outer layers are close to those calculated in the inner layers. For instance, the final cobalt concentration in the first outer layer is calculated to be 1.3 mmol·L−1 when neglecting the decrease of A0 and T2 in this layer. Taking the A0 and T2 decrease into account, the final concentration amounted to 5.2 mmol·L−1 in the same layer.
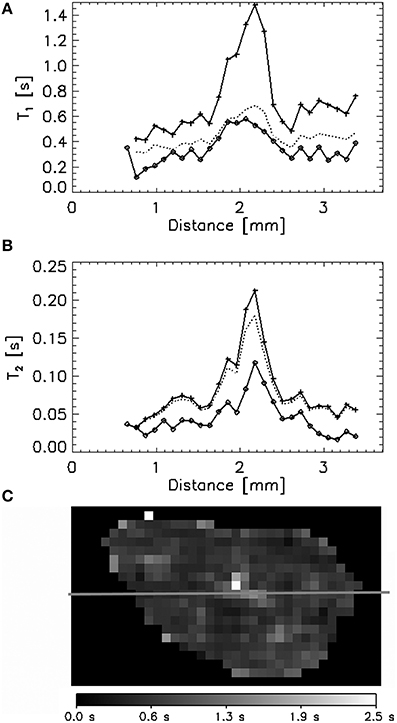
Figure 7. A single T1 (A) and T2 (B) profile through a single granule illustrated by the red line in a 2D T1 map (C) comparing the initial values (+), the values after exposure to 5 mmol·L−1 CoCl2 solution (♢) and the values calculated assuming that the T1 and T2 decrease was caused only by the presence of Co in the liquid phase.
The Type II region (T1 comparable to T1 of the free solution) was found in the center of several granules investigated (Figure 7). The T1 decrease in these regions agreed with the expected decrease after introduction of 5 mmol·L−1 cobalt, based on the relaxivity cobalt. An A0 decrease was not observed. In contrast, the T2 decrease in these regions was again larger than expected from calibration curves.
Discussion
Interaction of the Free Metal Ions with the Granular Biofilm Matrix
This study shows that MRI measurements can elucidate the mechanism and rate of free metal penetration in a granular matrix. As shown especially in the case of Gd3+, a reaction barrier is formed and its movement can be tracked (Figure 3). Although the presence of a reaction barrier in biofilms has been anticipated in the past (Beyenal and Lewandowski, 2004), the first direct in situ observation of the development of the reactive barrier in wastewater treatment biofilms was shown only recently (Bartacek et al., 2012).
This study also shows that metals used for tracing transport processes in biofilms are not inert and interact with the biofilm matrix. As shown by the experiments with Fe2+, Co2+, and Gd3+, free metal ions massively interact with the granular matrix (precipitation, sorption), causing extreme shortening of especially the T2 value and considerable decreases in the A0. Shortening of T2 and decreasing of A0 causes, respectively, T2 weighting of the TSE signal and a decrease of the TSE signal, which in turn causes an apparent decrease of the calculated metal concentration. As long as the relations between the metal precipitation and T1, T2 and A0 changes is not quantitatively described, the exact translation of the TSE signal to the metal concentration will remain impossible.
Interaction of the Complexed Metals with the Granular Biofilm Matrix
[GdDTPA]2−, often used as contrast agent in medical MRI (Li et al., 2007), is also an ideal example of a contrast agent for MRI studies of metal transport in a biofilm matrix (Ramanan et al., 2010). This complex did not decrease the A0 and the T2 decrease approximately corresponded to the values expected based on the [GdDTPA]2− relaxivity measured in free solution (Figure 4). The latter indicates that due to its high stability, [GdDTPA]2− does not disintegrate the granular matrix as shown for [FeEDTA]2− (Bartacek et al., 2009). However, the fact that the final concentration of gadolinium inside the granule was lower than the concentration introduced into the liquid surrounding the granule indicates that some interaction between [GdDTPA]2− and the granular matrix takes place. Most probably, the low [GdDTPA]2− concentration was caused by the Donnan effect, i.e., the presence of negatively charged EPS molecules in the granular matrix repulses the negatively charged [GdDTPA]2− complex. The Donnan effect probably also plays a role in the case of [FeEDTA]2− (Bartacek et al., 2009), but it was masked by other processes (T2 increase in the biofilm matrix due to EDTA-biofilm interactions) in this study. The opposite outcome of the Donnan effect has been previously observed during supersaturation of alginated gels by free (positively charged) metal species (Kalis et al., 2009), but it is masked by metal precipitation in this study (experiments with GdCl3, FeCl2, and CoCl2). Indeed, the Donnan effect can play an important role in anaerobic granular sludge e.g., by decreasing toxicity of the negatively charged metal species such as [FeEDTA]2− on the one hand and increasing toxicity of the positively charged metal species such as Co2+ on the other hand. The lower toxicity of complexed cobalt or nickel species has been shown previously (Bartacek et al., 2008, 2010).
[FeEDTA]2− can increase the T1 of the granular matrix hampering calculation of the iron concentration in the biofilm matrix (Figure 5B). This phenomenon was solved previously by Bartacek et al. (2009) by adding excess free iron achieving reliable data for iron diffusion (Figure 5C).
Implications of Metal Transport Pattern for the Deficiency of Essential Metals in Granular Sludge
Although this work did not focus on the biological activity of methanogenic biomass, it can be suggested that limitation or toxicity by different metals will be strongly affected by the transport phenomena taking place inside the granules. As shown also by Bartacek et al. (2012), trace metals tend to accumulate inside the granules when dosed as free ions. Then, the positive effect of metals supplementation lasts longer. In contrast, when dosed with organic ligands such as EDTA, the supplementation of metals causes faster and more pronounced responses. This paper further clarifies the mechanisms how are metals transported and accumulated inside the granules.
This paper also shows that supplementation of metals attached to organic ligands may cause serious degradation of the granular matrix. The negative effect of repeated CoEDTA2− additions on the granular matrix was previously reported by Fermoso et al. (2008).
Structure of the Granular Matrix and its Influence on Metals Transport
A clearly distinguishable core was observed in most of the granules investigated, a phenomenon previously reported for other types of granular sludge (Lens et al., 1997). The core had usually a higher T1 and T2 (Figure 1) and the SEM observation revealed that this part of the granules was mostly composed of decaying biomass (Figure 2). As observed by Bartacek et al. (2009) and confirmed by the observation with [GdDTPA]2− in this study (Figure 4), the final concentration of metal complexes tend to reach the highest values in the core (except the outer layers in some cases). This can be caused by a lower amount of negatively charged EPS inside the granular core, which is mostly composed of dead biomass (Figure 2). As discussed above, the presence of EPS can cause resistance against the increase of the metal concentration.
Although microbial analysis of the granules under study was not done, it can be expected that the majority of the methanogenic microorganisms seen in Figure 2B are of the Methanosarcina genus as was shown in similar granules previously (Fermoso et al., 2008). Also the morphology of the cells observed in Figure 2B supports this suggestion.
Besides the distinction between the core and the outer layers of the granules, two distinct types of regions (Type I and Type II) were observed in all cases associated with the granular core. Type I regions had a lower A0, T1 and T2 values compared to the rest of the granule, indicating that the density and mobility of water were lower in these regions. Therefore, Type I regions may indicate the presence of precipitates inside the granular matrix (Nott et al., 2001).
Type II regions were characterized by A0 values as high as in the rest of the granules and T1 and T2 values similar to those measured in the liquid surrounding the granule. Considering that the granular matrix consists of approximately 95% water, the A0 measured inside the granules (except Type I regions) can indeed be expected to be close to the A0 values measured in the surrounding liquid. However, the T1 and T2 values are strongly shortened in most of the granular matrix by the presence of cell walls, EPS, precipitates, etc. (Lens et al., 1997; Gonzalez-Gil et al., 2001; Bartacek et al., 2009). Therefore, high T1 and T2 values may indicate the presence of cracks, such as those revealed by the SEM images (Figure 2D).
Conclusions
This study shows that the chemical speciation of a metal strongly influences the metal transport in methanogenic granules. It was shown that free metals form a reactive barrier while precipitating inside biofilm, which slows down the increase of concentration of the given metal in the center of the granule. Chelated metals penetrate the granular biofilm faster, but can be repulsed by the negatively charged organic compounds present in the biofilm matrix. This paper also shows that the metal compounds used for investigating transport properties in biofilm are not entirely inert. Thus, the interaction between the biofilm and the contrast agent may be of such a nature (e.g., precipitation of free metal ions) that might biases the quantification of metal concentrations inside the biofilm via the MRI protocol used in this study.
Author Contributions
JB conducted a substantial part of the experiments, did most of data analysis, and has written the vast majority of the text. JM conducted most of the experiments and the primary data analyses. FV supported the experiments by developing experimental procedures and data acquisition for MRI. He also supported data analysis and contributed to the manuscript writing. EG supported the experimental work by operating the MRI equipment and contributed to the text in the Methods section. HVA supervised the research and guaranteed the quality as the expert on MRI. PL supervised the research and guaranteed the quality as the expert on anaerobic digestion and granular biofilm.
Funding
This work was supported by the European Commission via the Research Infrastructure Wageningen NMR Centre (FP6-2004-026164 Research Infrastructure Transnational Access WNMRC), the Marie Curie Intra European Fellowship “Bioavailability of trace metals in anaerobic granular sludge reactors” (MEIF-CT-2007-041896), and the Marie Curie Reintegration Grant “Biofilms in Bioreactors for Advanced Nitrogen Removal from Wastewater” (ERG-2010-268417).
Conflict of Interest Statement
The authors declare that the research was conducted in the absence of any commercial or financial relationships that could be construed as a potential conflict of interest.
References
Bartacek, J., Fermoso, F. G., Baldó-Urrutia, A. M., Van Hullebusch, E. D., and Lens, P. N. L. (2008). Cobalt toxicity in anaerobic granular sludge: influence of chemical speciation. J. Ind. Microbiol. Biotechnol. 35, 1465–1474. doi: 10.1007/s10295-008-0448-0
Bartacek, J., Fermoso, F. G., Catena, A. B., and Lens, P. N. L. (2010). Effect of sorption kinetics on nickel toxicity in methanogenic granular sludge. J. Hazard. Mater. 180, 289–296. doi: 10.1016/j.jhazmat.2010.04.029
Bartacek, J., Fermoso, F. G., Vergeldt, F., Gerkema, E., Maca, J., Van As, H., et al. (2012). The impact of metal transport processes on bioavailability of free and complex metal ions in methanogenic granular sludge. Water Sci. Technol. 65, 1875–1881. doi: 10.2166/wst.2012.030
Bartacek, J., Vergeldt, F. J., Gerkema, E., Jenicek, P., Lens, P. N. L., and Van As, H. (2009). Magnetic resonance microscopy of iron transport in methanogenic granules. J. Magn. Reson. 200, 303–312. doi: 10.1016/j.jmr.2009.07.013
Beyenal, H., and Lewandowski, Z. (2004). Dynamics of lead immobilization in sulfate reducing biofilms. Water Res. 38, 2726–2736. doi: 10.1016/j.watres.2004.03.023
De Lima, A. C. F., Gonçalves, M. M. M., Granato, M., and Leite, S. G. F. (2001). Anaerobic sulphate-reducing microbial process using UASB reactor for heavy metals decontamination. Environ. Technol. 22, 261–270. doi: 10.1080/09593332208618286
Donahue, K. M., Burstein, D., Manning, W. J., and Gray, M. L. (1994). Studies of Gd-DTPA relaxivity and proton exchange rates in tissue. Magn. Reson. Med. 32, 66–76. doi: 10.1002/mrm.1910320110
Fermoso, F. G., Bartacek, J., Chung, L. C., and Lens, P. (2008). Supplementation of cobalt to UASB reactors by pulse dosing: CoCl2 versus CoEDTA2− pulses. Biochem. Eng. J. 42, 111–119. doi: 10.1016/j.bej.2008.06.005
Gonzalez-Gil, G., Lens, P. N. L., Van Aelst, A., Van As, H., Versprille, A. I., and Lettinga, G. (2001). Cluster structure of anaerobic aggregates of an expanded granular sludge bed reactor. Appl. Environ. Microbiol. 67, 3683–3692. doi: 10.1128/AEM.67.8.3683-3692.2001
Hulshoff Pol, L. W., De Castro Lopes, S. I., Lettinga, G., and Lens, P. N. L. (2004). Anaerobic sludge granulation. Water Res. 38, 1376–1389. doi: 10.1016/j.watres.2003.12.002
Kalis, E. J. J., Davis, T. A., Town, R. M., and Van Leeuwen, H. P. (2009). Impact of ionic strength on Cd(II) partitioning between alginate gel and aqueous media. Environ. Sci. Technol. 43, 1091–1096. doi: 10.1021/es802305n
Lens, P. N. L., and Hemminga, M. A. (1998). Nuclear magnetic resonance in environmental engineering: principles and applications. Biodegradation 9, 393–409. doi: 10.1023/A:1008316031421
Lens, P., Pol, L. H., Lettinga, G., and Van As, H. (1997). Use of 1H NMR study of water transport processes in sulfidogenic granular sludge. Water Sci. Technol. 36, 157–163. doi: 10.1016/S0273-1223(97)00519-2
Li, Z., Li, W., Li, X., Pei, F., Li, Y., and Lei, H. (2007). The gadolinium complexes with polyoxometalates as potential MRI contrast agents. Magn. Reson. Imaging 25, 412–417. doi: 10.1016/j.mri.2006.09.039
Mohoric, A., Vergeldt, F., Gerkema, E., De Jager, A., Van Duynhoven, J., Van Dalen, G., et al. (2004). Magnetic resonance imaging of single rice kernels during cooking. J. Magn. Reson. 171, 157–162. doi: 10.1016/j.jmr.2004.08.013
Moradi, A. B., Oswald, S. E., Massner, J. A., Pruessmann, K. P., Robinson, B. H., and Schulin, R. (2008). Magnetic resonance imaging methods to reveal the real-time distribution of nickel in porous media. Eur. J. Soil Sci. 59, 476–485. doi: 10.1111/j.1365-2389.2007.00999.x
Nestle, N. (2002). NMR studies on heavy metal immobilization in biosorbents and mineral matrices. Rev. Environ. Sci. Biotechnol. 1, 215–225. doi: 10.1023/A:1021255727484
Nestle, N., and Kimmich, R. (1996). NMR imaging of heavy metal absorption in alginate, immobilized cells, and kombu algal biosorbents. Biotechnol. Bioeng. 51, 538–543.
Nestle, N., Wunderlich, A., Niessner, R., and Baumann, T. (2003). Spatial and temporal observations of adsorption and remobilization of heavy metal ions in a sandy aquifer matrix using magnetic resonance imaging. Environ. Sci. Technol. 37, 3972–3977. doi: 10.1021/es026250s
Nott, K. P., Paterson-Beedle, M., Macaskie, L. E., and Hall, L. D. (2001). Visualisation of metal deposition in biofilm reactors by three-dimensional magnetic resonance imaging (MRI). Biotechnol. Lett. 23, 1749–1757. doi: 10.1023/A:1012492216390
Phoenix, V. R., and Holmes, W. M. (2008). Magnetic resonance imaging of structure, diffusivity, and copper immobilization in a phototrophic biofilm. Appl. Environ. Microbiol. 74, 4934–4943. doi: 10.1128/AEM.02783-07
Ramanan, B., Holmes, W. M., Sloan, W. T., and Phoenix, V. R. (2010). Application of paramagnetically tagged molecules for magnetic resonance imaging of biofilm mass transport processes. Appl. Environ. Microbiol. 76, 4027–4036. doi: 10.1128/AEM.03016-09
Steed, V. S., Suidan, M. T., Gupta, M., Miyahara, T., Acheson, C. M., and Sayles, G. D. (2000). Development of a sulfate-reducing biological process to remove heavy metals from acid mine drainage. Water Environ. Res. 72, 530–535. doi: 10.2175/106143000X138102
Van As, H., and Lens, P. (2001). Use of 1H NMR to study transport processes in porous biosystems. J. Ind. Microbiol. Biotechnol. 26, 43. doi: 10.1038/sj.jim.7000087
Van As, H., and Van Dusschoten, D. (1997). NMR methods for imaging of transport processes in micro-porous systems. Geoderma 80, 389–403. doi: 10.1016/S0016-7061(97)00062-1
Van Hullebusch, E. D., Zandvoort, M. H., and Lens, P. N. L. (2003). Metal immobilisation by biofilms: mechanisms and analytical tools. Rev. Environ. Sci. Biotechnol. 2, 9–33. doi: 10.1023/B:RESB.0000022995.48330.55
Keywords: methanogenic granular sludge, magnetic resonance microscopy, metal transport, metal diffusion, granular biofilm
Citation: Bartacek J, Vergeldt FJ, Maca J, Gerkema E, Van As H and Lens PNL (2016) Iron, Cobalt, and Gadolinium Transport in Methanogenic Granules Measured by 3D Magnetic Resonance Imaging. Front. Environ. Sci. 4:13. doi: 10.3389/fenvs.2016.00013
Received: 30 November 2015; Accepted: 22 February 2016;
Published: 16 March 2016.
Edited by:
Gavin Collins, National University of Ireland, Galway, IrelandReviewed by:
Kevin Thomas Finneran, Clemson University, USADonald Jay Ferguson, Miami University, USA
Copyright © 2016 Bartacek, Vergeldt, Maca, Gerkema, Van As and Lens. This is an open-access article distributed under the terms of the Creative Commons Attribution License (CC BY). The use, distribution or reproduction in other forums is permitted, provided the original author(s) or licensor are credited and that the original publication in this journal is cited, in accordance with accepted academic practice. No use, distribution or reproduction is permitted which does not comply with these terms.
*Correspondence: Jan Bartacek, amFuLmJhcnRhY2VrQHZzY2h0LmN6
 Jan Bartacek
 Frank J. Vergeldt3
 Henk Van As