 Nnamdi C. Osakwe
 Alison A. Motsinger-Reif
 David M. Reif
- 1Department of Biological Sciences, Bioinformatics Research Center, North Carolina State University, Raleigh, NC, United States
- 2Biostatistics and Computational Biology Branch, Division of Intramural Research, National Institute of Environmental Health Sciences, Durham, NC, United States
- 3Predictive Toxicology Branch, Division of Translational Toxicology, National Institute of Environmental Health Sciences, Durham, NC, United States
This manuscript critically examines the landscape of public-facing web-based environmental health (EH) and environmental justice (EJ) screening tools aimed at mitigating environmental health crises that are involved in a substantial percentage of deaths globally. These EJ/EH screening tools have proliferated with the growth of publicly available data sources and computational advances that have fueled novel analytics and have made strides toward democratizing access to EJ/EH information impacting communities. The interactive, highly visual analytics offered by some of these EJ/EH screening tools could help address the role of environmental injustice in exacerbating environmental health-related causes of mortality and enable affected communities to take a more active role in EJ/EH efforts. Environmental injustice results from environmental conditions that affect communities differently based on residents’ race, income level, national origin, and level of participation in decision-making processes. We survey existing EJ/EH screening tools and evaluate selected examples based on parameters that include data availability, characterization of environmental burden and vulnerability, evaluation of stressor levels, and interpretability of environmental health and justice scores. This review highlights the unique capabilities and limitations of EJ/EH screening tools used at the local (US-Centric), national (US-Centric), and international levels. We then discuss unmet needs and thematic limitations apparent in this survey, related to data availability, relevancy of stressors, assignment of indicator weights, threshold values for action and intervention, modeling robustness, and appropriate community focus. The results underline the need for robust, accessible, and community-centric EJ/EH screening tools that can effectively address the unique environmental health burdens and vulnerabilities faced by communities. We conclude with proposed strategies to enhance EJ/EH screening tool development.
1 Introduction to environmental health/justice modeling and hazard assessment
Environmental health (EH) and justice (EJ) crises are increasingly affecting communities globally. According to the World Health Organization (WHO), 23% of deaths globally can be attributed to environmental health-related causes (1). Air and drinking water quality, waste management, access to healthcare, and building sustainability are many issues impacting communities. Administrative oversight, mismanagement of resources, inadequate policy measures, and failure to protect and maintain environmental resources have resulted in a decline of ecosystem-related infrastructure in many areas, including those used for drinking water management (2), traffic, and neighborhood walkability (3). Historically, developing and disadvantaged nations bear the greatest burden of issues caused by the decline of or limited infrastructure; however, in recent decades, developed nations have also encountered EJ/EH challenges. Since the 1960s, the United States has dealt with a growing number of environmental health crises, with infamous cases in Warren County, NC, Love Canal, NY, Flint, MI, and the Cape Fear River basin in North Carolina (4–7). From the national level to the census-tract level, innumerable inequities affect populations with high levels of exposure and vulnerability to various environmental stressors. These inequities result in disproportionate levels of environmental health and quality in a given population due to disparities in access to clean drinking water, air quality, transportation, greenspace access, healthcare, and a litany of other factors (8).
Overall, the issues that adversely affect some communities are defined as environmental injustices. The United States Center for Disease Control (CDC) defines environmental justice as:
…the fair treatment and meaningful involvement of all people, regardless of race, color, national origin, or income, to develop, implement, and enforce environmental laws, regulations, and policies. This goal will be achieved when everyone enjoys the same degree of protection from environmental and health hazards, and equal access to the decision-making process to live, learn, and work in a healthy environment (9).Communities where residents are adversely impacted by environmental stressors such as Flint, MI and the Cape Fear River basin of North Carolina, due to economic, political, and social factors, are burdened or vulnerable communities in need of deliberate environmental justice due to their disproportionate exposure to environmental stressors. For the purposes of this manuscript, the terms environmental health burdens and environmental health vulnerabilities are used interchangeably to mean any single or combination of stressors (e.g., environmental and/or socioeconomic) that increase the likelihood of adverse public health effects, hazards, and potential risk to exposed communities.
In response to the devastating effects of and public outcry over environmental crises in the United States over the past two decades, government entities have developed EJ/EH screening tools to assist risk assessors and stakeholders with monitoring stressors and to prevent future EJ crises. The advancement of computational techniques and increasing availability of environmental quality monitoring data has expedited the development of EJ/EH screening tools in recent years. EJ/EH screening tools allow users to monitor environmental stressors and identify communities burdened by them. Some EJ/EH screening tools have been instrumental in crafting policy, implementing efficient resource management measures, and creating rehabilitation and revitalization plans for affected communities (10–14). Despite these developments, EJ/EH screening tools have limitations. The majority are not capable of monitoring stressors specific to individual areas or local needs. Most do not include reference values based on human health guidelines, which are necessary to evaluate the severity of monitored stressors. While helpful to monitor stressors and alleviate EJ/EH issues, existing EJ/EH screening tools do not always adequately address the needs of communities or potential policy implications due to their limitations (15, 16).
In this manuscript, we survey EJ/EH screening tools, categorizing them based on features and offerings they provide for users. We evaluate EJ/EH screening tools for data availability and accessibility, characterization of environmental burden and vulnerability, evaluation of stressor levels, and interpretability of EJ/EH scores. We evaluate representative EJ/EH screening tools used at the local (US-Centric), national (US-Centric), and international levels, highlighting capabilities and limitations. In the next section, we outline the unmet needs of communities vis-à-vis EJ/EH screening tools and the limitations of currently available tools. We conclude with a discussion of challenges and recommendations on ways to address and prioritize these concerns.
For the purposes of this manuscript, an EJ/EH screening tool is defined as a methodology/framework that assesses the cumulative effects of pollution, chemical exposures, environmental resource management, socioeconomic instability, and other environmental stressors on the overall health of communities using statistical modeling and/or mapping/GIS techniques. We selected EJ/EH screening tools currently in use that are supported by accessible platforms, associated data, and active userbases.
2 Exemplar environmental health and justice screening tools
Initiatives and goals aimed at improving environmental sustainability require different EJ/EH screening tools and associated capabilities based on the level of geographic focus (i.e., local, state, national, international). While most EJ/EH screening tools are not intended for rigorous risk assessment or primary justification of policy changes and regulatory practices, these tools can effectively identify hazard disparities, burden, vulnerabilities, and exposures that require remediation. Furthermore, EJ/EH screening tools are valuable resources for researchers, risk assessors, policymakers, and community stakeholders who rely on timely and trustworthy information for effective action. We provide an overview of currently available exemplar EJ/EH screening tool that possess the traits necessary for monitoring and screening EJ/EH impacts. The following section separately evaluates the EJ/EH screening tools and discusses limitations that need to be addressed for full realization of their potential. Key themes discussed include environmental health data and indicator availability, environmental burden risk characterization, emphasis on cumulative impacts of environmental stressors, and a concerted effort for community engagement and involvement pre/post EJ/EH screening tool development. Table 1 presents the tools discussed organized by their geographic level of focus.
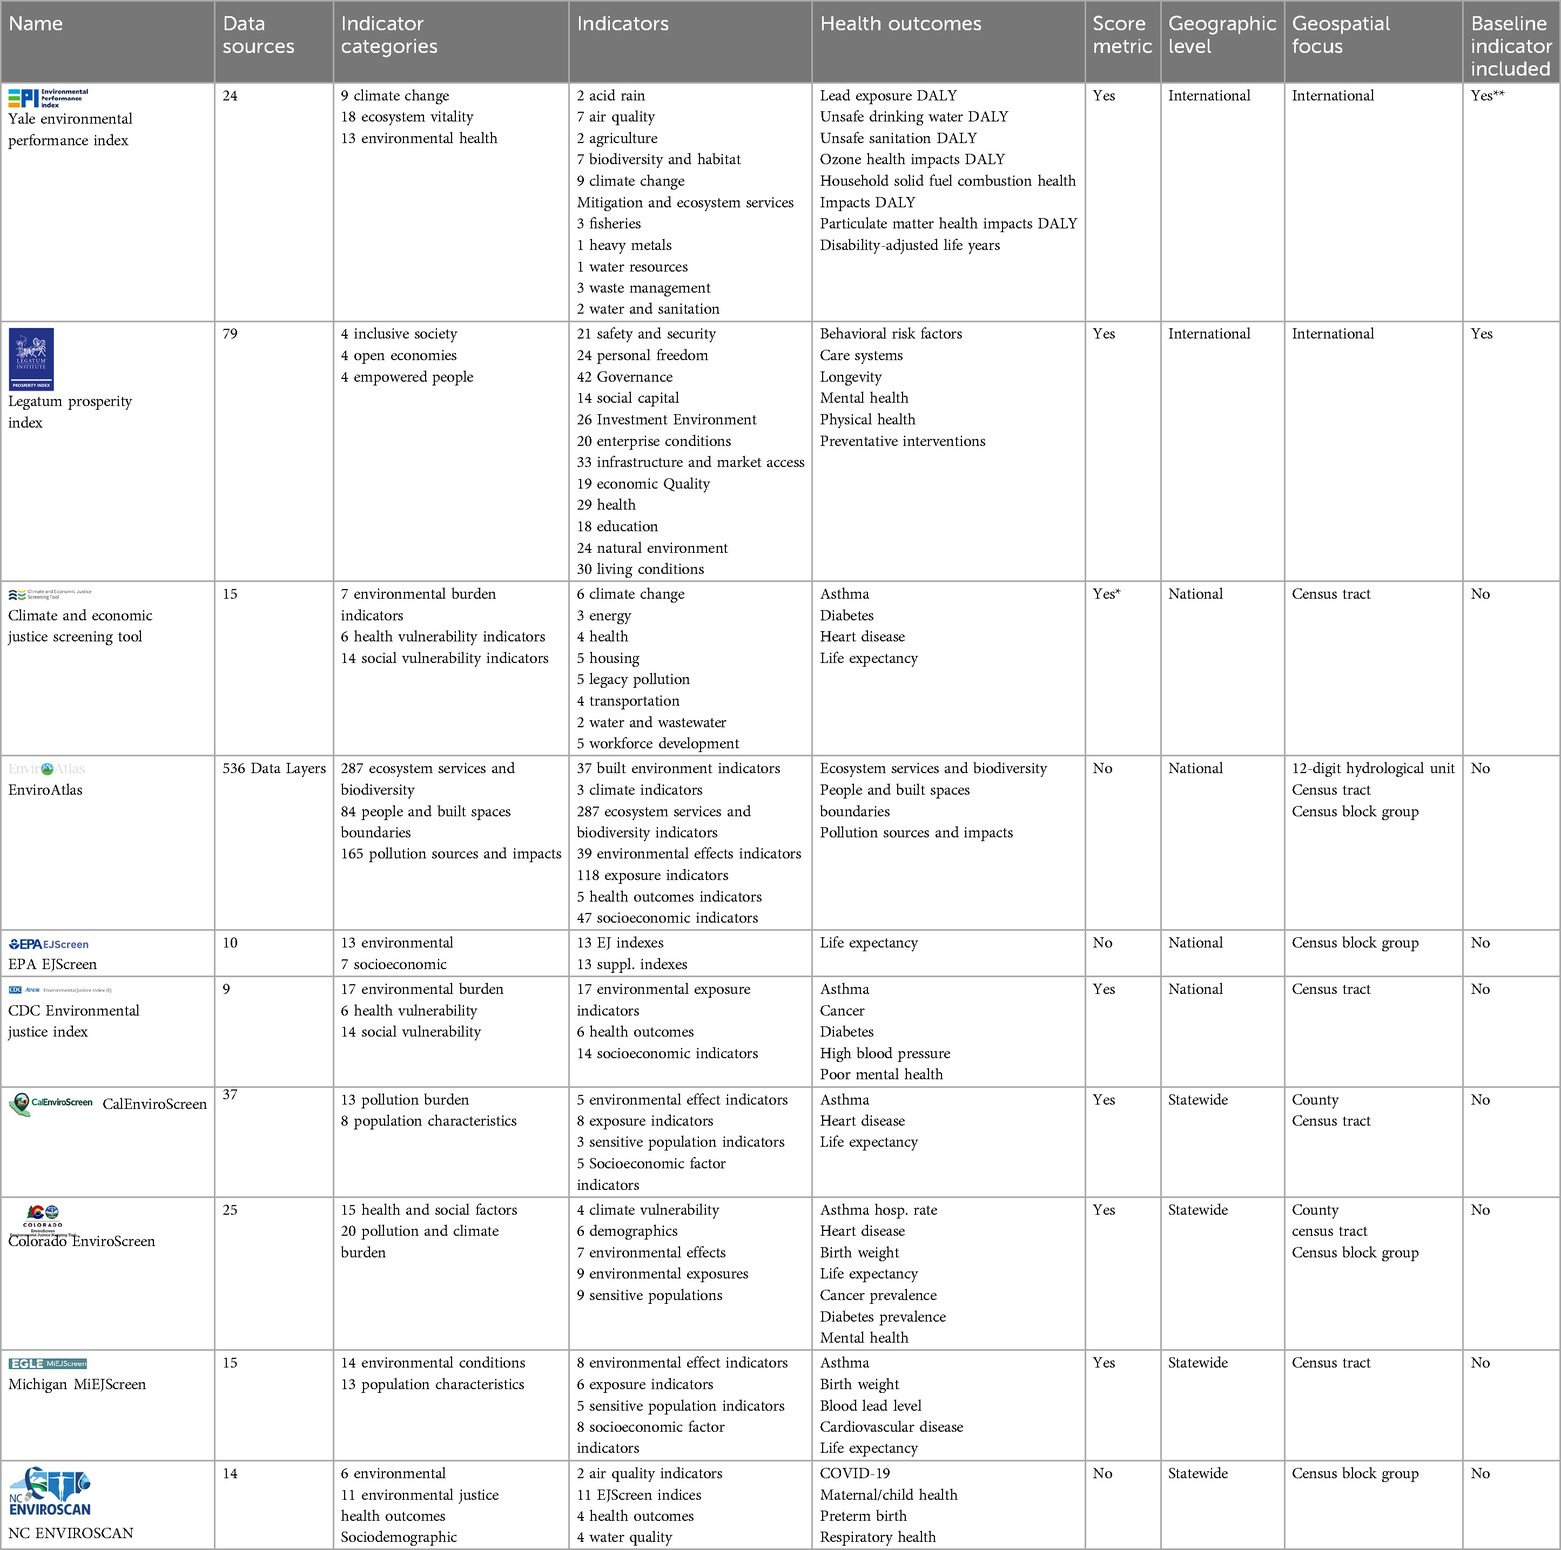
Table 1. Environmental justice/health screening tools table.
2.1 International-level tools
International-level EJ/EH screening tools are primarily focused on evaluating the performance of countries in their efforts to manage environmental health and sustainability. Data availability constraints can significantly affect international-level EJ/EH screening tools, as the data available as inputs depend on the environmental monitoring programs in place in individual countries, which vary widely. Some input data for EJ/EH screening tools is taken from reports evaluating progress toward meeting the standards or goals in global agreements set by multinational entities such as the United Nations (UN) or WHO. These commonly include goals on water, sanitation and hygiene (WASH), air quality, and climate action. As a result, the key function of most international-level EJ/EH screening tools is in determining nation-level global standings on EH and sustainability. The Yale Environmental Performance Index (EPI) (17) and the Legatum Prosperity Index (LPI) (18) are two examples of such a tool.
2.1.1 Yale's Environmental Performance Index
2.1.1.1 Background
For the past 20 years, the EPI has taken a global approach to measuring environmental quality and performance in accordance with the UN Sustainable Development Goals (UN SDGs). A result of a collaborative effort by the Yale Center for Environmental Law and Policy and the Center for International Earth Science Information Network (CIESIN) at Columbia University's Earth Institute, the EPI provides practical guidance and a framework used by 180 countries to track their progress toward environmental sustainability and ecosystem preservation. Updated biennially, the EPI leverages 40 indicators that include factors for policy objectives, environmental health and climate change, and factors in several issue-based categories such as air quality, sanitation, and water. EPI scores are based on the cumulative sum of every included indicator, with each indicator weighted as a percentage of the total EPI score. Each indicator's contribution to the total EPI score is displayed as a percentage that is equivalent to its weight. Indicators focused on environmental health, ecosystem vitality [i.e., agriculture, WASH, air quality, emissions, water resources, and biodiversity factors], and climate change strategies and efforts are the types of indicators used to calculate each country's EPI score. Furthermore, Yale EPI aggregates these categories into three policy objectives: Environmental Health, Ecosystem Vitality, and Climate Change.
2.1.1.2 Advantages
The EPI considers the effects of policy objectives, which highlights gaps in governance and differences in social and economic factors that affect nation-level EPI scores. To gauge EH values and quality, thresholds comprising performance targets and values of interest are used to determine whether individual indicators meet, miss, or exceed standards. Benchmark threshold values are determined based on the recommendation from a three-part criterion that include the following: 1. International sustainability and environmental management agreements (i.e., UN SDGs, The Paris Climate Agreement, and the Convention on Biological Diversity); 2. Domain expertise; and 3. Percentiles from good performing country scores (i.e., 95th–99th percentile = good 1st–5th percentile =bad). However, according to EPI developers, most of the threshold values are based on percentile-based rank comparisons, since specific values to gauge performance ratings for most indicators are not specifically established by regulatory parties. Fortunately, percentile-based thresholds for each indicator are not only generated from the current EPI year's report but from all available data from all years for every country. Scores are calculated for each country by first logarithmically transforming raw indicator values to improve comparative analysis. Transformed data is then inputted into a general formula for indicator scoring by leveraging the distance to target approach. Using this approach, the difference between a country's indicator value and the given target performance threshold is calculated and is divided by the difference between the best performing country's value and the worst performing country's value. This score is then rescaled to fit the range between 0 and 100 (i.e., 100 = best performing nation, 0 = worst performing) for a given indicator.
EPI reports are released on a biennial schedule and scoring methodology and inclusion of additional indicators are also updated. The update schedule enables a focus on continual refinement of the scoring methodology and country ranking procedures as new indicators and metrics can be added to generate informative EPI scores. However, comparing EPI scores across years can be problematic. Challenges in comparative trend analysis arise because all data used in EPI are not collected and/or monitored at consistent timeframes. Because of this, EPI does not support annual reports of EPI. Despite such challenges, the 2022 EPI report includes backcast scores from the past ten years along with the current year's performance scores. For the policy objectives, weights are specifically determined through robust statistical analyses and are not equal. The reason for this is that the Environmental Health policy objective's metrics range in greater magnitude compared to Ecosystem Vitality and Climate Change and would impact overall EPI scores despite contributions from the latter two policy objectives. Therefore, to account for this issue, the Environmental Health, Ecosystem Vitality, and Climate Change policy objectives are weighted 20%, 42%, and 38%, respectively. Weights for individual indicators and categories vary based on data availability, statistical manipulation, timeliness of data, and importance of select issues related to environmental sustainability. The 2022 EPI report emphasizes that users should not rely on weights as firm statements of importance but rather as suggestions of significance. The Yale EPI also provides a weighting explorer tool that allows users to adjust indicator weights.
2.1.1.3 Limitations
Select indicators are measured in relation to health impacts (i.e., ozone, combustion of household fuel, unsafe drinking water, lead exposure) regarding age-standardized disability-adjusted life years (DALYs). As mentioned previously, to determine performance thresholds for all indicators, most EPI indicator performance thresholds are determined from percentile-based rank comparison for countries that are poor performers vs. those that are good performers. While each indicator's performance threshold is calculated from all available data for all years for a given country, incorporating percentile-based threshold values compared to human health-based guidance (HBGV) values or reference values for specific indicators (i.e., ozone, PM2.5, unsafe drinking water, lead exposure) limits the ability to fully characterize specific health impacts and how well a country is performing in regard to protecting human health. Given that the Yale EPI calculates scores and ranks at the nation-level, some environmental stressors that uniquely affect specific communities and populations within a country are either: 1. Measured at a broader geospatial resolution (i.e., national, regional), 2. Not measured at a consistent rate (i.e., sporadic data collection practices and/or not measured at all), and 3. Not included within the scope of the EPI's methodology. As a result, communities within a given country that are disproportionately affected by unique stressors compared to the rest of a country's population are simply unaccounted for when tracking environmental performance. This is a salient limitation for both developing and developed countries, as different communities within a country often deal with differing levels of vulnerability to exposures. This is evident with other EJ/EH screening tools evaluated later in this manuscript.
2.1.2 The Legatum Prosperity Index 2023
2.1.2.1 Background
Developed by the Legatum Institute in 2007, the Legatum Prosperity Index (LPI) is a framework for global leaders to best evaluate the progress and current efforts towards managing the sustainable economic, governmental, environmental and social wellbeing of individual nation-states towards prosperity. Prosperity is defined by the Legatum Institute as a state in which all people are provided the chance for economic and social empowerment in a sustainable and inclusive society. The LPI provides a comprehensive ranking for 167 countries worldwide and gauges their progress towards global prosperity annually. The LPI can be categorized in three domains: 1. Inclusive Societies, 2. Open Economies, and 3. Empowered People. Within each domain there consists four distinct pillars for a total of 12 pillars, and across all pillars there are a total of 67 elements with over 300 nation-level indicators that gauge aspects of country performance ranging from governance, infrastructure, economic quality, living conditions, and natural environment. Nation-level indicators are chosen based on a selection criteria and insight from a diverse spectrum of over 100 international experts and advisors in each of the three domains. Indicators selected are standardized using the distance to frontier approach, where scales and units are transformed to fit a range of best cases and worst cases for nation-level indicator performance. The LPI employs the following weighting scheme of importance for indicators in each LPI element: 0.5, 1, 1.5, 2; where 0.5 signifies that a given indicator is not as relevant in explaining prosperity for a given element and 2 signifying that a given indicator is very relevant in explaining prosperity for a given element. The LPI elements are then weighted based on how important they are in explaining the prosperity for a given LPI pillar. Indicator weights for each LPI element are initially set based on the insight from the collection of LPI advisors and the literature, and then based on the statistical significance of an indicator in relation to economic and social wellbeing based on productive capacity measures and Cantril's Ladder of Life Scale. For LPI pillars, percentages are used as weights (e.g., 1%–99%) for each element in each LPI pillar. LPI pillars and domains are all equally weighted as being important in driving nation-level prosperity. The LPI also provides specific scores for each element, pillar and domain. LPI element scores are calculated by taking the average of each weighted indicator score for a given LPI element. LPI pillar scores are calculated similarly, by taking the average of each weighted LPI element score to determine a given LPI pillar score. LPI domain scores and the overall LPI score per country is calculated by taking the average of the pillar scores for each LPI domain and the average of the domain scores for a country's LPI score, respectively. Although the LPI focuses on sustainable social and economic integrity, specific pillars and elements that focus on environmental and social determinants of health provide insight on how well these areas are managed on a global level. Specifically, the Natural Environment and Health pillars that are housed within the Empowered People domain.
The Natural Environment pillar focuses on the effect that the physical environment has on current citizens and the potential impacts on future generations. The Health pillar evaluates behaviors and risk factors associated with human health, access to healthcare services and resources, and the overall health and wellbeing levels of citizens. The range of over 300 indicators used across all elements within each pillar and domain category demonstrate the LPI's focus on providing a comprehensive assessment of global progress and development. Within the Natural Environment and Health pillars, a total of 53 indicators are used to gauge the performance and quality of these categories for each country. For the Health pillar, elements such as Physical Health and Longevity, incorporate indicators that assess measures for physical pain, blood pressure, non-communicable diseases, and mortality at various life stages. The Natural Environment pillar includes indicators related to wastewater treatment, nation-level satisfaction with air quality, measures of various air pollutants, and the health impacts associated with air pollution. Furthermore, each LPI element and pillar has its own score, providing individual insight on each country's performance regarding environmental and public health management practices. Overall, the LPI aims to provide nation-level rankings of prosperity to inform policy initiatives and progress towards sustainable development and equitable resource management at the individual country and global levels.
2.1.2.2 Advantages
The LPI's use of the distance to frontier approach (similar to Yale EPI's distance to target approach for scoring) to standardizing units and scales of indicators also provides a means of comparing country's performance regarding prosperity and provides a benchmark threshold value of comparison for desirable and undesirable levels of prosperity per indicator, which LPI labels as values of logical best and worst case scenarios. The LPI's use of a weighting scheme to signify specific indicators and elements of importance and relevancy regarding prosperity demonstrate the key objectives and issues of concern when it comes to managing and ultimately improving domains of economic and social wellbeing. For example, in the Natural Environment pillar, the Freshwater element and Forest, Land, Soil element are tied at 20% each as the top two weighted elements within this pillar. These LPI elements provide insight on each country's performance and their life impacts on their constituents. Following these elements are Exposure to Air Pollution, Emissions, Oceans, and Preservation Efforts at 15% each. This weighting of importance puts a stronger emphasis and prioritization on freshwater and land resource quality regarding global prosperity compared to air quality.
2.1.2.3 Limitations
While the LPI provides hundreds of indicator level metrics categorized across three domains, 12 pillars, 67 elements, and provides informative insight on social and economic wellbeing globally, it is not without its limitations. Despite the array of environmental and social determinants of health indicators, elements, and related pillars included in the LPI, the inclusion of more timely and relevant indicators would improve our understanding of cumulative impacts of these stressors on human health and overall prosperity. Distinct stressors that disproportionately impact specific countries are not monitored extensively. Furthermore, certain indicators related to environmental effects and conditions, such as waste and toxicity sites, are not included in the Natural Environment pillar, limiting our understanding of the impacts of the physical environment on human health and the quality of life of global citizens. The lack of maternity, gestational health outcomes, and other cardiovascular health outcomes is also a limiting component of the Health pillar. Although the LPI uses the distance to frontier approach for indicator value standardization, the range of country indicator values determines the best and worst case levels to compare. That is, the set benchmark threshold values are not determined based on a desired or undesired goal from regulatory or policy decision making, but rather on the total collection of country indicator values, as similarly shown in the Yale EPI section. This limits the understanding for specific indicators that may be a cause of concern based on exposure concentration levels, policy, or regulatory statutes when comparative rank scoring methods are used to determine set indicator threshold values. Also, as highlighted in the Yale EPI section, given the LPI's global focus on economic and social wellbeing, and despite its use of population-weighted averaging, the disproportionate impacts towards vulnerable populations cannot be adequality assessed. Country or nation-level focus also does not lend itself to fine-scaled resolution assessments. Furthermore, the emphasis on country-to-country comparisons also limits the data sources and types used to evaluate nation-level performance, as only data available for each country can be used for indicator inclusion and ultimate element and pillar categorization. The limitation of data availability and geographic level of focus is a common challenge for many indices and screening tools discussed in this manuscript.
2.2 US-Centric Nation-Level tools
US-Centric Nation-level EJ/EH screening tools report key EH indicators monitored across most municipalities in the United States. These EJ/EH screening tools allow researchers, policymakers, and stakeholders to gauge the performance of current mitigation measures (i.e., policy changes, regulations, exposure guidance), assist resource managers in assessing the vulnerability of populations, and compare mitigation strategies across locales. Stressors monitored at similar frequencies in all areas are used as inputs for EH metrics and indices. Stressors that are not widely monitored or for which insufficient data is available are not included in nation-based EJ/EH screening tools. While updates are made when additional data become available at a sufficient scale, these generally occur annually, with wider intervals in some cases. Nation-level EJ/EH screening tools include data on multiple environmental and sociodemographic factors to characterize environmental quality and hazard across the United States. Exemplar Nation-level EJ/EH screening tools in the United States include EnviroAtlas (19), EJScreen (20), the Climate and the Environmental Justice Screening Tool (CEJST) (21), and the Centers for Disease Control's Environmental Justice Index (CDC EJI) (22).
2.2.1 Enviroatlas
2.2.1.1 Background
Launched in May 2014, EnviroAtlas is a multidimensional environmental and human health resource developed by several entities including the U.S. EPA, the U.S. Geological Survey, the U.S. Department of Agriculture, non-profit organizations, universities, and a vast collection of state and local community stakeholders. EnviroAtlas encompasses a wide array of objectives, from visualizing various environmental quality indicators to assessing the relationship between Superfund site proximity and political affiliation. The resource enables users to evaluate ecosystem services (i.e., the benefits received from nature) and analyze the relationships between ecosystem resource quality, environmental stressors, and public health outcomes. EnviroAtlas provides, at the time of writing, 537 national and community data layers for ecosystem services in categories that include climate stabilization, biodiversity conservation, natural hazard mitigation, recreation, and culture. Within these categories, indicators represent environmental factors related to pollution, impaired waters, hydrologic features, political boundaries, traffic, and walkability. A diverse toolset enables decision-makers to assess planning and management efforts for target areas and assists with resource allocation and environmental rehabilitation measures.
2.2.1.2 Advantages
Outside of the ever-growing array of national and community data layers it provides, an advantage of EnviroAtlas is its ability to perform climate projections through the year 2100 based on current and past greenhouse gas levels, aerosol emissions, and meteorological data. The assessment of environmental quality and its relationship with community health and wellness, at multiple levels of spatial resolution (i.e., the national, census-block group and 12-digit hydrologic watershed basin unit code level) is another strength. Furthermore, Community Summaries for areas across the United States provide rich in-depth summary data and metrics related to demographic, census, land cover, and ecosystem services at fine spatial resolutions. Data on multiple sociodemographic factors, including census data, are used to assess disparities and deficiencies regarding resource allocation. Additionally, the EnviroAtlas ecosystem allows users to overlay maps with their own data for further analysis and comparison with the Community Summaries. Another strength of EnviroAtlas is the ability to examine the effects of tree cover and its role in managing air quality indicators (e.g., ozone, PM2.5, nitrogen dioxide, sulfur dioxide, carbon monoxide) and relationships with health outcomes (e.g., asthma exacerbation avoided, acute respiratory symptoms avoided, school days not lost). The Eco-Health Relationship Browser is an additional resource of the EnviroAtlas platform. The browser provides insights on potential health impacts of ecosystem and environmental health indicators through visual linkage maps that represent the association of ecosystem indicators such as neighborhood greenery with multiple health outcomes.
2.2.1.3 Limitations
Community Summaries are available for only 30 cities in the continental United States. While these communities benefit from in-depth insights on their overall EH integrity from rich data and metrics, areas not covered by the summaries cannot take advantage of the same insights. Further, while EnviroAtlas users can overlay their own data onto maps to create innovative and unique visualizations, data can be proprietary, so this potentially limits the accessibility of the platform. Additionally, EnviroAtlas does not generate cumulative scores or summary metrics for overall EJ/EH quality at varying Geographic levels (i.e., national, census-block group) to gauge the EH integrity of an area or community of interest. Also, while the Eco-Health Relationship Browser provides general information on the relationships between ecosystem and environmental health indicators and health outcomes, insights on specific health outcomes (i.e., asthma, cardiovascular health, cancer) are not available in EnviroAtlas.
2.2.2 EJScreen
2.2.2.1 Background
To address mandates established in Executive Order 12898–Federal Actions to Address Environmental Justice in Minority Populations and Low-Income Populations, the U.S. EPA developed EJScreen beginning in late 2010 and publicly released the tool in 2015. EJScreen helps government partners, advocacy groups, and community stakeholders understand the environmental, EJ-related, and sociodemographic/socioeconomic impacts across communities in the United States using nation-level data. EJScreen indicators cover several domains, including air, water, waste, and proximity to Superfund sites and other potential risk sites, and comprise 13 environmental and seven socioeconomic indicators. EJScreen allows users to evaluate EJ-related issues localized to the census-block level. Two demographic indexes, each computed using the same methodology but different socioeconomic factors, report which population segments are vulnerable to environmental hazards. The Demographic Index (DI) averages two indicators (percentage of low-income residents and people of color), and the Supplemental Demographic Index (SDI) represents the average of five socioeconomic indicators (percentage of residents with low life expectancy, percentage with low income, percentage who are unemployed, percentage who have limited English speaking ability, and percentage with less than a high school education) for each census-block group based on national averages for the given indicators. Each Demographic Index is then multiplied to the national percentile for a specific environmental indicator for a given census-block group to calculate each of the 13 EJ (EJ = DI × EJ Indicator) and Supplemental EJ (Suppl. EJ = SDI × EJ Indicator) Indexes for every census-block group in the United States. Overall, the EJ Index values are intended as a starting point for users and are not definitive measures of EJ in a given area.
2.2.2.2 Advantages
An advantage of EJScreen is its ability to generate open-access data summaries and visualizations of EJ for individual communities through its online interface and mapping tool. EJScreen can generate threshold filter maps that identify areas at or above the 80th percentile for any EJ Index. Locations that are above the 80th percentile mark (i.e., 80–90th, 90–95th, above 95th) for certain indicators are color-coded from yellow, orange, and red accordingly. These values indicate census-block groups that are above national averages for a specific indicator index. Users can also create a buffer region to summarize data across all 13 EJ indexes for a desired area of interest. This helps users determine areas of concern and potentially burdened communities that require further evaluation by providing insight on the cumulative impacts present across the EJ Indexes. EJScreen also combines environmental and demographic data in a central dataset that is updated based on data availability. EJScreen also provides a level of transparency for EJ-related work that is done, so that local regulators, policymakers, and the EPA remain accountable. Health disparities, climate change, and critical service gap datasets are also included for users to visualize and compare conditions across communities at varying census-tract and census-block group levels. Finally, the tool has been instrumental in information dissemination, outreach, and engagement practices, as well as targeting areas for community rehabilitation, resource management, policy reform and overall EJ progress.
2.2.2.3 Limitations
Like other US-Centric nation-level EJ/EH screening tools, the scope of monitored stressors is often limited due to data availability constraints and stressors that are monitored at the regional and local levels. Another limitation is the use of a single environmental indicator to represent population-level characteristics and to provide a summary metric of the effect of a given indicator on a given demographic group. A range of threshold percentile values are used to represent and compare the perceived severity of EJ/EH impacts across communities. While this produces percentile rankings of EJ burden across communities, these rankings are based not on whether the given indicator is at a safe reference or benchmark level, but on how it compares with the extent of exposure or perceived vulnerability in other communities. Moreover, the lack of reference values to determine safe levels of exposure is a limitation of the tool. For example, EJ Index values for census-block groups are not directly comparable. If a census-block group has a higher percentile compared to another census-block group for a particular EJ Index, this does not indicate that the census-block group has a safe level for an indicator. It only indicates that the specific census-block group is “safer” or “better” than the census-block group to which it is compared based on data the percentile-rank is derived from for the given indicator. Finally, while health disparity (e.g., asthma, cancer, cardiovascular disease) metrics can be displayed in the mapping feature, these metrics are not currently included as a separate EJ Index or within the set of available EJ Indexes.
2.2.3 Climate and Environmental Justice Screening Tool
2.2.3.1 Background
The Climate and Environmental Justice Screening Tool (CEJST) identifies areas of vulnerability and burden across the United States. Resulting from Executive Order 14008 and developed in accordance with the Justice 40 initiative, CEJST is an interactive mapping tool that helps federal and state agencies identify and assist (through legislation and reallocating resources) communities in need of improved energy and water infrastructure, pollution mitigation, and sustainable housing (23). The tool was designed to help reach the goal set out in Executive Order 14008 of distributing 40% of federal investments and benefits to disadvantaged communities. Unlike other US-Centric nation-level EJ/EH screening tools, CEJST was designed specifically for multiple federal agencies to identify burdened communities and address their needs. The tool assesses the burden of communities (at the census-tract level) by incorporating a series of indicators across eight categories, including, but not limited to, climate change, housing, health, legacy pollution, water, and wastewater.
2.2.3.2 Advantages
Federal agencies are encouraged to use the CEJST to help identify disadvantaged communities. For a community to be considered burdened or disadvantaged, it must be located in a census-tract or on federally-recognized tribal land with at least one indicator category that is at or above the percentile threshold for that given environmental stressor (i.e., energy, climate) AND a related socioeconomic stressor (i.e., low income). For example, if Community A is below the percentile threshold for climate change, energy, housing, health, transportation, workforce development, and legacy pollution but is at or above the 90th percentile threshold for wastewater discharge in the water and wastewater category and at or above the 65th percentile threshold for low income, it is classified as disadvantaged. The CEJST is updated annually with newly available data. To encourage public and stakeholder feedback on further development of the tool, CEJST provides publicly available open-source code and datasets. Future development plans include implementing multiple language versions of CEJST, beginning with Spanish.
2.2.3.3 Limitations
While CEJST is useful for highlighting single indicators that characterize community burden, it does not characterize the cumulative impacts that multiple stressors have on community burden with a specific scoring metric. As with most EJ/EH screening tools, CEJST is based on specific indicators of burden and vulnerability that are tracked on a national scale. Unique stressors impacting specific areas are not tracked by CEJST. Further, like other nation-level EJ/EH screening tools, the CEJST determines the burden and vulnerability level of a community based on whether that community is at or above the 90th percentile compared to the remaining communities for a given indicator, and not based on whether it is at a safe benchmark threshold level for a given indicator.
2.2.4 Centers for Disease Control (CDC) Environmental Justice Index (EJI)
2.2.4.1 Background
The CDC's Environmental Justice Index (EJI) is the first US-Centric nation-level EJ/EH screening tool focused on the cumulative impacts of EJ and EH inequities. The CDC's EJI provides a public-facing interface that allows users to evaluate environmental and public health indicators and their unique impacts across U.S. communities. Covering 36 components, the EJI categorizes indicators tracked into ten domains summarized into three modules: Social Vulnerability, Environmental Burden, and Health Vulnerability. To characterize EJI, a scoring methodology is employed to generate scores for indicators that track these three modules. For the Environmental Burden and Social Vulnerability modules, percentile rank scores are generated for each indicator per census-tract, and a module score is aggregated and summed, with a 0 score indicating a community having low relative vulnerability and a 1 for a community with the highest relative vulnerability. These module scores are then aggregated to generate an overall EJI score and EJI ranking across all census-tracts. Conversely, for the Health Vulnerability module, census-tracts in the top tertile for prevalence of a given health indicator are assigned a value of 1 while other census-tracts are assigned a value of 0. Health indicators monitored in each census-tract that are classified in the top tertile for prevalence are then flagged, where all health indicator flags for a given census-tract are summed and scored with a value between 0 and 5 (5 indicating all indicators were flagged). For each census-tract, flagged scores are multiplied by a factor of 0.2 to calculate a final Health Vulnerability rank score that consists of either five of the following values in ascending order of severity (0.0., 0.2, 0.4., 06, 0.8, or 1.0). Scores from all modules are then aggregated to calculate an overall EJI score.
2.2.4.2 Advantages
Unlike other US-Centric nation-level EJ/EH screening tools, the EJI applies an equal weighting scheme across all modules to improve the interpretability of community health rankings. An advantage of the EJI is the provision of an overall EJI score along with specific scores for each module and for each module's domain for individual census-tracts. Social Vulnerability and Environmental Burden modules are aggregated for a social-environmental ranking for each census-tract, allowing secondary analyses in relation to specific health outcomes. Similar to CEJST and EJScreen, the EJI measures cumulative impacts at the census-tract level, allowing for census-tract level EJI community comparisons. The CDC also implements stakeholder feedback in ongoing improvement and refinement of the EJI.
2.2.4.3 Limitations
Limitations of the EJI include a lack of dynamic and/or streamed data for current metrics of environmental burden and a lack of future predictions forecasting the potential environmental burdens for communities of interest. Similar to other EJ/EH screening tools, CDC's EJI measures each indicator at the census-tract level based on a percentile-ranked comparison with other census tracts. Additionally, like other US-Centric nation-level EJ/EH tools, the EJI is focused on indicators of burden and vulnerability that are tracked on a national scale. As a result, unique stressors impacting specific areas are not tracked.
2.3 US-Centric regional/local-level tools
While international- and US-Centric nation-level EJ/EH screening tools make concessions regarding methodology and input data to apply a consistent framework for a wide range of localities and populations, US-Centric regional/local-level EJ/EH screening tools are not limited by these constraints and have more flexibility to tailor reporting of specific environmental indicators and stressors by sociodemographic and geospatial parameters. This approach to modeling and screening aspects of EJ/EH helps identify areas of concern regarding rehabilitation, revitalization, and mitigation practices for managing and preventing environmental crises at the state and local levels (24). Many states and regions have adopted similar approaches and methodologies when developing EJ/EH screening tools. These tools include CalEnviroScreen (10), Colorado EnviroScreen (12), NC ENVIROSCAN (25), and Michigan EJScreen (11).
2.3.1 Calenviroscreen
2.3.1.1 Background
A pioneer in the EJ/EH screening tool space, CalEnviroScreen was in development for nearly five years before the first version was released in April 2013. After several iterations and updates, the most recent CalEnviroScreen 4.0 is its most informative and intuitive version yet. CalEnviroScreen is tailored for California communities and is used to support the dispersal of grants and funding to help alleviate the impacts of EJ-related issues and site cleanup measures. CalEnviroScreen monitors the effects of regulatory and policy-related changes on vulnerable communities. CalEnviroScreen leverages environmental and public health data to develop indices and scores to gauge the overall vulnerability of communities in California at the census-tract level. Furthermore, a weighted arithmetic mean or average is used to generate scores for each census-tract. CalEnviroScreen scores consist of 21 indicators that describe various population and environmental health characteristics. Thirteen indicators are in the Pollution Burden group component (eight Exposure components and five Environmental Effects components) and eight are in the Population Characteristic group component (three Sensitive Populations components and five in Socioeconomic Effects components). The Environmental Effects components include indicators that track people's proximity to hazardous sites and areas, including solid waste site facilities, cleanup sites and impaired water bodies. The Exposure components contain indicators that track pollutants that people may be exposed to including air quality, water quality, pesticide and built environment stressors. The Socioeconomic Effects components include indicators that may exacerbate personal stress, increasing sensitivity to adverse effects due to exposure to environmental stressors. Some of these indicators track employment, education, and poverty status. Asthma, birth, and cardiovascular health metrics are health-related indicators that provide insight on populations that are disproportionately impacted by exposure to stressors in the Sensitive Populations component. Like other EJ/EH screening tools, CalEnviroScreen leverages percentile rankings for indicators across geographic levels to generate scores for specific communities. The percentile values for individual indicators in each component are averaged together to generate a component score. Next, weights are applied for specific component scores (0.5 for Environmental Effects component, equal weighting of 1 for the remaining components) and then component scores are averaged and scaled, producing group component score values ranging from 0 to 10. Group component scores are multiplied to generate final CalEnviroScreen scores. Final scores range from 0 to 100, with 100 indicating that a community is severely impacted by monitored indicators and stressors.
2.3.1.2 Advantages
Being one of the earliest EJ/EH screening tools in the space, CalEnviroScreen has spearheaded many innovations in data aggregation, indicator creation, and scoring method development. As a result, newer EJ/EH screening tools have adopted many of the foundational features (i.e., scoring methodology, select indicator) CalEnviroScreen established. Also, CalEnviroScreen's approach towards multiplying group component scores (i.e., Pollution Burden and Population Characteristics) is supported by research that emphasizes the effect that certain factors, such as those in the Population Characteristics group component, have in modifying the risk raised through exposure to environmental stressors, such as those within the Pollution Burden group component. Overall, certain populations are more sensitive to environmental stressors, and multiplying these scores helps to account for these sensitivities. CalEnviroScreen is in constant development and is revamped with new iterations every few years. Additionally, CalEPA actively involves community members and stakeholders during the development process of CalEnviroScreen to help identify burdened areas, indicators, and stressors to include in its monitoring.
2.3.1.3 Limitations
CalEnviroScreen scores are based on percentile values, which, while useful for comparing conditions across communities, are limited because they do not incorporate reference or benchmark threshold values for safe exposure and condition levels. Like EJScreen, a CalEnviroScreen score at the 95th percentile for one community compared to surrounding communities does not necessarily mean that the community meets safe standards of contamination or exposure for the indicators that comprise said score. CalEnviroScreen also weights the Environmental Effects component one-half compared to other components, signifying that it has a lesser contribution to pollution burden than the Exposure component, since most Californian communities are not directly exposed to these stressors. While this method may be accurate for most Californian communities, this ignores the potential communities that are vulnerable to these stressors. As a result, some communities may have an overestimated or underestimated CalEnviroScreen score that misses the true extent of the effects of these indicators on said communities.
2.3.2 Colorado EnviroScreen
2.3.2.1 Background
Developed by the Colorado Department of Human and Public Health (CDPHE) and launched in June 2022, Colorado EnviroScreen incorporates many of the same attributes and characteristics as its predecessors, including the CDPHE's Climate Equity Data Viewer and Data Viewer for Disproportionately Impacted Communities. Colorado EnviroScreen also shares developmental characteristics with CalEnviroScreen, EJScreen, and CEJST. Focusing on disproportionately affected communities, either recently or in the past, and EJ issues at the county-level, Colorado EnviroScreen is an effective tool for impactful EJ/EH screening. Colorado EnviroScreen also aggregates monitoring results for various indicators, not limited to environmental exposure, climate vulnerability, and health outcomes metrics. Similar to CalEnviroScreen, Colorado EnviroScreen creates scores for quantifying the potential impacts from exposure to environmental stressors. The Colorado EnviroScreen score is calculated from Pollution and Climate Burden group components (Environmental Effects, Environmental Exposure, and Climate Vulnerability Components) and Health and Social Factor components (Sensitive Populations and Demographic Components) encompassing 35 indicators. Colorado EnviroScreen Scores are calculated and determined for each indicator at the county, census-tract, and census-block-group level.
2.3.2.2 Advantages
Colorado EnviroScreen adopts CalEnviroScreen's scoring methodology; however, when determining component scores, the geometric mean is used instead of the arithmetic mean because indicators within a given component are related to one another. Health indicators such as heart disease, cancer, diabetes and age-related indicators in relation to the population are included within the Sensitive Populations Component, allowing for more in-depth assessment of diverse health effects in relation to environmental stressor exposures. Colorado EnviroScreen indicators can be visualized using a mapping interface and viewed as the concentration/exposure measure or as a percentile compared to other communities in Colorado. Community involvement has been integral in the development of Colorado EnviroScreen, with constant inquiry for community feedback on the inclusion of select indicators to monitor and the rating of the tool's usability.
2.3.2.3 Limitations
Colorado EnviroScreen incorporates important elements for modeling purposes, but additional elements are needed to improve the tool regarding addressing issues relevant to Colorado residents. Moreover, given that it shares several features with CalEnviroScreen, many of the same limitations of CalEnviroScreen are present in Colorado EnviroScreen. As with CalEnviroScreen, nation-level EJ/EH screening tools such as EJScreen, and even international screening indices such as Yale's EPI, percentiles are used as scores of EJ/EH quality across monitored communities. As a result, a percentile ranking for a community that is better or worse than the percentile ranking for another community does not mean that the level of the specific indicator is at a safe guidance level. Colorado EnviroScreen does not incorporate reference or benchmark threshold values for monitored stressors, so users cannot gauge how well a given community is performing regarding EJ/EH vulnerability. Furthermore, Colorado EnviroScreen also uses weights for its given components. While the Health and Social Factors indicators are weighted equally, the Environmental Effects indicator, which is in the Pollution and Climate Burden group component, is weighted as half (e.g., one-half) as much as the Environmental Exposure indicator. While most Coloradoans are not directly affected by or exposed to these Environmental Effects indicators, this leaves out the few communities that are exposed.
2.3.3 Nc ENVIROSCAN
2.3.3.1 Background
Developed in partnership with the University of North Carolina (UNC) Superfund Research Program (UNC SRP), UNC Institute Environmental Health Solutions (UNC IEHS), and Renaissance Computing Institute (RENCI), NC ENVIROSCAN is an EJ/EH screening tool developed to increase awareness of key EJ issues, social, and public health stressors impacting communities in North Carolina. The NC ENVIROSCAN framework includes environmental, sociodemographic, environmental justice, and health outcome indicators. The tool also focuses on reporting monitoring results at the census-tract and ZIP-code levels to help users gauge the level of EJ/EH vulnerability in specific communities.
2.3.3.2 Advantages
An advantage of NC ENVIROSCAN is its inclusion of health outcomes data, specifically pregnancy/gestational-related metrics, COVID-19 case and mortality rates, on the online platform. The mapping tool also reports on private well-water contaminant levels (i.e., arsenic, cadmium, lead, manganese) based on threshold values for standard concentrations. Healthcare and education access indicators, such as the number of hospitals and private/public schools, are also included in the mapping tool interface. NC ENVIROSCAN also incorporates EJScreen's EJ Indexes to provide summary metrics on EH integrity.
2.3.3.3 Limitations
Because of the nascency of development, several features that would improve NC ENVIROSCAN have been identified and will be included in upcoming updates. These additional features include monitoring of air quality indicators such as NO2, SO2, CO, and Pb and sociodemographic indicators such as greenspace abundance, access to transportation, and soil-related domains. Additional contaminants, including per- and polyfluoroalkyl substances (PFOS/PFAS), will be included in updates of NC ENVIROSCAN, with a focus on relevant stressors in North Carolina. Unlike CalEnviroScreen and Colorado EnviroScreen, NC ENVIROSCAN does not currently incorporate a scoring metric that would allow users to gauge the integrity of a census tract or ZIP code's EJ/EH integrity and level of hazard compared with surrounding areas.
2.3.4 MiEJScreen
2.3.4.1 Background
Modeled on the development and methodology used in the California EPA's CalEnviroScreen, input from community members, and recommendations from the Michigan Environmental Justice Workgroup, the Michigan Department of the Environment, Great Lakes, and Energy's (EGLE) Office of the Environmental Justice Public Advocate developed MiEJScreen in 2018 as an intuitive EJ/EH screening tool that uses environmental conditions and population traits and characteristics to calculate impact metrics of EH and EJ at the census-tract level. MiEJScreen was developed to inform stakeholders (i.e., government agencies, researchers, policymakers, and impacted communities) of EH integrity and potential EJ issues in target areas for mitigation and rehabilitation efforts. MiEJScreen incorporates 26 indicators categorized into four components (environmental exposure, environmental effects, sensitive populations and socioeconomic factors). For each census-tract, the average percentiles for each component of indicators are summed and weighted to generate two group components, namely Environmental Conditions (Environmental Effects and Environmental Exposures) and Health and Population Characteristics (Sensitive populations and Socioeconomic factors), sub-scores. These two sub scores are summed to calculate the final composite MiEJScreen Score for a given census-tract. The MiEJScreen scoring methodology was adapted from CalEnviroScreen and generates sub-scores for components, group components, and overall MiEJ scores. MiEJScreen also allows users to assess the environmental, health, and socioeconomic conditions of Michigan communities at the census-tract level.
2.3.4.2 Advantages
MiEJScreen scores can be mapped at spatial resolutions from the county to census-tract level and based on indicators of interest. This allows users to assess individual indicators, components within each group component, and a cumulative MiEJ score for a target area. The Michigan Department of EGLE uses MiEJScreen to enhance decision-making, planning, and policymaking for communities disproportionately affected by unique environmental stressors. EGLE supports and promotes opportunities for equitable treatment and involvement of Michigan residents in the development and refinement of MiEJScreen. This ensures that no group has a disproportionate share of negative consequences from policies related to MiEJScreen. Further, MiEJScreen includes indicators and factors relevant to demographics and past EJ issues, such as the inclusion of childhood blood lead-level concentrations for the Sensitive Populations factor.
2.3.4.3 Limitations
As the framework for the MiEJScreen is mirrored after CalEnviroScreen, many of its advantages and limitations are similar. Like CalEnviroScreen scores, MiEJ scores are calculated as percentiles and are ranked for each indicator and component across all census-tracts in Michigan. While this provides a means of comparing other communities’ cumulative MiEJ Scores, the extent to which a community is burdened based on benchmark threshold values cannot be determined. Furthermore, the lack of threshold values limits transparency regarding whether communities are at safe levels of exposure for specific environmental stressors. The weights used for MiEJ Scores follow a methodology similar to that used by CalEnviroScreen, where Environmental Effects are weighted one-half of the Environmental Exposure component within the Environmental Conditions group component, as most communities in the state of Michigan are not directly exposed to these factors. However, as with other EJ/EH screening tools, this adjustment does not consider the few communities that are directly impacted by and exposed to these environmental effects.
3 Discussion
3.1 Unmet needs and limitations of current tools
When highlighting the capabilities, differences, advantages, and limitations of the selected EJ/EH screening tools, several overarching themes related to their limitations are apparent. We discuss these thematic limitations as opportunities to address as-yet unmet needs in the following subsections.
3.1.1 Data availability
3.1.1.1 Limitations
EJ/EH screening tools differ in their frameworks, scoring methodologies, indicators included, population parameters, and geospatial scope. Some EJ/EH tools focus on assessing cumulative environmental health effects while others identify differences among specific environmental health indicators of interest. However, a major constraint of all tools is uncertainty regarding data availability, which can significantly affect the capability of EJ/EH screening tools to report and model EH. To address uncertainty in risk assessment, combining multivariate monitoring and population-specific data with overall scientific research is common (26–28). Accordingly, issues can arise when data gaps affect the ability of a tool to accurately characterize vulnerability and burden for specific communities. Inconsistent data, limited diversity in the indicators assessed, infrequent reporting, and a lack of rich datasets of environmental health and quality indicators limit the performance of EJ/EH screening tools. As a result, many tools aggregate data and make various concessions and tradeoffs to deal with this uncertainty.
3.1.1.2 What strategies can be implemented to meet this need?
Managing uncertainty is a challenging but necessary task to maximize the applicability of environmental health data in EJ/EH tools. The technical documentation for several tools mentions the concessions made to deal with uncertainty in screening data. CalEnviroScreen takes measures that include omitting data with high margins of error and major data gaps that may affect results (10). The EPA EJScreen and MiEJScreen recognize the limitations and uncertainty of results when dealing with demographic and environmental estimates for screening purposes, especially at fine spatial resolutions (11, 29). Other tools such as Colorado EnviroScreen assume data sources have already handled uncertainties and errors and focus on integrating up-to-date data into the screening framework (12).
To address these issues, the most important strategy is prioritizing the frequent monitoring of pollutants and environmental stressors. To ensure reports are frequent and timely, the data used needs to be updated at regular intervals. Second, identifying areas of uncertainty as a metric can be beneficial, as opposed to making concessions for these areas. While accounting and adjusting for uncertainty is a commonly used strategy, incorporating this limitation as an additional stressor can highlight areas of vulnerability that communities should consider for environmental health management. Finally, establishing more local/regional monitoring networks and increasing the sampling frequency of environmental monitoring data can address the data gaps encountered with most EJ/EH screening tools, as it has been shown to be effective in both environmental health and natural resource management (30, 31).
3.1.2 Relevancy of stressors
3.1.2.1 Limitations
While it is informative to consider stressors that reveal areas with better performance compared to others for specific categories, certain areas may be disproportionately affected by stressors that are not included in a EJ/EH screening tool.
Stressors that are more relevant and pressing to specific communities that are identified as environmentally burdened or disadvantaged should take precedence over less relevant stressors. Specific communities are identified if they exhibit risk factors/warning signs of being environmentally burdened or disadvantaged based on either external governing body review (i.e., municipalities’ health and environmental quality departments) and currently applicable EJ/EH screening tool results (i.e., CEJST metrics for classifying a census-tract as disadvantaged). The choice of indicators used to monitor and screen for EJ/EH quality across tools and frameworks often depends on two factors: data availability and the importance of the environmental stressor as it pertains to potential hazard. EJ/EH screening tools typically monitor contaminants and stressors related to air pollution, water quality, land use and waste, and health and social factors. However, in the interest of developing screening frameworks applicable to a broad geographic area (i.e., country, state, county, city), and to account for constraints due to data availability, environmental indicators are chosen based on how well they generally characterize a community's level of burden or disadvantage when it comes to environmental health and wellbeing. For example, EJScreen comprises 13 EJ Indexes, CDC EJI includes 36 total indicators, and EnviroAtlas contains over 500 spatial data layers representing ecosystem services. Indicators in these EJ/EH screening tools are used to characterize the integrity of several environmental and socioeconomic domains across the United States. Categories composed of several indicators that represent key EJ/EH stressors enable users to assess the overall quality and integrity of a location and set benchmarks to evaluate trends in environmental resource management and actions to protect public health. However, understanding the full extent in which a community is burdened or disadvantaged can be affected due to a lack of prioritization of relevant stressors impacting said community.
3.1.2.2 What strategies can be implemented to meet this need?
The indicators included in EJ/EH screening tools are typically those that best represent the environmental exposures and effects across a monitored area. While monitoring EJ using a general set of indicators can be valuable, communities are affected by different stressors and have unique concerns that may require further attention and screening.
For example, concerns about PFAS exposure serve as a microcosm of societal issues regarding the pervasive lack of proactive management, monitoring, and screening of environmental stressors and contaminants affecting many communities (32–37). Similar disparities are apparent in NC ENVIROSCAN and the indicators monitored through this platform. Expanding the scope of monitored contaminants and stressors to include those with disproportionate impacts on North Carolina communities (i.e., PFAS) would enable decision-makers to focus attention and resources on affected areas. Expanding monitored components beyond the four currently monitored water contaminants (i.e., arsenic, cadmium, lead, manganese) and including threshold/reference values to determine whether concentrations are within safe limits would also enhance monitoring efforts.
In regard to conventional EJ/EH screening tool development and indicators included in said tools, specifically regional or state-level tools, concerted efforts toward fostering and facilitating collaborations with local health and environmental quality departments can assist in identifying and including key stressors disproportionately impacting the communities under their jurisdiction. Additionally, engaging and involving community stakeholders to assist in identifying relevant stressors impacting communities can also prove to be beneficial in tool development (31). As mentioned in previous sections, many tools at the state and nation-level including Colorado EnviroScreen, CalEnviroScreen, and CEJST have incorporated community involvement during all stages of tool development, including ongoing post-development updates. Localizing this effort directly in burdened or disadvantaged communities can improve stressor identification and ultimately prioritizes monitoring going forward. Local examples detailing the benefits and effectiveness of community engagement at a local level are illustrated in Section 3.1.6 of this manuscript.
3.1.3 Assignment of indicator weights
3.1.3.1 Limitations
Current methods in EJ/EH screening tools and platforms primarily focus on tracking and comparing environmental health stressors that are monitored on a international/nation/state level. Monitored stressors generally focus on what most communities are exposed to (e.g., air pollution, water contaminants, soil/land/built structure stressors, and social determinants of health). For most EJ/EH screening tools, expert assessment and evaluation is used when determining factor weights for EJ scores. Furthermore, many tools employ equal weighting or a general weighting scheme for indicators/stressors that are assessed for their given geographic level of interest. This ensures scoring methodologies are generalizable and applicable to all target areas of interest for comparative analysis. Nation-level EJ/EH screening tools, such as CDC's EJI, employ an equal weighting scheme across all indicators and modules because of limited scientific evidence for use of a specific weighting scheme and for the ease of interpretation and applicability of specific weights towards impacting environmental health (22). Module scores are aggregated and summed to calculate EJI scores. In contrast, more regional or state-level EJ/EH screening tools, including Colorado EnviroScreen, MiEJScreen and CalEnviroScreen, implement a scoring scheme that weights some indicators as more important based on monitoring data for the target areas of interest.
An example at a state-level is CalEnviroScreen. As mentioned in previous sections, CalEnviroScreen Score is calculated from two group component scores of Environmental Conditions and Population Characteristics that include two separate components each, specifically Environmental Effects and Environmental Exposures, and Sensitive Populations and Socioeconomic Factors, respectively. While all indicators within each component, a total of 26, are weighted equally when calculating the CalEnviroScreen Score, the weight of importance given to components to generate the CalEnviroScreen Score is not equal. While the Sensitive Populations and Socioeconomic Factors components in the Population Characteristics Score and the Environmental Exposure component within the Environmental Conditions Score are weighted the same (i.e., 1.0), the Environmental Effects component is weighted one-half (0.5) of what the other components are weighted (1.0). Indicators within this component only account for proximity to sources of potential exposure and not direct exposure, and as a result, due to proximity is weighted as so to be most applicable to the risk to communities impacted (10).
While relying on expert guidance is valuable, especially when dealing with highly variable and diverse data sources, a one-size-fits-all approach to EJ/EH screening and modeling that fails to incorporate population-specific conditions can distort hazard assessment results. By prioritizing a more generalizable methodology and maximizing the monitoring range in regard to geography, populations adversely impacted by stressors with lower weights may be disproportionately monitored and their levels of hazard potentially overlooked.
3.1.3.2 What strategies can be implemented to meet this need?
As illustrated in Table 1, the Colorado EnviroScreen CO EnviroScreen Score comprises individual component scores grouped into two group components (Health and Social Factors, and Pollution and Climate Burden). The component scores in each group component are averaged, scaled, and multiplied together. When averaging the component groups’ values, each component is assigned a weight based on all Colorado residents’ perceived exposure to the component's stressors. For Colorado EnviroScreen, Environmental Effects and Climate Vulnerability indicators (indicators in the Pollution and Climate burden component) are weighted at 0.5 while indicators in the Pollution and Climate category and the Health and Social Factors group are weighted at 1.0. While most Coloradans are not directly exposed to Environmental Effects and Climate Vulnerability factors, indicators monitored within each of these components pose an issue for some communities and populations. For example, proximity to the National Priorities List site Colorado Smelter in Pueblo County is a major concern as lead exposure through soil contamination and air emissions can adversely affect communities (38–40). Further, proximity to oil and gas facilities in counties with per capita income below Colorado's and the United States’ national average, such as Montezuma, Archuleta, and Weld Counties in Colorado, is a concern due to the multiple sources of exposure in these areas. Such exposures have been associated with low birth weights and other adverse birth outcomes in several studies (41–44). Additionally, a propensity for increased drought occurrences also poses a concern for some counties, including Pueblo and Weld Counties (45). However, given that most of Colorado's population is not directly exposed to these environmental stressors, these stressors are not weighted as important. As a result, the previously discussed counties and the communities that are directly exposed are left disadvantaged in the scope of the applied scoring methodology.
Most EJ/EH screening tools select indicators of importance based on expert consultation, whether through direct consultation or through prevailing literature on given environmental stressors. Another justification for a more conventional approach towards screening is for method simplicity and transparency purposes. That is, to evaluate given indicator measures, it is favorable to have a set weighting to effectively compare one area to another based on its level of vulnerability/burden. This is evident in most tools, especially in CDC's EJI. Yale EPI, for example, adjusts weights for specific indicators based on relevancy towards country of interest (i.e., landlocked countries and marine protected area indicator). Unfortunately, development of many of these EJ/EH screening tools has proven to be resource intensive, with the need of countless hours of method development, engagement and involvement with community stakeholders, and thorough deliberation to decide on indicators to include and to develop alone. Applying a similar approach with input from expert consultation for individual communities at a smaller geographic scale would prove to be too resource intensive.
Therefore, using data-centric methods and approaches rooted in statistical inference to determine indicators' weights would prove useful because: 1. Limited reliance on the subjectivity of experts and developers in tool development stage; 2. Tailored approach lends itself to focus on needs and relevance of risk/hazard to population of interest; and 3. Weights are dynamic and always changing to fit the most current needs of the community.
That is, as weights change in level of importance, progress towards mitigating risks of previous highly weighted indicators has been made and efforts and resources can be shifted to new areas of need. This can improve the resource allocation efficiency and management of environmental health crises and issues. Furthermore, applying this weighting scheme toward a scoring methodology that weighs indicators of importance and value based on the most relevant areas of concern at a finer spatial resolution can provide communities with metrics that reflect their reality. Adjusting weights based on the stressors present at the city, zipcode, and census-tract levels can provide a more accurate picture of environmental health and help identify EJ/EH issues that would ordinarily be missed with a state-level approach to monitoring. This can, in turn, improve management and mitigation practices.
3.1.4 Threshold values included for monitoring purposes
3.1.4.1 Limitations
Many EJ/EH screening tools implement a scoring metric to characterize the quality of individually monitored components and determine overall EJ/EH scores for areas of interest. For most EJ/EH screening tools, varied indicators are monitored and used to calculate scores and rankings and thus their units of measure vary greatly. To maintain unit consistency, raw monitored indicator values are converted to percentiles in relation to their location (e.g., percentiles for Indicator A across all census blocks). To calculate a score for a specific component, the product of each indicator's monitoring values and distinct weights is summed to calculate an overall EJ/EH score for a target area. This enables users to assess and compare environmental health and quality across monitored areas based on specific indicators, components, and overall EJ/EH scores. This is the method used for most EJ/EH screening tools, including EJScreen, CalEnviroScreen, MiEJScreen, and Colorado EnviroScreen. While these metrics are useful for comparative analysis of environmental quality and health across monitored areas, the extent to which these values determine the performance of an area in relation to a given indicator's safe level or level that indicates regulatory compliance is not readily apparent or interpretable. In other words, the EJ/EH score of a census-block group is entirely dependent on how it compares to the EJ/EH score of other census-block groups and is not reliant on levels in standard health guidance or regulatory levels.
As an example, for indicators in the Pollution and Climate Burden group component in Colorado EnviroScreen, EJ/EH percentile scores for all census-block groups are ranked from 1 (for low hazard burden) to 99 (for high hazard burden). The exemplar location being monitored and screened contains several census-block groups. Groups A and B have percentile scores of 34 and 55, respectively. While group A has a lower hazard burden percentile-wise compared to group B, this does not indicate whether these values are in accordance with values used to determine safe contamination or exposure levels. The percentile scores do not explain the level of severity in relation to safe contamination or exposure levels. These scores, however, do indicate how well-monitored exposure rates compare to the rates for other groups because no reference values or thresholds are included.
3.1.4.2 What strategies can be implemented to meet this need?
The lack of threshold values to assess the levels of burden and vulnerability for specific areas limits the usefulness of tools and can result in gaps in transparency for regulators, researchers, and the public regarding progress in policy and environmental health management. Further, the percentile rank method, while useful for comparative purposes, implies that of the locations tracked, some are performing well or have safe levels of exposure.
Leveraging regulatory standards, maximum contaminate levels (MCLs), and HBGVs as a baseline for stressors and indicators can be informative. Some EJ/EH screening tools incorporate such standards within monitored indicators. The CDC's EJI leverages air-quality indicators [e.g., mean annual days and eight-hour maximum days for which ozone concentration levels are above National Ambient Air-Quality Standards (NAAQS)] and water-pollution indicators (e.g., percentage of watershed that is impaired per census-tract). However, if a set of census-tracts includes an elevated average number of days with ozone concentrations above NAAQS, their percentile ranks will misrepresent EJ/EH quality. Alternative implementations of the percentile-rank scoring method could include MCL and HBGVs as references for percentile rank construction, specifically for environmental quality indicators (e.g., air and water pollutants, chemical contaminants). Including a baseline or reference metric for comparison of indicators for other census-tracts (e.g., group A's indicators are set to regulatory/MCL/HBGVs) and applying a percentile-rank scoring methodology that better reflects the magnitude of effect that stressors and indicators have on a given area can improve existing tools.
3.1.5 Robust and appropriate modeling
3.1.5.1 Limitations
The choice of model affects both confidence (statistical robustness) and the usefulness of outputs, as presented in the EJ/EH screening tools discussed in Section 2, to users. In other words, how can these tools assure that models present actionable information that communities can trust?
Most EJ/EH screening tools employ a series of computational methods and techniques to characterize burden and other social determinants of health. Many EJ/EH screening tools utilize GIS techniques for mapping and geographic representations and analyzing EH data. Waldo Tobler's first law of geography states that everything is connected and the strength of that connection is dependent on distance (46). There is substantial support for the notion that distance and location are associated with levels of exposure to environmental stressors (47–49), giving credence to the use of GIS techniques.
Manual or more ground-based monitoring efforts are foundational means of collecting environmental health and quality data at a fine spatial resolution for specific areas. However, ground-based efforts can be limited in range of monitoring, leading to spatiotemporal disparities in monitoring results. Advancements in remote sensing data helps fill the disparate data gaps that ground-based sensors pose for wide areal units. Improvements in satellites, such as Terra, Aqua, and those in the Sentinel and Landsat families, have yielded continuous and fine spatial resolution data useful in assessing earth's atmospheric and landcover-related conditions (50, 51). In recent decades, use of remote sensing data has allowed for the incorporation of key indicators that measure greenspace, air pollution, traffic impacts and other aspects of the built environment (50, 51). Many tools already leverage these technologies, including the EnviroAtlas, Yale EPI, and state-level tools such as CalEnviroScreen, Colorado EnviroScreen, and MiEJScreen. More efforts can be made; however, to improve data integration of these data modalities and at varying spatial resolutions.
Many of the EJ/EH screening tools surveyed in this manuscript employ GIS techniques not only to aggregate environmental monitoring data based on distance and locations of interest for further statistical analysis, but to also map and provide a visual representation of cumulative impacts based on a specific geographic area (10–12). GIS techniques also assist in analyzing relationships between distance and proximity toward EJ/EH. Geospatial analysis approaches such as spatial coincidence analysis, distance-based analysis, and pollution plume analysis are used to determine the proximity of exposure to environmental stressors and investigate differences in exposure across demographics for various populations. Spatial coincidence analysis is based on the assumption that exposure sources located within a given geographic unit equally affect all populations located in that geographic unit, whether this is at the country, state, county, or census-tract level (52). This means that exposure measurements are attributed to all populations within a given geographic unit, regardless of their true distance to the exposure source. Populations located close to an exposure source are considered to have the same exposure as populations far from the exposure source while in the same geographic unit. In contrast to spatial coincidence analysis, distance-based analysis gauges exposure based on the assumption that distance to an exposure source is proportional to a population's level of exposure (53). This means the closer a population is to a stressor source, the higher the level of exposure for the population. Pollution plume analysis accounts for meteorological factors such as wind and precipitation, path of exposure (e.g., via air, water, or soil), and proximity to exposure source when assessing a population's exposure (54). Point and areal interpolations are used to aggregate population data. Many EJ/EH screening tools leverage many of these geospatial techniques to aggregate data sources to develop key indicators of interest. For EJ/EH screening tools such as CalEnviroScreen, the proximity to toxicity sites, impaired water bodies, and traffic impact indicators are developed based on point source buffer zones and census-tract proximity to said exposure sources. Distance or proximity to source of exposure is used to gauge the level of perceived exposure to said stressors.
When it comes to scoring vulnerability, most EJ/EH screening tools employ either additive or multiplicative approaches to characterize perceived vulnerabilities. As a result, EJ/EH scores are calculated based on the collection of indicators or category of indicators included for that specific EJ/EH screening tool. As practical as this is for monitoring purposes, generating future predictions for EJ/EH scores based on the given indicator values for areas of interest is an aspect not explored by many EJ/EH screening tools. The lack of statistical modeling and predicting capabilities limits our ability to understand intricate statistical impacts and the underlying distribution or assumption of cumulative risks to a given population of interest.
3.1.5.2 What strategies can be implemented to meet this need?
Employing the discussed GIS techniques to assist in various health-association studies and EJ/EH screening tools has been useful in modeling and justifying government mitigation initiatives (55–57). Statistical and machine learning techniques such as dimensional reduction analysis and regression techniques (e.g., principal component analysis, multiple correspondence analysis, least-squares regression, regularized regression, spatial autoregression, logistic regression, classification, regression trees) can be leveraged to better understand the underlying data patterns of stressor variables in relation to environmental health burden (58, 59). Furthermore, the use of methods such as geographically weighted regression, spatial autoregression and leveraging of more machine learning techniques can prove useful in selecting key indicators driving EJ/EH vulnerabilities and burdens. Applying these methods can also assist in more tailored composite index and screening tool development.
As the effects of climate change continue to grow, leveraging remote sensing technology to integrate satellite imagery data has proven to be quite informative. Trends in climate and meteorological impacts, such as changes in weather patterns and identifying climate-related tipping points, can be measured more rapidly geospatially and can be tracked in real-time and can assist in ecosystem and environmental resource management efforts (60). As mentioned previously, development of key indicators related to vegetation, greenspace, land cover density and other aspects of the natural and built environment over time can provide spatiotemporal insight on the effects of environmental stressors on environmental integrity (61). In fact, the promise of using both remote sensing and ground-based monitoring data has been demonstrated for various environmental quality factors, ranging from aspects of water quality, air pollutants and other meteorological factors (62–64). Overall, integrating these multiple data modalities in EJ/EH screening tools and employing statistical and machine learning techniques for modeling EJ/EH quality, can improve our understanding of the cumulative impacts of environmental stressors toward environmental and community health.
3.1.6 Community-focus
3.1.6.1 Limitations
Poor communication between regulators and the public has spurred dissent and distrust when relaying environmental health information via social mediums. While people have ample access to information and news relevant to their circumstances, the lack of oversight regarding the credibility of publicly communicated monitoring results has led to confusion regarding accuracy. Misleading news reports on the COVID-19 pandemic and the minimal information initially released about the Flint, Michigan water crisis are examples of how mixed messaging in media has fueled dissent and weakened public trust in regulatory officials (65–67). In fact, it is arguably a health disparity issue, as poor health and environmental health literacy regarding individual and environmental health vary based on socioeconomic and demographic factors. As a result, the potential risks to vulnerable populations (i.e., children, the elderly, women of childbearing age) and the disproportionate impacts on some communities further exacerbate health inequities (68–70). However, while problematic, this in no way indicates that poor health literacy is the only driver of EJ/EH issues. Instead, it is a contributing stressor and a consequence of various environmental health stressors. Researchers have detailed the relationships between public health and environmental health literacy, disparity, and various social determinants of health, how they ultimately contribute to and can exacerbate public health issues at-large, and conceptual frameworks to address them (70–72). Regarding EJ/EH crises, the public's limited understanding of the risks and hazardous impacts of chronic exposure to environmental stressors can have disastrous effects.
In lieu of a deeper analysis of media responsibility for accurate, impartial news reporting, we explore the value of timely, frequent, and comprehensive reports on environmental and public health and the mutual responsibility that regulators and community stakeholders have in maintaining levels of accountability, transparency, and trust for the overall benefit of the public.
3.1.6.2 What strategies can be implemented to meet this need?
Community engagement and involvement in decision-making and knowledge sharing can improve transparency and facilitate decisions that protect the interests of the public (73–75). Two recent examples illustrate how this can be incorporated to improve EJ/EH screening tools.
The first example is the Appalachian Study. A rural Appalachian community in Kentucky lacked adequate plumbing and access to safe water, leaving many residents disproportionately exposed to various microbes and toxicants and at risk of adverse health effects (76–78). A group of health practitioners, legal professionals, and engineers formed the Interprofessional Collaborative Practice (IPCP) group to address the water insecurity affecting this community. After a series of community stakeholder meetings, the IPCP group developed a water sanitation and hygiene education program and held several health literacy sessions. The group also established a central water kiosk servicing over 4,000 residents to improve access to clean water (79).
The second example is the South-Central Los Angeles Air Study. The California Resources Board created the South Central LA Project to Understand the Sources and Health Impacts of Local Air Pollution (SCLA-PUSH) program to involve researchers and southeast Los Angeles residents in developing community-focused solutions to address local air pollution (80). Through community engagement efforts, residents are recruited and receive training in the use of portable air-quality monitors to collect data on air pollution in their community. This helped inform residents about air quality and empowered self-advocacy efforts regarding environmental health issues (80).
The IPCP and SCLA-PUSH showcase intentional efforts to educate and engage communities by prioritizing their needs and cultivating relationships based on mutual trust and transparency. This provides community members the tools and knowledge needed to safeguard their communities. Many EJ/EH screening tool development teams have made a concerted effort to engage with the public and develop user interfaces that are accessible to the communities served and the public. Community-centered engagement and involvement in the development and use of EJ/EH screening tools are tantamount to addressing these issues. Ensuring that communities’ needs are heard and met is vital for fostering relationships of accountability between officials and community members (73). It also assists researchers and developers with risk and hazard characterization by providing insights on pertinent stressors directly affecting communities (75). Further, transparency in environmental quality monitoring and establishing a level of trust that assures community members that their input is needed and valued ultimately empowers communities to be actively involved in EJ/EH monitoring and screening (81).
3.2 Lessons learned and a path forward
This discussion of the limitations of current tools sheds light on what aspects should be considered in the development of impactful EJ/EH screening tools.
3.2.1 Improve community and public engagement
In recent years, government entities have made efforts to improve community and public engagement in decision-making and have implemented initiatives that directly address complex environmental health concerns. With increased interest in EJ/EH screening tools, many government agencies have prioritized early and frequent public engagement during the development process to ensure stakeholders’ needs are recognized and addressed.
Concerted efforts to encourage community engagement and involvement in the planning and developmental stages for the Colorado EnviroScreen were integral to ensure the concerns of impacted Colorado residents were addressed. In Phase 1, a total of 96 responses were collected from for public engagement, including nine virtual interviews, four virtual focus groups, virtual public meetings, and one-on-one meetings. During these sessions, developers collected initial ideas and focus values. Participants included EJ advocates and organizations, public health researchers, government agencies, and community stakeholders. Interpretation services in Spanish were also provided. In Phase 2 of development, a total of 102 responses were collected including twelve 50-min interviews with key stakeholders, online questionnaires, and a public beta-testing meeting were conducted to gauge user experience and functionality of Colorado EnviroScreen's online platform (12).
A novel community-academia-government partnership spearheaded by Washington community organization group Front and Center was instrumental in developing Washington State's Environmental Health Disparities Map in 2019. This partnership was groundbreaking due to the focus on prioritizing community engagement and involvement early and throughout each development stage. Meetings were held to gather insights from community stakeholders on the types of stressors impacting their communities and what they considered to be important measures of environmental health integrity. Sessions were held on methods to best characterize environmental health disparities and how to incorporate and address the impacts of climate change in affected communities. After each stage, community feedback was solicited, with an emphasis on effective strategies for transparent communication of environmental health and disparity information. The terminology and verbiage used in the tool was discussed at length, and communication goals and policy implications were discussed to gauge the tool's usefulness. Over a two-year period, community organizations in Washington held 11 two-hour listening sessions with 170 participants. The tool was launched at a statewide EJ summit with over 200 community participants who gained hands-on experience using the tool (82).
The Washington State Environmental Health Disparities Map and Colorado EnviroScreen demonstrate how establishing a foundation of equitable communication, engagement, and involvement can foster trust within local communities to address EJ/EH issues.
3.2.2 Establish relationships based on accountability and empowerment between risk assessors and community stakeholders
Despite the recent emphasis on community-centric science initiatives in EJ/EH screening tool development, issues regarding human health risks and fractured scientist-community partnerships in burdened communities have been ongoing for decades. Fortunately, the Old Lead Belt Mining (OLBM) superfund site demonstrates how effective site rehabilitation efforts can be conducted through establishing relationships based on accountability and empowerment between risk assessors and community stakeholders.
Ensuring that community members are directly involved in and informed of the results of the risk-assessment process can help foster positive relationships that help risk assessors conduct assessments that serve the needs and interests of communities. It can also help alleviate issues regarding misinformation of environmental health issues affecting said communities. The OLBM site risk-assessment process prioritized community involvement by educating affected communities about the risks of lead exposure and its adverse health effects. The Environmental Round Table, a collection of representatives from the community, the Missouri Department of Health, Environmental Protection Agency, St. Francois Community College, and the mining industry, was created to inform the community on cleanup, revitalization plans, and potential environmental health risks from the OLBM to maintain a level of transparency and oversight for related risk-assessment activities (83). These efforts equipped community members with knowledge of the environmental situation and established a level of transparency that fostered trust and accountability during the risk assessment process.
3.2.3 Include characterization of cumulative impacts and stressors
Understanding the impacts of environmental stressors on communities is vital when assessing environmental vulnerability. However, focusing on individual stressors does not adequately portray the myriad of environmental hazards impacting a community. To investigate multiple stressors, many tools combine several indicators of EJ/EH risk to characterize cumulative impacts for targeted communities. However, several problems can arise regarding these metrics. First, general weighting schemes are used for measured indicators. Second, a reference baseline is often not included, making it impossible to compare metrics in other areas to gauge how well an area is performing regarding EJ/EH risk. Many EJ/EH screening tools, including CalEnviroScreen, Colorado EnviroScreen, and MiEJScreen, screen for and characterize hazards in relation to cumulative impacts. Monitored indicators are grouped into components that are weighted based on their importance to cumulative risk. To generate component scores, the product of component weights and indicators is calculated, and the components weights and indicators are summed to calculate the total EJ score. Standard weighting schemes and indicator components are generally incorporated across EJ/EH screening tools. In other words, for all EJ/EH screening tools, the component weights are the same across the entire monitored and screened area. This means that for communities disproportionately exposed to components that are weighted as less significant, many EJ/EH screening tools cannot fully characterize the hazards affecting specific communities.
Further, in many EJ/EH screening tools, comparisons of communities are based on a normalized percentile ranking of scores to gauge how burdened a community is. That is, the extent in which a community is burdened compared to another community is based strictly on percentile-score rankings for the range of scores in an area. EJ scores are not compared to a benchmark reference baseline for health guidance values, minimum contaminant levels, or available regulatory standards to fully gauge the integrity of a community's environmental health.
3.2.4 Localized EJ/EH vs. broad screening approaches
Targeted development and screening focused on fine-scale, localized centers of burden are important for elucidating disparities across factors and indicators within a population (84–89). There is value in evaluating distinct environmental health disparities across a given population, especially when focusing on the effects of air and water quality that vary on local scales.
Despite improvements in air-quality monitoring in the United States, the EPA determined in 2021 that over 102 million people across the country live in counties with pollution levels that are consistently above primary NAAQS (90). Furthermore, urban areas have shown to have worse air quality compared to more rural areas (91). The population segments that reside in proximity to industrial sites, landfills, waste treatment plants, highways, and other primary polluters are disproportionately impacted by environmental stressors. Disparities in air quality, such as PM 2.5, transcend geographic boundaries and demographics, including race/ethnicity and socioeconomic status (88). Further, exposure disparities are directly associated with other health disparity-related issues (92, 93). The EPA's 2019 America's Children and Environment (ACE) report determined that children from families that were below the poverty-level were disproportionately more affected by respiratory diseases compared to children from families above the poverty level, and that lower-income families and Black non-Hispanic and “All Other race Children” were also disproportionately more affected by respiratory diseases compared to Hispanic, White non-Hispanic, and Asian non-Hispanic children, especially asthma (94, 95).
Another area in which localized approaches are important to consider is drinking water quality. WASH standards across the United States have improved since the Safe Drinking Water Act (SDWA) and Clean Water Act (CWA) were enacted in 1974 and 1977, respectively. However, infrastructure that supports access to clean drinking water and wastewater services is lacking in parts of the country. A 2021 study found that 2.44% of water management services were underperforming and habitually did not meet SDWA and CWA water quality standards (96). The EPA's 2019 ACE report indicated that 6% of community drinking water systems do not meet all health standards (94). Infamous water crises such as those in Washington D.C., Newark, NJ, Flint, MI, and Jackson MS, have underlined the issues surrounding water quality management at the local level (5, 97–99). Preventative measures are key to enhance water quality management services and increase accountability and transparency. Many water quality crises have occurred in metropolitan areas with populations over 100,000, often due to city-level issues at water treatment agencies. If such problems persist, this could exacerbate problems in the 13% of the U.S. population serviced by non-public water systems (i.e., private well water) and water management agencies of small municipalities. Most EJ/EH screening tools do not include indicators that monitor non-public water systems. Of the EJ/EH screening tools included in this survey, NC ENVIROSCAN is the only one that incorporates private well-water data as a tracked indicator.
Highlighting gaps in coverage and disproportionately impacted communities affected by environmental stressors does not invalidate the regulatory progress made in recent decades or negate the value of current EJ/EH screening tools in tracking available environmental health indicators. However, including indicators that address the often-overlooked segments of populations would ensure thorough and robust monitoring of the cumulative impacts of EJ/EH stressors.
3.2.5 Leveraging locally sourced data
Collecting local environmental health data that accurately represents monitored communities and involving community stakeholders in the EJ/EH screening tool development process promotes community buy-in. EJ/EH screening tool developers should prioritize composability of data sources and streams to allow for more accurate and timely results. As mentioned in Section 3.1.4, common limitations of EJ/EH screening tools (with the exception of EnviroAtlas) include the use of outdated data to characterize burden and EJ risk and the lack of capability of most EJ/EH screening tools for users to update or upload their own data for general analysis and mapping purposes. Using data collected several years or even months prior can limit analysis as the data may not accurately represent the current conditions in a community. This can lead to inaccurate conclusions and weaken support for measures to manage community burdens. Further, the lack of functionality in most EJ/EH screening tools for users to upload their own data may limit potentially insightful analyses that could be useful in addition to the EJ/EH screening tool's available datasets. Using distinct data to compare communities, assessing the relevance of the broader monitoring data with users’ fine-scale data, or comparative analyses of EJ data, human health outcomes, and disease incidence and prevalence rates are functionalities lacking in most current EJ/EH screening tools.
4 Conclusions
The development of EJ/EH screening tools over the past 15 years has raised much needed awareness of the environmental justice and health disparities impacting global health and has enabled progress toward addressing its substantial and often disproportionate impacts. Collaborations involving researchers, risk assessors, public health officials, and community stakeholders have aided the development of EJ/EH screening tools and improved their functionality. Integration across multiple ecosystem and environmental health domains have improved understanding of the cumulative impacts of indicators and their relationships with population health outcomes. However, most of the EJ/EH screening tools discussed in this manuscript lack sufficient stressor specificity in relation to community impacts and do not include HBGVs for individual stressors and instead rely on percentile-based thresholds. The recommendations made in this manuscript are intended to enhance current EJ/EH screening tools so they can address community concerns at a finer scale. Improving the accessibility of EJ/EH health metrics and broadening their userbase by fostering community involvement in EJ/EH screening tool development will help ensure that the most relevant and unique stressors impacting communities are identified and prioritized in mitigation efforts.
While we do not specifically address climate change, it is well-recognized that the changing climate will bring new environmental health and justice challenges. EJ/EH platforms and screening tools including the CDC's Heat and Health Tracker (100), Cal-Adapt (101), The Climate Explorer (102), RVAgreen 2050 Climate Equity Index (103), CDC's National Environmental Public Health Tracking Network (104), National Risk Index (105), Neighborhoods at Risk (106), and Climate Mapping for Resilience and Adaptation (107) provide users monitoring data on the risk factors and vulnerabilities associated with climate change at varying population and geographic levels. Climate shifts could compound existing issues for a given area. Moreover, the effects will be difficult to predict without current (and, ideally, historical) data as inputs for predictive models. As institutions steadily strive toward consistent environmental and public health monitoring, machine learning techniques are being applied in environmental health and climate modeling. Efforts to improve data harmonization and standardization will improve forecast modeling, which can help predict the impacts of stressors. Thus, potential impacts from climate change present yet another impetus for creating EJ/EH screening tools so that communities can be empowered to plan for future needs.
Overall, EJ/EH screening tools are effective for characterizing, identifying, and screening for the cumulative impacts of a diverse range of stressors. As EJ/EH screening tool development advances, incorporating threshold values centered on established stressor safety levels can improve quantification of the effects of stressors on communities. Further, focusing on specific stressors driving changes in individual communities vs. tracking a general set of stressors can help identify unique stressors disproportionately impacting communities and improve efforts to establish meaningful change.
Author contributions
NO: Conceptualization, Formal Analysis, Investigation, Visualization, Writing – original draft, Writing – review & editing. AM-R: Supervision, Writing – review & editing, Validation. DR: Writing – review & editing, Funding acquisition, Supervision.
Funding
The author(s) declare financial support was received for the research, authorship, and/or publication of this article. This work was funded by grants from the SRP Center for Environmental and Human Effects of PFAS (P42 ES031009) and intramural funds from the National Institute of Environmental Health Sciences (ZIA ES103385). The views expressed in this manuscript do not reflect those of the funding agencies.
Acknowledgments
We would like to thank the SRP Grant P42 ES031009 Center for Environmental and Human Effects of PFAS, Bioinformatics Research Center, and the National Institute of Environmental Health Sciences (Z ES103385) for the funding and support of this manuscript.
Conflict of interest
The authors declare that the research was conducted in the absence of any commercial or financial relationships that could be construed as a potential conflict of interest.
Publisher's note
All claims expressed in this article are solely those of the authors and do not necessarily represent those of their affiliated organizations, or those of the publisher, the editors and the reviewers. Any product that may be evaluated in this article, or claim that may be made by its manufacturer, is not guaranteed or endorsed by the publisher.
References
1. Prüss-Üstün A, Wolf J, Corvalán CF, Bos R, Neira MP. Preventing Disease Through Healthy Environments: A Global Assessment of the Burden of Disease from Environmental Risks. Geneva: World Health Organization (2016). p. 147. Available online at: https://iris.who.int/handle/10665/204585 (cited December 27, 2023).
2. Renwick DV, Heinrich A, Weisman R, Arvanaghi H, Rotert K. Potential public health impacts of deteriorating distribution system infrastructure. J - Am Water Works Assoc. (2019) 111(2):42–53. doi: 10.1002/awwa.1235
3. Marshall JD, Brauer M, Frank LD. Healthy neighborhoods: walkability and air pollution. Environ Health Perspect. (2009) 117(11):1752–9. doi: 10.1289/ehp.0900595
4. Energy.gov. Environmental Justice History. Available online at: https://www.energy.gov/lm/environmental-justice-history (cited December 27, 2023).
5. Felton R. Flint’s water crisis: what went wrong. The Guardian. (2016). Available online at: https://www.theguardian.com/environment/2016/jan/16/flints-water-crisis-what-went-wrong (cited December 27, 2023).
6. Fowlkes MR, Miller PY. Chemicals and community at love canal. In: Johnson BB, Covello VT, editors. The Social and Cultural Construction of Risk: Essays on Risk Selection and Perception. Dordrecht: Springer Netherlands (1987). p. 55–78. (Technology, Risk, and Society). doi: 10.1007/978-94-009-3395-8_3
7. Gibbens S. Science. Toxic ‘forever chemicals’ flow freely through Cape Fear River—and now its fish. (2020). Available online at: https://www.nationalgeographic.com/science/article/toxic-chemical-pfas-found-in-north-carolina-striped-bass (cited December 27, 2023).
8. Braveman P. What are health disparities and health equity? We need to be clear. Public Health Rep. (2014) 129(Suppl 2):5–8. doi: 10.1177/00333549141291S203
9. Centers for Disease Control and Prevention, Agency for Toxic Substances and Disease Registry, Environmental Justice Index Fact Sheet. Centers of Disease Control and Prevention (CDC); Available online at: https://www.atsdr.cdc.gov/placeandhealth/eji/docs/eji_fact_sheet.pdf (cited March 6, 2024).
10. August L, Bangia K, Plummer L, Prasad S, Ranjbar K, Slocombe A, et al. CalEnviroScreen 4.0. Office of Environmental Health Hazard Assessment; California Environmental Protection Agency. (2021). Available online at: https://oehha.ca.gov/media/downloads/calenviroscreen/report/calenviroscreen40reportf2021.pdf (cited November 14, 2023).
11. Office of Environmental Justice Public Advocate, Interagency Environmental Justice Response Team. MiEJScreen Draft Technical Report. Michigan Department of Environment, Great Lakes, and Energy (2022).
12. Colorado EnviroScreen tool team. Colorado EnviroScreen tool technical document. Available online at: https://drive.google.com/file/d/1aXfZiJtv2-6lfSQeQYfMupIICEXwidiC/view?usp=embed_facebook (cited December 21, 2023).
13. Wolf MJ, Emerson JW, Esty DC, de Sherbinin A, Wendling ZA, Mangalmurti D, et al. Environmental Performance Index 2022. New Haven, CT: Yale Center for Environmental Law & Policy (2022). Available online at: https://epi.yale.edu/downloads/epi2022report06062022.pdf (cited March 6, 2024).
14. U.S. Environmental Protection Agency (EPA). EJScreen Technical Documentation. (2023). Available online at: https://www.epa.gov/system/files/documents/2023-06/ejscreen-tech-doc-version-2-2.pdf (cited November 14, 2023).
15. Van Horne YO, Alcala CS, Peltier RE, Quintana PJE, Seto E, Gonzales M, et al. An applied environmental justice framework for exposure science. J Expo Sci Environ Epidemiol. (2023) 33(1):1–11. doi: 10.1038/s41370-022-00422-z
16. Kato-Huerta J, Geneletti D. A distributive environmental justice index to support green space planning in cities. Landsc Urban Plan. (2023) 229:104592. doi: 10.1016/j.landurbplan.2022.104592
17. Yale Center for Environmental Law & Policy, Center for International Earth Science Information Network Earth Institute, Columbia University. Environmental Performance Index (EPI). New Haven, CT: Yale Center for Environmental Law & Policy (2022). Available online at: https://epi.yale.edu/ (cited March 6, 2024).
18. The Legatum Prosperity Index (2023) by the Legatum Institute: Legatum Prosperity Index. (2023). Available online at: https://www.prosperity.com/ (cited July 7, 2024).
19. US EPA O. EnviroAtlas. (2015). Available online at: https://www.epa.gov/enviroatlas (cited March 6, 2024).
20. US EPA O. EJScreen: Environmental Justice Screening and Mapping Tool. (2014). Available online at: https://www.epa.gov/ejscreen (cited March 6, 2024).
21. Council on Environmental Quality. Climate & Economic Justice Screening Tool (CEJST). Available online at: https://screeningtool.geoplatform.gov/en/#3/33.47/-97.5 (cited March 6, 2024)
22. CDC, Centers for Disease Control and Prevention. CDC Environmental Justice Index (EJI). 2023. Available online at: https://www.atsdr.cdc.gov/placeandhealth/eji/index.html (cited March 6, 2024)
23. Federal Register. Tackling the Climate Crisis at Home and Abroad. (2021). Available online at: https://www.federalregister.gov/documents/2021/02/01/2021-02177/tackling-the-climate-crisis-at-home-and-abroad (cited December 21, 2023).
24. Sadd JL, Pastor M, Morello-Frosch R, Scoggins J, Jesdale B. Playing it safe: assessing cumulative impact and social vulnerability through an environmental justice screening method in the South Coast Air Basin, California. Int J Environ Res Public Health. (2011) 8(5):1441–59. doi: 10.3390/ijerph8051441
25. NC ENVIROSCAN. Available online at: https://enviroscan.org/(cited March 1, 2024).
26. Committee on Decision Making Under Uncertainty, Board on Population Health and Public Health Practice, Institute of Medicine. Risk assessment and uncertainty. In: Environmental Decisions in the Face of Uncertainty. US: National Academies Press (2013). p. 52–71. Available online at: https://www.ncbi.nlm.nih.gov/books/NBK200844/(cited December 21, 2023).
27. Mathers CD, Salomon JA, Ezzati M, Begg S, Hoorn SV, Lopez AD. Sensitivity and uncertainty analyses for burden of disease and risk factor estimates. In: Lopez AD, Mathers CD, Ezzati M, Jamison DT, Murray CJ, editors. Global Burden of Disease and Risk Factors. Washington (DC): The International Bank for Reconstruction and Development/The World Bank (2006). p. 399–426. Available online at: http://www.ncbi.nlm.nih.gov/books/NBK11802/ (cited December 21, 2023).
28. Fischhoff B, Davis AL. Communicating scientific uncertainty. Proc Natl Acad Sci U S A. (2014) 111(Suppl 4):13664–71. doi: 10.1073/pnas.1317504111
29. US EPA O. Limitations and Caveats in Using EJScreen. (2014). Available online at: https://www.epa.gov/ejscreen/limitations-and-caveats-using-ejscreen (cited December 21, 2023).
30. Salgado M, Vieira ACL, Torres A, Oliveira MD. Selecting indicators to monitor and assess environmental health in a Portuguese urban setting: a participatory approach. Int J Environ Res Public Health. (2020) 17(22):8597. doi: 10.3390/ijerph17228597
31. Danielsen F, Enghoff M, Poulsen MK, Funder M, Jensen PM, Burgess ND. The concept, practice, application, and results of locally based monitoring of the environment. BioScience. (2021) 71(5):484–502. doi: 10.1093/biosci/biab021
32. Edwards M, Triantafyllidou S, Best D. Elevated blood lead in young children due to lead-contaminated drinking water: Washington, DC, 2001–2004. Environ Sci Technol. (2009) 43(5):1618–23. doi: 10.1021/es802789w
33. Masten SJ, Davies SH, Mcelmurry SP. Flint water crisis: what happened and why? J - Am Water Works Assoc. (2016) 108(12):22–34. doi: 10.5942/jawwa.2016.108.0195
34. Lopez PD. Letter August 9, 2019 from Peter D. Lopez to Hon. Catherine McCabe Commissioner NJ DEP and Hon. Ras Baraka, Mayor, Newark NJ. New York, NY: United States Environmental Protection Agency (2019). Available online at: https://www.epa.gov/sites/default/files/2019-08/documents/r2letteraugust092019.pdf (cited December 21, 2023).
35. Neuman S. Burst pipes in Jackson, Mississippi, are just the latest of the city’s water woes. NPR. (2022). Available online at: https://www.npr.org/2022/12/31/1145966097/water-problems-jackson-mississippi-explanation (cited December 21, 2023).
36. Portnoy J. Aging Infrastructure to Blame for E. coli bacteria in Baltimore Water. Washington DC: Washington Post (2022). Available online at: https://www.washingtonpost.com/dc-md-va/2022/09/30/baltimore-water-ecoli-infrastructure/(cited December 21, 2023).
37. Leyden L. In Echo of Flint, Mich., Water Crisis now Hits Newark. New York, NY: The New York Times (2018). Available online at: https://www.nytimes.com/2018/10/30/nyregion/newark-lead-water-pipes.html (cited December 21, 2023).
38. Kiaghadi A, Rifai HS, Dawson CN. The presence of superfund sites as a determinant of life expectancy in the United States. Nat Commun. (2021) 12(1):1947. doi: 10.1038/s41467-021-22249-2
39. Stone R, Webber WB. Male–female differences in the prevalence of non-hodgkin lymphoma and residential proximity to superfund sites in Kentucky. J Environ Health. (2018) 81(3):16–25. Available online at: https://digitalcommons.wcupa.edu/hea_facpub/15
40. Stephens C, Kim Y-i, Ramachandran R, Baskin ML, Antony V, Bae S. Disparities in healthcare utilization: superfund site vs. Neighboring comparison site. Int J Environ Res Public Health. (2022) 19(15):9271. doi: 10.3390/ijerph19159271
41. Tran KV, Casey JA, Cushing LJ, Morello-Frosch R. Residential proximity to oil and gas development and birth outcomes in California: a retrospective cohort study of 2006–2015 births. Environ Health Perspect. (2020) 128(6):067001. doi: 10.1289/EHP5842
42. Casey JA, Savitz DA, Rasmussen SG, Ogburn EL, Pollak J, Mercer DG, et al. Unconventional natural gas development and birth outcomes in Pennsylvania, USA. Epidemiol Camb Mass. (2016) 27(2):163–72. doi: 10.1097/EDE.0000000000000387
43. Willis MD, Carozza SE, Hystad P. Congenital anomalies associated with oil and gas development and resource extraction: a population-based retrospective cohort study in Texas. J Expo Sci Environ Epidemiol. (2023) 33(1):84–93. doi: 10.1038/s41370-022-00505-x
44. McKenzie LM, Guo R, Witter RZ, Savitz DA, Newman LS, Adgate JL. Birth outcomes and maternal residential proximity to natural gas development in Rural Colorado. Environ Health Perspect. (2014) 122(4):412–7. doi: 10.1289/ehp.1306722
45. Bauman A, Goemans C, Pritchett J, McFadden DT. Estimating the economic and social impacts from the drought in Southern Colorado. J Contemp Water Res Educ. (2013) 151(1):61–9. doi: 10.1111/j.1936-704X.2013.03152.x
46. Sui DZ. Tobler’s first law of geography: a big idea for a small world? Ann Assoc Am Geogr. (2004) 94(2):269–77. doi: 10.1111/j.1467-8306.2004.09402003.x
47. Lane HM, Morello-Frosch R, Marshall JD, Apte JS. Historical redlining is associated with present-day air pollution disparities in U. S. Cities. Environ Sci Technol Lett. (2022) 9(4):345–50. doi: 10.1021/acs.estlett.1c01012
48. Chakraborty J, Collins TW, Grineski SE, Aun JJ. Air pollution exposure disparities in US public housing developments. Sci Rep. (2022) 12(1):9887. doi: 10.1038/s41598-022-13942-3
49. Ortega-García JA, López-Hernández FA, Cárceles-Álvarez A, Fuster-Soler JL, Sotomayor DI, Ramis R. Childhood cancer in small geographical areas and proximity to air-polluting industries. Environ Res. (2017) 156:63–73. doi: 10.1016/j.envres.2017.03.009
50. Sayyed TK, Ovienmhada U, Kashani M, Vohra K, Kerr GH, O’Donnell C, et al. Satellite data for environmental justice: a scoping review of the literature in the United States. Environ Res Lett. (2024) 19(3):033001. doi: 10.1088/1748-9326/ad1fa4
51. Weigand M, Wurm M, Dech S, Taubenböck H. Remote sensing in environmental justice research—a review. ISPRS Int J Geo-Inf. (2019) 8(1):20. doi: 10.3390/ijgi8010020
52. Chakraborty J, Maantay JA, Brender JD. Disproportionate proximity to environmental health hazards: methods, models, and measurement. Am J Public Health. (2011) 101(Suppl 1):S27–36. doi: 10.2105/AJPH.2010.300109
53. Distance analysis—ArcGIS Pro | Documentation. Available online at: https://pro.arcgis.com/en/pro-app/latest/tool-reference/spatial-analyst/distance-analysis.htm (cited December 27, 2023).
54. Chakraborty J, Armstrong MP. Using geographic plume analysis to assess community vulnerability to hazardous accidents. Comput Environ Urban Syst. (1995) 19(5):341–56. doi: 10.1016/0198-9715(95)00018-6
55. California S of. Department of Toxic Substances Control. Permitted Facilities on CalEnviroScreen. Available online at: https://dtsc.ca.gov/permitted-facilities-on-calenviroscreen/(cited December 27, 2023).
56. Monserrat L, OEHHA. SB 535 Disadvantaged Communities. (2015). Available online at: https://oehha.ca.gov/calenviroscreen/sb535 (cited December 27, 2023).
57. US EPA O. How Does EPA Use EJScreen? (2014). Available online at: https://www.epa.gov/ejscreen/how-does-epa-use-ejscreen (cited December 27, 2023).
58. Frndak S, Yan F, Edelson M, Immergluck LC, Kordas K, Idris MY, et al. Predicting low-level childhood lead exposure in Metro Atlanta using ensemble machine learning of high-resolution raster cells. Int J Environ Res Public Health. (2023) 20(5):4477. doi: 10.3390/ijerph20054477
59. Gharibvand L, Shavlik D, Ghamsary M, Beeson WL, Soret S, Knutsen R, et al. The association between ambient fine particulate air pollution and lung cancer incidence: results from the AHSMOG-2 study. Environ Health Perspect. (2017) 125(3):378–84. doi: 10.1289/EHP124
60. Lenton TM, Abrams JF, Bartsch A, Bathiany S, Boulton CA, Buxton JE, et al. Remotely sensing potential climate change tipping points across scales. Nat Commun. (2024) 15(1):343. doi: 10.1038/s41467-023-44609-w
61. Jerrett M, Gale S, Kontgis C. Spatial modeling in environmental and public health research. Int J Environ Res Public Health. (2010) 7(4):1302–29. doi: 10.3390/ijerph7041302
62. Chapman DV, Sullivan T. The role of water quality monitoring in the sustainable use of ambient waters. One Earth. (2022) 5(2):132–7. doi: 10.1016/j.oneear.2022.01.008
63. Colston JM, Ahmed T, Mahopo C, Kang G, Kosek M, de Sousa Junior F, et al. Evaluating meteorological data from weather stations, and from satellites and global models for a multi-site epidemiological study. Environ Res. (2018) 165:91–109. doi: 10.1016/j.envres.2018.02.027
64. Yu J, Song CH, Lee D, Lee S, Kim HS, Han KM, et al. Synergistic combination of information from ground observations, geostationary satellite, and air quality modeling towards improved PM2.5 predictability. Npj Clim Atmospheric Sci. (2023) 6(1):1–9. doi: 10.1038/s41612-023-00330-5
65. Mach KJ, Salas Reyes R, Pentz B, Taylor J, Costa CA, Cruz SG, et al. News media coverage of COVID-19 public health and policy information. Humanit Soc Sci Commun. (2021) 8(1):1–11. doi: 10.1057/s41599-020-00684-8
66. Johnson SB, Parsons M, Dorff T, Moran MS, Ward JH, Cohen SA, et al. Cancer misinformation and harmful information on Facebook and other social Media: a brief report. JNCI J Natl Cancer Inst. (2021) 114(7):1036–9. doi: 10.1093/jnci/djab141
67. Campbell C, Greenberg R, Mankikar D, Ross RD. A case study of environmental injustice: the failure in flint. Int J Environ Res Public Health. (2016) 13(10):951. doi: 10.3390/ijerph13100951
68. Fleary SA, Ettienne R. Social disparities in health literacy in the United States. Health Lit Res Pract. (2019) 3(1):e47–52. doi: 10.3928/24748307-20190131-01
69. Seibert RG, Winter MR, Cabral HJ, Wolf MS, Curtis LM, Paasche-Orlow MK. Health literacy and income mediate racial/ethnic asthma disparities. Health Lit Res Pract. (2019) 3(1):e9–18. doi: 10.3928/24748307-20181113-01
70. Binder AR, May K, Murphy J, Gross A, Carlsten E. Environmental health literacy as knowing, feeling, and believing: analyzing linkages between race, ethnicity, and socioeconomic Status and willingness to engage in protective behaviors against health threats. Int J Environ Res Public Health. (2022) 19(5):2701. doi: 10.3390/ijerph19052701
71. Schillinger D. Social determinants, health literacy, and disparities: intersections and controversies. HLRP Health Lit Res Pract. (2021) 5(3):e234–43. doi: 10.3928/24748307-20210712-01
72. Ramirez-Andreotta MD, Brody JG, Lothrop N, Loh M, Beamer PI, Brown P. Improving environmental health literacy and justice through environmental exposure results communication. Int J Environ Res Public Health. (2016) 13(7):690. doi: 10.3390/ijerph13070690
73. Han HR, Xu A, Mendez KJW, Okoye S, Cudjoe J, Bahouth M, et al. Exploring community engaged research experiences and preferences: a multi-level qualitative investigation. Res Involv Engagem. (2021) 7(1):19. doi: 10.1186/s40900-021-00261-6
74. Rosas LG, Rodriguez Espinosa P, Montes Jimenez F, King AC. The role of citizen science in promoting health equity. Annu Rev Public Health. (2022) 43(1):215–34. doi: 10.1146/annurev-publhealth-090419-102856
75. Payne-Sturges DC, Korfmacher KS, Cory-Slechta DA, Jimenez M, Symanski E, Carr Shmool JL, et al. Engaging communities in research on cumulative risk and social stress-environment interactions: lessons learned from EPA’s STAR program. Environ Justice Print. (2015) 8(6):203–12. doi: 10.1089/env.2015.0025
76. Ashbolt NJ. Microbial contamination of drinking water and disease outcomes in developing regions. Toxicology. (2004) 198(1–3):229–38. doi: 10.1016/j.tox.2004.01.030
77. Cabral JPS. Water Microbiology. Bacterial pathogens and water. Int J Environ Res Public Health. (2010) 7(10):3657–703. doi: 10.3390/ijerph7103657
78. Rehman K, Fatima F, Waheed I, Akash MSH. Prevalence of exposure of heavy metals and their impact on health consequences. J Cell Biochem. (2018) 119(1):157–84. doi: 10.1002/jcb.26234
79. Arcipowski E, Schwartz J, Davenport L, Hayes M, Nolan T. Clean water, clean life: promoting healthier, accessible water in rural appalachia. J Contemp Water Res Educ. (2017) 161(1):1–18. doi: 10.1111/j.1936-704X.2017.3248.x
80. SCLA-PUSH. ArcGIS StoryMaps. South Central Los Angeles Air Quality Academy. (2021). Available online at: https://storymaps.arcgis.com/stories/078793e745364ebc9f027f22471015e4 (cited December 27, 2023)
81. Baltzell K, Harvard K, Hanley M, Gosling R, Chen I. What is community engagement and how can it drive malaria elimination? Case studies and stakeholder interviews. Malar J. (2019) 18(1):245. doi: 10.1186/s12936-019-2878-8
82. Min E, Gruen D, Banerjee D, Echeverria T, Freelander L, Schmeltz M, et al. The Washington State Environmental Health disparities map: development of a community-responsive cumulative impacts assessment tool. Int J Environ Res Public Health. (2019) 16(22):4470. doi: 10.3390/ijerph16224470
83. Office of Emergency and Remedial Response, EPA Regional risk assessors. Risk Assessment Guidance for Superfund: Volume 1—human Health Evaluation Manual Supplement to Part A: Community Involvement in Superfund Risk Assessments. Washington DC: United States Environmental Protection Agency (EPA) (1999). Available online at: https://www.epa.gov/sites/default/files/2015-09/documents/ci_ra_supp.pdf (cited December 27, 2023).
84. Local- and regional-scale racial and ethnic disparities in air pollution determined by long-term mobile monitoring | PNAS. Available online at: https://www.pnas.org/doi/10.1073/pnas.2109249118 (cited December 21, 2023).
85. Stillo F, MacDonald Gibson J. Exposure to contaminated drinking water and health disparities in North Carolina. Am J Public Health. (2017) 107(1):180–5. doi: 10.2105/AJPH.2016.303482
86. Wang Y, Apte JS, Hill JD, Ivey CE, Patterson RF, Robinson AL, et al. Location-specific strategies for eliminating US national racial-ethnic PM2.5 exposure inequality. Proc Natl Acad Sci. (2022) 119(44):e2205548119. doi: 10.1073/pnas.2205548119
87. Liu J, Clark LP, Bechle MJ, Hajat A, Kim SY, Robinson AL, et al. Disparities in air pollution exposure in the United States by race/ethnicity and income, 1990–2010. Environ Health Perspect. (2021) 129(12):127005. doi: 10.1289/EHP8584
88. Chemical & Engineering News. A local look at air pollution highlights inequalities within cities. Available online at: https://cen.acs.org/environment/pollution/local-air-quality-monitoring-inequalities/99/i23 (cited December 21, 2023).
89. Maantay J. Mapping environmental injustices: pitfalls and potential of geographic information systems in assessing environmental health and equity. Environ Health Perspect. (2002) 110(Suppl 2):161–71. doi: 10.1289/ehp.02110s2161
90. US EPA O. Air Quality—National Summary. (2016). Available online at: https://www.epa.gov/air-trends/air-quality-national-summary (cited December 21, 2023).
91. Strosnider H, Kennedy C, Monti M, Yip F. Rural and urban differences in air quality, 2008–2012, and community drinking water quality, 2010–2015 — united States. MMWR Surveill Summ. (2017) 66(13):1–10. doi: 10.15585/mmwr.ss6613a1
92. Tessum CW, Paolella DA, Chambliss SE, Apte JS, Hill JD, Marshall JD. PM2.5 Polluters disproportionately and systemically affect people of color in the United States. Sci Adv. (2021) 7(18):eabf4491. doi: 10.1126/sciadv.abf4491
93. O’Lenick CR, Winquist A, Mulholland JA, Friberg MD, Chang HH, Kramer MR, et al. Assessment of neighbourhood-level socioeconomic status as a modifier of air pollution–asthma associations among children in Atlanta. J Epidemiol Community Health. (2017) 71(2):129–36. doi: 10.1136/jech-2015-206530
94. US EPA, Children’s Health Protection Advisory Committee. USEPA: America’s Children and the Environment. Washington DC: United States Environmental Protection Agency (2019). Available online at: https://www.epa.gov/sites/default/files/2019-10/documents/ace2019-v17s.pdf (cited December 21, 2023).
95. US EPA, Children’s Health Protection Advisory Committee. Respiratory Diseases. Washington DC: United States Environmental Protection Agency (2019). (America’s Children and the Environment | Third Edition). Available online at: https://www.epa.gov/system/files/documents/2022-04/ace3-respiratory-updates.pdf (cited March 1, 2024).
96. Mueller JT, Gasteyer S. The widespread and unjust drinking water and clean water crisis in the United States. Nat Commun. (2021) 12(1):3544. doi: 10.1038/s41467-021-23898-z
97. Nakamura D. Water in D.C. Exceeds EPA Lead Limit. Washington DC: Washington Post (2004). Available online at: https://www.washingtonpost.com/archive/politics/2004/01/31/water-in-dc-exceeds-epa-lead-limit/1e54ff9b-a393-4f0a-a2dd-7e8ceedd1e91/ (cited December 27, 2023).
98. Corasaniti N, Kilgannon C, Schwartz J. Lead Crisis in Newark Grows, as Bottled Water Distribution is Bungled. New York, NY: The New York Times (2019). Available online at: https://www.nytimes.com/2019/08/14/nyregion/newark-water-lead.html (cited December 27, 2023).
99. Fowler S. A Water System So Broken That One Pipe Leaks 5 Million Gallons a Day. New York, NY: The New York Times (2023). Available online at: https://www.nytimes.com/2023/03/22/us/jackson-mississippi-water-crisis.html (cited December 27, 2023).
100. Heat & Health Tracker | Tracking | NCEH | CDC. Available online at: https://ephtracking.cdc.gov/Applications/heatTracker (cited February 29, 2024).
101. Cal-Adapt. Available online at: https://cal-adapt.org/(cited February 29, 2024).
102. Climate Explorer. Available online at: https://crt-climate-explorer.nemac.org/(cited February 29, 2024).
103. Climate Equity Index [Internet]. (cited 2024 February 29). Available online at: https://cor.maps.arcgis.com/apps/webappviewer/index.html?id=e4d732f225fe457d83df11fe9bf71daf (cited February 29, 2024).
104. National Environmental Public Health Tracking Network. Available online at: https://ephtracking.cdc.gov (cited February 29, 2024).
105. Map | National Risk Index. Available online at: https://hazards.fema.gov/nri/map (cited February 29, 2024).
106. Neighborhoods at Risk. Available online at: https://nar.headwaterseconomics.org/37000/explore/map (cited February 29, 2024).
107. Climate Mapping for Resilience and Adaptation. Available online at: https://resilience.climate.gov/(cited February 29, 2024).
Appendix
ACE: America’s Children and Environment report
CalEnviroScreen: California Environmental Justice Mapping and Screening Tool
CDC: Centers for Disease Control
CDC’s EJI: Centers for Disease Control’s Environmental Justice Index
CEJST: Climate and Environmental Justice Screening Tool
CIESIN: Center for International Earth Science Information Network
Colorado (CO) EnviroScreen: Colorado Environmental Justice Mapping and Screening Tool
CWA: Clean Water Act
DALYs: disability-adjusted life years
EH: Environmental Health
EIF: Environmental Integrity Framework
EJ: Environmental Justice
EJ/EH screening tool: Environmental Justice/Environmental Health screening tool
EJScreen: United States Environmental Protection Agency’s Environmental Justice Mapping and Screening Tool
EnviroAtlas: Environmental Analytical Tools Interface for Landscape Assessments GIS Toolbox
Environmental Health Burdens/Vulnerability: any single or combination of stressors (e.g., environmental and/or socioeconomic) that increase the likelihood of adverse public health effects, hazards, and potential risk to exposed communities.
Environmental Health Stressors: Any aspect of environmental or public health (i.e., social determinants, pollutants, exposure to toxicants and contaminants) that adversely affect populations.
EPA: Environmental Protection Agency
Geographic levels: scales of geographic areas (i.e., state, county, city, zip code, census tract, census block group)
GIS: Geographic Information System
Human Health-based Guidance Values/Reference Baseline Values: maximum exposure to a substance that will likely not result in an adverse harmful health risk.
Indicators: Any metric or measurement used to characterize an aspect of environmental or public health.
IPCP: Interprofessional Collaborative Practice
LPI: Legatum Prosperity Index
MCL: Maximum Contaminant Level concentration level of chemical/toxicants (dose-response) that is safe for humans/animal-model can be exposed to without deleterious effects
MiEJScreen: Michigan Environmental Justice Mapping and Screening Tool
NAAQS: National Ambient Air Quality Standards
NC ENVIROSCAN: North Carolina Environmental Justice Mapping and Screening Tool
OLBM: Old Lead Belt Mining
PFAS: per- and polyfluoroalkyl substances
SCLA-PUSH: South Central LA Project to Understand the Sources and Health Impacts of Local Air Pollution
SDWA: Safe Drinking Water Act
UN SDGs: United Nations Sustainable Development Goals
UN: United Nations
WASH: Water and Sanitation, Hygiene
WHO: World Health Organization
Yale EPI: Yale Environmental Performance Index
Keywords: environmental health, environmental justice (EJ), cumulative impacts, social determinants of health, citizen science (CS)
Citation: Osakwe NC, Motsinger-Reif AA and Reif DM (2024) Environmental health and justice screening tools: a critical examination and path forward. Front. Environ. Health 3:1427495. doi: 10.3389/fenvh.2024.1427495
Received: 3 May 2024; Accepted: 13 August 2024;
Published: 12 September 2024.
Edited by:
Rakesh Kumar, Auburn University, United StatesReviewed by:
Pawan Kumar Rose, Chaudhary Devi Lal University, IndiaSandhya Maurya, Shri Ramswaroop Memorial University, India
Jyoti Kushawaha, University of Delhi, India
Copyright: © 2024 Osakwe, Motsinger-Reif and Reif. This is an open-access article distributed under the terms of the Creative Commons Attribution License (CC BY). The use, distribution or reproduction in other forums is permitted, provided the original author(s) and the copyright owner(s) are credited and that the original publication in this journal is cited, in accordance with accepted academic practice. No use, distribution or reproduction is permitted which does not comply with these terms.
*Correspondence: David M. Reif, ZGF2aWQucmVpZkBuaWguZ292