 Alexa Irvin
 Daniel J. Dutton1
 Susan Kirkland
 Daniel G. Rainham
95% of researchers rate our articles as excellent or good
Learn more about the work of our research integrity team to safeguard the quality of each article we publish.
Find out more
ORIGINAL RESEARCH article
Front. Environ. Health , 10 September 2024
Sec. Environmental Epidemiology
Volume 3 - 2024 | https://doi.org/10.3389/fenvh.2024.1407646
This article is part of the Research Topic Insights in Environmental Health: 2023 View all 5 articles
Introduction: Greenness is considered to be a health-promoting feature of both natural and built environments and has the potential to influence mental health outcomes. However, most studies to date have neglected to address whether greenness differentially affects mental health outcomes for individuals across the socioeconomic spectrum. Our study explored if greenness is a moderating factor in the relationship between socioeconomic status (SES) and mental health using data from the Canadian Longitudinal Study on Aging (CLSA).
Methods: A cross-sectional design was used to compare mental health outcomes between individuals with different levels of SES and residential greenness. We used self-rated social standing as a measure of SES and depression score measured using the Centre for Epidemiologic Studies 10-Item Depression Scale (CESD-10) as a measure of mental health. Greenness was measured using the annual maximum Normalized Difference Vegetation Index (NDVI) within a 1,000 m buffer area of participants' residential postal code locations.
Results: There was a statistically significant moderating effect of greenness for the relationship between self-rated social standing and depression score. As greenness increased, individuals with lower self-rated social standing had the greatest decreases in depression score.
Discussion: The results of our study suggests that targeting greening interventions at individuals and communities with low SES may reduce depressive symptoms overall, as well as decrease socioeconomic inequalities in depression.
Understanding how the natural environment shapes mental health outcomes is crucial for improving population health and has important implications for urban planning and public health interventions. The relationship between greenness and mental health is well established, with greenness having a strong positive association with desirable mental health outcomes (1–7). Being in a green environment for as little as 15 min immediately attenuates the stress response and lowers cortisol levels (8). Over time, continuous exposure to greenness can reduce chronic stress, which may lead to better mental health outcomes including lower risk of depression (9, 10). Globally, depression affects over 300 million people annually and is the leading cause of mental health-related burden of disease (11). Depression is a major public health concern in Canada, with 7% of Canadians experiencing a major depressive disorder in 2019 (12). During the height of the COVID-19 pandemic, the prevalence of depression in Canada more than doubled to 16% in the fall of 2020 (12). Population-level interventions targeted at decreasing the prevalence of depression are important upstream strategies to reduce the burden of disease, and the emerging relationship between greenness and depression has led to an interest in using green spaces and green infrastructure as a public health intervention (7).
Socioeconomic status (SES) is associated with mental health conditions, including depression, where disadvantaged individuals have worse outcomes (13). Similarly, recent research has highlighted the potential for SES to moderate a person's access to natural environmental features such as green spaces. For example, those who are socioeconomically disadvantaged often have less green space in their neighbourhoods, which stems from a variety of factors including having fewer community actors advocating for green spaces, living in crowded urban environments, and less investment by local governments and organizations (14, 15). That mental health is associated independently with both SES and access to green space adds support to the notion that green space is equigenic, that is, individuals with lower SES may have the most to gain in terms of mental health improvements from increasing green space exposure (16). The rationale behind this hypothesis is that green space exposure modifies psychosocial factors that are strongly associated with low SES, such as stress and low social cohesion, by attenuating the stress response and providing environments that facilitate social connectedness such as community parks and other outdoor spaces (9, 10, 16, 17).
Despite heightened interest in green space as a public health intervention, the simultaneous evaluation of greenness, SES, and mental health in Canada is lacking, and the potential impact of greenness to moderate the relationship between SES and mental health remains unaddressed. The Canadian Longitudinal Study on Aging (CLSA) provides a unique opportunity for addressing this gap; it is a rich source of survey data from over 50,000 Canadians and includes individual-level measures of SES and mental health that have been linked to measures of residential greenness. Older adults are an ideal study population for this work for two reasons. First, SES is generally well-established by the time someone becomes an older adult, compared to its relative volatility among younger adults. Second, residential greenness (i.e., a measure of green space in proximity of an individual's home) is an accurate measure of green space exposure in older adults because they spend more time at or near the home than younger adults due to health and social factors (18).
The objective of this study was to determine if greenness is a moderating factor in the relationship between SES and mental health in older Canadians. We operationalized SES using self-rated social standing, which captures how individuals position themselves in their social hierarchy. Using a subjective measure of SES is particularly useful in older populations, where objective measures including income are less relevant due to retirement (19). Additionally, greenness is thought to moderate the relationship between SES and mental health by influencing psychosocial factors related to low SES such as stress and social cohesion (9, 10, 17). Individuals with higher SES measured by objective measures may still have low self-rated social standing and experience some degree of psychosocial effects related to low SES despite having material resources. Taken together, a subjective measure of SES is well-suited to our study population as well as our conceptual framework of the relationship between SES, mental health, and greenness.
Depression has a strong social gradient and high prevalence (20). Additionally, the Centre for Epidemiological Studies 10-item scale (CESD-10), the measure of depression in this study, can capture depressive symptoms in individuals who are not clinically depressed as well as those who meet the criteria for clinical depression (21). The results of this study will help fill a gap in the literature by determining how greenness affects individuals with different demographic characteristics and may help inform public policy surrounding green space interventions as an approach to reducing depression in Canada.
We used a cross-sectional design to compare mental health outcomes between individuals with different levels of socioeconomic status (SES) and residential greenness using baseline data from the Canadian Longitudinal Study on Aging (CLSA) collected between 2011 and 2015. The CLSA is a population-based, prospective cohort study designed to investigate biological, clinical, psychosocial, societal, and environmental factors that contribute to healthy aging. A full description of the CLSA has been published elsewhere (22, 23), however a brief description of features relevant to this study are described below.
The CLSA cohort consisted of a stratified sample of 51,338 Canadians between the ages of 45 and 85 at baseline. The full CLSA cohort was split into two complementary cohorts, Tracking and Comprehensive. The Tracking cohort consisted of 21,241 participants from the 10 Canadian provinces, whose baseline data was collected via telephone interviews. The Comprehensive cohort consisted of 30,097 participants who lived within 25–50 km of 11 data collection sites in seven provinces (British Columbia, Alberta, Manitoba, Ontario, Québec, Nova Scotia, and Newfoundland). Baseline data were collected from the Comprehensive cohort using in-home interviews, as well as physical assessments and biospecimen collection at the data collection sites. Both cohorts completed the same core questionnaire that covered a broad range of social, health, and lifestyle measures (22).
To meet eligibility requirements, participants had to live in households or transitional housing environments and be able to communicate in either English or French. Residents of the three territories, individuals who lived on federal First Nations reserves, full-time members of the Canadian Armed Forces, and individuals living in institutions at the baseline were excluded from the sampling frame (23).
Baseline greenness data were provided to the CLSA from the Canadian Urban Environmental Health Research Consortium (CANUE) and were linked to CLSA data using Desktop Mapping Technologies Incorporated (DMTI) single link postal code coordinates. Greenness was represented by the normalized difference vegetation index (NDVI) that quantifies the presence of living green vegetation. We used the CANUE variable GRLANYY_9 (Annual Max of Means 1,000 m) in our main analysis, and CANUE variables GRLANYY_07 and GRLANYY_04 (Annual Max of Means 250 m and 500 m respectively) in our sensitivity analyses.
To ensure temporal alignment between baseline greenness data and CLSA data, linked greenness data for each participant were from the same year as their baseline CLSA data collection. In 2012, there was a break in NDVI data collection due to the temporary decommission of the remote satellite used to capture images (24). Therefore, CLSA participants whose baseline data were collected in 2012 did not have linked greenness data and were excluded from our analysis (n = 16,162).
After applying this exclusion criterion, our study population included 35,176 participants. We compared the distribution of age, sex, socioeconomic, and mental health variables between the included and excluded participants using Chi-square tests and did not find any meaningful differences between the two groups that would have introduced bias.
Depression was measured in the CLSA using the Centre for Epidemiologic Studies Depression Scale (CESD-10), which is a 10-item Likert-style self-report questionnaire that records depressive symptoms within the past seven days (25). Questions in the CESD-10 touch on different depressive feelings and behaviours, including, but not limited to, loneliness, hopelessness, and sleep disturbances (23).
The CLSA reports two variables using CESD-10 scores, depression score, and depression status. Depression score was calculated by summing the scores from the 10 items on the questionnaire and had a range of 0–30. Depression status was a binary variable created using the established cut-off point of a CESD-10 score of 10 or more (23, 25). Participants with CESD-10 scores less than 10 were coded as having a “negative screen for depression”, and those with scores of 10 or more were coded as having a “positive screen for depression”. We used depression score as the primary measure of depression in our study in order to capture depressive symptoms on a depression continuum, and depression status as a sensitivity analysis (Supplementary Table A.1).
Participants were asked to picture a ladder with 10 steps representing where people stand in their communities, and to place themselves on the ladder. Self-rated social standing was a categorical variable with 10 categories (1 = individuals who consider themselves to have the lowest social standing in their community, and 10 = individuals who consider they have the highest social standing in their community). We collapsed self-rated social standing into three categories, “Low” (scores of 1–3 on the ladder), “Medium” (scores of 4–7 on the ladder), and “High” (scores of 8–10 on the ladder), following previously established cut-off scores (26).
Greenness was measured using NDVI, which is a well-validated measure of greenness exposure (27–29) and has been used in epidemiological studies measuring the association between greenness and mental health outcomes (2, 29, 30).
NDVI is a measure of living plant material measured in 30 m × 30 m blocks across Canada and is calculated using Landsat 5 and Landsat 8 satellite sensors that measure chlorophyll in green vegetation (Landsat 5 Annual Green, 1984; Landsat 8 Annual Green, 2013; USGS Landsat 5, 1984; USGS Landsat 8, 2013). NDVI is measured on a scale from −1 to +1, with +1 representing lush green vegetation, 0 representing pavement or bare soil, and negative scores representing standing bodies of water. In general, scores between 0.2 and 0.3 represent moderately green environments and may include plants like shrubs and grass, and scores between 0.6 and 0.8 represent highly green environments such as temperate forests (31).
We only included positive values of NDVI. Although a study shows that “blue space exposure” (i.e., living in environments with natural water features) may also affect mental health outcomes (32), we were specifically interested in measuring the association between greenness and mental health. To facilitate interpretation of “change in NDVI”, we converted the continuous NDVI variable into quartiles for our analytic sample to use in our regression models (median = 0.797, IQR = 0.042).
NDVI in the CLSA was provided by the Canadian Urban Environmental Health Research Consortium (CANUE) and was indexed to DMTI Spatial Inc. postal codes (33). NDVI was available at four different spatial resolutions representing the average NDVI score of the geographic area within a circular buffer of 100, 250, 500, and 1,000 m from each postal code location. Previous greenness research has shown that NDVI scores representing larger buffer areas are more strongly associated with health outcomes because they capture participants' environmental exposure as they live and move around their neighbourhood (30, 34). A study by Reid et al. found similar effect sizes in the relationship between greenness and self-rated health using 1,000 m NDVI buffer areas and self-described neighbourhoods, which are participant-defined and account for how individuals are actually exposed to their environment (30). Since the CLSA does not include self-described neighbourhoods as a spatial area for NDVI, we determined that the largest NDVI buffer of 1,000 m was the best to capture individuals' actual environmental exposure. We used the 1,000 m buffer in our main analysis, and included the 250 m and 500 m buffers as sensitivity analyses to account for potential differences in effect size that were sensitive to NDVI buffer size (Supplementary Tables B.1, B.2).
To account for participants' interactions with their environment, we included Life Space Index (LSI) as a covariate, which provides a general measure of participants' mobility within their home and surrounding community (35, 36). LSI is a self-report measure that asks about participants' movements to different areas of their homes and communities (“life spaces”) in the last four weeks. LSI is a composite score that accounts for which life spaces participants were in, as well as how frequently they were in those spaces and if they required assistance from another person to get there. LSI was measured as a continuous variable on a scale from 0 to 120 (0 = totally bed bound, 120 = travelled out of town every day without assistance) and helped adjust for participants' level of greenness exposure based on their mobility.
The urban/rural classification variable in the CLSA was a categorical variable with five levels (urban core, urban fringe, urban population centre outside census metropolitan areas and census agglomerations, secondary core, rural), created using Statistics Canada's Postal Code Conversion File (PCCF) (37). For our main analysis, we collapsed the variable into three levels, “Urban”, which included participants classified as “urban core”, “Rural”, which included participants classified as “rural”, and “Other”, which included participants classified as outside an urban core but not living rurally. This allowed us to control for confounding based on potential differences in greenness across urban and rural environments. We also ran a sensitivity analysis stratifying across urban, rural, and other categories to determine if the relationship between NDVI, self-rated social standing, and depression score varied between urban and rural environments.
Other covariates included in our models came from CLSA baseline data and were based on the literature on greenness and mental health, as well as mental health in older adults. They included age (measured in years), sex (male or female), race (white or not), marital status (single, married, widowed, divorced, or separated), overall social support score [calculated using 19 questionnaire items that ask about different dimensions of social support (38)], and physical activity (weekly, monthly, yearly, or never) (1, 5, 39).
We calculated summary statistics (mean and standard deviation) for NDVI across self-rated social standing categories, depression status, and the other covariates included in our models to explore the distribution of greenness by participant characteristics and used t-tests and ANOVA to test for statistically significant differences in mean NDVI. Tukey's HSD Test for multiple comparisons was used to test for differences in mean NDVI between specific levels of self-rated social standing (low vs. medium, medium vs. high, and low vs. high).
We conducted a series of linear regression analyses modelling depression score using self-rated social standing, NDVI quartiles, and other covariates. Our baseline model (Model 1) was adjusted for age and sex, Model 2 was adjusted for other covariates (LSI, urban/rural classification, race, marital status, overall social support, and physical activity) and Model 3 added an interaction term between NDVI and self-rated social standing. We evaluated our models for collinearity using variance inflation factors (VIF). As expected, there was moderate correlation between covariates (VIF <5 for all), which we considered acceptable given the nature of our variables.
In our sample, 8.8% of participants were missing self-rated social standing. We compared participants with missing data to those without using Chi-square tests. Missing data was significantly associated with being female, over the age of 65, being depressed, and having lower educational attainment (p < 0.05 for all). We used the Multiple Imputation by Chained Equations (MICE) method with 10 imputations to impute missing self-rated social standing data using sex, age group, depression status, and educational attainment, and used the imputed data in our regression analyses. We chose the MICE model of imputation over the multivariate normal model (MVN) because MICE does not assume a joint normal distribution of variables; instead, the variables with missing values are modelled using their own distributions (40). This is useful when variables are skewed, as was the case with self-rated social standing in our data. We conducted a sensitivity analysis using complete cases (i.e., non-imputed data) to validate our imputed data and did not find any differences in our models (Supplementary Table C.1).
Sample weights were provided by the CLSA and accounted for the complex survey design when calculating standard errors. We considered p-values ≤0.05 statistically significant. All analyses were conducted using Stata version 15.1 (41). Code used in our statistical analysis will be made available upon reasonable request.
The CLSA study protocol was approved by 13 research ethics boards across Canada. Data access for this study was granted by the CLSA, and this study was approved by Dalhousie University Research Ethics Board (REB # 2020–5168).
Our study population included 35,176 participants from the Tracking and Comprehensive CLSA cohorts. The study population was close to evenly split between males and females (55.2% male, 44.8% female), predominantly Caucasian (94.8%), and most participants were aged 45–64 (72.7%). The majority lived in urban environments (71.8%), were married (76.2%), participated in physical activity at least once a week (39.6%), and had medium self-rated social standing (65.4%). Nearly a fifth (18.5%) of study participants had a positive screening for depression on the CESD-10 (CESD-10 score ≥10) (Table 1). We used NDVI within a 1,000 m buffer area of postal code locations. The mean NDVI for our study population was 0.792, with a standard deviation of 0.039 and a range of 0.901 (minimum = 0.099, maximum = 1.000).
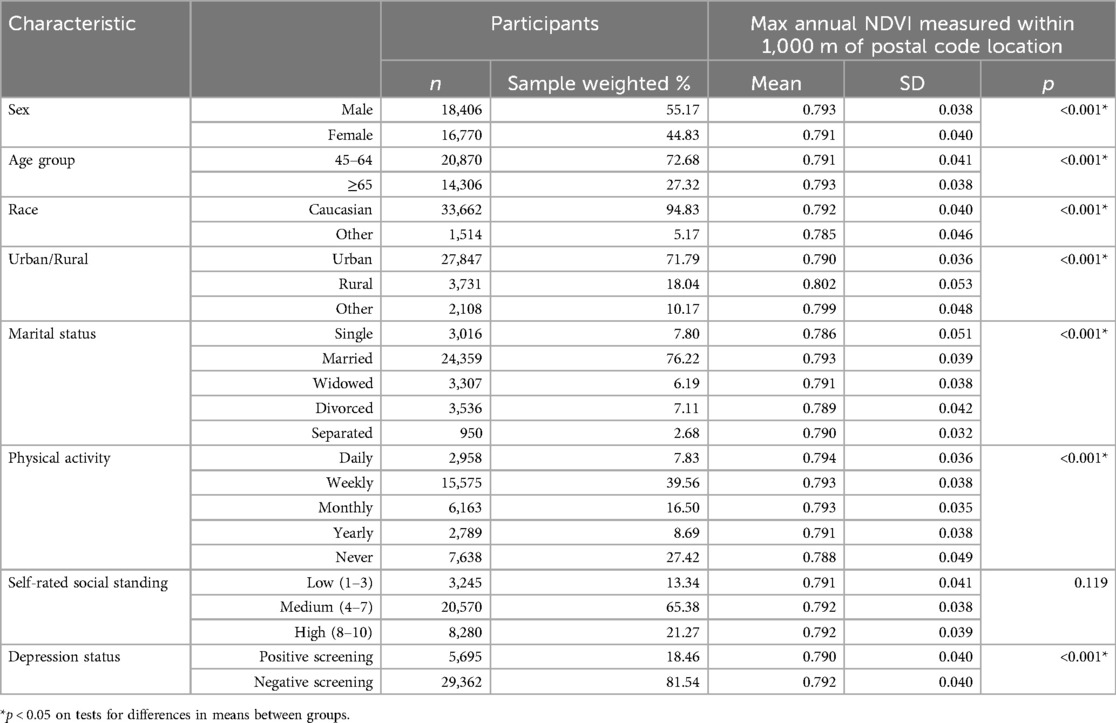
Table 1. Descriptive characteristics and NDVI scores for CLSA participants.
There were no statistically significant differences in mean NDVI between self-rated social standing categories (p = 0.119) (Table 1), however Tukey's HSD Test for multiple comparisons determined that mean NDVI between “Low” and “High” self-rated social standing categories was significantly different (p = 0.020). Participants with a positive screen for depression on the CESD-10 had a statistically significant lower mean NDVI score than participants with a negative screen for depression [0.790 compared to 0.792, (p < 0.001)] (Table 1).
Figures 1, 2 illustrate the relationship between self-rated social standing and NDVI (measured as continuous and quartiles, respectively) on depression score. Individuals with lower self-rated social standing had higher depression scores than individuals with higher self-rated social standing. As greenness increased, depression scores decreased for all self-rated social standing categories, however depression scores decreased more for individuals with lower self-rated social standing. Figure 1 illustrates the relationship between self-rated social standing across the range of NDVI values included in the data, and Figure 2 is in line with our regression models that use NDVI quartiles to quantify change in NDVI.
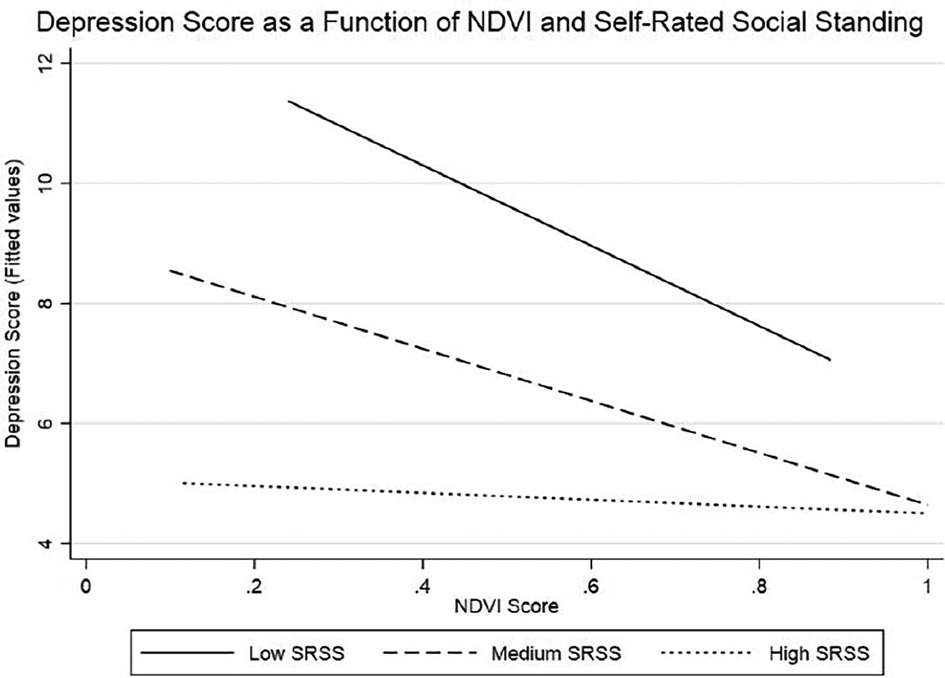
Figure 1. Interaction between self-rated social standing and NDVI on depression score. Higher NDVI has a great impact on depression score for participants with low and medium self-rated social standing compared to participants with high self-rated social standing.
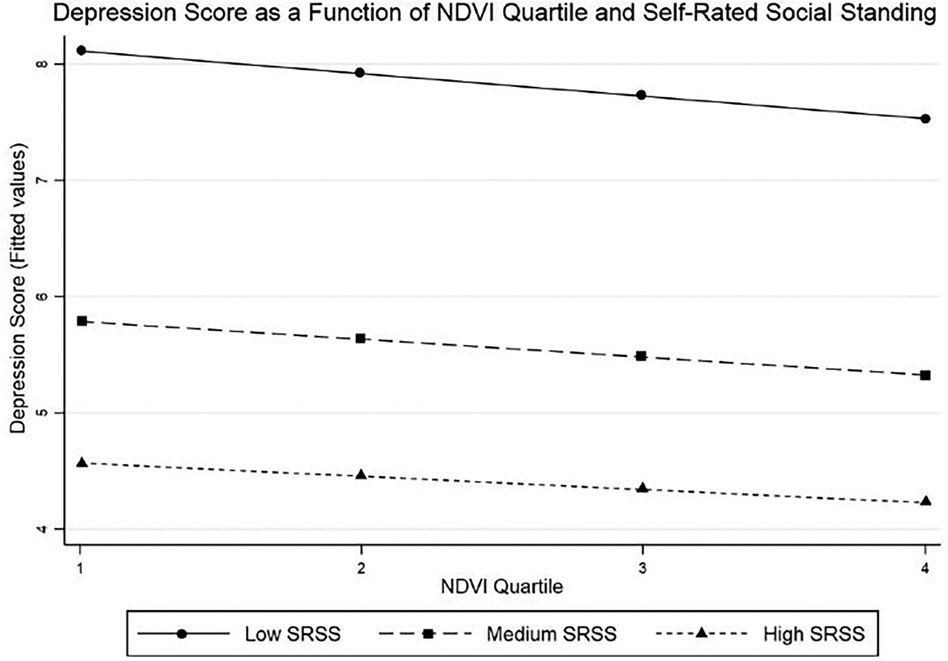
Figure 2. Interaction between self-rated social standing and NDVI quartile on depression score. Higher NDVI has a greater impact on depression score for participants with low and medium self-rated social standing compared to participants with high self-rated social standing.
We conducted a series of linear regression models to determine if NDVI was a statistically significant modifier in the relationship between self-rated social standing and depression score. In the baseline model, individuals with medium and high self-rated social standing scored on average 2.05 and 3.13 points lower on the CESD-10 than individuals with low self-rated social standing (p < 0.001 for both) (Table 2). Residential greenness, measured using NDVI quartiles, was also significantly associated with lower depression scores. Individuals in the highest NDVI quartile (i.e., the most greenness) scored on average 0.27 points lower on the CESD-10 than individuals in the lowest NDVI quartile (p < 0.001) (Table 2). After adjusting for covariates in Model 2, self-rated social standing was still significantly associated with lower depression score, however the association between NDVI and depression score was attenuated and no longer statistically significant. There were statistically significant interactions between levels of self-rated social standing and NDVI quartile after adjusting for covariates in Model 3, which indicated that the relationship between self-rated social standing and depression score varied by greenness (Table 2).
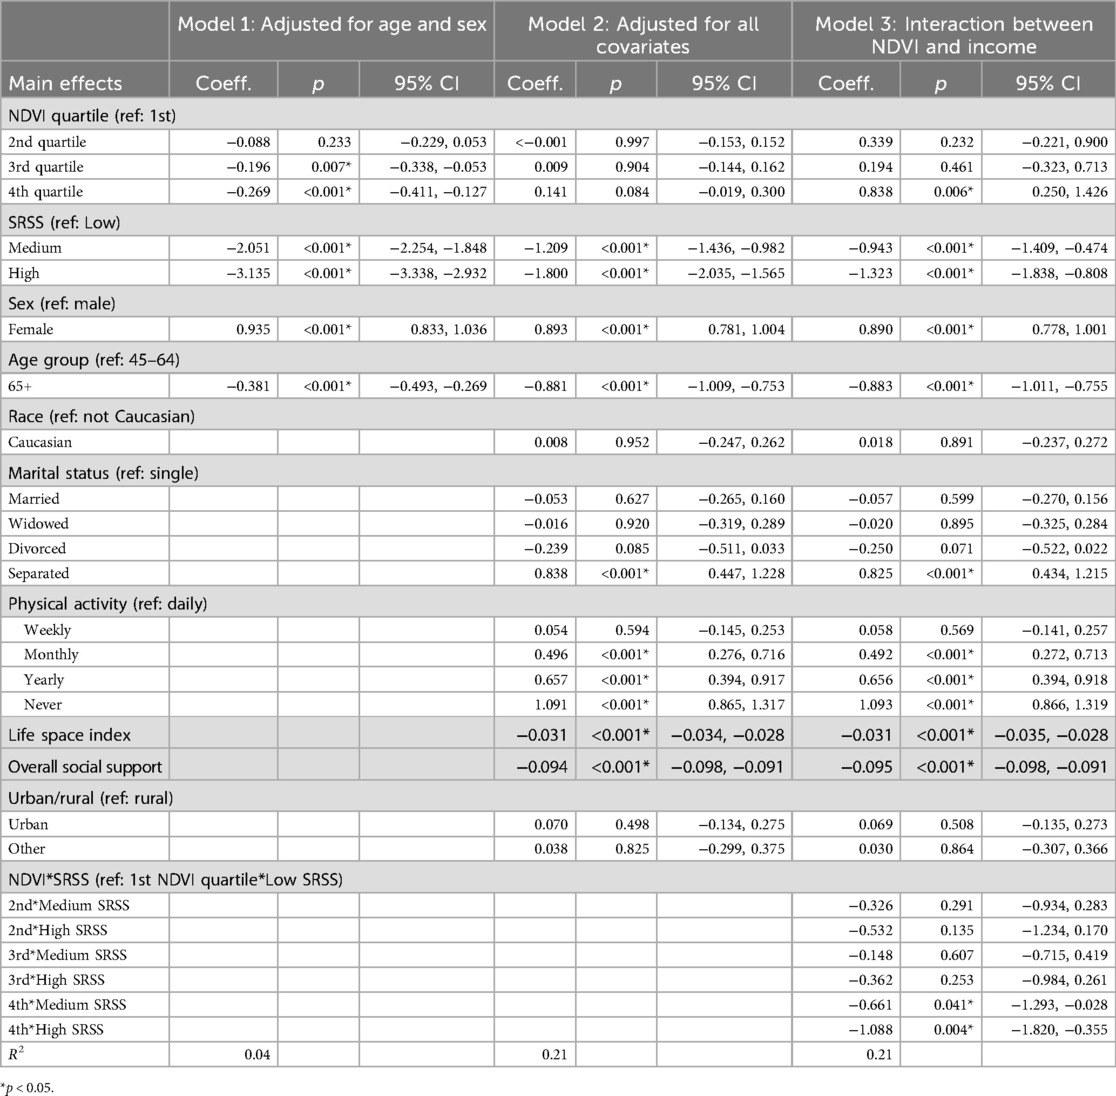
Table 2. Results of regression analysis modelling depression score by self-rated social standing and maximum annual NDVI within 1,000 m buffer area.
We also conducted a sensitivity analysis stratifying across urban, rural, and other categories to determine if the relationship between self-rated social standing, NDVI quartile, and depression score varied between urban and rural environments (Table 3). Significant interactions were noted between levels of self-rated social standing and NDVI quartile after adjusting for covariates for participants in the urban stratum, but no significant interaction terms were identified for participants in the rural or other strata (Table 3).

Table 3. Results of regression analysis modelling depression score by maximum annual NDVI within 1,000 m buffer area, stratified by urban/rural classification.
To account for potential differences in effect size that were sensitive to NDVI buffer size, we ran our models using NDVI with 250 m and 500 m buffer areas as sensitivity analyses (Supplementary Tables B.1, B.2). The direction of association between NDVI and depression score was the same regardless of NDVI buffer area in the base model adjusted for age and sex, however, there were no statistically significant interaction terms between NDVI quartiles and self-rated social standing using the smaller NDVI buffer areas.
We conducted a sensitivity analysis using depression status, which is a more clinically relevant measure of depression created using the established CESD-10 score cut-off point of <10 or ≥10 (25). Higher self-rated social standing and NDVI were statistically significantly associated with lower odds of depression, however, there were no significant interaction terms between self-rated social standing and NDVI quartiles using the 1,000 m buffer area (Supplementary Table B.1).
The aim of this study was to improve our understanding of the relationships between greenness, SES, and mental health in Canada using data from the Canadian Longitudinal Study on Aging. Our objective was to determine if greenness is a moderating factor in the association between self-rated social standing and depression. We observed a statistically significant interaction between self-rated social standing and NDVI in their associations with depression score, which suggests that greenness moderates the relationship between self-rated social standing and depression among older Canadians.
In general, individuals with lower self-rated social standing had higher depression scores, which is consistent with observed social gradients in depression (20). However, as NDVI score increased, the rate of decrease in depression score was greater for individuals with low and medium self-rated social standing compared to individuals with high self-rated social standing. This suggests that greenness may help reduce social gradients in depression, which has important implications for public health interventions aimed at improving population-level depression outcomes. Further, stratified analysis showed NDVI significantly modified the relationship between self-rated social standing and depression score among individuals who live in urban areas. Intentional greening initiatives (i.e., planting vegetation in neighbourhoods) targeted at individuals with low SES may be associated with less socioeconomic-related depression inequalities and other mental health inequalities, especially in urban areas where individuals with lower SES may have less access to green spaces (14).
We used depression status and self-rated social standing categories to compare mean NDVI between individuals with different mental health states and socioeconomic status. NDVI was higher for individuals with a negative screen for depression and higher self-rated social standing. This is consistent with the literature on the beneficial effects of greenness on mental health (1, 3–7), as well as documented socioeconomic gradients in neighbourhood green space where individuals with higher SES have more green space (14, 15, 42). However, for both variables, the difference in mean NDVI values between groups was very small. Despite a wide range of possible NDVI scores (0.099–1.000), there was a 0.002 difference in mean NDVI between individuals with positive and negative screens for depression (0.790 vs. 0.792), a 0.001 difference between the lowest and highest self-rated social standing categories (0.791 vs. 0.792), and the mean NDVI for depression status and self-rated social standing groups were virtually identical to the overall study population mean NDVI of 0.792, with only slight decreases from the mean for individuals with a positive screen for depression and low self-rated social standing. While these results indicate that higher NDVI within 1,000 m of postal code location is associated with less depressive symptoms measured on the CESD-10, it is unclear how such small differences in NDVI should be interpreted when considering the design of greening interventions targeted at reducing depression. To explore this further, we conducted a sensitivity analysis using depression status in our model instead of depression score and found that NDVI did not significantly moderate the relationship between self-rated social standing and depression status. This is likely because the decreases in depression score associated with higher NDVI observed in our main model were below the binary depression cut-off score of 10 on the CESD-10.
Other NDVI studies have reported similarly small differences in NDVI by SES indicators and health outcomes. For example, a Canadian study measured an income-NDVI gradient where the difference in mean NDVI between the lowest and highest income categories was 0.05 (43). Other Canadian studies have reported statistically significant lower odds of depression and anxiety associated with small NDVI increases of 0.06–0.1 (2, 3). Small differences in NDVI raise questions about effect size, including whether statistically significant differences in mean NDVI translate to real differences in greenness. At its core, NDVI is a measure of chlorophyll concentration captured by satellite imagery, which is then transformed into an index. It does not provide contextual information about the types of vegetation in the environment, let alone how people interact with and are exposed to the green space it is measuring. This is a limitation of all studies using NDVI. However, exploratory analyses using NDVI and large study populations, such as the CLSA, are important for establishing associations between greenness, SES, and mental health, and lay the groundwork for future research using other green space measures.
Previous research aligns with our main finding, suggesting that greenness may act as an equalizer for mental health outcomes between individuals with low and high SES by reducing stress associated with low SES (44, 45). It is well established that low SES is a risk factor for poor mental health (46–48) because SES directly impacts psychosocial, material, and behavioural factors associated with mental health including stress, the ability to obtain resources (e.g., adequate housing, nutritious food), and health promoting behaviours (e.g., the opportunity to exercise) (49). Conversely, greenness and green spaces are thought to modify the association between SES and mental health by decreasing stress, improving social cohesion, and promoting physical activity (16). Individuals with low SES are also disproportionately exposed to harmful environmental exposures associated with poor mental health, which has been identified as a driver of mental health inequalities (42, 50). Green spaces can be protective against harmful environmental exposures associated with poor mental health by reducing air and noise pollution, as well as heat island effects (4, 51, 52).
Increasing greenness and access to green spaces, particularly for individuals with low SES, has been proposed as a potential strategy to help reduce socioeconomic-related mental health inequalities as an interim measure while addressing other social determinants of health (42, 44, 53, 54). Significant interaction terms between NDVI and self-rated social standing in our depression score model indicated that greenness moderated the effect of self-rated social standing on depression score, and consequently, increased NDVI was associated with a decrease in depression score inequality. Although we observed a difference in greenness availability by self-rated social standing, in reality, the observed decreases in depression scores in areas with higher NDVI would likely be too small to justify using greening initiatives as interventions to reduce depression in neighbourhoods and communities with low self-rated social standing.
A limitation of our study is the use of NDVI as the sole measure of greenness. There were very small differences in mean NDVI across self-rated social standing and depression groups, and further research is needed to determine the meaning of such small changes in NDVI to individuals living in built environments. Additionally, physical activity and social support were both associated with depression in our regression models, which in turn might be highly influenced by available green space and individual-level decisions on where to live. There are many types of green spaces, and those intended for playing sports or neighbourhood parks that facilitate social connectedness may have more of an influence on depression than other types of green space such as grassy road medians or agricultural fields. Understanding how specific types of green space facilitate physical activity and social connectedness is important when quantifying the relationship between greenness, SES, and mental health, and warrants further investigation. Additionally, other environmental exposures including air and noise pollution have also been linked to poor mental health and may be mitigated by increasing greenness, however these exposures were not measured in our study.
In summary, our findings add to the literature surrounding greenness and mental health in Canada and suggest that targeting greening interventions at individuals and communities with low SES may reduce depressive symptoms overall, as well as decrease socioeconomic inequalities in depression.
The data analyzed in this study is subject to the following licenses/restrictions: Data access requests to the Canadian Longitudinal Study on Aging are reviewed by the Data and Sample Access Committee (DSAC). Requests to access these datasets should be directed to https://www.clsa-elcv.ca/access.
The studies involving humans were approved by Dalhousie University Research Ethics Board (REB # 2020-5168). The studies were conducted in accordance with the local legislation and institutional requirements. Written informed consent for participation was not required from the participants or the participants’ legal guardians/next of kin in accordance with the national legislation and institutional requirements.
AI: Writing – review & editing, Writing – original draft, Project administration, Methodology, Investigation, Formal Analysis, Conceptualization. DD: Writing – review & editing, Supervision, Methodology. SK: Writing – review & editing, Supervision, Resources, Project administration, Methodology, Conceptualization. DR: Writing – review & editing, Methodology, Conceptualization. YA: Writing – review & editing, Methodology, Conceptualization.
The author(s) declare that no financial support was received for the research, authorship, and/or publication of this article.
This research was made possible using the data collected by the Canadian Longitudinal Study on Aging (CLSA). Funding for the Canadian Longitudinal Study on Aging (CLSA) is provided by the Government of Canada through the Canadian Institutes of Health Research (CIHR) under grant reference: LSA 94473 and the Canada Foundation for Innovation, as well as the following provinces, Newfoundland, Nova Scotia, Quebec, Ontario, Manitoba, Alberta, and British Columbia. This research has been conducted using the CLSA datasets Baseline Tracking Version 3.6 and Baseline Comprehensive Version 5.0, under Application Number 2002021. The CLSA is led by Drs. Parminder Raina, Christina Wolfson, and Susan Kirkland. NDVI metrics, indexed to DMTI Spatial Inc. postal codes, were provided by CANUE (Canadian Urban Environmental Health Research Consortium). The opinions expressed in this manuscript are the authors' own and do not reflect the views of the Canadian Longitudinal Study on Aging.
The authors declare that the research was conducted in the absence of any commercial or financial relationships that could be construed as a potential conflict of interest.
The author(s) declared that they were an editorial board member of Frontiers, at the time of submission. This had no impact on the peer review process and the final decision.
All claims expressed in this article are solely those of the authors and do not necessarily represent those of their affiliated organizations, or those of the publisher, the editors and the reviewers. Any product that may be evaluated in this article, or claim that may be made by its manufacturer, is not guaranteed or endorsed by the publisher.
The Supplementary Material for this article can be found online at: https://www.frontiersin.org/articles/10.3389/fenvh.2024.1407646/full#supplementary-material
1. Beyer KMM, Kaltenbach A, Szabo A, Bogar S, Javier Nieto F, Malecki KM. Exposure to neighborhood green space and mental health: evidence from the survey of the health of Wisconsin. Int J Environ Res Public Health. (2014) 11:3453–72. doi: 10.3390/ijerph110303453
2. Cottagiri SA, Villeneuve PJ, Raina P, Griffith LE, Rainham D, Dales R, et al. Increased urban greenness associated with improved mental health among middle-aged and older adults of the Canadian longitudinal study on aging (CLSA). Environ Res. (2022) 206:112587. doi: 10.1016/j.envres.2021.112587
3. Hystad P, Payette Y, Noisel N, Boileau C. Green space associations with mental health and cognitive function. Environ Epidemiol. (2019) 3:e040. doi: 10.1097/ee9.0000000000000040
4. Klompmaker JO, Hoek G, Bloemsma LD, Wijga AH, van den Brink C, Brunekreef B, et al. Associations of combined exposures to surrounding green, air pollution and traffic noise on mental health. Environ Int. (2019) 129:525–37. doi: 10.1016/j.envint.2019.05.040
5. Maas J, van Dillen SME, Verheij RA, Groenewegen PP. Social contacts as a possible mechanism behind the relation between green space and health. Health Place. (2009) 15:586–95. doi: 10.1016/j.healthplace.2008.09.006
6. Vujcic M, Tomicevic-Dubljevic J, Grbic M, Lecic-Tosevski D, Vukovic O, Toskovic O. Nature based solution for improving mental health and well-being in urban areas. Environ Res. (2017) 158:385–92. doi: 10.1016/j.envres.2017.06.030
7. Wendelboe-Nelson C, Kelly S, Kennedy M, Cherrie JW. A scoping review of mapping research on green space and associated mental health benefits. Int J Environ Res Public Health. (2019) 16:2081. doi: 10.3390/ijerph16122081
8. Lee J, Park BJ, Tsunetsugu Y, Ohira T, Kagawa T, Miyazaki Y. Effect of forest bathing on physiological and psychological responses in young Japanese male subjects. Public Health. (2011) 125:93–100. doi: 10.1016/j.puhe.2010.09.005
9. Barton J, Rogerson M. The importance of greenspace for mental health. BJPsych. Int. (2017) 14:79–81. doi: 10.1192/S2056474000002051
10. Hedblom M, Gunnarsson B, Iravani B, Knez I, Schaefer M, Thorsson P, et al. Reduction of physiological stress by urban green space in a multisensory virtual experiment. Sci Rep. (2019) 9:1–11. doi: 10.1038/s41598-019-46099-7
11. Herrman H, Kieling C, Mcgorry P, Horton R, Sargent J, Patel V. Comment reducing the global burden of depression: a lancet—world psychiatric association commission. Lancet. (2018) 393:e42–3. doi: 10.1016/S0140-6736(18)32408-5
12. Guerrero MD, Barnes JD. Profiles of mental health and their association with negative impacts and suicidal ideation during the COVID-19 pandemic: a Canadian Perspective. Health Rep. (2022) 33:19–30. doi: 10.25318/82-003-x202200800002-eng
13. Adler NE, Stewart J. Health disparities across the lifespan: meaning, methods, and mechanisms. Ann N Y Acad Sci. (2010) 1186:5–23. doi: 10.1111/j.1749-6632.2009.05337.x
14. Crouse DL, Pinault L, Balram A, Hystad P, Peters PA, Chen H, et al. Urban greenness and mortality in Canada’s largest cities: a national cohort study. Lancet Planet Health. (2017) 1:e289–97. doi: 10.1016/S2542-5196(17)30118-3
15. Pham TTH, Apparicio P, Séguin AM, Landry S, Gagnon M. Spatial distribution of vegetation in Montreal: an uneven distribution or environmental inequity? Landsc Urban Plann. (2012) 107:214–24. doi: 10.1016/j.landurbplan.2012.06.002
16. Braubach M, Egorov A, Mudu P, Wolf T, Ward Thompson C, Martuzzi M. Effects of urban green space on environmental health, equity and resilience. In: Kabisch N, Korn H, Stadler J, Bonn A, editors. Nature-Based Solutions to Climate Change Adaptation in Urban Areas. Theory and Practice of Urban Sustainability Transitions. Cham: Springer. doi: 10.1007/978-3-319-56091-5_11
17. Markevych I, Schoierer J, Hartig T, Chudnovsky A, Hystad P, Dzhambov AM, et al. Exploring pathways linking greenspace to health: theoretical and methodological guidance. Environ Res. (2017) 158:301–17. doi: 10.1016/j.envres.2017.06.028
18. Johnson J, Rodriguez MA, Snih SA. Life-space mobility in the elderly: current perspectives. Clin Interv Aging. (2020) 15:1665–74. doi: 10.2147/CIA.S196944
19. Demakakos P, Nazroo J, Breeze E, Marmot M. Socioeconomic status and health: the role of subjective social status. Soc Sci Med. (2008) 67:330–40. doi: 10.1016/j.socscimed.2008.03.038
20. Patten SB, Jian LW, Williams JVA, Currie S, Beck CA, Maxwell CJ, et al. Descriptive epidemiology of major depression in Canada. Can J Psychiatry. (2006) 51:84–90. doi: 10.1177/070674370605100204
21. Siddaway AP, Wood AM, Taylor PJ. The center for epidemiologic studies-depression (CES-D) scale measures a continuum from well-being to depression: testing two key predictions of positive clinical psychology. J Affect Disord. (2017) 213:180–6. doi: 10.1016/j.jad.2017.02.015
22. Raina P, Wolfson C, Kirkland S, Griffith LE, Balion C, Cossette B, et al. Cohort profile: the Canadian longitudinal study on aging (CLSA). Int J Epidemiol. (2019) 48:1752–1753J. doi: 10.1093/ije/dyz173
23. Raina PS, Wolfson C, Kirkland SA, Griffith LE, Oremus M, Patterson C, et al. The Canadian longitudinal study on aging (CLSA). Can J Aging. (2009) 28:221–9. doi: 10.1017/S0714980809990055
24. CANUE. Canadian Urban environmental health research consortium: CANUE metadata NDVI landsat 9999. (2018). p. 1–4.
25. Andresen EM, Malmgren JA, Carter WB, Patrick DL. Screening for depression in well older adults: evaluation of a short form of the CES-D. Am J Prev Med. (1) 10:77–84. doi: 10.1016/s0749-3797(18)30622-6
26. Chen B, Covinsky KE, Cenzer IS, Adler N, Williams BA. Subjective social status and functional decline in older adults. J Gen Intern Med. (2012) 27:693–9. doi: 10.1007/s11606-011-1963-7
27. Albarakat R, Lakshmi V. Comparison of normalized difference vegetation index derived from landsat, MODIS, and AVHRR for the mesopotamian marshes between 2002 and 2018. Remote Sens (Basel). (2019) 11:1245. doi: 10.3390/rs11101245
28. Gorelick N, Hancher M, Dixon M, Ilyushchenko S, Thau D, Moore R. Remote sensing of environment google earth engine: planetary-scale geospatial analysis for everyone. Remote Sens Environ. (2017) 202:18–27. doi: 10.1016/j.rse.2017.06.031
29. Rhew IC, Vander Stoep A, Kearney A, Smith NL, Dunbar MD. Validation of the normalized difference vegetation Index as a measure of neighborhood greenness. Ann Epidemiol. (2011) 21:946–52. doi: 10.1016/j.annepidem.2011.09.001
30. Reid CE, Kubzansky LD, Li J, Shmool JL, Clougherty JE. It’s not easy assessing greenness: a comparison of NDVI datasets and neighborhood types and their associations with self-rated health in New York city. Health Place. (2018) 54:92–101. doi: 10.1016/j.healthplace.2018.09.005
31. Gandhi GM, Parthiban S, Thummalu N, Christy A. Ndvi: vegetation change detection using remote sensing and gis—a case study of vellore district. Procedia Comput Sci. (2015) 57:1199–210. doi: 10.1016/j.procs.2015.07.415
32. Foley R, Kistemann T. Blue space geographies: enabling health in place. Health Place. (2015) 35:157–65. doi: 10.1016/j.healthplace.2015.07.003
34. Su JG, Dadvand P, Nieuwenhuijsen MJ, Bartoll X, Jerrett M. Associations of green space metrics with health and behavior outcomes at different buffer sizes and remote sensing sensor resolutions. Environ Int. (2019) 126:162–70. doi: 10.1016/j.envint.2019.02.008
36. Stalvey O, Sloane B. The life space questionnaire: a measure of the extent of mobility of older adults. J Appl Gerontol. (1999) 18:479–98. doi: 10.1177/073346489901800404
37. Canadian Longitudinal Study on Aging. Data Support Document Urban/Rural Classification. Hamilton, ON: CLSA (2018). p. 1–3. Available online at: https://www.clsa-elcv.ca/sites/default/files/documents/urbanrural_dsd_01_03_2018_final.pdf (Accessed July 19, 2024).
38. Canadian Longitudinal Study on Aging. Derived Variables—Social Support Availability (SSA). (2018).
39. Pun VC, Manjourides J, Suh HH. Association of neighborhood greenness with self-perceived stress, depression and anxiety symptoms in older U.S adults. Environ Health. (2018) 17:1–11. doi: 10.1186/s12940-018-0381-2
40. Azur MJ, Stuart EA, Frangakis C, Leaf PJ. Multiple imputation by chained equations: what is it and how does it work? Int J Methods Psych Res. (2011) 20:40–9. doi: 10.1002/mpr.329
42. Mitchell R, Popham F. Effect of exposure to natural environment on health inequalities: an observational population study. Lancet. (2008) 372:1655–60. doi: 10.1016/S0140-6736(08)61689-X
43. Crouse DL, Pinault L, Christidis T, Lavigne E, Thomson EM, Villeneuve PJ. Residential greenness and indicators of stress and mental well-being in a Canadian national-level survey. Environ Res. (2021) 192:110267. doi: 10.1016/j.envres.2020.110267
44. Mitchell RJ, Richardson EA, Shortt NK, Pearce JR. Neighborhood environments and socioeconomic inequalities in mental well-being. Am J Prev Med. (2015) 49:80–4. doi: 10.1016/j.amepre.2015.01.017
45. Sugiyama T, Villanueva K, Knuiman M, Francis J, Foster S, Wood L, et al. Can neighborhood green space mitigate health inequalities? A study of socio-economic status and mental health. Health Place. (2016) 38:16–21. doi: 10.1016/j.healthplace.2016.01.002
46. Hudson CG. Socioeconomic status and mental illness: tests of the social causation and selection hypotheses. Am J Orthopsychiatry. (2005) 75:3–18. doi: 10.1037/0002-9432.75.1.3
47. Lorant V, Deliège D, Eaton W, Robert A, Philippot P, Ansseau M. Meta-analysis socioeconomic inequalities in depression: a meta-analysis. Am J Epidemiol. (2003) 157:98–112. doi: 10.1093/aje/kwf182
48. Zimmerman FJ, Katon W. Socioeconomic status, depression disparities, and financial strain: what lies behind the income-depression relationship? Health Econ. (2005) 14:1197–215. doi: 10.1002/hec.1011
49. Shavers VL. Measurement of socioeconomic status in health disparities research. J Natl Med Assoc. (2007) 99:1013–23. doi: 10.13016/avw3-9cvx
50. Tooke TR, Klinkenberg B, Coops NC. A geographical approach to identifying vegetation-related environmental equity in Canadian cities. Environ Plann B Plann Des. (2010) 37:1040–56. doi: 10.1068/b36044
51. James P, Banay RF, Hart JE, Laden F. A review of the health benefits of greenness. Curr Epidemiol Rep. (2015) 2:131–42. doi: 10.1007/s40471-015-0043-7
52. Weinstein JN, Geller A, Negussie Y, Baciu A. Communities in Action: Pathways to Health Equity. Washington, DC: The National Academies Press. (2017). doi: 10.17226/24624
53. Hunter RF, Cleland C, Cleary A, Droomers M, Wheeler BW, Sinnett D, et al. Environmental, health, wellbeing, social and equity effects of urban green space interventions: a meta-narrative evidence synthesis. Environ Int. (2019) 130:104923. doi: 10.1016/j.envint.2019.104923
Keywords: CLSA, depression, self-rated social standing, greenness, health inequalities
Citation: Irvin A, Dutton DJ, Kirkland S, Rainham DG and Asada Y (2024) Greenness moderates the relationship between self-rated social standing and depression among older adults in the Canadian longitudinal study on aging. Front. Environ. Health 3:1407646. doi: 10.3389/fenvh.2024.1407646
Received: 27 March 2024; Accepted: 20 August 2024;
Published: 10 September 2024.
Edited by:
Reginald Quansah, University of Ghana, GhanaCopyright: © 2024 Irvin, Dutton, Kirkland, Rainham and Asada. This is an open-access article distributed under the terms of the Creative Commons Attribution License (CC BY). The use, distribution or reproduction in other forums is permitted, provided the original author(s) and the copyright owner(s) are credited and that the original publication in this journal is cited, in accordance with accepted academic practice. No use, distribution or reproduction is permitted which does not comply with these terms.
*Correspondence: Alexa Irvin, YWxleGEuaXJ2aW5AZGFsLmNh
Disclaimer: All claims expressed in this article are solely those of the authors and do not necessarily represent those of their affiliated organizations, or those of the publisher, the editors and the reviewers. Any product that may be evaluated in this article or claim that may be made by its manufacturer is not guaranteed or endorsed by the publisher.
Research integrity at Frontiers
Learn more about the work of our research integrity team to safeguard the quality of each article we publish.