 Mark E. McCauley1,2,†
 Peter McCauley1,†Leonid V. Kalachev3Siobhan Banks4David F. Dinges5,‡
 Hans P. A. Van Dongen1,2*‡
- 1Sleep and Performance Research Center, Washington State University, Spokane, WA, United States
- 2Department of Translational Medicine and Physiology, Washington State University Health Sciences, Spokane, WA, United States
- 3Department of Mathematical Sciences, University of Montana, Missoula, MT, United States
- 4Behaviour-Brain-Body Research Centre, University of South Australia, Adelaide, SA, Australia
- 5Unit for Experimental Psychiatry, Division of Sleep and Chronobiology, University of Pennsylvania Perelman School of Medicine, Philadelphia, PA, United States
Adequate sleep is essential for maintaining health, safety, and neurobehavioral functioning in 24/7 operational settings. Loss of sleep causes fatigue, which results in neurobehavioral impairment. Neurobehavioral impairment builds up disproportionately under conditions of total sleep deprivation compared to sustained sleep restriction; and recuperation due to recovery sleep is disproportionately fast after total sleep deprivation compared to sustained sleep restriction. These sleep schedule-dependent dynamics have been captured in a previously published, biomathematical model of fatigue, which includes positive feedback regulation of a relatively fast (hours to days) sleep/wake homeostatic process by a slower (days to weeks) allostatic process—a feature that suggests adenosinergic mechanisms are involved. However, the previously published model underestimates the rate of recuperation due to recovery sleep after acute total sleep deprivation as well as after consecutive days of sleep restriction. The objective of the present research is to modify the model to improve the accuracy of its predictions for recuperation due to recovery sleep. This can be accomplished by including in the model an additional, reciprocal feedback mechanism, presumed to be predominantly adenosinergic in nature, which provides feedback from the faster homeostatic process back onto the slower allostatic process. Adding a single new model parameter and refitting three existing model parameters significantly improves the predictions for recuperation due to recovery sleep after both acute total sleep deprivation and sustained sleep restriction. This model modification also improves the predictions of the build-up of neurobehavioral impairment across days of sustained sleep restriction, without adversely affecting the accuracy of the model in other scenarios including circadian misalignment and sleep inertia. The modified model preserves the previously developed capability to predict the differential dynamics of fatigue for objective performance impairment and subjective sleepiness. With the improved predictions for recuperation due to recovery sleep, the expanded model can be used to provide quantitative estimates for potentially impactful work scheduling decisions, such as the duration of time off needed before workers would be safe to return to the work floor. This enhances the usefulness of the model as a tool for predicting and managing neurobehavioral functioning and safety in 24/7 operational settings.
1 Introduction
1.1 Sleep loss and recovery sleep
1.1.1 Ubiquitous sleep loss underscores the need for recovery sleep
Consensus recommendations say that adults should have regular sleep of at least 7 h per day (1, 2). However, hundreds of millions of individuals world-wide do not regularly obtain sufficient sleep (3), even if their sleep is not curtailed by sleep and circadian disorders or other medical conditions. The reasons vary and include demands on people's time from work and commutes (4), caregiver duties (5), or other time commitments (6), to cultural norms (7), stimulant use (8), life stress (9), digital technology use (10), and lifestyle (11). Evidence is accumulating that irregular sleep is associated with poor performance and health outcomes (12–14), and people are therefore advised to maintain regular sleep/wake schedules (15, 16). Yet, the reality many people face is that they are chronically sleep restricted (17) and must try to make up for lost sleep on the weekend or days off work (18–20). Understandably, they have to trade sleep regularity for intermittent, extended catch-up sleep.
1.1.2 Recovery sleep is critical for risk management in operational settings
The issue of sleep loss is particularly salient for shift workers and others in extended and around-the-clock operational settings, where work schedules prevent them from getting enough sleep during work periods (21–23). Insufficient sleep during work periods results in neurobehavioral impairment, safety concerns, and potential long-term health consequences (24, 25). Proper recuperation through recovery sleep between work periods is essential to help manage these risks (26). Inadequate recovery sleep leads to incomplete physiological and neurobehavioral recuperation (27)—a condition to which people may not be able to functionally adapt (28).
1.2 Temporal dynamics of recuperation
1.2.1 The need for recovery sleep is a non-linear function of prior sleep loss
The dynamics of recuperation during recovery sleep are a topic of investigation within the framework of the two-process model of sleep regulation (29, 30). The two-process model posits that sleep/wake regulation and neurobehavioral functioning are governed by two primary physiological processes (31): a homeostatic process that produces a saturating exponential increase of pressure for sleep during wakefulness and a saturating exponential decrease of this pressure during sleep; and a circadian process that exerts a pressure for wakefulness during the day and withdraws that pressure for wakefulness during the night. Based on the interplay between these two processes, the two-process model predicts that during a period of total sleep deprivation, there will be a rapid growth of neurobehavioral impairment across hours awake, with the level of impairment being strongly modulated by circadian rhythmicity—as confirmed by observations from acute total sleep deprivation experiments (30, 32). Furthermore, the model predicts that the longer the sleep deprivation, the more recovery sleep will be needed to fully recuperate. Yet, since the saturating exponential decrease in homeostatic pressure during recovery sleep would make the first few hours of the sleep period disproportionately recuperative (33), the sleep lost during the sleep deprivation period would not need to be recovered hour for hour—as confirmed by empirical data (34, 35).
1.2.2 The two-process model predicts recuperation from recovery sleep inaccurately
Given the saturating exponential nature of the dissipation of homeostatic pressure during sleep, the two-process model predicts that a day with at least some sleep, even if substantially restricted, should display significantly less neurobehavioral impairment compared to a day with no sleep at all, again because the first few hours of the sleep period are disproportionately recuperative—a prediction that has also been confirmed by empirical data (33, 36, 37). However, the two-process model further predicts that there should be swift adaptation when a restricted sleep schedule is sustained across consecutive days, such that after one or two days neurobehavioral functioning will have degraded to a modest level of impairment that is then maintained from day to day (38). Laboratory studies have conclusively shown that this prediction is incorrect, and that sustained sleep restriction instead results in a steady accumulation of sleep pressure and neurobehavioral impairment that continues over many days (39–43). Because the two-process model does not adequately predict the build-up of neurobehavioral impairment across days of sustained sleep restriction, it also does not offer insight into neurobehavioral recuperation during subsequent recovery sleep.
1.2.3 The recuperative potential of recovery sleep is different after sustained sleep restriction than after acute total sleep deprivation
The financial cost of laboratory studies of recovery sleep is high and data pertaining to neurobehavioral recuperation are relatively scarce (44). From the available data, there appears to be a relatively straightforward dose-response relationship between the duration of recovery sleep and the degree of neurobehavioral recuperation (45, 46). Nonetheless, the recuperative potential of sleep also depends on the nature of the preceding sleep loss. That is, under conditions of acute total sleep deprivation or short-term sleep restriction there is a rapid build-up of neurobehavioral impairment, but there is also a high rate of recuperation during recovery sleep; one or two nights with at least 8 h of recovery sleep tend to suffice to fully recover (32, 47). By contrast, under conditions of sustained sleep restriction there is a more gradual build-up of neurobehavioral impairment across days (40, 41), which can reach a level equivalent to that seen after two to three days and nights of total sleep deprivation (42) but takes much longer (multiple nights) to recovery from (41, 48, 49). Thus, to determine how much recovery sleep is needed to overcome the neurobehavioral consequences of prior sleep loss, it is necessary to account for the nature of the prior sleep/wake schedule. Failure to do this properly could be a serious hindrance in efforts to curb fatigue1 and manage its risks in operational settings.
1.3 Biomathematical modeling of recovery sleep
1.3.1 A published biomathematical model predicts neurobehavioral impairment after sleep loss and recovery sleep
The sleep schedule-dependent dynamics of recovery sleep have proven to be challenging to model mathematically (50). Even so, they are represented in a biomathematical model of fatigue developed specifically to predict neurobehavioral functioning during sleep loss and after recovery sleep in scenarios involving acute total sleep deprivation or sustained sleep restriction. Since it was first published (51), this model has been refined to better capture the interaction of circadian rhythmicity with sleep loss and recovery (52), to include prediction of the magnitude of sleep inertia2 upon awakening (53), and to differentiate between objective performance impairment vs. subjective sleepiness (54). These refinements have made the model useful as a tool for fatigue risk management in operational settings (55). It is currently in use in passenger and cargo aviation as a tool to help minimize fatigue in work scheduling and to review fatigue reports to help improve operational safety.
1.3.2 The homeostatic and allostatic processes of the biomathematical model interact
At its core, the model includes a positive feedback mechanism comprising a relatively fast homeostatic process and a slower allostatic process, which together (and in conjunction with circadian rhythmicity) determine the build-up rate of neurobehavioral impairment due to sleep loss and the recuperation rate of recovery sleep (51). In mathematical form, the core of the model is a system of first-order ordinary differential equations (ODEs) with two principal state variables, p and u, changing as a function of time t. The function p(t) predicts neurobehavioral impairment during wakefulness, or the nominal propensity thereof during sleep (which would become manifest upon awakening), as driven by the homeostatic process on a timescale of hours to days. The function u(t) captures the allostatic process (56) and modulates p(t) on a timescale of days to weeks. In equations, the model can be written in the following form (52):
class="mb15">Here a, b and d are parameters specific to wake (w) and sleep (s), where aw, as and ds are negative, and bw, bs and dw are positive. The nonhomogeneities fw(t) and fs(t) represent wake- and sleep-specific modulating functions, respectively (52).
1.3.3 The prediction of neurobehavioral recuperation from recovery sleep for different types of sleep loss could be improved
A model of the form of Equation 1 has the capacity to differentiate the build-up of neurobehavioral impairment during acute total sleep deprivation vs. sustained exposure to various doses of sleep restriction (51), although it slightly underestimates the build-up of neurobehavioral impairment across days of sustained sleep restriction. The model can also differentiate neurobehavioral recuperation due to recovery sleep in these scenarios—however, following both acute total sleep deprivation and sustained sleep restriction, the model underestimates the rate of recuperation during recovery sleep (i.e., it overestimates the residual neurobehavioral impairment). While still a major improvement over the two-process model, a model of the form of Equation 1 does not appear to have the dynamic capability to accurately predict neurobehavioral recuperation due to recovery sleep for both types of sleep loss simultaneously. This is illustrated in Figure 1.
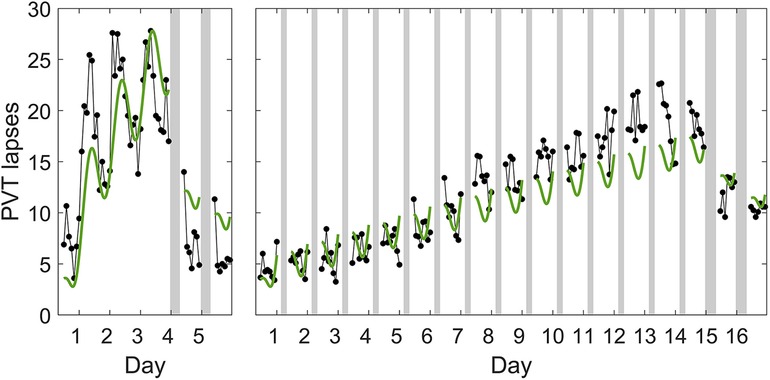
Figure 1. Predictions of the previously published, biomathematical model of fatigue for acute total sleep deprivation and sustained sleep restriction with subsequent recovery. The graphs show group-average observations and corresponding model predictions for the number of lapses of attention (reaction times >500 ms) on a Psychomotor Vigilance Test (PVT) (58) administered at 2 h intervals during scheduled wakefulness in two in-laboratory studies. The first study (left panel) involved an 88 h period of acute total sleep deprivation followed by two days with 8 h recovery sleep opportunities (23:30–07:30); data (black dots) are from 13 healthy young adults (36, 42). The data show a characteristic increase in performance impairment modulated by circadian rhythmicity during total sleep deprivation, and a rapid recuperation to near-baseline performance levels during the two recovery days (32). The second study (right panel) involved 14 days of sleep restriction to 4 h per day (03:30–07:30) followed by two days with 8 h recovery sleep opportunities (23:30–07:30); data (black dots) are from 13 (different) healthy young adults (42). The data show a steady accumulation of performance impairment across consecutive days with sleep restriction, and a slow and incomplete recuperation during the two recovery days (32). Gray bars indicate the sleep opportunities. Tick marks on the abscissa denote midnight for each day. The green curves represent the predictions for the two studies based on the previously published model (52), which is of the form of Equation 1, after recalibrating that model using only the data from the acute total sleep deprivation study.3 Whereas the recalibrated model captures the temporal dynamics of PVT performance during total sleep deprivation relatively well (left panel), the degree of recuperation after recovery sleep is considerably underestimated (i.e., the residual neurobehavioral impairment is overestimated), despite this being the study to which the model was recalibrated. Moreover, the recalibrated model predicts PVT performance during the two recovery days after sustained sleep restriction relatively well (right panel), but at the cost of significantly underpredicting the build-up of impairment across the prior 14 days of sustained sleep restriction. Thus, even after the recalibration performed for this illustration, the model cannot accurately predict neurobehavioral recuperation due to recovery sleep for both types of sleep loss at the same time.
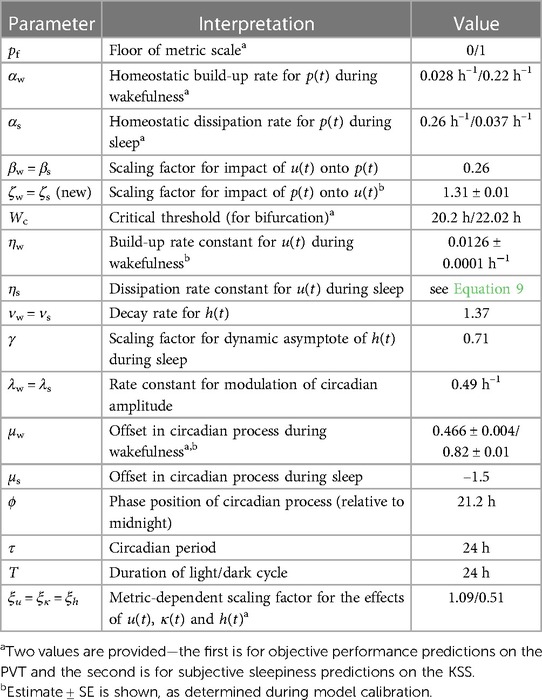
Table 2. Parameters of the modified biomathematical model of fatigue.
1.4 Research objective
1.4.1 Adding a single model parameter improves the prediction accuracy of neurobehavioral recuperation
The suboptimal prediction of neurobehavioral recuperation due to recovery sleep for both acute total sleep deprivation and sustained sleep restriction with the same set of equations limits the usefulness of the biomathematical model for fatigue risk management in operations where both types of sleep loss are common, such as commercial aviation and the military. A solution to this problem can be found by recognizing that Equation 1 are part of a larger class of models, which has previously been documented (51, 57) but not yet fully explored. In this larger class of models, the lower left coefficient of zero in each of the 2 × 2 coefficient matrices in Equation 1 is replaced by a free parameter, which opens up a bigger dynamic repertoire by making the feedback mechanism between the homeostatic and allostatic processes bidirectional (i.e., with p(t) modulating u(t) as well). Here we investigate whether this modification of the model, with just one added parameter, achieves improved prediction accuracy for neurobehavioral recuperation from recovery sleep after both acute total sleep deprivation and sustained sleep restriction, while preserving previously attained prediction accuracy for neurobehavioral impairment across a wide range of sleep loss scenarios.
The objective of the present research is to modify our previously published model to improve the accuracy of its predictions for recuperation due to recovery sleep following total sleep deprivation and sustained sleep restriction.
2 Methods
2.1 Model formulation
Figure 2 illustrates the biomathematical model of fatigue as modified to improve the predictions of recuperation from recovery sleep, and Table 1 shows the full set of model equations. Equations (T1-1) in Table 1 describe the dynamics of p(t), representing neurobehavioral functioning during wakefulness or the nominal propensity thereof during sleep, based on the homeostatic process in interaction with other processes. Equations (T1-2) describe the dynamics of u(t), representing the allostatic process modulating p(t). Equations (T1-3) describe the dynamics of sleep inertia through the function h(t), representing the manifestation of sleep inertia after awakening or the nominal propensity thereof across periods of sleep. Equations (T1-4) describe the dynamics of the function κ(t), represent the time-varying amplitude of the impact of the circadian process. It is embedded in the modulating functions gw(t) and gs(t) specified in Equations (T1-5), with the circadian process c(t) specified in Equations (T1-6). The parameters in these equations are provided in Table 2.
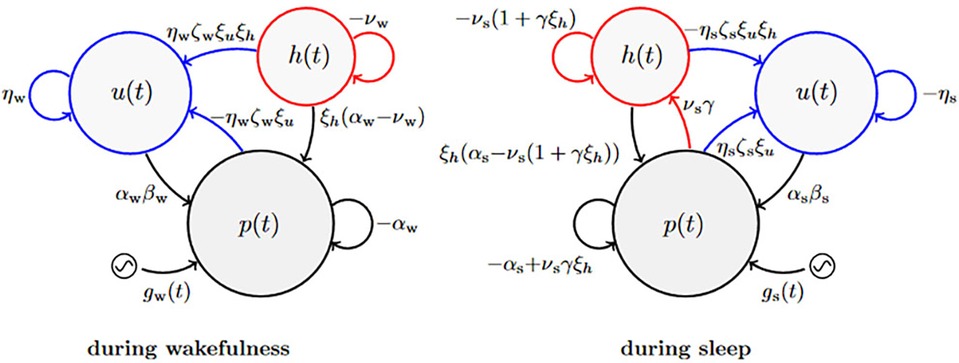
Figure 2. Schematic of the modified biomathematical model of fatigue. In this pharmacodynamic analog of the structure of the fatigue model, three compartments describe the interplay during wakefulness (left) and sleep (right) between state variables p(t) predicting neurobehavioral impairment (or the nominal propensity thereof during sleep) and tracking the homeostatic process, u(t) representing the allostatic process, and h(t) representing sleep inertia after awakening (or the nominal propensity thereof during sleep). The modulating functions gw(t) and gs(t) reflect the influence of the circadian process (52) during wakefulness and sleep, respectively. Parameters shown next to arrows represent rate constants; see Equation 8. The curved blue arrows pointing from p(t) and h(t) onto u(t) are new in the modified model; they represent the reciprocal feedback mechanism between fast (p and h) and slow (u) dynamic processes underlying neurobehavioral functioning.
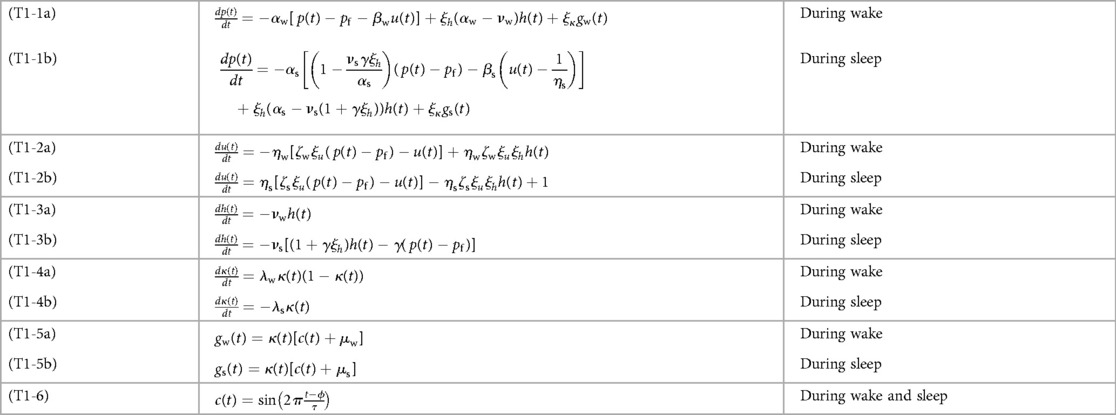
Table 1. Equations defining the modified biomathematical model of fatigue.
Aside from some trivial adjustments to the equations to more explicitly show the positive or negative signs of the parameters, the modified model with the added feedback mechanism is nearly identical to the most recent earlier version of the model without the added feedback mechanism (53). That said, Equations (T1-2) in Table 1 have been expanded to incorporate the new parameter, which replaces the zeros in the 2 × 2 coefficient matrices in Equation 1 from the original model (51) that had hitherto been retained. In the previous version of the model (53), Equations (T1-2) were as follows (Equations 2a,b):
class="mb15">When combined with Equations (T1-1) and written in the matrix form of Equation 1, we get (Equations 3a,b):
where:
which stands for neurobehavioral functioning expressed relative to the floor of the neurobehavioral metric (denoted as pf) and excluding sleep inertia [represented by the ξhh(t) term].
Now replacing the zeros in the 2 × 2 coefficient matrices, we obtain:
Here ζw = ζs denotes the new model parameter (assumed to be identical for wakefulness and sleep), ηw and ηs are the rate parameters of the allostatic process, and ξu is a newly introduced scaling factor assumed to be identical to other scaling factors in the model (i.e., ξκ and ξh). It is easy to show that Equation 5 reduce to Equations (T1-1), (T1-2).
Combining Equation 5 with Equations (T1-3), we may write:
Using Equation 4 and its derivative to time t in Equation 7,
to substitute p(t) for we get:
It can readily be seen that Equations (6a, 8a) are identical to Equations (T1-1a), (T1-2a), (T1-3a), and Equations (6b, 8b) are identical to Equations (T1-1b), (T1-2b), (T1-3b).
2.2 Model recalibration
Whereas our model modification adds only a single parameter, namely ζ, there are three previously included parameters that must be reevaluated to compensate for the addition of terms in Equations (T1-2) and restore previously attained accuracy in predicting the effects of sleep loss on neurobehavioral functioning. These include the offset in the circadian modulating functions gw(t) of Equations (T1-5a), μw, which is estimated separately for whether the model predicts sustained attention performance as measured on the Psychomotor Vigilance Test (PVT) (58) or subjective sleepiness as measured on the Karolinska Sleepiness Scale (KSS) (59); and the rate parameter of the allostatic process during wakefulness, ηw. The latter also determines the rate parameter of the allostatic process during sleep, ηs, through the following equation:
where T is the duration of the day (normally 24 h). Wc is a critical amount of daily wakefulness W that was previously shown to determine whether performance impairment can stabilizes over days (W < Wc) or rather escalates (W > Wc) (51). This bifurcation dynamic is also a feature of the modified model, as previously shown for the larger class of models more generally (57).
2.3 Data sets
Data from published in-laboratory studies were used for model calibration (studies Cal1–Cal3) and validation (studies Val1–Val3). In each of the studies, objective sustained attention performance was measured with the 10 min PVT (58), for which the number of lapses of attention (reaction times >500 ms) was assessed (60). Additionally, subjective sleepiness was measured with the KSS (59), for which the self-reported sleepiness score (on a scale from 1 to 9) was recorded. Within each condition of each study, data were averaged over subjects by test administration (i.e., time point). Data points potentially affected by sleep inertia (typically occurring within the first 2 h after scheduled awakenings) were omitted, as these were not the focus of the present calibration and validation efforts (except in validation study Val2 where sleep inertia was considered separately). The datasets are summarized in Table 3.
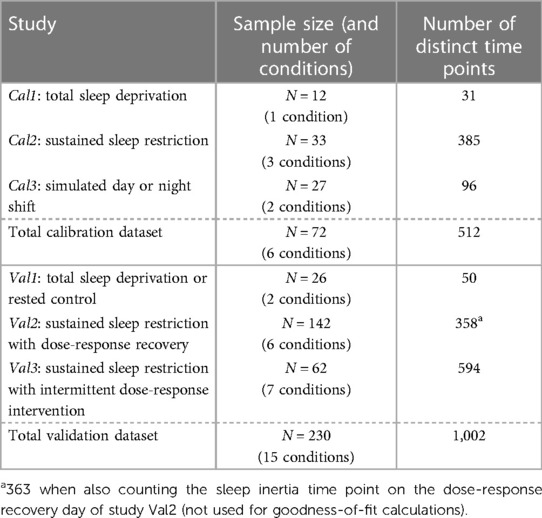
Table 3. Summaries of the calibration and validation datasets.
2.3.1 Calibration study Cal1
As a part of a larger study (61), N = 12 healthy adults (ages 22–37 years; 5 women) were randomized to a total sleep deprivation condition. After two days with 10 h baseline sleep opportunities (22:00–08:00), subjects were kept awake for 62 h. This was followed by two recovery days with 10 h sleep opportunities (22:00–08:00). Neurobehavioral testing occurred at 2 h intervals through most of scheduled wakefulness, starting at 09:30. PVT and KSS data from the 62 h total sleep deprivation period and from each of the two recovery days were used for model calibration. The first test administration of each period of wakefulness was omitted to avoid sleep inertia effects.
2.3.2 Calibration study Cal2
In this study (42), N = 33 healthy adults (ages 21–38 y; 6 women) were randomized to one of three conditions with fourteen consecutive days of nighttime sleep restriction: a 4 h daily sleep opportunity (03:30–07:30; n = 12), a 6 h daily sleep opportunity (01:30–07:30; n = 13), or an 8 h daily sleep opportunity (23:30–07:30; n = 8). The fourteen days of sustained sleep restriction were preceded by 3 baseline days and followed by 3 recovery days with 8 h sleep opportunities (23:30–07:30). Neurobehavioral testing occurred at 2 h intervals during scheduled wakefulness, starting at 07:30. PVT and KSS data from the last baseline day, the 14 days of sleep restriction, and the first two recovery days were used for model calibration. The first two test administrations of each waking period were omitted to avoid sleep inertia effects.
2.3.3 Calibration study Cal3
In this study (62), N = 27 healthy adults (ages 22–39 years; 14 women) were randomized to one of two simulated shift work schedules: day shift (n = 14) or night shift (n = 13). The day shift condition involved thirteen consecutive days with 10 h nighttime sleep opportunities (22:00–08:00). The night shift condition involved a baseline day with a 10 h nighttime sleep opportunity (22:00–08:00) and a 5 h afternoon transition nap (15:00–20:00), followed by four days with 10 h daytime sleep opportunities (10:00–20:00). There was then a “restart break” with a 5 h morning transition nap (10:00–15:00), a 10 h nighttime sleep opportunity (22:00–08:00), and another 5 h afternoon transition nap (15:00–20:00), followed by another four days with 10 h daytime sleep opportunities (10:00–20:00). The night shift condition ended with a 5 h morning transition nap (10:00–15:00) and a 10 h nighttime recovery sleep opportunity (22:00–08:00). Neurobehavioral testing occurred at intervals of 1–3 h through most of scheduled wakefulness, starting at least 1 h after the scheduled awakenings. For both conditions, PVT and KSS data from after the first nighttime sleep opportunity through to the end of the study were used for model calibration. None of the test administrations needed to be omitted to avoid sleep inertia effects.
2.3.4 Validation study Val1
In this study (63), N = 26 healthy adults (ages 22–37 years; 10 women) were randomized to a total sleep deprivation condition (n = 13) or a rested control condition (n = 13). In the total sleep deprivation condition, after two baseline days with 10 h sleep opportunities (22:00–08:00), subjects were kept awake for 62 h. This was followed by two recovery days with 10 h sleep opportunities (22:00–08:00). The rested control condition involved six consecutive days with 10 h sleep opportunities (22:00–08:00). Neurobehavioral testing occurred at 1 to 3 h intervals through most of scheduled wakefulness, starting at 09:30. PVT and KSS data from the 62 h total sleep deprivation period and from each of the two recovery days, as well as the equivalent time points in the rested control condition, were used for model validation. The first test administration of each period of wakefulness was omitted to avoid sleep inertia effects.
2.3.5 Validation study Val2
In this study (46), N = 142 healthy adults (age range 22–45 years; 69 women) were randomized to one of six recovery sleep conditions. In each condition, after two days with 10 h baseline sleep opportunities (22:00–08:00), subjects had five consecutive days of restriction to a 4 h nocturnal sleep opportunity (04:00–08:00). This was followed by a recovery day with a sleep opportunity of 10 h (22:00–08:00; n = 27), 8 h (00:00–08:00; n = 21), 6 h (02:00–08:00; n = 25), 4 h (04:00–08:00; n = 29), 2 h (06:00–08:00; n = 27), or 0 h (n = 13). Neurobehavioral testing occurred at 2 h intervals during scheduled wakefulness, starting at 08:00. PVT and KSS data from the last baseline day, the five sleep restriction days, and the recovery day were used for model validation. The first test administration of each period of wakefulness was omitted to avoid sleep inertia effects. Separately, data from the first test administration of the recovery day (in all but the 0 h condition) were used to validate the sleep inertia aspect of the modified model.
2.3.6 Validation study Val3
In this study (43), N = 62 healthy adults (age range 22–44 years; 28 women) were randomized to one of seven intermittent sleep dose-response interventions during a prolonged period of sustained sleep restriction. In each condition, after two days with 10 h baseline sleep opportunities (22:00–08:00), subjects had five consecutive days of restriction to a 4 h daily sleep opportunity (04:00–08:00). This was followed by an intermittent sleep dose-response intervention day with a sleep opportunity of 12 h (22:00–10:00; n = 10), 10 h (22:00–08:00; n = 11), 8 h (00:00–08:00; n = 11), 6 h (02:00–08:00; n = 10), 4 h (04:00–08:00; n = 8), 2 h (06:00–08:00; n = 7), or 0 h (n = 5). Subjects then had another five consecutive days of restriction to a 4 h daily sleep opportunity (04:00–08:00), which was followed by two days with 10 h recovery sleep opportunities (22:00–08:00). Neurobehavioral testing occurred at 2 h intervals during scheduled wakefulness, starting at 08:00 each day (or at 10:00 on the intermittent sleep dose-response intervention day in the 12 h condition). PVT and KSS data from the last baseline day through to the two recovery days were used for model validation. The first test administration of each period of wakefulness was omitted to avoid sleep inertia effects. The second recovery day contributed only one time point (after sleep inertia) before the study ended.
2.4 Calibration and validation procedures
The one new model parameter (ζw = ζs) and the three model parameters being refitted (ηw and metric-dependent μw for PVT and KSS) were calibrated by means of a Metropolis-Hastings-type Markov chain Monte Carlo (MCMC) algorithm, keeping the other model parameters at their previously estimated values as shown in Table 2. We used a Delayed Rejection Adaptive Metropolis (DRAM) method (64) with a chain length of 176,728 (200,000 iterations, 11.6% rejection rate), applied to the group-average PVT and KSS data points in the calibration dataset.
For determining the initial values of p, u, h and κ, we assumed an equilibrium state for the sleep/wake schedule of the baseline day(s) in each study, and iterated across days using that schedule until a steady state over days at the scheduled time of awakening was reached (at a tolerance level of ɛ = 10−9). Model goodness-of-fit based on group-average data was determined using explained variance (EV) and root-mean-square error (RMSE).
3 Results
3.1 Model improvement
The modified model addressed the main areas of improvement identified for the earlier version of the model (53): underestimation of the rate of recuperation due to recovery sleep following acute total sleep deprivation and following consecutive days of sleep restriction. By adding a single model parameter to add a reciprocal feedback mechanism to the model and refitting three existing model parameters, the predictions for recuperation due to recovery sleep after both acute total sleep deprivation and sustained sleep restriction improved significantly, as did the predictions of the build-up of impairment across days of sustained sleep restriction. The impact on the accuracy of the model in other aspects of its temporal dynamics was minimal, and the capability to differentiate fatigue in terms of objective performance impairment vs. subjective sleepiness was preserved.
As shown in Table 4, compared to the earlier model version (53) the modified model had improved goodness-of-fit for nearly all calibration and validation data, for both PVT and KSS predictions, with only the PVT predictions for validation study Val2 showing no change.
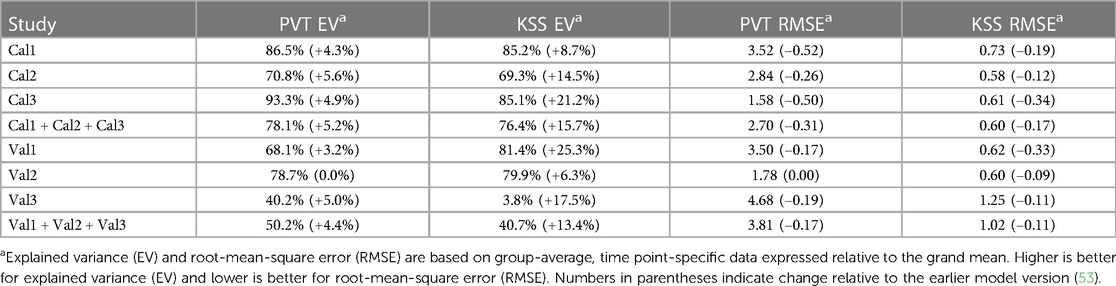
Table 4. Goodness-of-fit of the modified model for PVT lapses and KSS sleepiness for the calibration (Cal1–Cal3) and validation (Val1–Val3) studies.
3.2 Goodness-of-fit for calibration studies
Calibration study Cal1 involved exposure to 62 h of acute total sleep deprivation, followed by two recovery days with 10 h sleep opportunities. Figure 3 shows the group-average observations and the associated model predictions by time point across the study. As shown in the figure, the modified model was remarkably similar to the earlier model version (53) across the 62 h acute total sleep deprivation period, with both data and model displaying the well-established increase in performance impairment superimposed by circadian rhythmicity (30), although the circadian peak of PVT performance impairment during the second night of sleep deprivation was somewhat underpredicted by both models. Notably, for both PVT performance and KSS sleepiness, the modified model predictions for recuperation after the two 10 h recovery sleep periods were substantially improved. This addressed the earlier model version's underestimation of the rate of recuperation after acute total sleep deprivation. For KSS sleepiness, baseline performance (during the first ∼16 h of the 62 h period of wakefulness) was also captured better by the modified model. The latter was a consequence of the baseline sleep schedule yielding different initial values, as compared to the earlier model version, due to the improved recovery dynamics predicting baseline sleep to be more recuperative.
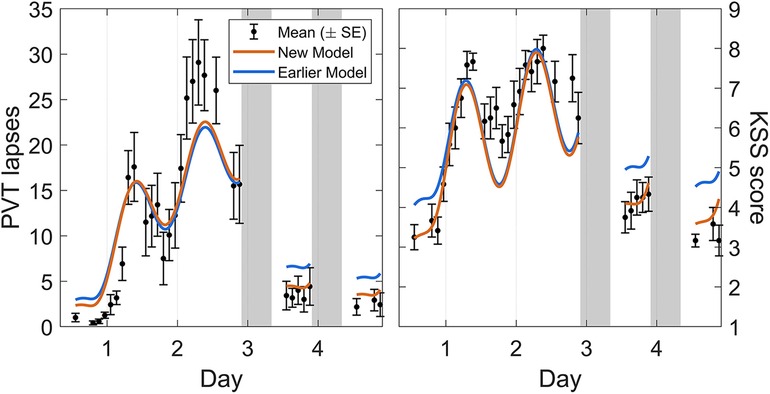
Figure 3. Observations and predictions for neurobehavioral functioning across 62 h of acute total sleep deprivation followed by two recovery days in calibration study Cal1. Block dots (and whiskers) are the means (±SE) of the number of lapses on the PVT (left panel) and the sleepiness score on the KSS (right panel). All data used for calibration are shown, from the start of the total sleep deprivation period (beginning on day 0) to the two recovery days (days 3 and 4, each with 10 h sleep opportunity). Plotted curves are the corresponding model predictions, with blue representing the earlier model version (53) and orange representing the modified (new) model. Gray bars indicate the sleep opportunities. Tick marks on the abscissa denote midnight for each day.
Calibration study Cal2 comprised three different sustained sleep restriction conditions, with fourteen consecutive days of sleep restriction to a 4 h, 6 h, or 8 h daily sleep opportunity followed by two recovery days with 8 h sleep opportunities. Figure 4 shows the group-average observations and the associated model predictions by time point across the study for each sleep restriction condition. As shown in the figure, the modified model displayed the established sleep dose-dependent accumulation of neurobehavioral impairment across days of sleep restriction (42) for objective performance on the PVT and subjective sleepiness on the KSS in all three conditions, although the accumulation of impairment in the 6 h sleep restriction condition was underpredicted for the PVT. In the 6 h and 4 h conditions, the modified model captured the gradual recuperation over the two recovery days (each with 8 h sleep opportunity). Importantly, both during the sleep restriction days and during the recovery days, the model fit was better overall compared to the earlier model version (53). Note that for the PVT in the 4 h sleep restriction condition (Figure 4, bottom left), the fit was improved especially during the sleep restriction days, where it exhibited the more substantial build-up of impairment that was underpredicted in the earlier model version. The degree of subsequent recuperation was still underestimated by the modified model, but relative to the greater prior build-up it was nonetheless faster than in the earlier model version. Also, the degree of recuperation on the KSS during the recovery days after 4 h sustained sleep restriction was predicted well by the modified model. These improvements partially addressed the earlier model version's underestimation of the rate of recuperation after sustained sleep restriction. Furthermore, subjective sleepiness on the KSS in the 8 h (control) condition was more accurately predicted by the modified model (Figure 4, top right).
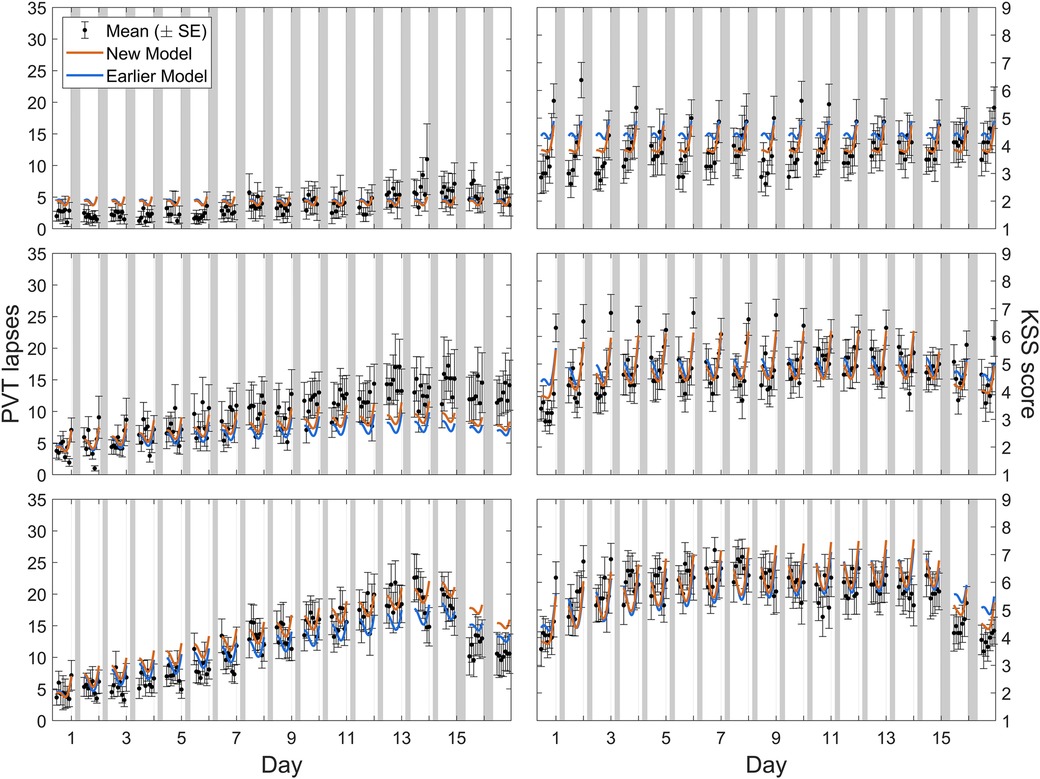
Figure 4. Observations and predictions for neurobehavioral functioning across days of sustained sleep restriction and recovery in calibration study Cal2. Block dots (and whiskers) are the means (±SE) of the number of lapses on the PVT (left panels) and the sleepiness score on the KSS (right panels). All data used for calibration are shown, including the last baseline day with 8 h sleep opportunity (day 0), the 14 days of sleep restriction to a daily sleep opportunity of 8 h (top panels), 6 h (middle panels), or 4 h (bottom panels), and the two recovery days each with 8 h sleep opportunity (days 15 and 16). Plotted curves are the corresponding model predictions, with blue representing the earlier model version (53) and orange representing the modified (new) model. Gray bars indicate the sleep opportunities. Tick marks on the abscissa denote midnight for each day.
Calibration study Cal3 consisted of simulated night and day shift schedules. Figure 5 shows the group-average observations and the associated model predictions by time point across the study for each shift schedule. As shown in the figure, the most notable difference with the earlier model version was that the modified model predicted the observations better at low levels of neurobehavioral impairment. There was still a slight overprediction of impairment on the PVT, especially for the day shift schedule and the first few days of the night shift schedule, but overall the modified model captured the dynamics relatively well.
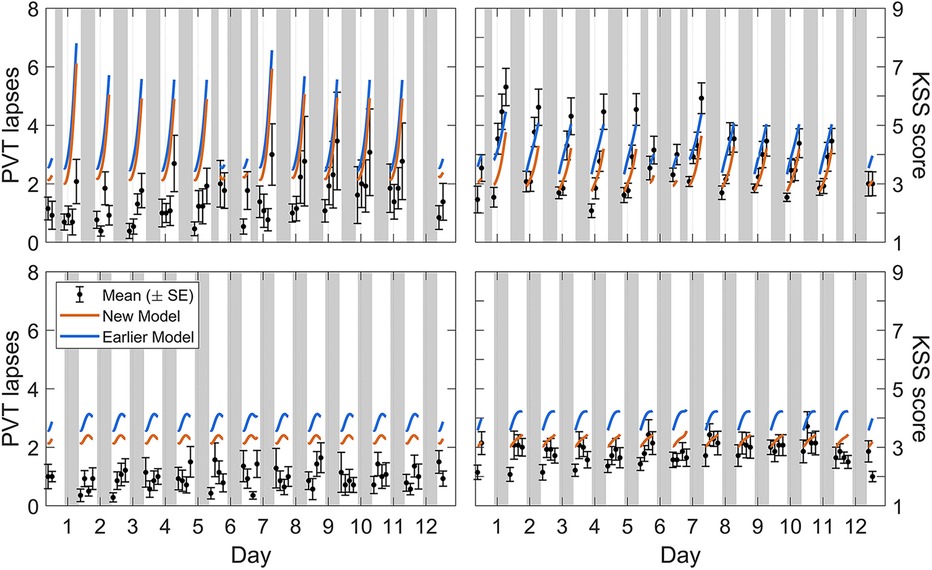
Figure 5. Observations and predictions for neurobehavioral functioning in the simulated day and night shift schedules of calibration study Cal3. Block dots (and whiskers) are the means (±SE) of the number of lapses on the PVT (left panels) and the sleepiness score on the KSS (right panels). All data used for calibration are shown, from the baseline day (day 0, with 10 h prior sleep opportunity) through to the recovery day (day 12, with 10 h sleep opportunity) in the night shift condition (top panels) and the matching days in the day shift condition (bottom panels). Plotted curves are the corresponding model predictions, with blue representing the earlier model version (53) and orange representing the modified (new) model. Gray bars indicate the sleep and nap opportunities. Tick marks on the abscissa denote midnight for each day.
3.3 Goodness-of-fit for validation studies
Validation study Val1 involved exposure to 62 h of acute total sleep deprivation, followed by two recovery days with 10 h sleep opportunities, or participation in an equivalent rested control condition. The study design of the sleep deprivation condition was essentially the same as that of calibration study Cal1. As evident from the RMSE values in Table 4, goodness-of-fit of the modified model to the group-average PVT and KSS data for study Val1 was almost identical to what we found for study Cal1. This indicated robust validation for acute total sleep deprivation and subsequent recovery, on par with goodness-of-fit for rested control.
Validation study Val2 had five consecutive days of restriction to a 4 h daily sleep opportunity, followed by a dose-response recovery day with a sleep opportunity ranging from 0 h to 10 h in duration. Figure 6 shows day-average neurobehavioral functioning for the recovery day after five days of sustained sleep restriction, plotted as a function of the sleep dose on the recovery day (ranging from 0 h to 10 h). As expected, recuperation increased (i.e., residual impairment decreased) with greater duration of recovery sleep. The modified model captured this dose-response relationship more accurately than the earlier model version (53).
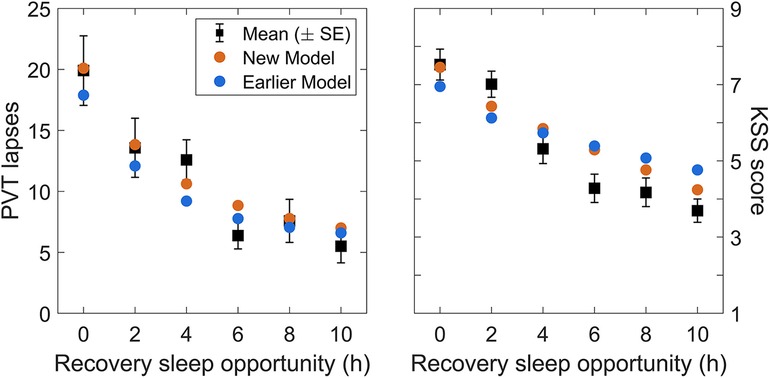
Figure 6. Observations and predictions for neurobehavioral functioning after the dose-response recovery night in validation study Val2. The left panel shows the number of lapses on the PVT and the right panel shows the sleepiness score on the KSS, averaged over time of day (10:00–20:00), for each of the recovery sleep durations investigated in the study. Black dots represent the observations (with error bars indicating ±1 SE). Blue dots represent predictions from the earlier model version (53), and orange dots represent predictions from the modified (new) model.
Validation study Val3 involved five days of restriction to a 4 h daily sleep opportunity followed by an intermittent sleep dose-response intervention day with a sleep opportunity ranging from 0 h to 12 h in duration (day 6). There were then another five days of restriction to a 4 h daily sleep opportunity followed by two days with 10 h recovery sleep (days 12 and 13). Figures 7, 8 (left panels) show the group-average PVT and KSS observations, respectively, averaged within days and plotted across days of the study, as a function of the intermittent sleep dose-response intervention condition.4 Because the second recovery day (day 13) contributed only one time point, it is not included in the figures (but it was included in the goodness-of-fit results of Table 4). On the intervention day (day 6), the observations showed a dose-response effect on neurobehavioral functioning, ranging from significant further impairment when the sleep dose was 4 h or less and progressively greater recuperation when the sleep dose was 6 h or more. However, this effect was surprisingly short-lived, and the build-up of neurobehavioral impairment continued across the second five-day sleep restriction period (days 7–11; similar to that observed in Figure 4 for the calibration study Cal2) with only a limited after-effect of the acute response to the intermittent sleep dose (43). Recuperation after the first recovery night (day 12) was incomplete, and residual neurobehavioral impairment was similar between conditions.
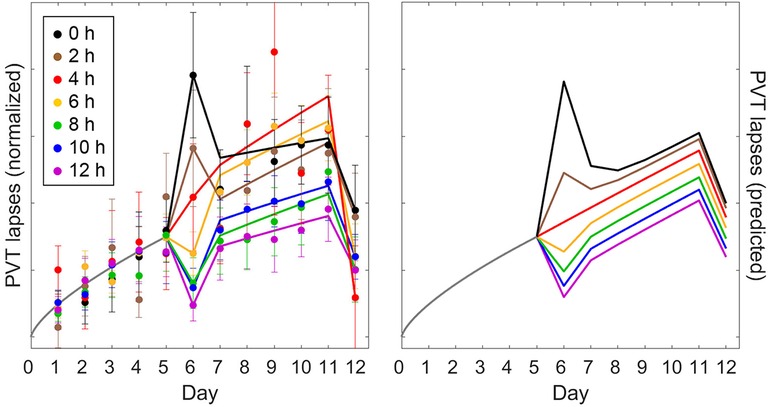
Figure 7. Observations and predictions for PVT performance in the sustained sleep restriction experiment with intermittent dose-response sleep intervention of validation study Val3. The left panel shows the number of lapses on the PVT (day average, 10:00–20:00) as group means ± SE (colored dots and whiskers), expressed relative to baseline (day 0) and normalized across the first five-day period of sleep restriction (days 1–5), plotted on a unitless axis. The curves in the left panel represent statistical model fits serving to better illustrate the temporal patterns.5 The right panel shows the corresponding predictions of the modified model, anchored at 12:00 (noon) for each day of the study, and scaled commensurate with the normalization of the data. Colors denote the duration of the sleep opportunity for the intermittent dose-response sleep intervention (day 6). Gray curves represent the period from the last baseline day (day 0) through to the end of the first sleep restriction period (day 5), which is common to all study conditions.
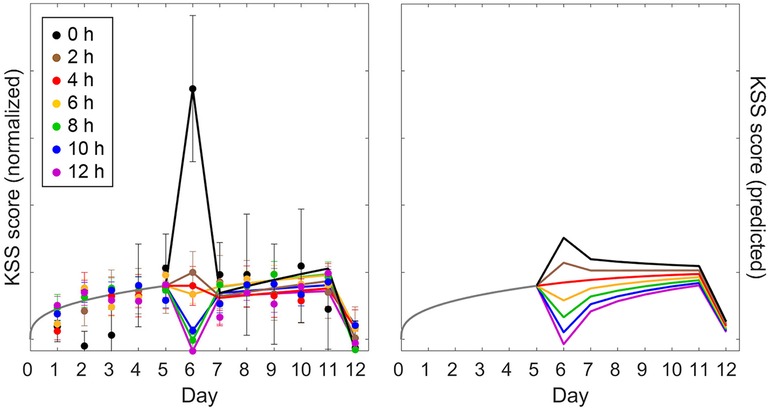
Figure 8. Observations and predictions for KSS sleepiness in the sustained sleep restriction experiment with intermittent dose-response sleep intervention of validation study Val3. The left panel shows the observations for sleepiness score on the KSS (day average, 10:00–20:00); the right panel shows the corresponding predictions of the modified model (anchored at 12:00). Details are otherwise the same as for Figure 7.
Figure 7 (right panel) shows the PVT predictions of the modified model, anchored at 12:00 (noon) for each day of the study. Overall, the model captured the temporal dynamics of PVT performance remarkably well. Predictions for the intermittent sleep dose-response intervention (day 6) captured the data mostly adequately, as would be expected based on the results for validation study Val2 (Figure 6), which was equivalent in study design up to that point. However, in study Val3 the degree of recuperation for the PVT was somewhat underpredicted for the 12 h sleep dose (Figure 7). Also, the differentiation between the conditions in the build-up of PVT performance impairment across the second five-day sleep restriction period (days 7–11) was less pronounced in the model predictions than in the empirical data, although the data were noisy and the general pattern was similar. For the subsequent recovery day (day 12), recuperation of PVT performance was again somewhat underpredicted. Even so, the modified model predicted the PVT data better than the earlier model version (53), as corroborated by the goodness-of-fit statistics in Table 4.
Figure 8 (right panel) shows the corresponding KSS predictions of the modified model. Compared to the PVT predictions in Figure 7 (right panel), there was a marked difference in curvature for the accumulation of neurobehavioral impairment across days, with predictions of PVT impairment increasing near-linearly and predictions of KSS sleepiness leveling out after just a few days—as also seen in the empirical data. This showcases the model's capability to capture such highly differential dynamics within the same biomathematical framework (54). As shown in Figure 8, KSS predictions for the intermittent sleep dose-response intervention (day 6) captured the data mostly adequately; yet, the increase in KSS sleepiness was grossly underpredicted for the 0 h sleep dose, which deviated considerably from the dose-response relationship seen in study Val2 (but notice the comparatively large error bars). In contrast with the PVT (Figure 7), the differentiation between the conditions in the trajectories of KSS sleepiness across the second five-day sleep restriction period (days 7–11) was more pronounced in the model predictions than in the empirical data (Figure 8). For the subsequent recovery day (day 12), recuperation on the KSS appeared to be predicted well for all study conditions. The modified model predicted the KSS data, like the PVT data, better than the earlier model version (53), as corroborated by the goodness-of-fit statistics in Table 4.
3.4 Goodness-of-fit for sleep inertia
Both the earlier model version and the modified model are capable of predicting the effect of sleep inertia on neurobehavioral functioning. However, because of the quick dissipation of sleep inertia in the first few minutes immediately after awakening, precise accounting of the time of awakening based on a sleep recording for each individual person is required to make accurate sleep inertia predictions using the model equations in Table 1. Quantitative validation of sleep inertia predictions was therefore beyond the scope of the present model validation, which was based on group-average data. That said, we examined qualitatively whether the sleep inertia predictions of the modified model were reasonable and not substantially worse than those of the earlier model version, which had been developed specifically for predicting sleep inertia (53).
We considered the group-average PVT and KSS data of the first time point after awakening from the dose-response recovery sleep in validation study Val2 (2–10 h conditions) and compared them to model predictions based on the group-average times of PVT and KSS administrations after the end of the sleep period (as a proxy for individual time awake). Figure 9 shows the results, demonstrating the expected inverse dose-response relationship between recovery sleep duration and the magnitude of sleep inertia in both the observations and the model predictions. Considering the approximations made in this group-average comparison and recognizing that the results were based on a single time point, the observations and model predictions were remarkably close, indicating that the sleep inertia predictions of the modified model were in fact reasonable and not much different from those of the earlier model version.
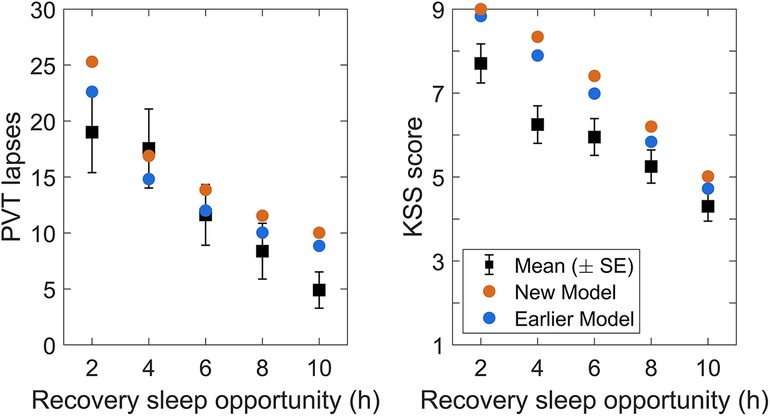
Figure 9. Observations and predictions for sleep inertia after the dose-response recovery night in validation study Val2. The left panel shows the number of lapses on the PVT, and the right panel shows the sleepiness score on the KSS, at the first measurement after awakening, for each of the recovery sleep durations investigated in the study. Black dots represent the observations (with error bars indicating ±1 SE). Blue dots represent predictions from the earlier model version (53), and orange dots represent predictions from the modified (new) model. Note that the KSS sleep inertia prediction for the 2 h recovery sleep dose slightly exceeded the range of the scale and is therefore capped at 9 for plotting.
3.5 Parameter estimates
The parameter estimates obtained during model calibration (using studies Cal1–Cal3) are shown in Table 2. Figure 10 displays parameter distribution plots, which confirmed that the four free parameters (including the one parameter that was added to the model, ζw = ζs) were well defined by the calibration dataset. The one-dimensional marginal probability distributions were all close to normal. The pairwise correlations were between −0.37 and 0.63, suggesting only modest parameter interdependence and alleviating potential concerns about model overspecification with regard to the fitted parameters.
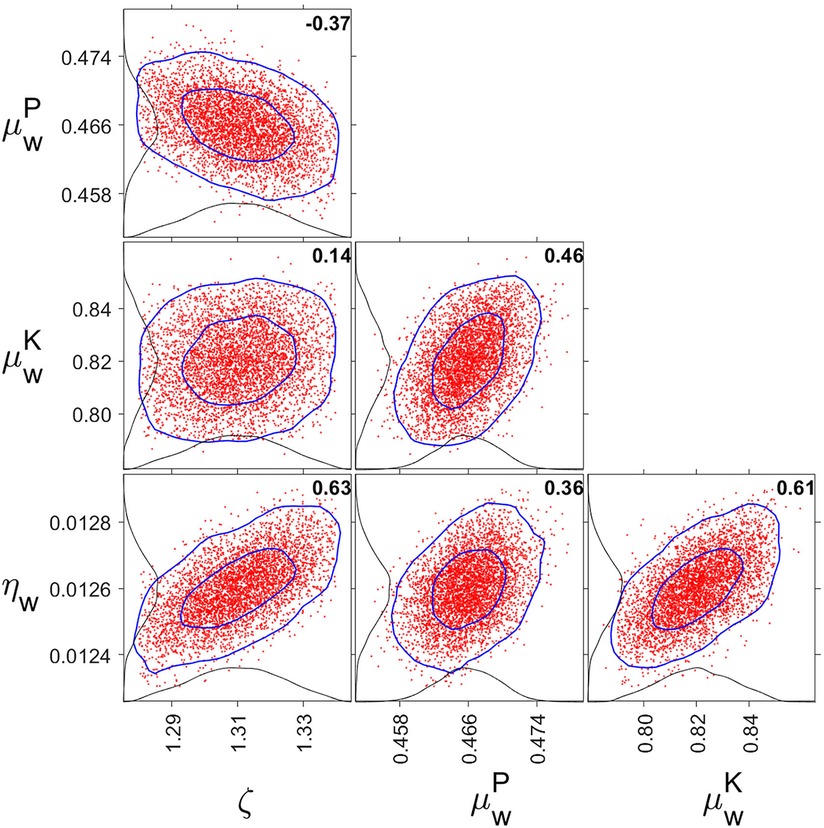
Figure 10. One- and two-dimensional marginal probability distributions for fitted parameter pairs. The red dots are pairs of parameter estimates from the MCMC chain (plotting 5,000 points equally distributed along the chain). The inner and outer blue curves represent contours of the approximate 50% and 95% reliability regions, respectively. The black curves anchored on the axes are the one-dimensional marginal distributions. The bold numbers inside the panels are the pairwise correlations. Tick marks are set at the mean and two standard errors from the mean. Note that ζ = ζw = ζs, and that μw is metric-dependent and differentiated between PVT (P) and KSS (K).
4 Discussion
4.1 Summary of results
4.1.1 The modified model improves the prediction of neurobehavioral recuperation from recovery sleep for different types of sleep loss and better predicts the build-up of impairment from sustained sleep restriction
These improvements were accomplished by including an additional, reciprocal feedback mechanism between the homeostatic and allostatic processes in the model. Using six laboratory sleep deprivation and sleep displacement studies for model calibration and validation, we showed that the addition of a single new model parameter improved the predictions for recuperation due to recovery sleep, and also improved predictions of the build-up of neurobehavioral impairment across days of sustained sleep restriction, without reducing the accuracy of the model otherwise. Furthermore, the modified model preserved the previously developed capability to predict both objective performance impairment and subjective sleepiness, even though these different outcomes exhibit markedly differential dynamics. The modified model may be expected to have enhanced potential as a tool for predicting and managing neurobehavioral functioning and safety in 24/7 operational settings.
4.2 Improved temporal dynamics
4.2.1 The modified model challenges presumed mechanisms of recuperation
Despite more than 50 years of experimental and theoretical research, the recuperative potential of sleep for neurobehavioral functioning remains poorly understood (44). Slow wave sleep (SWS) and the associated high-intensity EEG delta power (∼1–4 Hz) appear to take priority over rapid eye movement (REM) sleep in the typical sleep pattern of healthy adults (35, 65), and SWS is highly preserved under conditions of sleep restriction and circadian displacement (42, 62, 66, 67). As such, SWS is commonly assumed to be the most restorative aspect of sleep (68). However, this assumption is called into question by the near absence of a dynamic response of SWS and EEG delta power to sustained sleep restriction (42, 69), in contrast with the strong rebound effect after acute total sleep deprivation (42, 70). Sleep dose-response studies have suggested a more straightforward relationship between sleep and neurobehavioral functioning based simply on the total sleep duration per circadian cycle (42, 71), but biomathematical scrutiny has shown that perspective to be incomplete (51). Rather, it appears that the recuperative potential of sleep depends at least in part on long-term sleep history (43, 56, 72). This may involve both neuronal (73, 74) and astrocytic (75, 76) mechanisms and may or may not be reflected in any biomarkers of sleep examined to date (77, 78).
4.2.2 Data and modeling results suggest reciprocal feedback between homeostatic and allostatic processes
Under conditions of acute total sleep deprivation there is a rapid build-up of neurobehavioral impairment, but there is also a high rate of recuperation during recovery sleep (Figure 3). By contrast, under conditions of sustained sleep restriction there is a more gradual build-up of neurobehavioral impairment, but the rate of recuperation during recovery sleep is diminished (Figure 4). These sleep schedule-dependent dynamics are represented in earlier versions of our biomathematical model of fatigue featuring a positive feedback mechanism between a homeostatic process and a slower allostatic process (51–54). The inclusion of this important regulatory mechanism notwithstanding, the earlier model versions underestimate the rate of recuperation during recovery after acute total sleep deprivation. They also underestimate the rate of recuperation during recovery after consecutive days of sleep restriction—after first underestimating the accumulation of neurobehavioral impairment across those sleep restriction days, especially when the prior sleep was restricted to 4 h daily. Here, through the addition of a single model parameter, we aimed to address these issues by inclusion of a second, reciprocal feedback mechanism, while keeping the model within the same, larger class of models from which it was originally derived (51, 57) in order to retain its previously established useful properties.
4.2.3 Modifying the model led to multi-faceted improvements in predictions
For both objective performance on the PVT and subjective sleepiness on the KSS, the previous model versions’ underestimation of the rate of recuperation during recovery after acute total sleep deprivation was resolved (Figure 3). The previous underestimation of recuperation during recovery sleep after consecutive days of sustained sleep restriction was also largely resolved (Figures 4, 6–8), although recuperation on the PVT was still somewhat underestimated after consecutive days of sleep restriction to 4 h (Figures 4, 7). The accumulation of PVT impairment across days of sleep restriction to 4 h was itself more accurately predicted, leaving only the 6 h condition to be improved in that regard (Figure 4). Additionally, there were improvements in the prediction of neurobehavioral functioning at baseline (Figures 3, 5) and across rested control conditions (Figures 4, 5), especially for KSS sleepiness.
4.2.4 Previously established model characteristics were retained
The modified model retained important properties of the earlier model version in areas where accurate predictions had already been achieved. This included the effects of time awake and time of day during acute total sleep deprivation (Figure 3); the differentiation in the degree of non-linearity in changes across days of sleep restriction for the PVT vs. the KSS (Figures 4, 7 vs. Figure 8); and the magnitude of sleep inertia after awakening (Figure 9), although the latter is somewhat overpredicted on the KSS in both the modified model and the earlier model version. There is still room for improvement in the modified model in terms of the amplitude of circadian rhythmicity after more than 24 h of acute total sleep deprivation (Figure 3), and the level of impairment on the PVT during simulated day and night shift schedules is still somewhat over predicted (Figure 5). And while the modified model captures the overall dynamics of neurobehavioral impairment across days with sustained sleep restriction and an intermittent sleep dose-response intervention well (Figures 7, 8), the unexpectedly large KSS sleepiness response to the intermittent 0 h sleep dose remains unexplained.
4.3 Theoretical interpretation
4.3.1 The allostatic process influences the rate of recuperation from recovery sleep
The positive feedback mechanism represented in the earlier versions of our biomathematical model involves the allostatic process (u) modulating the dynamics of the homeostatic process (p) by shifting its equilibrium set point (51). During wakefulness, this causes the asymptote toward which the homeostatic process increases to gradually incline; and during sleep, it causes the asymptote toward which the homeostatic process decreases to gradually decline. During a period of one or two days of acute total sleep deprivation, the increase in the homeostatic process is substantial and neurobehavioral impairment may be considerable, while the change in the homeostatic equilibrium set point in such a short timeframe is comparatively small. Recuperation from acute total sleep deprivation during recovery sleep is therefore relatively fast. By contrast, across a number of days of sustained sleep restriction, the incremental increase in the homeostatic process from day to day is modest, but over consecutive days the allostatic process produces a notable incline in the equilibrium set point, which causes neurobehavioral impairment to accumulate. Furthermore, across subsequent days with recovery sleep, it takes time for the allostatic process to decline substantially, which limits the rate by which recuperation from sustained sleep restriction can occur.
4.3.2 The added feedback mechanism modulates the dynamics of the allostatic process
Earlier model versions with only the one positive feedback mechanism underestimated recuperation during recovery after acute total sleep deprivation and after sustained sleep restriction, and it underestimated the accumulation of neurobehavioral impairment across consecutive days of sleep restriction. The additional feedback mechanism in the modified model largely remediates these limitations by modulating the wake-based incline and sleep-based decline of the allostatic process. Per the term in square brackets in Equations (T1-2), this modulation occurs in proportion to the difference between the homeostatic (p) and allostatic (u) processes (and controlled in part by the new parameter ζw = ζs), as illustrated in Figure 11. When the homeostatic process is elevated considerably but the allostatic process is elevated only modestly, given that the rate constant ηw in Equations (T1-2a) is positive and thus –ηw is negative, the result is a dampening of the growth of the allostatic process during wakefulness. This allows for recuperation from acute total sleep deprivation during recovery sleep to be even faster in the modified model, thereby addressing the underestimation of recuperation after acute total sleep deprivation in the earlier model versions. On the other hand, when the allostatic process is elevated considerably and the difference between the homeostatic and allostatic processes is therefore reduced, as is the case after sustained sleep restriction, the growth of the allostatic process is less tempered. This allows for greater build-up of neurobehavioral impairment during sustained sleep restriction, thereby addressing the underestimation of the accumulation of neurobehavioral impairment across consecutive days of sleep restriction in the earlier model versions. Finally, given that the rate constant ηs in Equations (T1-2b) is positive, the decline of the allostatic process during sleep is somewhat accelerated in the modified model compared to the earlier model versions. To some degree this also addressed the previous underestimation of recuperation after sustained sleep restriction.
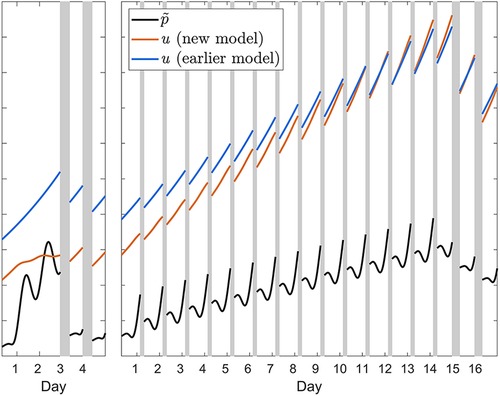
Figure 11. Illustration of the effect of the additional feedback mechanism in the modified (new) model. The orange curves show the waking build-up of the allostatic process u from Equation (T1-2a) in calibration study Cal1 involving 62 h of acute total sleep deprivation followed by two recovery days (left panel); and in the 4 h condition of calibration study Cal2 involving fourteen days of sleep restriction followed by two recovery days (right panel). The black curves show the associated homeostatically driven dynamics of waking PVT performance (number of lapses), with the effect of sleep inertia process h omitted, from Equation 4—multiplied by scaling factor ξu and newly introduced parameter ζw—plotted on the same, unitless axis. The difference between the orange and black curves represents the term in square brackets in Equation (T1-2a), which modulates the wakefulness-based incline of the allostatic process. The impact of the modulation can be appreciated by comparing to the waking temporal profile of the allostatic process u in the previous model version (53), which did not have this additional feedback mechanism, as represented by the blue curves. During sleep, the same principle applies (not shown in the figure). Note that the initial values of each of the curves in both panels are determined by the prior baseline conditions, which involved a 10 h daily sleep opportunity in study Cal1 (left panel) and an 8 h daily sleep opportunity in study Cal2; the difference between models in the initial values of u (orange versus blue curves) reflects the improved recovery dynamics of the modified model, predicting baseline sleep to be more recuperative. Gray bars indicate sleep opportunities.
4.4 Molecular underpinnings
4.4.1 The biomathematical model may represent adenosinergic mechanisms
There is a plethora of molecular substrates for sleep/wake regulation and its impact on neurobehavioral functioning (78–81). The neuromodulator adenosine appears to be pivotal, with the interplay between adenosine and its receptors providing a basis for sleep homeostasis (82, 83), long-term (use-dependent and allostatic) dynamics (84, 85), waking function (86, 87), and sleep inertia (88, 89). Adenosine is a metabolic (by) product of brain energy metabolism (90) and has been implicated in a cascade of sleep regulatory substances (85), and adenosine and adenosine A1 receptor availability may be rate-limiting drivers of the pharmacokinetics of sleep/wake regulation and neurobehavioral functioning. Both extracellular adenosine and adenosine A1 receptor density change dynamically with sleep loss and recovery sleep (84, 90–92); and sleep loss-induced increases in extracellular adenosine lead to concomitant increases in A1 receptor expression, implicating positive feedback regulation (93). As such, the effects of sleep loss and recovery sleep on neurobehavioral functioning may be understood in terms of adenosine binding to receptors that are up- and down-regulated dynamically across sleep/wake cycles. We incorporated this positive feedback mechanism in our biomathematical model of fatigue early on (51) and postulated that extracellular adenosine flux is represented by p (as well as the much faster sleep inertia process h) while adenosine receptor density is represented by u (51, 53).
4.4.2 The added feedback mechanism may also be adenosinergic
In this framework, the additional feedback mechanism added in the present model modification may be understood in terms of the availability of adenosine receptors for binding (92), which would be captured by the p vs. u difference term in the square brackets of Equations (T1-2). Through this additional mechanism, increased adenosine production during extended wakefulness would cause increased sleep homeostatic pressure, leading to neurobehavioral impairment, as well as upregulation of the A1 receptor—but the latter would be modulated by receptor availability (through the additional feedback mechanism). The receptor upregulation would enhance sensitivity to sleep loss on subsequent days (56, 93), which could be interpreted as an allostatic adaptation decoupled from sleep/wake regulation itself (51, 86) and would cause cumulative neurobehavioral impairment across days of sustained sleep restriction as a consequence. Receptor downregulation during consecutive recovery sleep periods would reverse this process. To the extent that such a mapping of model components to adenosinergic substrates resembles a simplified version of reality, it seems plausible that the regulation of adenosine and its receptor could explain the main dynamics observed in our calibration and validation sets.
4.4.3 The bidirectionality of the feedback mechanisms appears to be essential
In another adenosine-based model, a conceptual approach comparable to ours has been pursued (94). That model produces similar dynamics based on a feedback mechanism involving adenosine receptor upregulation in response to adenosine production—but does not contain the same dual feedback mechanisms. While that model provides reasonable estimates of the accumulation of impairment across days of sustained sleep restriction and recuperation during subsequent recovery days, it is not clear how well it captures the different recuperation rates after sustained sleep restriction vs. acute total sleep deprivation. Moreover, that model does not feature a bifurcation differentiating the neurobehavioral response to sustained sleep restriction for daily amounts of wakefulness less than or greater than a critical amount Wc (see Table 2), and therefore does not produce the escalation of neurobehavioral impairment that has been observed when daily sleep is restricted too severely (41, 51). As such, the assumption of bidirectional feedback regulation between adenosine and its receptor, which was first proposed in the context of neurobehavioral functioning and local sleep (95) and first implemented in the present model modification, appears to be essential to capture a wider range of dynamic behaviors pertaining to neurobehavioral functioning, sleep loss, and recovery sleep.
4.5 Limitations
4.5.1 Generalizability may be limited and real-world validation is needed
Our focus was on adenosinergic mechanisms on which the biomathematical model was based from the outset (51), but other regulatory processes, such as cortical waste clearance through the glymphatic system (96), have been proposed to be involved in the recuperative potential of recovery sleep as well (97) and could generate similar dynamics (98); we did not explore this here. Another important caveat for our findings is that the population from which we sampled in all six calibration and validation studies was comprised of healthy young adults. While that may be applicable for many of the operational settings where the modified model could be deployed, we do not know to what extent our findings generalize to other age categories and to individuals with sleep/circadian or other medical disorders. The modified model also needs to be validated in real-world operations before being deployed as a fatigue risk management tool. It should be recognized that the model seeks to predict basal fatigue levels in the absence of aggravating or mitigating conditions, such as the use of fatigue countermeasures (e.g., caffeine intake), and without accounting for inter-individual differences. It is generally recommended, therefore, to use the model to make relative comparisons of predicted fatigue—e.g., in order to decide between different work schedules—rather than to rely on absolute levels of predicted fatigue for managing fatigue risk (99).
4.6 Practical implications
4.6.1 Prior sleep/wake history has long-term influence
Over the last two decades, studies have provided new insights into the long-term dynamics of neurobehavioral impairment due to sleep loss and recuperation due to recovery sleep (41, 42, 46, 71, 72, 100–103). Studies in adults (43) and adolescents (104) have revealed a need to differentiate between short-term and long-term recuperation of neurobehavioral functioning. As shown in Figures 7, 8, extended sleep for recovery may provide recuperation to near-baseline performance levels acutely—but if prior sleep loss was incurred through sustained partial sleep restriction (as opposed to acute total sleep deprivation), a lingering sensitivity to further sleep loss remains. This dependence of sleep/wake neurobiology on its history, which is referred to as hysteresis, appears to be a fundamental aspect of the regulation of neurobehavioral functioning (43). This makes sense given the involvement of (at least) two interacting sleep/wake regulatory processes operating at timescales of a day or longer: the homeostatic process (represented by p) and the allostatic process (represented by u). The feedback mechanisms between the two processes confer hysteresis in the model dynamics.
4.6.2 This research suggests a need to differentiate between acute and sustained recuperation
Full recuperation from prior sleep loss requires restoration to baseline levels of both the faster homeostatic process—which we may call acute recuperation—and the slower allostatic process—which we may call sustained recuperation. As acute recuperation may be largely achieved within a day or two but sustained recuperation typically cannot, individuals facing repeated cycles of sustained sleep restriction punctuated by brief periods of catch-up sleep may experience a false sense of readiness to perform based on incomplete (acute-only) recuperation. This can create fatigue-related risks to cognitive function, safety, and health in a wide range of work settings. In many such settings, critical scheduling decisions are made regarding the duration of time off needed before workers can be expected to return to the work floor and considered fit for duty (26). A biomathematical model of fatigue that can make quantitative, trustworthy predictions of acute and sustained recuperation of neurobehavioral functioning, as we aimed to develop in this paper, is therefore an important tool for fatigue risk management in many operational settings.
4.6.3 The modified model may support predictive, proactive, and reactive phases of work scheduling
Biomathematical modeling has a range of applications in operational contexts (105), including (but not limited to) a predictive work scheduling phase in which possible schedules are compared to distinguish those that cause the least and most fatigue risk; a proactive work scheduling phase in which situations that could lead to neurobehavioral impairment are identified and mitigated during the day of operations; and a reactive work scheduling phase in which fatigue encountered during the day of operations is evaluated posthoc in order to improve future work scheduling practices (106). In all three phases, the modified model can advise workers and schedulers of the potential impacts of scheduling decisions and how improvements in fatigue-related risks can most likely be achieved. With the modified model, the long-term influence of prior sleep/wake history is accounted for more accurately, which puts greater emphasis on strategic planning and advance preparation for work as a viable strategy to mitigate risks. This in turn should help to improve performance and safety in the workplace.
Data availability statement
The data analyzed in this study is subject to the following licenses/restrictions: The study data are available from the corresponding authors upon reasonable request. Requests to access these datasets should be directed toaHZkQHdzdS5lZHU=.
Ethics statement
The studies involving humans were approved by the Institutional Review Board of Washington State University (studies Cal1, Cal3, and Val1) and the Institutional Review Board of the University of Pennsylvania (studies Cal2, Val2, and Val3). The studies were conducted in accordance with the local legislation and institutional requirements. The participants provided their written informed consent to participate in this study.
Author contributions
MM: Data curation, Formal Analysis, Investigation, Methodology, Software, Validation, Visualization, Writing – original draft, Writing – review & editing. PM: Conceptualization, Data curation, Formal Analysis, Investigation, Methodology, Software, Validation, Visualization, Writing – original draft, Writing – review & editing. LK: Conceptualization, Formal Analysis, Methodology, Supervision, Writing – review & editing. SB: Investigation, Writing – review & editing. DD: Funding acquisition, Investigation, Writing – review & editing. HV: Conceptualization, Data curation, Funding acquisition, Investigation, Project administration, Resources, Supervision, Writing – original draft, Writing – review & editing.
Funding
The author(s) declare that financial support was received for the research, authorship, and/or publication of this article.
Model development was supported by Federal Express Corporation. Datasets used for calibration and validation were drawn from studies supported by Congressionally Directed Medical Research Programs award W81XWH-05-1-0099 (study Cal1), National Institutes of Health grants R01NR04281 (studies Cal2 and Val2) and R01HL105768 (study Val1), Federal Motor Carrier Safety Administration contract DTMC75-07-D-00006 (study Cal3), and a National Space Biomedical Research Institute grant through NASA NCC 9-58 (study Val3).
Conflict of interest
The authors declare the research was conducted in the absence of any commercial or financial relationships that could be construed as a potential conflict of interest.
Footnotes
1Here “fatigue” is a term conventionally used in operational settings to refer to neurobehavioral impairment, or more specifically “a state of reduced mental or physical performance capability, resulting from sleep loss or extended wakefulness, circadian rhythmicity, workload, or other factors” (26); see https://www.icao.int/safety/fatiguemanagement/FRMS%20Tools/FRMS%20Implementation%20Guide%20for%20Operators%20July%202011.pdf.
2Sleep inertia refers to a transient period of lingering neurobehavioral impairment and disorientation, which manifests immediately after waking up (107) and then decays exponentially, largely dissipating within an hour (108).
4For graphical presentation, the data in Figures 7, 8 were expressed relative to baseline (day 0) and normalized to the build-up of neurobehavioral impairment across the first five-day sleep restriction period common to all study conditions (days 1–5). This accounts for systematic inter-individual differences (109) and more clearly exposes the dynamics during and after the intermittent sleep dose-response intervention day (43).
3Two model parameters that are highly influential with regard to the growth and decay dynamics of the model (52) were refit: ηw (which through Equation (9) also altered ηs) and µw (cf. Table 2).
5Non-linear mixed-effects regression models (110) with discontinuities at the sleep dose-response intervention day and the first recovery day, and condition-specific offsets and rates of change across the second five-day sleep restriction period, are used for visualization of the temporal patterns (43).
Publisher's note
All claims expressed in this article are solely those of the authors and do not necessarily represent those of their affiliated organizations, or those of the publisher, the editors and the reviewers. Any product that may be evaluated in this article, or claim that may be made by its manufacturer, is not guaranteed or endorsed by the publisher.
References
1. Hirshkowitz M, Whiton K, Albert SM, Alessi C, Bruni O, DonCarlos L, et al. National sleep foundation’s updated sleep duration recommendations: final report. Sleep Health. (2015) 1:233–43. doi: 10.1016/j.sleh.2015.10.004
2. Watson NF, Badr MS, Belenky G, Bliwise DL, Buxton OM, Buysse D, et al. Recommended amount of sleep for a healthy adult: a joint consensus statement of the American academy of sleep medicine and sleep research society. Sleep. (2015) 38:843–4. doi: 10.5665/sleep.4716
3. Chattu VK, Manzar MD, Kumary S, Burman D, Spence DW, Pandi-Perumal SR. The global problem of insufficient sleep and its serious public health implications. Healthcare (Basel). (2018) 7:1. doi: 10.3390/healthcare7010001
4. Wong IS, Dawson D, Van Dongen HPA. International consensus statements on non-standard working time arrangements and occupational health and safety. Ind Health. (2019) 57:135–8. doi: 10.2486/indhealth.57_202
5. Byun E, Lerdal A, Gay CL, Lee KA. How adult caregiving impacts sleep: a systematic review. Curr Sleep Med Rep. (2016) 2:191–205. doi: 10.1007/s40675-016-0058-8
6. Basner M, Fomberstein KM, Razavi FM, Banks S, William JH, Rosa RR, et al. American time use survey: sleep time and its relationship to waking activities. Sleep. (2007) 30:1085–95. doi: 10.1093/sleep/30.9.1085
7. Steger B. Sleeping through class to success: Japanese notions of time and diligence. Time Soc. (2006) 15:197–214. doi: 10.1177/0961463X06066952
8. Tselha T, Whitehurst LN, Yetton BD, Vo TT, Mednick SC. Morning stimulant administration reduces sleep and overnight working memory improvement. Behav Brain Res. (2019) 370:111940. doi: 10.1016/j.bbr.2019.111940
9. McEwen BS. Protective and damaging effects of stress mediators: central role of the brain. Dialogues Clin Neurosci. (2006) 8:367–81. doi: 10.31887/DCNS.2006.8.4/bmcewen
10. Dresp-Langley B, Hutt A. Digital addiction and sleep. Int J Environ Res Public Health. (2022) 19:6910. doi: 10.3390/ijerph19116910
11. Shochat T. Impact of lifestyle and technology developments on sleep. Nat Sci Sleep. (2012) 4:19–31. doi: 10.2147/NSS.S18891
12. Phillips AJK, Clerx WM, O’Brien CS, Sano A, Barger LK, Picard RW, et al. Irregular sleep/wake patterns are associated with poorer academic performance and delayed circadian and sleep/wake timing. Sci Rep. (2017) 7:3216. doi: 10.1038/s41598-017-03171-4
13. Chaput JP, Dutil C, Featherstone R, Ross R, Giangregorio L, Saunders TJ, et al. Sleep timing, sleep consistency, and health in adults: a systematic review. Appl Physiol Nutr Metab. (2020) 45(10 Suppl. 2):S232–47. doi: 10.1139/apnm-2020-0032
14. Windred DP, Burns AC, Lane JM, Saxena R, Rutter MK, Cain SW, et al. Sleep regularity is a stronger predictor of mortality risk than sleep duration: a prospective cohort study. Sleep. (2023) 47:zsad253. doi: 10.1093/sleep/zsad253
15. Barasnwal N, Yu PK, Siegel NS. Sleep physiology, pathophysiology, and sleep hygiene. Prog Cardiovasc Dis. (2023) 77:59–69. doi: 10.1016/j.pcad.2023.02.005
16. Sletten TL, Weaver MD, Foster RG, Gozal D, Klerman EB, Rajaratnam SMW, et al. The importance of sleep regularity: a consensus statement of the national sleep foundation sleep timing and variability panel. Sleep Health. (2023) S2352-7218(23):00166–3. doi: 10.1016/j.sleh.2023.07.016
18. Killick R, Hoyos CM, Melehan KL, Dungan GC 2nd, Poh J, Liu PY. Metabolic and hormonal effects of ‘catch-up’ sleep in men with chronic, repetitive, lifestyle-driven sleep restriction. Clin Endocrinol (Oxf). (2015) 83:498–507. doi: 10.1111/cen.12747
19. Leger D, Richard JB, Collin O, Sauvet F, Faraut B. Napping and weekend catchup sleep do not fully compensate for high rates of sleep debt and short sleep at a population level (in a representative nationwide sample of 12,637 adults). Sleep Med. (2020) 74:278–88. doi: 10.1016/j.sleep.2020.05.030
20. Onninen J, Pylkkönen M, Tolvanen A, Sallinen M. Accumulation of sleep loss among shift-working truck drivers. Chronobiol Int. (2021) 38:13–53. doi: 10.1080/07420528.2021.1929280
21. Åkerstedt T. Sleep/wake disturbances in working life. Electroencephalogr Clin Neurophysiol. (1987) 39(Suppl):360–3.
22. Sallinen M, Härmä M, Mutanen P, Ranta R, Virkkala J, Müller K. Sleep-wake rhythm in an irregular shift system. J Sleep Res. (2003) 12:103–12. doi: 10.1046/j.1365-2869.2003.00346.x
23. Shriane AE, Rigney G, Ferguson SA, Bin YS, Vincent GE. Healthy sleep practices for shift workers: consensus sleep hygiene guidelines using a delphi methodology. Sleep. (2023) 46:zsad182. doi: 10.1093/sleep/zsad182
24. Satterfield BC, Van Dongen HPA. Occupational fatigue, underlying sleep and circadian mechanisms, and approaches to fatigue risk management. Fatigue Biomed Health Behav. (2013) 1:118–36. doi: 10.1080/21641846.2013.798923
25. Moreno CRC, Marqueze EC, Sargent C, Wright Jr KP, Ferguson SA, Tucker P. Working time society consensus statements: evidence-based effects of shift work on physical and mental health. Ind Health. (2019) 57:139–57. doi: 10.2486/indhealth.SW-1
26. Gurubhagavatula I, Barger LK, Barnes CM, Basner M, Boivin DB, Dawson D, et al. Guiding principles for determining work shift duration and addressing the effects of work shift duration on performance, safety, and health: guidance from the American academy of sleep medicine and the sleep research society. Sleep. (2021) 44:zsab161. doi: 10.1093/sleep/zsab161
27. Jay SM, Lamond N, Ferguson SA, Dorrian J, Jones CB, Dawson D. The characteristics of recovery sleep when recovery opportunity is restricted. Sleep. (2007) 30:353–60. doi: 10.1093/sleep/30.3.353
28. Simpson NS, Diolombi M, Scott-Sutherland J, Yang H, Bhatt V, Gautam S, et al. Repeating patterns of sleep restriction and recovery: do we get used to it? Brain Behav Immun. (2016) 58:142–51. doi: 10.1016/j.bbi.2016.06.001
30. Daan S, Beersma DG, Borbély AA. Timing of human sleep: recovery process gated by a circadian pacemaker. Am J Physiol. (1984) 246(2 Pt 2):R161–83. doi: 10.1152/ajpregu.1984.246.2.R161
31. Borbély AA, Achermann P. Sleep homeostasis and models of sleep regulation. J Biol Rhythms. (1999) 14:557–68. doi: 10.1177/074873099129000894
32. Van Dongen HPA, Dinges DF. Sleep, circadian rhythms, and psychomotor vigilance. Clin Sports Med. (2005) 24:237–49. doi: 10.1016/j.csm.2004.12.007
33. Jewett ME, Dijk DJ, Kronauer RE, Dinges DF. Dose-response relationship between sleep duration and human psychomotor vigilance and subjective alertness. Sleep. (1999) 22:171–9. doi: 10.1093/sleep/22.2.171
34. Rosa RR, Bonnet MH, Warm JS. Recovery of performance during sleep following sleep deprivation. Psychophysiology. (1983) 20:152–9. doi: 10.1111/j.1469-8986.1983.tb03281.x
35. Åkerstedt T, Gillberg M. A dose-response study of sleep loss and spontaneous sleep termination. Psychophysiology. (1986) 23:293–7. doi: 10.1111/j.1469-8986.1986.tb00635.x
36. Doran SM, Van Dongen HPA, Dinges DF. Sustained attention performance during sleep deprivation: evidence of state instability. Arch Ital Biol. (2001) 139:253–67.11330205
37. Drake CL, Roehrs TA, Burduvali E, Bonahoom A, Rosekind M, Roth T. Effects of rapid versus slow accumulation of eight hours of sleep loss. Psychophysiology. (2001) 38:979–87. doi: 10.1111/1469-8986.3860979
38. Van Dongen HPA, Rogers NL, Dinges DF. Sleep debt: theoretical and empirical issues. Sleep Biol Rhythms. (2003) 1:5–13. doi: 10.1046/j.1446-9235.2003.00006.x
39. Carskadon MA, Dement WC. Cumulative effects of sleep restriction on daytime sleepiness. Psychophysiology. (1981) 18:107–13. doi: 10.1111/j.1469-8986.1981.tb02921.x
40. Dinges DF, Pack F, Williams K, Gillen KA, Powell JW, Ott GE, et al. Cumulative sleepiness, mood disturbance, and psychomotor vigilance performance decrements during a week of sleep restricted to 4–5 h per night. Sleep. (1997) 20:267–77. doi: 10.1093/sleep/20.4.267
41. Belenky G, Wesensten NJ, Thorne DR, Thomas ML, Sing HC, Redmond DP, et al. Patterns of performance degradation and restoration during sleep restriction and subsequent recovery: a sleep dose-response study. J Sleep Res. (2003) 12:1–12. doi: 10.1046/j.1365-2869.2003.00337.x
42. Van Dongen HPA, Maislin G, Mullington JM, Dinges DF. The cumulative cost of additional wakefulness: dose-response effects on neurobehavioral functions and sleep physiology from chronic sleep restriction and total sleep deprivation. Sleep. (2003) 26:117–26. doi: 10.1093/sleep/26.2.117
43. Banks S, Jones CW, McCauley ME, Dorrian J, Basner M, Maislin G, et al. Long-term influence of sleep/wake history on the dynamic neurobehavioral response to sustained sleep restriction. J Sleep Res. (2023):e14117. doi: 10.1111/jsr.14117
44. Guzzetti JR, Banks S. Dynamics of recovery sleep from chronic sleep restriction. Sleep Adv. (2022) 4:zpac044. doi: 10.1093/sleepadvances/zpac044
45. Lamond N, Jay SM, Dorrian J, Ferguson SA, Jones C, Dawson D. The dynamics of neurobehavioural recovery following sleep loss. J Sleep Res. (2007) 16:33–41. doi: 10.1111/j.1365-2869.2007.00574.x
46. Banks S, Van Dongen HPA, Maislin G, Dinges DF. Neurobehavioral dynamics following chronic sleep restriction: dose-response effects of one night for recovery. Sleep. (2010) 33:1013–26. doi: 10.1093/sleep/33.8.1013
47. Herscovitch J, Broughton R. Performance deficits following short-term partial sleep deprivation and subsequent recovery oversleeping. Can J Psychol. (1981) 35:309–22. doi: 10.1037/h0081197
48. Ochab JK, Szwed J, Oleś K, Bereś A, Chialvo DR, Domagalik A, et al. Observing changes in human functioning during induced sleep deficiency and recovery periods. PLoS One. (2021) 16:e0255771. doi: 10.1371/journal.pone.0255771
49. Yamazaki EM, Antler CA, Lasek CR, Goel N. Residual, differential neurobehavioral deficits linger after multiple recovery nights following chronic sleep restriction or acute total sleep deprivation. Sleep. (2021) 44:zsaa224. doi: 10.1093/sleep/zsaa224
50. St. Hilaire MA, Rüger M, Fratelli F, Hull JT, Phillips AJK, Lockley SW. Modeling neurocognitive decline and recovery during repeated cycles of extended sleep and chronic sleep deficiency. Sleep. (2017) 40:zsw009. doi: 10.1093/sleep/zsw009
51. McCauley P, Kalachev LV, Smith AD, Belenky G, Dinges DF, Van Dongen HPA. A new mathematical model for the homeostatic effects of sleep loss on neurobehavioral performance. J Theor Biol. (2009) 256:227–39. doi: 10.1016/j.jtbi.2008.09.012
52. McCauley P, Kalachev LV, Mollicone DJ, Banks S, Dinges DF, Van Dongen HPA. Dynamic circadian modulation in a biomathematical model for the effects of sleep and sleep loss on waking neurobehavioral performance. Sleep. (2013) 36:1987–97. doi: 10.5665/sleep.3246
53. McCauley ME, McCauley P, Kalachev LV, Riedy SM, Banks S, Ecker AJ, et al. Biomathematical Modeling of Fatigue Due to Sleep Inertia. Submitted.
54. McCauley ME, McCauley P, Riedy SM, Banks S, Ecker AJ, Kalachev LV, et al. Fatigue risk management based on self-reported fatigue: expanding a biomathematical model of fatigue-related performance deficits to also predict subjective sleepiness. Transp Res Part F Traffic Psychol Behav. (2021) 79:94–106. doi: 10.1016/j.trf.2021.04.006
55. Rangan S, Riedy SM, Bassett R, Klinck ZA, Hagerty P, Schek E, et al. Predictive and proactive fatigue risk management approaches in commercial aviation. Chronobiol Int. (2020) 37:1479–82. doi: 10.1080/07420528.2020.1803902
56. Grant DA, Van Dongen HPA. Individual differences in sleep duration and responses to sleep loss. In: Shaw PJ, Tafti M, Thorpy MJ, editors. The Genetic Basis of Sleep and Sleep Disorders. Cambridge, UK: Cambridge University Press (2013). p. 189–96. doi: 10.1017/cbo9781139649469.020
57. McCauley P. Fatigue Risk Management: Modeling the Sleep/Wake-Based Dynamics of Performance (Phd thesis). University of Montana, Missoula (2009). ISBN: 9781109550894
58. Dinges DF, Powell JW. Microcomputer analyses of performance on a portable, simple visual RT task during sustained operations. Behav Res Meth Instr Comp. (1985) 17:652–5. doi: 10.3758/bf03200977
59. Åkerstedt T, Gillberg M. Subjective and objective sleepiness in the active individual. Int J Neurosci. (1990) 52:29–37. doi: 10.3109/00207459008994241
60. Dorrian J, Rogers NL, Dinges DF. Psychomotor vigilance performance: neurocognitive assay sensitive to sleep loss. In: Kushida CA, editor. Sleep Deprivation. Clinical Issues, Pharmacology, and Sleep Loss Effects. New York: Marcel Dekker (2005). p. 39–70. doi: 10.3109/9780203998007-4
61. Tucker AM, Whitney P, Belenky G, Hinson JM, Van Dongen HPA. Effects of sleep deprivation on dissociated components of executive functioning. Sleep. (2010) 33:47–57. doi: 10.1093/sleep/33.1.47
62. Van Dongen HPA, Belenky G, Vila BJ. The efficacy of a restart break for recycling with optimal performance depends critically on circadian timing. Sleep. (2011) 34:917–29. doi: 10.5665/SLEEP.1128
63. Whitney P, Hinson JM, Jackson ML, Van Dongen HPA. Feedback blunting: total sleep deprivation impairs decision making that requires updating based on feedback. Sleep. (2015) 38:745–54. doi: 10.5665/sleep.4668
64. Haario H, Laine M, Mira A, Saksman E. DRAM: efficient adaptive MCMC. Stat Comp. (2006) 16:339–54. doi: 10.1007/s11222-006-9438-0
65. Feinberg I, Floyd TC. Systematic trends across the night in human sleep cycles. Psychophysiology. (1979) 16:283–91. doi: 10.1111/j.1469-8986.1979.tb02991.x
66. Webb WB, Agnew HW Jr. The effects on subsequent sleep of an acute restriction of sleep length. Psychophysiology. (1975) 12:367–70. doi: 10.1111/j.1469-8986.1975.tb00002.x
67. Tilley AJ. Recovery sleep at different times of the night following loss of the last four hours of sleep. Sleep. (1985) 8:129–36. doi: 10.1093/sleep/8.2.129
68. Dijk DJ. Regulation and functional correlates of slow wave sleep. J Clin Sleep Med. (2009) 5(2 Suppl):S6–15. doi: 10.5664/jcsm.5.2s.s6
69. Skorucak J, Arbon EL, Dijk DJ, Achermann P. Response to chronic sleep restriction, extension, and subsequent total sleep deprivation in humans: adaptation or preserved sleep homeostasis? Sleep. (2018) 41:zsy078. doi: 10.1093/sleep/zsy078
70. Dijk DJ, Brunner DP, Borbély AA. Time course of EEG power density during long sleep in humans. Am J Physiol. (1990) 258(3 Pt 2):R650–61. doi: 10.1152/ajpregu.1990.258.3.R650
71. Mollicone DJ, Van Dongen HPA, Rogers NL, Dinges DF. Response surface mapping of neurobehavioral performance: testing the feasibility of split sleep schedules for space operations. Acta Astronaut. (2008) 63:833–40. doi: 10.1016/j.actaastro.2007.12.005
72. Rupp TL, Wesensten NJ, Bliese PD, Balkin TJ. Banking sleep: realization of benefits during subsequent sleep restriction and recovery. Sleep. (2009) 32:311–21. doi: 10.1093/sleep/32.3.311
73. Krueger JM, Rector DM, Roy S, Van Dongen HPA, Belenky G, Panksepp J. Sleep as a fundamental property of neuronal assemblies. Nat Rev Neurosci. (2008) 9:910–9. doi: 10.1038/nrn2521
74. Vyazovskiy VV, Harris KD. Sleep and the single neuron: the role of global slow oscillations in individual cell rest. Nat Rev Neurosci. (2013) 14:443–51. doi: 10.1038/nrn3494
75. Halassa MM, Florian C, Fellin T, Munoz JR, Lee SY, Abel T, et al. Astrocytic modulation of sleep homeostasis and cognitive consequences of sleep loss. Neuron. (2009) 61:213–9. doi: 10.1016/j.neuron.2008.11.024
76. Blutstein T, Haydon PG. The importance of astrocyte-derived purines in the modulation of sleep. Glia. (2013) 61:129–39. doi: 10.1002/glia.22422
77. Davis CJ, Clinton JM, Jewett KA, Zielinski MR, Krueger JM. Delta wave power: an independent sleep phenotype or epiphenomenon? J Clin Sleep Med. (2011) 7(5 Suppl):S16–8. doi: 10.5664/JCSM.1346
78. Laing EE, Möller-Levet CS, Dijk DJ, Archer SN. Identifying and validating blood mRNA biomarkers for acute and chronic insufficient sleep in humans: a machine learning approach. Sleep. (2019) 42:zsy186. doi: 10.1093/sleep/zsy186
79. Clinton JM, Davis CJ, Zielinski MR, Jewett KA, Krueger JM. Biochemical regulation of sleep and sleep biomarkers. J Clin Sleep Med. (2011) 7(5 Suppl):S38–42. doi: 10.5664/JCSM.1360
80. Uyhelji HA, Kupfer DM, White VL, Jackson ML, Van Dongen HPA, Burian DM. Exploring gene expression biomarker candidates for neurobehavioral impairment from total sleep deprivation. BMC Genomics. (2018) 19:341. doi: 10.1186/s12864-018-4664-3
81. Oh J, Petersen C, Walsh CM, Bittencourt JC, Neylan TC, Grinberg LT. The role of co-neurotransmitters in sleep and wake regulation. Mol Psychiatry. (2019) 24:1284–95. doi: 10.1038/s41380-018-0291-2
82. Porkka-Heiskanen T, Strecker RE, Thakkar M, Bjørkum AA, Greene RW, McCarley RW. Adenosine: a mediator of the sleep-inducing effects of prolonged wakefulness. Science. (1997) 276:1265–8. doi: 10.1126/science.276.5316.1265
83. Landolt HP. Sleep homeostasis: a role for adenosine in humans? Biochem Pharmacol. (2008) 75:2070–9. doi: 10.1016/j.bcp.2008.02.024
84. Elmenhorst D, Meyer PT, Winz OH, Matusch A, Ermert J, Coenen HH, et al. Sleep deprivation increases A1 adenosine receptor binding in the human brain: a positron emission tomography study. J Neurosci. (2007) 27:2410–5. doi: 10.1523/JNEUROSCI.5066-06.2007
85. Sengupta P, Roy S, Krueger JM. The ATP-cytokine-adenosine hypothesis: how the brain translates past activity into sleep. Sleep Biol Rhythms. (2011) 9(Suppl 1):29–33. doi: 10.1111/j.1479-8425.2010.00463.x
86. Kim Y, Bolortuya Y, Chen L, Basheer R, McCarley RW, Strecker RE. Decoupling of sleepiness from sleep time and intensity during chronic sleep restriction: evidence for a role of the adenosine system. Sleep. (2012) 35:861–9. doi: 10.5665/sleep.1890
87. Urry E, Landolt HP. Adenosine, caffeine, and performance: from cognitive neuroscience of sleep to sleep pharmacogenetics. Curr Top Behav Neurosci. (2015) 25:331–66. doi: 10.1007/7854_2014_274
88. Benington JH, Heller HC. Restoration of brain energy metabolism as the function of sleep. Prog Neurobiol. (1995) 45:347–60. doi: 10.1016/0301-0082(94)00057-o
89. Van Dongen HPA, Price NJ, Mullington JM, Szuba MP, Kapoor SC, Dinges DF. Caffeine eliminates psychomotor vigilance deficits from sleep inertia. Sleep. (2001) 24:813–19. doi: 10.1093/sleep/24.7.813
90. Porkka-Heiskanen T, Alanko L, Kalinchuk A, Stenberg D. Adenosine and sleep. Sleep Med Rev. (2002) 6:321–32. doi: 10.1053/smrv.2001.0201
91. Yanik G, Radulovacki M. REM sleep deprivation up-regulates adenosine A1 receptors. Brain Res. (1987) 402:362–4. doi: 10.1016/0006-8993(87)90046-1
92. Elmenhorst D, Elmenhorst EM, Hennecke E, Kroll T, Matusch A, Aeschbach D, et al. Recovery sleep after extended wakefulness restores elevated A1 adenosine receptor availability in the human brain. Proc Natl Acad Sci U S A. (2017) 114:4243–8. doi: 10.1073/pnas.1614677114
93. Basheer R, Bauer A, Elmenhorst D, Ramesh V, McCarley RW. Sleep deprivation upregulates A1 adenosine receptors in the rat basal forebrain. NeuroReport. (2007) 18:1895–9. doi: 10.1097/WNR.0b013e3282f262f6
94. Phillips AJK, Klerman EB, Butler JP. Modeling the adenosine system as a modulator of cognitive performance and sleep patterns during sleep restriction and recovery. PLoS Comput Biol. (2017) 13:e1005759. doi: 10.1371/journal.pcbi.1005759
95. Van Dongen HPA, Belenky G, Krueger JM. A local, bottom-up perspective on sleep deprivation and neurobehavioral performance. Curr Top Med Chem. (2011) 11:2414–22. doi: 10.2174/156802611797470286
96. Bohr T, Hjorth PG, Holst SC, Hrabětová S, Kiviniemi V, Lilius T, et al. The glymphatic system: current understanding and modeling. iScience. (2022) 25:104987. doi: 10.1016/j.isci.2022.104987
97. Eide PK, Vinje V, Pripp AH, Mardal KA, Ringstad G. Sleep deprivation impairs molecular clearance from the human brain. Brain. (2021) 144:863–74. doi: 10.1093/brain/awaa443
98. Tekieh T, Robinson PA, Postnova S. Cortical waste clearance in normal and restricted sleep with potential runaway tau buildup in Alzheimer’s disease. Sci Rep. (2022) 12:13740. doi: 10.1038/s41598-022-15109-6
99. Riedy S, Hursh SR, Dawson D, Balkin TJ, Van Dongen HPA. Sleep, sleepiness, and performance prediction modeling. In: Kryger M, Roth T, Goldstein CA, editors. Principles and Practice of Sleep Medicine. 7th ed. Philadelphia, PA: Elsevier (2022). p. 780–87.
100. Cohen DA, Wang W, Wyatt JK, Kronauer RE, Dijk DJ, Czeisler CA, et al. Uncovering residual effects of chronic sleep loss on human performance. Sci Transl Med. (2010) 2:14ra3. doi: 10.1126/scitranslmed.3000458
101. Arnal PJ, Sauvet F, Leger D, Van Beers P, Bayon V, Bougard C, et al. Benefits of sleep extension on sustained attention and sleep pressure before and during total sleep deprivation and recovery. Sleep. (2015) 38:1935–43. doi: 10.5665/sleep.5244
102. Lo JC, Lee SM, Teo LM, Lim J, Gooley JJ, Chee MW. Neurobehavioral impact of successive cycles of sleep restriction with and without naps in adolescents. Sleep. (2017) 40:zsw042. doi: 10.1093/sleep/zsw042
103. Smith MG, Wusk GC, Nasrini J, Baskin P, Dinges DF, Roma PG, et al. Effects of six weeks of chronic sleep restriction with weekend recovery on cognitive performance and wellbeing in high-performing adults. Sleep. (2021) 44:zsab051. doi: 10.1093/sleep/zsab051
104. Lo JC, Koa TB, Ong JL, Gooley JJ, Chee MWL. Staying vigilant during recurrent sleep restriction: dose-response effects of time-in-bed and benefits of daytime napping. Sleep. (2022) 45:zsac023. doi: 10.1093/sleep/zsac023
105. Dawson D, Noy YI, Härmä M, Åkerstedt T, Belenky G. Modelling fatigue and the use of fatigue models in work settings. Accid Anal Prev. (2011) 43:549–64. doi: 10.1016/j.aap.2009.12.030
106. Rangan S, Van Dongen HPA. Quantifying fatigue risk in model-based fatigue risk management. Aviat Space Environ Med. (2013) 84:155–7. doi: 10.3357/asem.3455.2013
107. Dinges DF. Are you awake? Cognitive performance and reverie during the hypnopompic state. In: Bootzin RR, Kihlstrom JF, Schacter DL, editors. Sleep and Cognition. Washington, DC: American Psychological Association (1990). p. 159–75. doi: 10.1037/10499-012
108. Achermann P, Werth E, Dijk DJ, Borbély AA. Time course of sleep inertia after nighttime and daytime sleep episodes. Arch Ital Biol. (1995) 134:109–19.8919196
109. Rupp TL, Wesensten NJ, Balkin TJ. Trait-like vulnerability to total and partial sleep loss. Sleep. (2012) 35:1163–72. doi: 10.5665/sleep.2010
Keywords: acute recuperation, sustained recuperation, cognitive performance, subjective sleepiness, acute total sleep deprivation, sustained sleep restriction, circadian misalignment, sleep inertia
Citation: McCauley ME, McCauley P, Kalachev LV, Banks S, Dinges DF and Van Dongen HPA (2024) The dynamics of neurobehavioral impairment and recovery sleep: improved biomathematical modeling for fatigue risk management in operational settings. Front. Environ. Health 3:1362755. doi: 10.3389/fenvh.2024.1362755
Received: 28 December 2023; Accepted: 22 March 2024;
Published: 10 April 2024.
Edited by:
Mikael Sallinen, Finnish Institute of Occupational Health, FinlandReviewed by:
Göran Kecklund, Stockholm University, SwedenJaime Devine, Institutes for Behavior Resources, United States
© 2024 McCauley, McCauley, Kalachev, Banks, Dinges and Van Dongen. This is an open-access article distributed under the terms of the Creative Commons Attribution License (CC BY). The use, distribution or reproduction in other forums is permitted, provided the original author(s) and the copyright owner(s) are credited and that the original publication in this journal is cited, in accordance with accepted academic practice. No use, distribution or reproduction is permitted which does not comply with these terms.
*Correspondence: Hans P. A. Van Dongen aHZkQHdzdS5lZHU=
†These authors share first authorship
‡These authors share senior authorship