 Charlotte Gabel
 Torben Sigsgaard
 Steffen Petersen2,‖
 Grethe Elholm
94% of researchers rate our articles as excellent or good
Learn more about the work of our research integrity team to safeguard the quality of each article we publish.
Find out more
ORIGINAL RESEARCH article
Front. Environ. Health , 12 April 2024
Sec. Housing Conditions and Public Health
Volume 3 - 2024 | https://doi.org/10.3389/fenvh.2024.1358546
This article is part of the Research Topic Women In Environmental Health: Housing Conditions and Public Health View all 4 articles
Background: In social housing buildings, poor indoor air quality (IAQ) has been shown to be more prevalent, and residents living in social housing areas are often more vulnerable and susceptible to adverse health effects from IAQ.
Aim: To examine the state and the association of measured and perceived IAQ, how housing characteristics and residents' behavior are associated with IAQ, and the association with residents' health.
Method: The HOME-Health study is a cross-sectional study among residents living in social housing in Denmark (n = 432). Seasonal measurements examined the IAQ by a 14-day period measuring carbon dioxide (CO2), temperature (TP), relative humidity (RH), and air change rate. Residents' self-reported behavior, comfort, and health were obtained from a structured interview.
Results: Thermal discomfort and draught were the most common challenges. During summer, the mean TP was higher, the mean RH was lower, and residents more frequently reported dry air in homes where it was not possible to create cross ventilation. There were a higher mean CO2 and RH when crowdedness increased, particularly during winter. In addition, the proportion of residents reporting dry air was higher when CO2-level was below 1,000 ppm. When the mean RH-level was above 50%, a higher proportion of residents reported experiencing damp air, and when the mean RH-level was below 40% residents more frequently reported dry air. Perception of bad air quality was higher when the mean CO2-level exceeded 1,000 ppm. Additionally, residents reported being most thermally comfortable when the TP was within the range of 20–20.99°C and least comfortable within a range of 22–22.99°C. The residents' perceived experience of impaired IAQ was associated with negative general health symptoms.
Conclusion: It is key that homes have the capability to create cross ventilation in order to allow for proper ventilation and to avoid overheating. When evaluating IAQ it is important to not only consider the measured parameters but to also include the residents' behavior and perception of IAQ as these both are related to the actual IAQ and associated health effects.
Indoor air quality (IAQ) is a pressing concern of modern life. IAQ impacts the well-being and health of people within their own homes. We spend an increasing portion of our time indoors (1), and furthermore the higher rate of working from home post COVID-19 has increased the numbers of hours some people spend in their homes (2). The IAQ is influenced by a myriad of factors, ranging from the housing typology and construction materials used to the behavior of its occupants (3).
Research has associated poor IAQ to many different symptoms and diseases, such as respiratory ailments (4–7), rhinitis (8), and other issues such as fatigue and lethargy (9). Poor IAQ can also be a driver of discomfort, contributing to a diminished quality of life. Research has shown that the perception of indoor climate also can be associated with negative health outcomes (10–12), which is why it is critical to also include the impact of reported discomfort in the investigation of the effects of IAQ. Creating a better understanding of the perception of IAQ can benefit both construction and building industry strategies and the residents themselves in establishing healthy homes.
The IAQ issues can potentially be more severe when considering social housing, where occupants often are more vulnerable and therefore more susceptible to bad IAQ (13, 14).
The physical condition of most social housing units is poor due to maintenance neglect and inadequate insulation and ventilation issues that compound the IAQ challenges encountered, Consequently, these poor living conditions impact the health and comfort of the occupants (15). Becher et al., found that 31% of private homes built between the 60's and 80's in Norway had moisture or mold issues (16). Daily routines such as candle burning can also affect the IAQ dramatically. Researchers have showed that only a few hours of burning candles elevated residents' daily exposure to harmful airborne particles (17, 18).
In Denmark, many social housing units were built during the 1950's, 60's, and 70's. A large proportion of the existing social housing areas currently need to be renovated due to advanced deterioration (19, 20). This presents a timely opportunity to measure the current state of IAQ within these deteriorated buildings and assess the residents' state of health and comfort and evaluate the effect of the building renovations on improved IAQ.
A review found several studies on the state of IAQ within social housing (13), that focus on measurements of carbon dioxide (CO2), relative humidity (RH), temperature (TP), or air change rate, comfort, behavior, and health. Most of the studies occurred outside Europe (21–32), a small number were conducted in Europe (33–40) and an even smaller number were conducted in the Nordic countries (41–44). Many of the studies are limited by season, since most studies only collect data during one season and therefore did not report on seasonal differences (26, 28, 30–32). Some were carried out during winter (23, 29, 33, 34, 36, 37, 41, 42) and others during summer (11, 21, 31, 35, 38, 39). Furthermore, we lack data on how the size of the dwelling, crowding, and residents' behavior collectively affect IAQ.
In this study, we aim to elucidate the state of measured and perceived IAQ, housing characteristics, and residents' behavior and health living in Danish social housing. The aim is to understand whether measured IAQ is different across housing characteristics and residents' behavior. Moreover, to explore the proportion of measured IAQ, residents' behavior and housing characteristics across perceived IAQ. Additionally, the aim is to explore how these dynamics are associated and the association with residents' health (Figure 1).
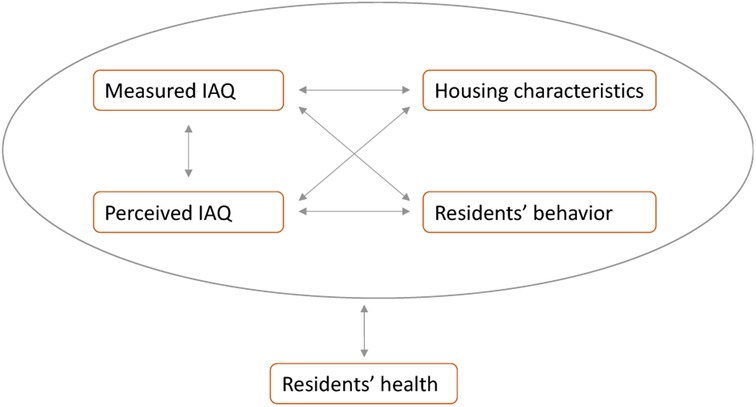
Figure 1. Illustration of the aims. Arrows indicate that the association, distribution or proportion are investigated between variables. The associations are explored for all variables within the grey circle and resident' health.
A detailed description of the HOME-Health study is published elsewhere (45) but it is briefly described here. This part of the HOME-Health study includes the cross-sectional data gathered before the renovation of social housing buildings in two major cities in Denmark. Data was collected both during winter and summer. Winter data was collected during February-April, and summer data was collected during August-September. The winter season was prioritized over the summer season, as participants were expected to stay at home during the winter season and therefore, be more exposed. Data collection was initiated at site 1 in 2016, at site 2 and site 3 in 2017, and at site 4 in 2018. IAQ was measured immediately after the interview and for at least 14 consecutive days logging every five minutes (Figure 2).
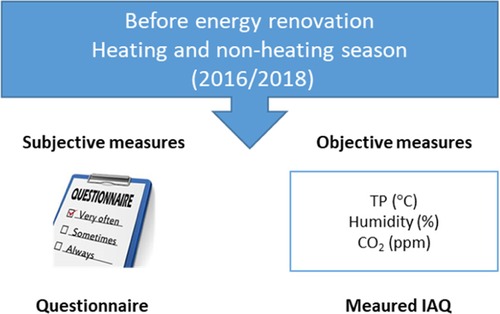
Figure 2. Overview of the HOME-Health study design. TP, temperature; °C, degrees Celsius; CO2, carbon dioxide; ppm, parts per million.
The baseline study population included 432 participants, with 402 of these living in apartments and 30 participants in attached houses. Of the 402 residents living in apartments, seven were new residents. A new resident was a person, who lived in an apartment, where the former resident, included in the study, had lived and vacated the apartment afterwards. The new resident was included in order to obtain follow-up measurements. Data was not collected from all 432 participants during both seasons (Figure 3). Only one participant above the age of 18 was included for each household. Each participant was interviewed by a trained interviewer for the structured interview.
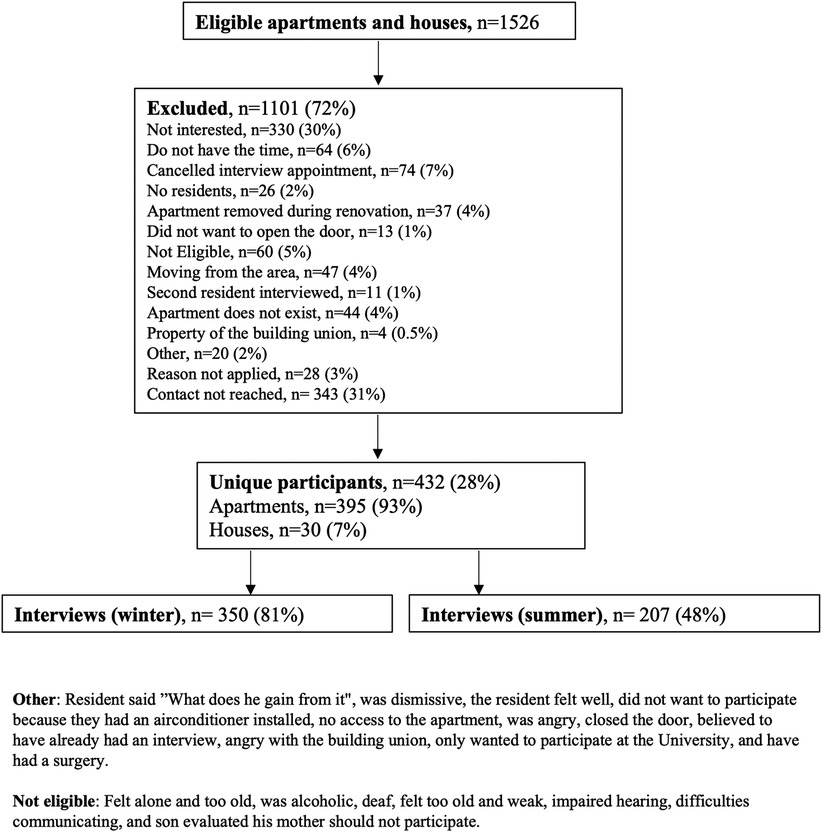
Figure 3. Flowchart of the HOME-Health study population.
The buildings were situated at four different sites. Site 1 was apartments built in 1980s, site 2 was apartments built in between 1968 and 1972, site 3 was apartments and single-floored terraced attached houses built in the 1950s, and site 4 was apartments built in 1950's. The windows of the apartments were primarily mounted facing West and East except for the single-floored terraced attached houses facing North and South. The buildings with apartments were either three, four, or seven stories high, and had a private balcony varying in size. At all sites, the residents carried the expense burdens of heating, water and electricity consumption.
The questionnaire and IAQ measurements were inspired by previous studies carried out in the built environment (46, 47). Furthermore, a pilot study was conducted among 12 participants at site 1 to evaluate the comprehensiveness and understandability of the questionnaire. Few questions were altered before the final questionnaire.
IAQ parameters were defined as CO2 in parts per million (ppm), TP in degrees Celsius (°C), and RH in percentages (%). Air change per hour (ACH) was modelled from CO2 measurements using the mass balance equation for the decay of CO2. A full description of assumptions and modelling can be found elsewhere (45). All measurements were assessed by Tinytag equipment (48, 49) and were carried out in the living room of each home.
Perception of IAQ included air quality, air humidity, air circulation, and thermal comfort. The participants were asked to state their general perception of air humidity, air circulation, and air quality in their home. Participants were asked to state their perception of the thermal comfort in the different rooms of their home. However, for the purpose of this paper only the perception of the thermal comfort in the living room was used, as this was the location of the IAQ measurements.
The household characteristics used for this study were crowdedness, persons per household, possibility to create cross ventilation, and presence of a range hood in the kitchen. Crowdedness is a measure of the number of residents living in the home reported by the surveyed resident and compared to the number of rooms in the home which was provided by the building association. A low crowdedness was defined as fewer residents than the number of rooms, neutral crowdedness was defined as an equal number of rooms and residents, and a high crowdedness was defined as more residents than the number of rooms. A room was equivalent to either a living room or a bedroom. Persons per household were the number of residents living in the apartment permanently. Cross ventilation was only possible in homes with windows mounted on two of the building facades.
The participants were asked to recall their general health symptoms during the past 12 months. Symptoms included watery eyes, sneezing, nose irritation, eye irritation, coughing, wheezing, hoarseness, throat irritation, shortness of breath, sense of chest pressure, dizziness, trouble sleeping, abnormal tiredness, nausea, stomach pain, headache, impaired sense of smell, and skin irritation. The general health symptoms were categorized into five categories: respiratory (hoarseness, throat irritation, coughing, shortness of breath, and sense of chest pressure), ocular (eye irritation and watery eyes), dermal (skin irritation), abdominal (nausea and stomach pain), fatigue (headache, dizziness, trouble sleeping, and abnormal tiredness), and nasal (sneezing, nose irritation, and impaired sense of smell). Participants could rank the frequency of symptoms as; less than twice a month, at least twice a month; at least twice a week; daily; or daily during the pollen season.
Participants were also asked to report their disease status during the past ten years using the criteria of having had the disease at any time point during the 10-year period, whether it was physician diagnosed, and whether the participant was currently ill with the disease at the time of the survey. In this paper, disease is categorized as either yes or no, where “yes” corresponds to “have had the disease the past 10 years,” and/or the disease was diagnosed by a physician and/or the participant being currently ill.
CO2, TP and RH measurements were tested and treated as parametric. Any variable regarding comfort, behavior, and household characteristics were non-parametric except for the distribution of rooms, which was parametric. Prevalence of all included variables is presented in percentages or means with the corresponding standard deviation (±SD). The difference of prevalence between apartments and houses as well as between seasons is tested by a chi-square test and means are tested by an unpaired t-test. The distribution of the mean measured IAQ across housing characteristics and residents' behavior is shown as box plots and the difference between categories are tested with a t-test. The associations are further analyzed by linear regression models presenting the coefficient (β) with a corresponding 95% confidence interval (CI). The proportion of measured IAQ, housing characteristics, and residents' behavior across residents' perceived IAQ is tested by a chi-squared overall test for un-parametric unpaired data. Additionally, the associations are tested by logistic regression. Outcome was perceived IAQ and treated as binary. All variables regarding perceived IAQ have three categories why these variables are modified. A new variable named damp included only those answering damp air or being comfortable was included, the new variable named dry included those expressing dry and comfortable air. The variable draught included only those expressing draught or comfortable air. Still air entailed those experiencing still or comfortable air, and bad air retained those experiencing bad air and those reporting neutral or comfortable air. The variable cold is those being cold or comfortable during winter, where the variable warm is those being warm or comfortable during summer. Prevalence differences between household typologies is presented as percentage points (pp.). Logistic regression analysis is applied testing the association between included variables and residents' health because outcome is treated as binary. Potential covariates are selected a priori. Output is presented as odds ratios (OR) with a corresponding 95% CI. Only results with p < 0.01 are shown. Model 1 is a crude analysis, model 2 is adjusted for smoking status, sex, and age, and model 3 is adjusted for model 2 and relevant diseases according to the outcome of interest. Having no symptoms or symptoms monthly were defined as negative outcomes, whereas weekly, daily or daily during pollen season were defined as positive outcomes. Statistical significance was defined as a p-value below 0.01. All statistical analyses and visualization of data were performed in STATA version 17 (50) or Excel version 17 (51).
Informed consent was obtained from all participants at the start of the interview. At the same time, approval from the Danish Data Protection Agency (2016-051-000001, 1475) was obtained. To comply with the General Data Protection Regulation (GDPR), all interviews were carried out and stored on encrypted platforms (property of Aarhus University).
The demography of the population is presented separately for apartment residents and house residents. In general, more women than men were included in the study. Distribution of gender, age, and occupation within apartments were different from houses. In apartments, most of the included residents were female (55%), below the age of 48 (62%), and either employed (32%), receiving social welfare support (27%) or were students (20%). In houses, most of the included residents were female (73%), above the age of 48 (90%), and retired (83%). Educational attainment was similar between housing typologies (Table 1).
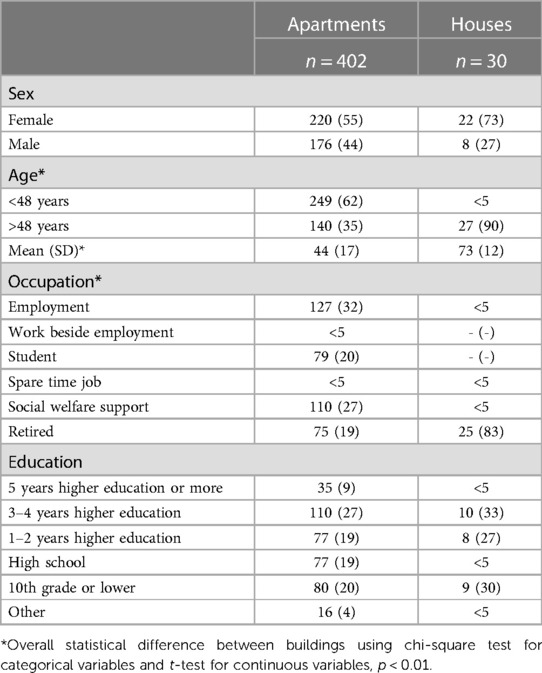
Table 1. Demography stratified by building typology. Percentages might not add up to 100% due to rounding. Values are shown as prevalence (%).
Overall, household characteristics were statistically significant for differences between housing typologies, except for hours spent indoors during the weekend. Crowding was mainly low for both housing typologies, and all the participants spent a large proportion of their time indoors, especially during the weekend. In apartments, households mainly consisted of either one (43%) or two persons (30%), and were mainly three-room apartments (55%), and crowdedness was mainly low (66%). Houses consisted of at least four rooms with a maximum of two residents, equivalent to low crowdedness in all houses. On average, the apartment residents had lived in the homes for eight (±10) years, and 57% expected to stay after the building renovation. Residents living in houses had resided far longer in their homes (24 years, ±19), and significantly more of them expected to stay after the building renovation (90%). Half of the population stayed indoors less than 16 h a day during the week (48%), and the rest stayed indoors more than 16 h (50%). Usually, residents living in houses stayed indoors more than 16 h or day (83%). A range hood was installed in 52% of the apartments but in almost all houses (97%) (Table 2). In apartments, wall-to-wall carpets were less common compared to houses (14% vs. 50%), and wooden floors were more common (75% vs. 33%). Both apartments and houses had either painted wallpaper or wallpaper (95% vs. 100%, respectively) (Supplementary Table S1).
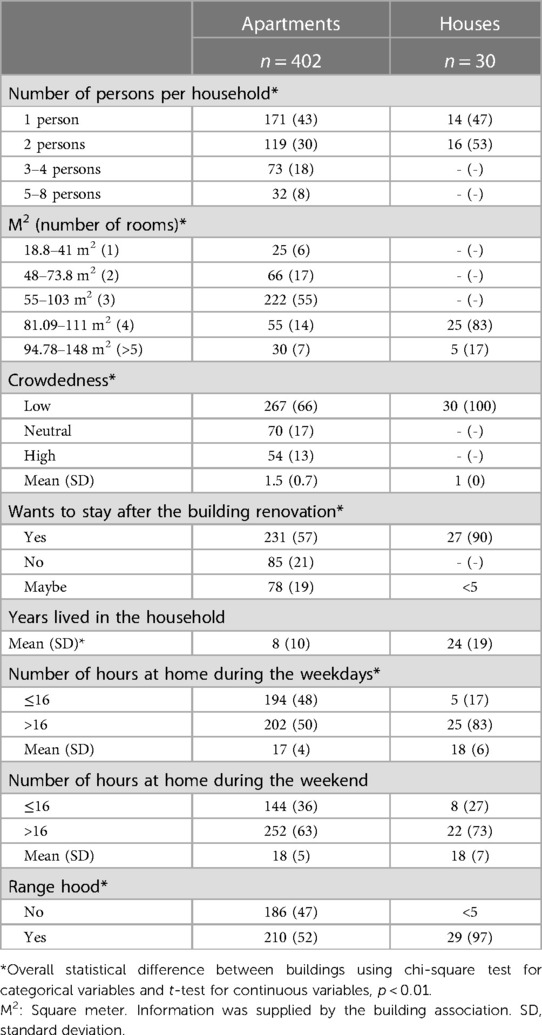
Table 2. Housing characteristics stratified by building typology. Percentages might not add up to 100% due to rounding. Values are shown as prevalence (%).
The IAQ was measured both during winter and summer. In general, IAQ was different between housing typologies. During summer, the mean TP-level was higher in apartments (22.4°C, ± 1.4) compared to houses (21.1°C, ± 1.3). Mean RH-level was lower in apartments compared to houses both during winter (40%, ±7 vs. 46%, ±6, respectively) and summer (56%, ±5 vs. 64%, ±5, respectively). In apartments, the mean CO2-level was lower compared to houses both during winter (1,100 ppm, ±412 vs. 1,334 ppm, ±443, respectively) and summer (908 ppm, ±322 vs. 1,281 ppm, ±343, respectively), where the mean CO2-level remained above 1,200 ppm (1,281 ppm, ±343) in houses (Table 3). Seasonal difference was most pronounced within apartments, finding a higher mean CO2-level during winter (1,100 ppm, ±412) compared to summer (908 ppm, ±322), and a higher TP and RH-level during summer (22.4°C, ±1.4% and 56%, ±5, respectively) compared to winter (21.0°C, ±1.7 and 40%, ±7, respectively). In houses, only a RH-level above 50% was different between winter and summer (19% vs. 100%, respectively). It was not possible to calculate an ACH within houses based on CO2 measurements, but ACH remained at 0.2 h−1 in apartments (Table 3).
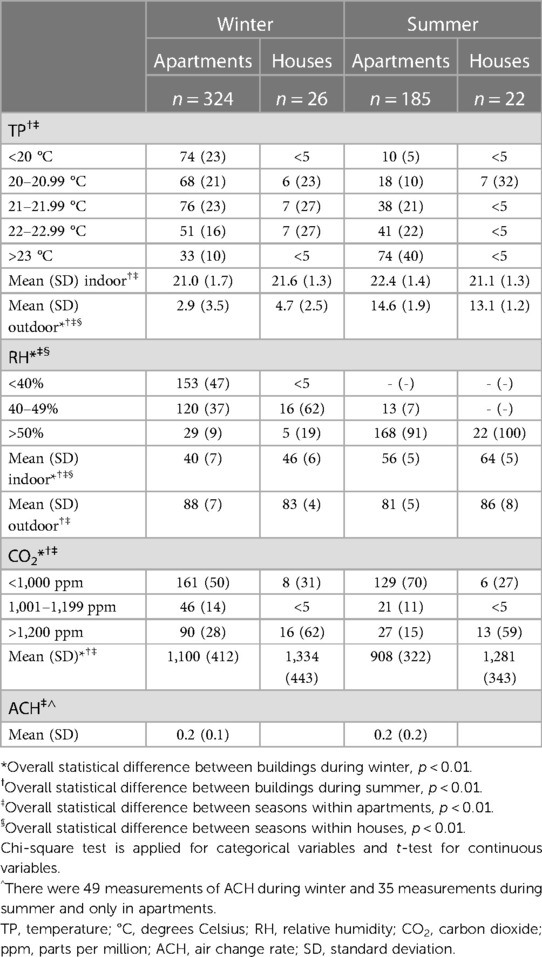
Table 3. IAQ stratified by housing typologies and seasons. Percentages might not add up to 100% due to rounding. Values are shown as prevalence (%).
In general, residents living in apartments experienced a lower level of comfort compared to residents living in houses but perception of IAQ improved during the summer season. The most common complaint among all participants was draught followed by thermal discomfort. Residents living in apartments more frequently experienced draught during both winter (64%), which was 18% higher than in houses (46%), and summer (42%), which was 15% higher compared to residents living in houses (27%). Equally, more residents living in apartments experienced being cold or too cold during winter (56%) which was 14% higher than in houses (42%), and 62% being warm or too warm during summer which was 17% higher than in houses (45%). The experience of draught was less common during summer compared to winter, both among residents living in apartments (42% vs. 64%) and houses (27% vs. 46%) (Table 4).
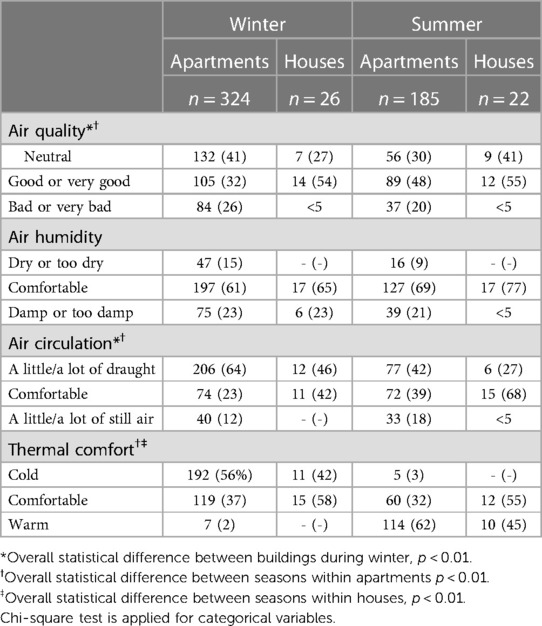
Table 4. Perception of indoor air stratified by housing typologies and seasons. Percentages might not add up to 100% due to rounding. Values are shown as prevalence (%).
The residents’ behavior did not seem to be affected by season, and no statistically significant differences were found between housing typologies or between seasons, with the exception that more apartment residents smoked outside during summer (43%) than during winter (26%) (Table 5).
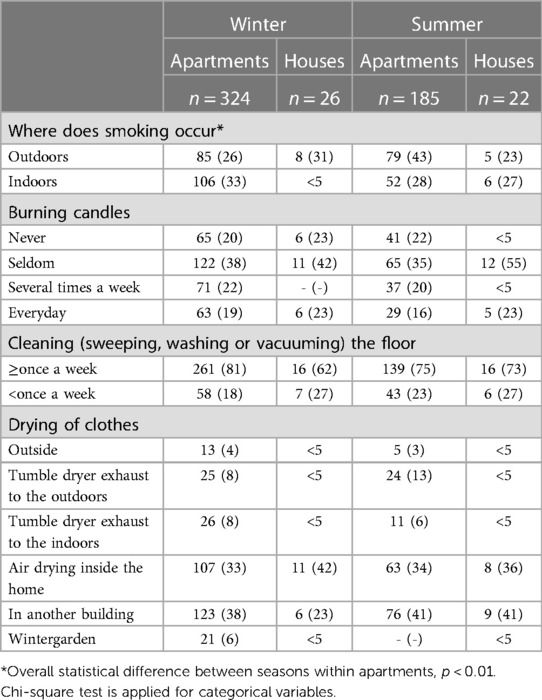
Table 5. Behavior stratified by housing typologies and seasons. Percentages might not add up to 100% due to rounding. Values are shown as prevalence (%).
In the following sections, the association between specific housing characteristics, and measured and perceived IAQ are presented. Results for number of rooms, crowdedness, and the possibility to create cross ventilation are presented, as these variables showed a statistically significant association on IAQ (Figure 4). Results for persons per household and having a range hood in the kitchen are shown in Supplementary Figure S1. Results from the linear regression analyses are based on the adjusted model, adjusting for age, smoking status, and gender. Results are presented as odds ratio (OR), with a corresponding 95% confidence interval (CI), and p < 0.01 unless otherwise stated. All results from the linear regression analyses can be found in Supplementary Table S2.
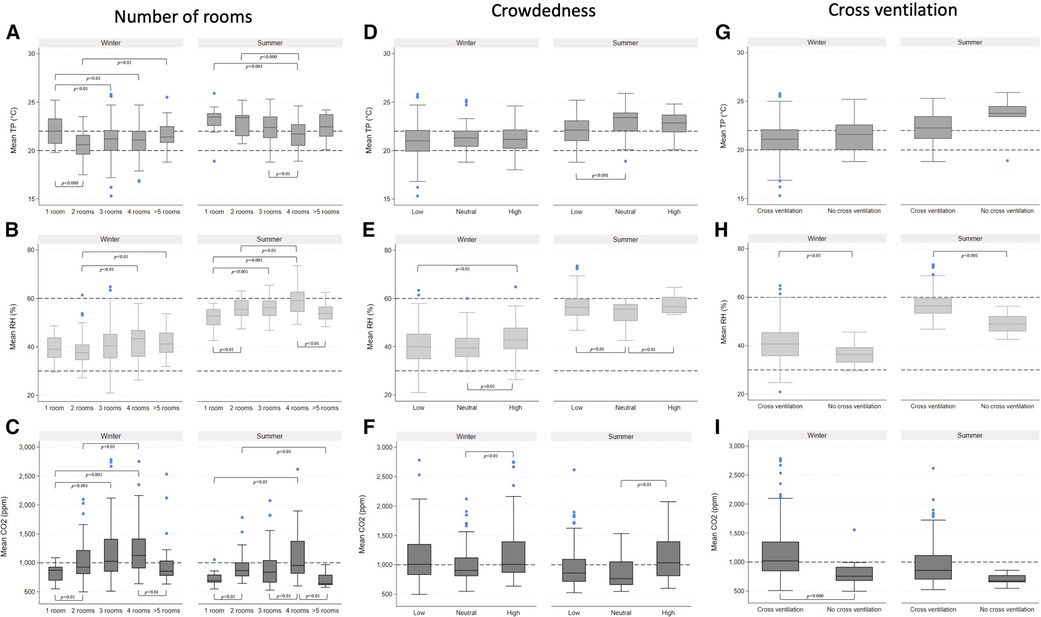
Figure 4. Boxplots showing the interquartile range, whiskers, and outliers of temperature (TP) in degrees Celsius (°C), relative humidity (RH) in percentages (%), and carbon dioxide (CO2) in parts per million (ppm) by number of rooms (A–C), crowdedness (D–F), and cross ventilation (G–I) stratified by season. Statistical significance was assessed by t-test for continuous variables.
TP was associated with number of rooms, and TP was lower when the number of rooms increased; however, the highest mean TP-level was found in one-room homes in both seasons (Figure 4A). During winter, analyses revealed a coefficient of 1.5°C (0.6, 2.4) in homes with one room compared to homes with two rooms, but the association was lower during summer (Supplementary Table S2). The mean RH-level was higher when number of rooms increased during both seasons (Figure 4B). The mean CO2 was higher when number of rooms increased, showing the lowest mean CO2-level within one-room homes in both seasons (Figure 4C). Regression analyses of winter data showed an association between homes with four rooms and mean CO2-level (OR 127 ppm (69-385 ppm)) compared to one-room homes (Supplementary Table S2).
Crowdedness was only associated with mean TP-level during summer (Figure 4D). Living in a household with neutral crowdedness showed a coefficient of 0.8°C (0.3–1.4) (Supplementary Table S2) compared to homes with low crowdedness. During winter, high crowdedness showed the highest mean RH-level and during summer low and high crowdedness showed higher mean RH-level than neutral crowdedness (Figure 4E). Mean CO2-level was higher when crowdedness increased, which was most pronounced during summer (Figure 4F).
The TP level was generally higher during summer than winter, but mean TP-level was higher in homes unable to create cross ventilation, particularly during summer (Figure 4G). The RH level was also generally higher during summer than during winter, but the inability to create cross ventilation showed lower mean RH-level both during summer and winter (Figure 4H). This was supported by findings from the analyses. During winter, analyses showed a coefficient of −4% (−7, −1%) within homes without the ability to create cross ventilation compared to homes that had this option. This association was greater during summer, revealing a coefficient equivalent to −7% (−12, −3%) (Supplementary Table S2). Homes without the option to create cross ventilation had a lower mean CO2-level (Figure 4I), revealing a coefficient of −341 ppm (−507, −175 ppm) when compared to homes with this option (Supplementary Table S2).
In general, the residents' behavior did not appear to be associated with mean TP or RH-level in either season. However, during winter, those who reported smoking indoors, drying clothes indoors, and more frequently using the range hood while cooking had a lower mean CO2-level. Furthermore, those who reported cleaning the floor less than once a week had a higher mean CO2-level (Supplementary Figure S2).
To evaluate how measured IAQ, housing characteristics, and behavior change residents' perception of IAQ, stacked bar charts were created to spot trends and differences (Figure 5). The following section presents variables which showed clear trends and differences related to residents' perception of IAQ. Only variabels showing statistical significance defined by p < 0.01 are shown unless otherwise stated. The complete stacked bar charts can be found in the Supplementary Material (Supplementary Figures S3–S6). Results from the regression analyses are based on the model adjusting for age, smoking status, and gender. Results are presented as OR, with a corresponding 95% CI, and p < 0.01. Results are found in Supplementary Material (Supplementary Tables S3, S4).
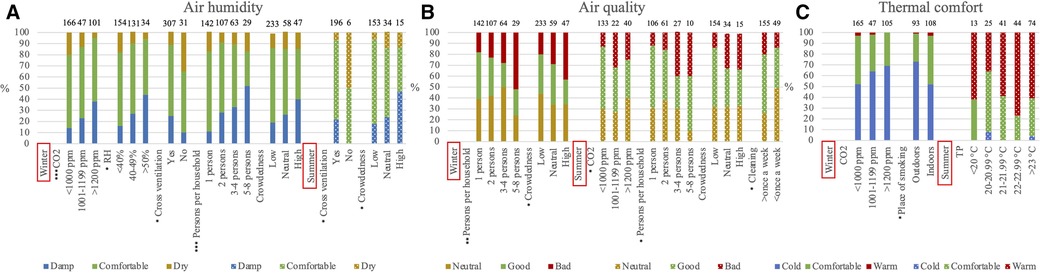
Figure 5. Stacked bar chart showing the proportion of seasonally perceived air humidity (A), air quality (B), and thermal comfort (C) by selected variables. Variables showing overall statistical significance are shown. * (p < 0.01), ** (p < 0.001), *** (p < 0.000). Winter measurements are highlighted with solid colors, and summer measurements are highlighted with a dotted pattern. TP, temperature; °C, degrees Celsius; RH, relative humidity; CO2, carbon dioxide; ppm, parts per million.
During winter, a mean CO2 level above 1,000 ppm resulted in more residents reporting damp air (Figure 5A), which was supported in the analyses. If the mean CO2-level was above 1,200 ppm the odds of experiencing damp air was 3.73 (1.97–7.06) compared to having a mean CO2-level below 1,000 ppm (Supplementary Table S3). Having a mean CO2-level below 1,000 ppm residents more frequently reported dry air. A higher mean RH-level above 50% was associated with a higher proportion of residents experiencing damp air (Figure 5A), finding the odds of 4.13 (1.76–9.64) compared to having a mean RH-level below 40% (Supplementary Table S3). Having a mean RH-level below 40% resulted in the highest proportion of residents reporting dry air (Figure 5A).
Increased crowdedness showed a higher proportion of residents experiencing dampness or dryness in both seasons though borderline significant during winter (p < 0.02). Additionally, in homes with the possibility to create cross ventilation, the residents experienced more damp air. Conversely, in homes without the possibility to create cross ventilation, a high proportion of residents reported dry air (Figure 5A) with the odds of 4.12 (1.80–9.43) when compared to homes with the possibility to create cross ventilation (Supplementary Table S3).
Despite air circulation, in terms of draught being the most common complaint in the interviews, we did not find any of housing characteristics or behaviors to be statistically significantly associated with the perception of air circulation. One exception was that during winter, residents burning candles weekly or daily experienced more draught compared to residents who seldom or never burned candles (data not shown). This was persistent in the analyses showing the odds of 2.13 (1.29, 3.49) where residents using candles seldom or never was the reference (Supplementary Table S3).
When the number of persons per household was high, more residents reported bad or very bad air quality in both seasons. This was likewise found when crowdedness was high though borderline significant during summer (p < 0.05). During summer, more residents reported neutral or bad air quality when mean CO2-level was above 1,000 ppm (p < 0.04) (Figure 5B). Analyses showed an association between not having the ability to create cross ventilation and reporting bad air quality finding the odds of 3.08 (1.38, 6.90) (Supplementary Table S3).
Residents' perception of thermal comfort was not statistically significantly different across housing characteristics or residents' behavior. However, during winter, more residents experienced being cold when mean CO2-level was above 1,000 ppm (p < 0.03) (Figure 5C). Analyses revealed that the odds of feeling cold during winter was 2.13 (1.23, 3.68) when mean CO2-level was above 1,200 ppm compared to the reference group with a mean CO2-level below 1,000 ppm (Supplementary Table S3). During summer, more residents reported being warm when mean TP-level increased (p < 0.04). Residents were the most comfortable with a mean TP-level between 20 and 20.99°C and least comfortable when the mean TP-level was between 22 and 22.99°C (Figure 5C). It is worth mentioning that during summer, residents living in homes without the possibility to create cross ventilation reported that they were warm or too warm but, this was not statistically significant (Supplementary Figure S6) or found in the analyses.
The prevalence of the residents' health status are stratified by housing typology and season to grasph the differences.
Allergy was the most common disease (29%), followed by hay fever (23%), and mental illness (22%) among residents living in apartments. Among residents living in houses, cardiovascular disease was the most prevalent disease (37%), followed by metabolic disease (17%) and diabetes (17%) (Supplementary Table S5).
More never-smokers lived in apartments than houses (42% vs. 23%), and fewer former smokers lived in apartments than houses (25% vs. 62%). Overall, general health symptoms were not different between housing typologies, and seasonal differences were not found. Only the prevalence of respiratory symptoms was different, revealing that fewer residents living in apartments experienced respiratory symptoms (winter 26% and summer 24%) compared to residents living in houses (winter 50% and summer 45%) (Table 6).
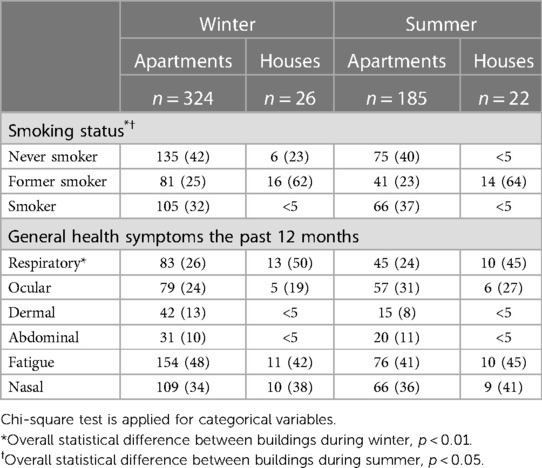
Table 6. Smoking status and general health symptoms for the past 12 months stratified by building typology and seasons. Those who were/were not diagnosed by a doctor or who are currently sick or not are presented as well as those with general health symptoms. Percentages might not add up to 100% due to rounding. Values are shown as prevalence (%).
The following regression analyses were stratified for season rather than housing typology. Results from the logistic regression analyses are based on the adjusted model adjusting for age, smoking status, gender, and relevant disease. Relevant disease for respiratory symptoms were asthma, chronic bronchitis, other lung disease, allergy, and hay fever. For nasal symptoms, it was allergy and hay fever, and for dermal symptoms it was allergy, hay fever and dermal disease. For ocular symptoms it was allergy and hay fever. Results are presented as OR, with a corresponding 95% CI, and p < 0.01 unless otherwise stated. A forest plot of statistically significant non-stratified analyses can be found in Supplementary Figure S7.
Measured IAQ in terms of CO2, RH, and TP-level and residents' behavior were not associated with residents' general health symptoms (Data not shown). However, Perception of dampness, draught, bad air quality, and dry air were seen to be associated with general health symptoms, primarily during winter (Figure 6). Perception of increased dampness was associated with nasal symptoms during winter (2.30, 1.26, 4.17) and respiratory symptoms during summer (3.62, 1.55, 8.45). Perception of increased draught during winter was associated with respiratory symptoms (2.18, 1.13, 4.19) and ocular symptoms during summer (2.65, 1.24–5.66). During winter, perception of bad air quality was associated with nasal symptoms (2.22, 1.16, 4.27), where perception of dry air was associated with dermal symptoms (2.88, 1.19, 7.00).
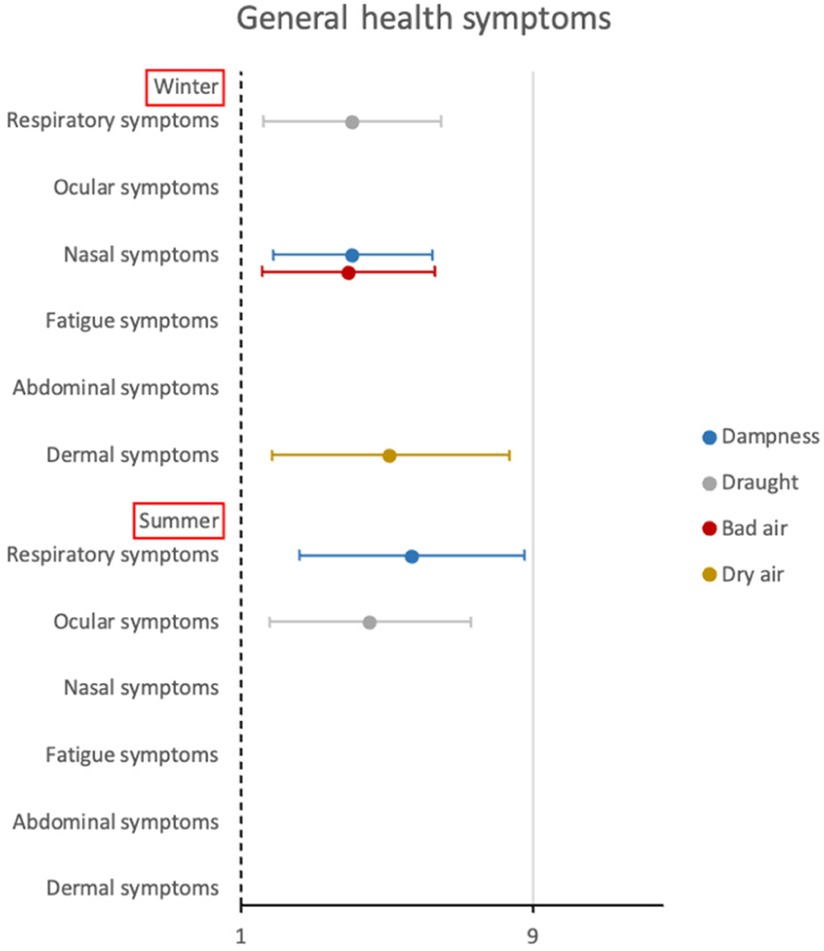
Figure 6. Forest plot showing results with p < 0.01. Logistic regression analyses were performed, adjusting for smoking status, age, gender, and relevant disease. Relevant disease for respiratory symptoms were asthma, chronic bronchitis, other lung disease, allergy, and hay fever. For nasal symptoms it was allergy and hay fever, and for dermal symptoms it was allergy, hay fever and dermal disease. For ocular symptoms it was allergy and hay fever. Having weekly or daily symptoms were compared to having symptoms monthly or never (reference). Dampness, draught, bad air, and dry air were self-reported by the residents.
This study confirms previous findings of higher CO2 and lower RH-level within residential buildings during winter compared to summer (52, 53). Seasonally, mean CO2-level was higher when number of rooms increased where the TP and RH-level were lower. Likewise, a high crowdedness showed the highest mean CO2-level. Not having cross ventilation during summer showed a higher mean TP-level confirming previous research (54, 55), and a lower mean RH-level compared to having cross ventilation. These findings are in contrast with an Australian study conducted during the summer, where average TP and RH was similar between housing with and without the possibility to create cross ventilation (56). Level of measured IAQ was not different across residents' behavior. In this study, findings further showed the highest mean levels of measured IAQ within houses, but mean TP was lower in houses during summer compared to apartments.
Thermal discomfort and draught were the most common complaint. Findings support a Portuguese study among elderly living in a care facility, finding 42% of the residents being cold during winter and slightly fewer (34%) during summer (57). Prevalence of thermal discomfort in this study are higher than in the European housing and health Status (LARES) study presenting 39% having cold-related problems during winter and 46% having heat-related problems during summer among several housing typologies (58). Residents living with higher crowdedness more frequently experienced either humid or dry air, and bad air quality both during winter and summer. Interestingly, the residents were able to correctly assess elevated RH-level as humid air and a RH-level below 40% as dry. Moreover, not having the possibility to create cross ventilation was associated to more residents experiencing dry air. The proportion of residents being comfortable was highest within a narrow range of 20–20.99°C and lowest when TP-level was between 22 and 22.99°C. In a study of Portuguese students, a sample of 16 long-term inhabitants of the tropics, had a temperature preference of 25.5°C (59), shortly after their arrival to Denmark. De Dear et al. replicated the study in Singapore among 32 college students finding the same result (60), where Brager and de Dear found neutral thermal comfort within a wide range of TP-level between 21.1–23.1 in USA, Canada, and China during winter and 21.8–25.6 in Australia, USA, Canada, and China during summer (61). Likewise, a review of thermal comfort in Asian residential buildings found that the range of TP-level was wide (62). This difference between findings suggests it might be due to various thermal comfort requirements and extended methods to adapt to their thermal environment.
Unexpectedly, the mean CO2-level was lower in homes where residents smoked and dried clothes indoors, and more frequently used the range hood while cooking. Potentially, the residents are aware that these habits are bad for their IAQ and they might choose to air out more often, thereby reducing the CO2-level. Furthermore, the mean CO2-level was elevated in homes where residents cleaned the floor less than once a week, which might be a proxy for these residents being less interested in cleanliness and airing out their homes less often, thereby having a higher mean CO2-level. Measured IAQ, behavior and housing characteristics were not associated with residents' general health symptoms. However, the residents' perception of IAQ were associated with their general health symptoms.
Modelling ACH from CO2 decay relies on the residents leaving the room where the equipment was placed, for at least 120 min, which might occur less frequently in homes with multiple residents vs. one resident. Due to the low number of ACH measurements in this study, the results may not be representative of the true ACH in the included social housing sites. Another method which could have been used is the gas tracer method, which is not sensitive to people staying in the household. However, this method is used for assessing the occupants' behavior related to manual ventilation and not the basic ACH without occupancy, which we wanted to assess in this study. It was not possible to derive ACH for the houses, which might be explained by the high mean level of CO2 found in the houses and not reaching a minimum level of 500 ppm for at least 120 min. Moreover, ACH was modelled from measurements obtained in the living room, and ACH could potentially have been higher in other rooms. It was possible to detect an ACH within 15% (n = 49) of the apartments during winter and 19% (n = 35) during summer. This does not represent a complete overview of the ACH within the included homes, rather it is an indicator of the mean level of ACH, showing a low level of ACH both lower than international and national recommendations.
In this study we employed the metric crowdedness rather than only looking into number of rooms and persons per household individually. Adding a measure of crowdedness introduce a possibility to evaluate if the space is too small for the number of persons living in the home. The most common method to calculate crowdedness is persons per room excluding kitchens and bathrooms (63, 64), why this method was applied to this study. It did not seem appropriate to use number of persons and bedrooms as the measured IAQ was conducted in the living room.
In our study, residents living in houses were more comfortable than the residents living in the apartments despite showing a poorer IAQ in terms of a CO2-level above 1,200 ppm, and a RH level above 50% on average. It is not obvious from the measured IAQ why residents living in houses are more comfortable than residents living in apartments. In this study, residents living in houses were all elderly and retired. A Swedish study found that a younger population living in multi-family buildings expressed more dissatisfaction with their IAQ (65), and these finding were confirmed in another Swedish study among residents living in single-family houses (66). In a French study, Langer et al. found that retired/elderly people complained less about IAQ (67). Residents living in the included houses have, on average, lived there for 25 years, and they appear very attached to both the house and the area. One reason why the residents living in houses feel comfortable might also be explained by the fact that these residents are feeling a greater sense of “ownership,” and we speculate that this leads to a higher acceptance of their IAQ, both as perceived and as measured. In this study, residents living in apartments and houses were treated as one population in the analyses. We cannot rule out that the difference between the two populations might have influenced the main findings. However, it was not feasible to stratify results by housing typology due low prevalence of specific outcomes and exposures among residents living in houses. Future studies might benefit from only looking into apartments or houses, and even including more houses in this kind of studies.
Fanger et al. found that air turbulence affected the sensation of draught, with high turbulence and low temperature showing the highest proportion of participants experiencing draught (68). Later, Toftum and Nielsen found that participants' perceptions of temperature at 11°C and 17°C affected participants' perceptions of draught (69), which was confirmed by a current review (70). In our study, the stacked bar chart showed that mean TP-level did not alter the proportion of residents experiencing draught during winter or summer. Instead, we explored how the perception of thermal comfort was associated with draught. We found that of those reporting draught a large proportion reported being cold (70%) during winter and warm (64%) during summer (Supplementary Table S6). Additionally, a sensitivity analysis revealed that the perception of being cold (OR 2.91, 95%CI [1.78, 4.75]) was associated with residents' perceptions of draught during winter (Supplementary Table S7). This proposes that alleviating thermal discomfort can reduce discomfort related to draught especially within cold environments (69). The reason why we do not find the mean TP-level altering or being associated with draught, might be explained by the fact that the level of TP is perceived differently by residents due to persistent exposure (62, 71).
Residents' behavior such as smoking indoors, burning candles frequently, and not using the range hood while cooking did not reflect on the CO2-level. It is most likely that the CO2 measurements do not capture the pollutants emitted in relation to these activities. Moreover, Hänninen et al. also suggests that indoor particle concentrations should not be measured far away from the source (i.e., in the living room as in this study) as it does not represent the true level of exposure. They suggest that personal exposure should be measured instead in order to obtain true exposure and effect of emissions from cooking and usage of range hood while cooking (72). Further, it might have been appropriate to have measured volatile organic compounds (VOCs), carbon monoxide and particulate matter (PM), as previous research has shown elevated levels of VOCs and PM due to cooking, use of ventilation (i.e., a range hood) (73), smoking indoors (74), and burning candles (75).
This study was determined to investigate a vulnerable population as they were expected to be more susceptible to adverse health symptoms due to poor IAQ. This expectation was partially confirmed. Karvala et al. described how self-reported overall health can influence the reporting of perceived building-related symptoms defined as building related intolerance (BRI). Those reporting poorer general health reported more BRI. They were also more often female and single (76). In this study, the aim was not to explore archetypes. Moreover, residents reporting poor or less good health and being sensitive to poor indoor climate were limited both during winter (n = 64 and n = 99, respectively) and summer (n < 34 and n = 47, respectively) which would be too small a population to analyze (Supplementary Table S8). Future studies might benefit diving into this matter to investigate the significance of archetypes.
Our study has several strengths—for example, employing repeated measurements to capture true seasonal conditions, prevalence, and effect. Furthermore, repeated measurements were obtained from the same pool of residents. The limitation of the study is the cross-sectional design, which does not allow for concluding on causality. Additionally, attrition rate was high between seasons. Finally, employing self-reported health might have introduced misclassification of health information, but was evaluated as most appropriate to capture the general health symptoms of interest. The HOME-Health study included an objective health measure being a lung function test, though not included in this paper. Future papers can add insights in to the association with objective health.
A previous publication explored the generalizability of the HOME-Health study population (n = 432) where apartments and houses were treated as one entity (45). The study population was found to be similar to the overall social housing population living in Denmark in terms of gender, age, occupation, immigration status, and persons per household. In this paper, results were stratified by season. Demography of the study population in each season was explored, finding fewer immigrants participating during both seasons, though prevalence between seasons remained the same (18%) (Supplementary Table S9).
The findings provide us with insights into the interplay between measured IAQ, housing characteristics, and the residents' comfort, behavior and health. The residents in this study experienced poor IAQ especially in terms of draught and thermal comfort, though this was better during summer. Our findings showed that measured IAQ was not different across the residents’ behavior. The possibility to create cross ventilation is important, to avoid excess heat, dampness, and the experience of dry air. Furthermore, recommending a neutral crowdedness might be appropriate to achieve lower CO2-level and risk of exposure to unhealthy indoor air. Residents were able to assess humidity and dryness correctly according to mean RH-level. Furthermore, residents reported bad air quality when the CO2 level exceeded 1,000 ppm. Interestingly, residents' perception of IAQ was associated with their general health symptoms. This knowledge put emphasis on the importance of addressing residents' perception of IAQ, which in turn can lead to improvements in IAQ, as well as residents' health and comfort.
The datasets presented in this article are not readily available because. Currently data cannot be shared for privacy and ethical reasons. Requests to access the datasets should be directed toY2hhcmxvdHRlZ2FiZWxAcGguYXUuZGs=.
The studies involving humans were approved by the Danish Data Protection Agency (2016-051-000001, 1475). To comply with the General Data Protection Regulation (GDPR), all interviews were carried out and stored on encrypted platforms (property of Aarhus University). The studies were conducted in accordance with the local legislation and institutional requirements. The ethics committee/institutional review board waived the requirement of written informed consent for participation from the participants' legal guardians/next of kin because Informed consent was obtained from all participants at the start of the interview.
CG: Writing – review & editing, Writing – original draft, Visualization, Validation, Software, Resources, Project administration, Methodology, Investigation, Formal Analysis, Data curation, Conceptualization. TS: Writing – review & editing, Validation, Supervision, Resources, Methodology, Funding acquisition, Conceptualization. SP: Writing – review & editing, Validation, Supervision, Software, Resources, Funding acquisition, Conceptualization. GE: Writing – review & editing, Validation, Supervision, Resources, Project administration, Methodology, Investigation, Funding acquisition, Conceptualization.
The author(s) declare that financial support was received for the research, authorship, and/or publication of this article.
This work was supported by Realdania (2014-00153 and 2011-00612). Realdania is a philanthropic association with 185.000 members, who conduct philanthropy based on the return from their investments, and the association is regulated through law on certain commercial enterprises. The aim of the association is to create quality of life for all through the built environment. The Innovation Fund (5151-0003B), which is initiated by the Danish Ministry of Higher Education and Science, whose purpose is to provide grants for the development of knowledge and technology, including high technology, leading to the strengthening of research and innovative solutions to benefit growth and employment in Denmark. The Former Ministry of Housing, Rural and Urban Affairs (2014-2274). None of the funders took part in the concept development, data acquisition, analyses or interpretation of the results.
We thank the staff, BE-READY and ReVALUE, and Vibeke Heitmann Gutzke for data collection, administrative support and valuable insights that improved the process and project. We thank Peter Ravn for providing validated equipment to measure indoor air quality. Thank you to Thea Hauge Broholt for creating, in cooperation with Steffen Petersen, the Matlab programme for indoor air measurements. Finally, we are grateful for the participation of all the building unions and boards involved in the project, which enhanced collaborations and accessibility to eligible participants.
The authors declare that the research was conducted in the absence of any commercial or financial relationships that could be construed as a potential conflict of interest.
All claims expressed in this article are solely those of the authors and do not necessarily represent those of their affiliated organizations, or those of the publisher, the editors and the reviewers. Any product that may be evaluated in this article, or claim that may be made by its manufacturer, is not guaranteed or endorsed by the publisher.
The Supplementary Material for this article can be found online at: https://www.frontiersin.org/articles/10.3389/fenvh.2024.1358546/full#supplementary-material
1. Klepeis NE, Nelson WC, Ott WR, Robinson JP, Tsang AM, Switzer P, et al. The National Human Activity Pattern Survey (NHAPS): A Resource for Assessing Exposure to Environmental Pollutants. Available online at:www.nature.com/jea
2. Algarni S, Khan RA, Khan NA, Mubarak NM. Particulate matter concentration and health risk assessment for a residential building during COVID-19 pandemic in Abha, Saudi Arabia. Environ Sci Pollut Res. (2021) 28(46):65822–31. doi: 10.1007/s11356-021-15534-6
3. Mannan M, Al-Ghamdi SG. Indoor air quality in buildings: a comprehensive review on the factors influencing air pollution in residential and commercial structure. Int J Environ Res Public Health. (2021) 18(6):1–24. doi: 10.3390/ijerph18063276
4. Fisk WJ, Lei-Gomez Q, Mendell MJ. Meta-analyses of the associations of respiratory health effects with dampness and mold in homes. Indoor Air. (2007) 17(4):284–96. doi: 10.1111/j.1600-0668.2007.00475.x
5. Mendell MJ, Mirer AG, Cheung K, Tong M, Douwes J. Respiratory and allergic health effects of dampness, mold, and dampness-related agents: a review of the epidemiologic evidence. Environ Health Perspect. (2011) 119:748–56. doi: 10.1289/ehp.1002410
6. Norbäck D, Lampa E, Engvall K. Asthma, allergy and eczema among adults in multifamily houses in Stockholm (3-HE study)—associations with building characteristics, home environment and energy use for heating. PLoS One. (2014) 9(12):1–17. doi: 10.1371/journal.pone.0112960
7. Norbäck D, Zock JP, Plana E, Heinrich J, Svanes C, Sunyer J, et al. Lung function decline in relation to mould and dampness in the home: the longitudinal European community respiratory health survey ECRHS II. Thorax. (2011) 66(5):396–401. doi: 10.1136/thx.2010.146613
8. Jaakkola MS, Quansah R, Hugg TT, Heikkinen SAM, Jaakkola JJK. Association of indoor dampness and molds with rhinitis risk: a systematic review and meta-analysis. J Allergy Clin Immunol. (2013) 132(5):1099–110. doi: 10.1016/j.jaci.2013.07.028
9. Gawande S, Tiwari R, Narayanan P, Bhadri A. Indoor air quality and sick building syndrome: are green buildings better than conventional buildings? Indian J Occup Environ Med. (2020) 24(1):30. doi: 10.4103/ijoem.IJOEM_148_19
10. Wolkoff P. Indoor air humidity, air quality, and health—an overview. Int J Hyg Environ Health. (2018) 221(3):376–90. doi: 10.1016/j.ijheh.2018.01.015
11. Diaz Lozano Patiño E, Vakalis D, Touchie M, Tzekova E, Siegel JA. Thermal comfort in multi-unit social housing buildings. Build Environ. (2018) 144(May):230–7. doi: 10.1016/j.buildenv.2018.08.024
12. Bourdakis E, Simone A, Olesen BW. An experimental study of the effect of different starting room temperatures on occupant comfort in Danish summer weather. Build Environ. (2018) 136:269–78. doi: 10.1016/j.buildenv.2018.03.046
13. Diaz Lozano Patino E, Siegel JA. Indoor environmental quality in social housing: a literature review. Build Environ. (2018) 131(January):231–41. doi: 10.1016/j.buildenv.2018.01.013
14. Capasso L, D’alessandro D. Housing and health: here we go again. Int J Environ Res Public Health. (2021) 18(22):12060. doi: 10.3390/ijerph182212060
15. Bonnefoy XR, Braubach M, Moissonnier B, Monolbaev K, Röbbel N. Housing and health in Europe: preliminary results of a pan-European study. Am J Public Health. (2003) 93(9):1559–63. doi: 10.2105/AJPH.93.9.1559
16. Becher R, Høie AH, Bakke JV, Holøs SB, Øvrevik J. Dampness and moisture problems in Norwegian homes. Int J Environ Res Public Health. (2017) 14(10):1–12. doi: 10.3390/ijerph14101241
17. Siponen T, Yli-Tuomi T, Tiittanen P, Taimisto P, Pekkanen J, Salonen RO, et al. Wood stove use and other determinants of personal and indoor exposures to particulate air pollution and ozone among elderly persons in a northern suburb. Indoor Air. (2019) 29(3):413–22. doi: 10.1111/ina.12538
18. Laursen KR, Rasmussen BB, Rosati B, Gutzke VH, Østergaard K, Ravn P, et al. Acute health effects from exposure to indoor ultrafine particles—a randomized controlled crossover study among young mild asthmatics. Indoor Air. (2021) 31(6):1993–2007. doi: 10.1111/ina.12902
19. The Danish Government. Strategy for Energy Renovation of Buildings. Copenhagen: The Ministry of Climate (2014). ISBN: 978-87-93214-02-6
20. The Danish Government. Tættere på II. Copenhagen; (2021). Available online at: https://www.altinget.dk/misc/Byermedpladstilalle.pdf (accessed October 12, 2023).
21. Tsoulou I, He R, Senick J, Mainelis G, Andrews CJ. Monitoring summertime indoor overheating and pollutant risks and natural ventilation patterns of seniors in public housing. Indoor Built Environment. (2023) 32(5):1–28. doi: 10.1177/1420326X221148728
22. Zhao H, Chan WR, Cohn S, Delp WW, Walker IS, Singer BC. Indoor air quality in new and renovated low-income apartments with mechanical ventilation and natural gas cooking in California. Indoor Air. (2021) 31(3):717–29. doi: 10.1111/ina.12764
23. Colton MD, Laurent JGC, MacNaughton P, Kane J, Bennett-Fripp M, Spengler J, et al. Health benefits of green public housing: associations with asthma morbidity and building-related symptoms. Am J Public Health. (2015) 105(12):2482–9. doi: 10.2105/AJPH.2015.302793
24. Jacobs DE, Ahonen E, Dixon SL, Dorevitch S, Breysse J, Smith J, et al. Moving into green healthy housing. J Public Health Manag Pract. (2015) 21(4):345–54. doi: 10.1097/PHH.0000000000000047
25. Coombs KC, Chew GL, Schaffer C, Ryan PH, Brokamp C, Grinshpun SA, et al. Indoor air quality in green-renovated vs. Non-green low-income homes of children living in a temperate region of US (Ohio). Sci Total Environ. (2016) 554–555:178–85. doi: 10.1016/j.scitotenv.2016.02.136
26. Haaland D, Tzekova E, Purcell B, Siegel J. Pre-Retrofit assessment of thermal comfort and excess moisture in post-war multi-unit buildings in Toronto. 2016 Ashrae Annual Conference Papers (2016)(2013). p. 1–8
27. Noris F, Adamkiewicz G, Delp WW, Hotchi T, Russell M, Singer BC, et al. Indoor environmental quality benefits of apartment energy retrofits. Build Environ. (2013) 68:170–8. doi: 10.1016/j.buildenv.2013.07.003
28. Breysse J, Jacobs DE, Weber W, Dixon S, Kawecki C, Aceti S, et al. Health outcomes and green renovation of affordable housing. Public Health Rep. (2011) 126(Suppl. 1):64–75. doi: 10.1177/00333549111260S110
29. Howden-Chapman P, Matheson A, Crane J, Viggers H, Cunningham M, Blakely T, et al. Effect of insulating existing houses on health inequality: cluster randomised study in the community. Br Med J. (2007) 334(7591):460–4. doi: 10.1136/bmj.39070.573032.80
30. Zota A, Adamkiewicz G, Levy JI, Spengler JD. Ventilation in public housing: implications for indoor nitrogen dioxide concentrations. Indoor Air. (2005) 15(6):393–401. doi: 10.1111/j.1600-0668.2005.00375.x
31. Brugge D, Rice PW, Terry P, Howard L, Best J. Housing conditions and respiratory health in a Boston public housing community. New Solut. (2001) 11(2):149–64. doi: 10.2190/NJ9H-MLA2-GX7F-C0AU
32. Brugge D, Welker-Hood K, Kosheleva A, Saddler S. Association and correlation of self-reported home environmental factors and health symptoms. Arch Environ Occup Health. (2006) 61(1):33–41. doi: 10.3200/AEOH.61.1.33-41
33. Domínguez-amarillo S, Fernández-agüera J, Cesteros-garcía S, González-lezcano RA. Bad air can also kill: residential indoor air quality and pollutant exposure risk during the COVID-19 crisis. Int J Environ Res Public Health. (2020) 17(19):1–34. doi: 10.3390/ijerph17197183
34. Broderick Á, Byrne M, Armstrong S, Sheahan J, Coggins AM. A pre and post evaluation of indoor air quality, ventilation, and thermal comfort in retrofitted co-operative social housing. Build Environ. (2017) 122:126–33. doi: 10.1016/j.buildenv.2017.05.020
35. Mavrogianni A, Taylor J, Davies M, Thoua C, Kolm-Murray J. Urban social housing resilience to excess summer heat. Building Research and Information. (2015) 43(3):316–33. doi: 10.1080/09613218.2015.991515
36. Peretti C, Pasut W, Emmi G, De Carli M. Comfort and perceived air quality in refurbished social houses with mechanical ventialtion system: the impact of occupants behaviour. Energy Procedia. (2015) 78:2887–92. doi: 10.1016/j.egypro.2015.11.659
37. Santamouris M, Alevizos SM, Aslanoglou L, Mantzios D, Milonas P, Sarelli I, et al. Freezing the poor—indoor environmental quality in low and very low income households during the winter period in Athens. Energy Build. (2014) 70:61–70. doi: 10.1016/j.enbuild.2013.11.074
38. Giancola E, Soutullo S, Olmedo R, Heras MR. Evaluating rehabilitation of the social housing envelope: experimental assessment of thermal indoor improvements during actual operating conditions in dry hot climate, a case study. Energy Build. (2014) 75:264–71. doi: 10.1016/j.enbuild.2014.02.010
39. Sakka A, Santamouris M, Livada I, Nicol F, Wilson M. On the thermal performance of low income housing during heat waves. Energy Build. (2012) 49:69–77. doi: 10.1016/j.enbuild.2012.01.023
40. Braubach M, Savelsberg J. Social Inequalities and Their Influence on Housing Risk Factors and Health A Data Report Based on the WHO LARES Database. (2009). Available online at: http://www.euro.who.int/envhealth/topics/20090706_1
41. Klint J, Scanlon P, Kolarik B, Rønnow G, Løck S, Aalling L, et al. Bedre Indeklima Gennem. Copenhagen: World Health Organization (2021). Available online at: https://iris.who.int/handle/10665/107955
42. Nellemose H, Steen T. Aalborg Universitet perceived indoor environment in social housing with different ventilation principles. SINTEF proceedings. SINTEF Academic Press (2021).
43. Andersen HV, Gunnarsen L, Knudsen LE, Frederiksen M. PCB In air, dust and surface wipes in 73 Danish homes. Int J Hyg Environ Health. (2020) 229:113429. doi: 10.1016/j.ijheh.2019.113429
44. Andersen MH, Michael Jensen O, Boligselskabet Fruehøjgaard, SBi. PILOTPROJEKT Brændgårdsparken—Energikrav og Beboernes Energiforståelse og Adfærd før og Efter en Energirenovering. Herning; (2015). Available online at: https://almennet.dk/media/563049/rapport_braendgaardsparken-final.pdf (accessed October 8, 2023).
45. Gabel C, Elholm G, Rasmussen MK, Broholt TH, Jensen SR, Petersen S, et al. The Home-health (housing, environment, and health) study; description of a danish natural experiment, designed as a longitudinal study with repeated measurements, providing internal- and external validity of the study. Environ Health Insights. (2023) 17:11786302231181489. doi: 10.1177/11786302231181489
46. Engvall K, Norrby C, Sandstedt E. The Stockholm indoor environment questionnaire: a sociologically based tool for the assessment of indoor environment and health in dwellings. Indoor Air. (2004) 14(1):24–33. doi: 10.1111/j.1600-0668.2004.00204.x
47. Bodin L, Andersson K, Bønløkke JH, Mølhave L, Kjaergaard SK, Stridh G, et al. Nasal hyperresponders and atopic subjects report different symptom intensity to air quality: a climate chamber study. Indoor Air. (2009) 19(3):218–25. doi: 10.1111/j.1600-0668.2009.00584.x
48. Gemini Dataloggers. Datasheet: Tinytag CO2 Logger. (2017). p. 1–3. Available online at: https://www.geminidataloggers.com/data-loggers/tinytag-co2-data-logger/tinytag-tge-0011-high-concentration-carbon-dioxide-data-logger (accessed May 4, 2023).
49. Gemini Dataloggers. Datasheet: Tinytag Ultra 2. (2014). Available online at: https://www.geminidataloggers.com/data-loggers/tinytag-ultra-2/tgu-4500 (accessed May 4, 2023).
51. Microsoft Corporation. Microsoft Excel. Available online at: https://office.microsoft.com/excel
52. Lim AY, Yoon M, Kim EH, Kim HA, Lee MJ, Cheong HK. Field-based longitudinal study design for measuring the association between indoor air quality and occupant health status in residential buildings. MethodsX. (2021) 8:101426. doi: 10.1016/j.mex.2021.101426
53. Nguyen JL, Schwartz J, Dockery DW. The relationship between indoor and outdoor temperature, apparent temperature, relative humidity, and absolute humidity. Indoor Air. (2014) 24(1):103–12. doi: 10.1111/ina.12052
54. Raja IA, Nicol J, McCartney K. Natural ventilated buildings: use of controls for changing indoor climate. Renew Energy. (1998) 15(1–4):391–4. doi: 10.1016/S0960-1481(98)00193-1
55. Ahmed T, Prashant K, Mottet L. Natural ventilation in warm climate: the challenges of thermal comfort, heatwave resilience and indoor air quality. Renewable Sustainable Energy Rev. (2021) 138:1–17. doi: 10.1016/j.rser.2020.110669
56. Omrani S, Garcia-Hansen V, Capra BR, Drogemuller R. Effect of natural ventilation mode on thermal comfort and ventilation performance: full-scale measurement. Energy Build. (2017) 156:1–16. doi: 10.1016/j.enbuild.2017.09.061
57. Mendes A, Pereira C, Mendes D, Aguiar L, Neves P, Silva S, et al. Indoor air quality and thermal comfort—results of a pilot study in elderly care centers in Portugal. J Toxicol Environ Health—Part A: Current Issues. (2013) 76(4–5):333–44. doi: 10.1080/15287394.2013.757213
58. Ormandy D, Ezratty V. Health and thermal comfort: from WHO guidance to housing strategies. Energy Policy. (2012) 49:116–21. doi: 10.1016/j.enpol.2011.09.003
59. Fanger PO. Improvement of human comfort and resulting effects on working capacity. Biometeorology. (1972) 2:31–41.
60. de Dear RJ, Leow KG, Ameen A. Thermal comfort in the humid tropics. Part I. Climate chamber experiments on temperature preferences in Singapore. ASHRAE Transactions. Atlanta, GA: ASHRAE (1991). p. 874–9.
61. Brager GS, de Dear RJ. Thermal adaptation in the built environment: a literature review. Energy Build. (1998) 17:83–96. doi: 10.1016/S0378-7788(97)00053-4
62. Aqilah N, Rijal HB, Zaki SA. A review of thermal comfort in residential buildings: comfort threads and energy saving potential. Energies. (2022) 15(23):9012. doi: 10.3390/en15239012
63. Mah SM, Rosella LC, Kivimäki M, Carmeli C. Overcrowded Housing During Adolescence and Future risk of Premature Mortality: a 28-Year Follow-up of 556,191 Adolescents from Switzerland. (2023). Available online at: www.thelancet.com
64. Blake KS, Kellerson RL, Simic A. Measuring Overcrowding in Housing. Fairfax, Virginia: U.S. Department of Housing and Urban Development Office of Policy Development and Research (2007). Available online at: https://www.huduser.gov/publications/pdf/measuring_overcrowding_in_hsg.pdf (cited February 6, 2024).
65. Zalejska-Jonsson A, Wilhelmsson M. Impact of perceived indoor environment quality on overall satisfaction in Swedish dwellings. Build Environ. (2013) 63:134–44. doi: 10.1016/j.buildenv.2013.02.005
66. Wang J, Norbäck D. Subjective indoor air quality and thermal comfort among adults in relation to inspected and measured indoor environment factors in single-family houses in Sweden-the BETSI study. Sci Total Environ. (2022) 802:1–10. doi: 10.1016/j.scitotenv.2021.149804
67. Langer S, Ramalho O, Le Ponner E, Derbez M, Kirchner S, Mandin C. Perceived indoor air quality and its relationship to air pollutants in French dwellings. Indoor Air. (2017) 27(6):1168–76. doi: 10.1111/ina.12393
68. Fanger PO, Melikov AK, Hanzawa H, Ring J. Air turbulence and sensation of draught. Energy Build. (1988) 12:21–39. doi: 10.1016/0378-7788(88)90053-9
69. Toftum J, Nielsen R. Draught sensitivity is influenced by general thermal sensation. Int J Ind Ergon. (1996) 18:295–305. doi: 10.1016/0169-8141(95)00070-4
70. Berger C, Mahdavi A, Ampatzi E, Crosby S, Hellwig RT, Khovalyg D, et al. Thermal conditions in indoor environments: exploring the reasoning behind standard-based recommendations. Energies (Basel). (2023) 16(4):1–22. doi: 10.3390/en16041587
71. Nicol JF, Humphreys MA. Thermal comfort as part of a self-regulating system. Build Res Pract. (1973) 1(3):174–9. doi: 10.1080/09613217308550237
72. Hänninen OO, Lebret E, Ilacqua V, Katsouyanni K, Künzli N, Srám RJ, et al. Infiltration of ambient PM 2.5 and levels of indoor generated non-ETS PM 2.5 in residences of four European cities. Atmos Environ. (2004) 38(37):6411–23. doi: 10.1016/j.atmosenv.2004.07.015
73. Lachowicz JI, Milia S, Jaremko M, Oddone E, Cannizzaro E, Cirrincione L, et al. Cooking particulate matter: a systematic review on nanoparticle exposure in the indoor cooking environment. Atmosphere (Basel). (2023) 14:2–26. doi: 10.3390/atmos14010012
74. Zhang J, Smith KR. Indoor air pollution: a global health concern. Br Med Bull. (2003) 68:209–25. doi: 10.1093/bmb/ldg029
75. Salthammer T, Gu J, Wientzek S, Harrington R, Thomann S. Measurement and evaluation of gaseous and particulate emissions from burning scented and unscented candles. Environ Int. (2021) 155:1–13. doi: 10.1016/j.envint.2021.106590
Keywords: indoor environment, indoor air, wellbeing, comfort, social housing
Citation: Gabel C, Sigsgaard T, Petersen S and Elholm G (2024) The prevalence and association of measured and perceived indoor air quality, housing characteristics, and residents’ behavior and health. Front. Environ. Health 3:1358546. doi: 10.3389/fenvh.2024.1358546
Received: 19 December 2023; Accepted: 18 March 2024;
Published: 12 April 2024.
Edited by:
Marcella Ucci, University College London, United KingdomReviewed by:
Tunde Ogbemi Etchie, Federal University Lokoja, Nigeria© 2024 Gabel, Sigsgaard, Petersen and Elholm. This is an open-access article distributed under the terms of the Creative Commons Attribution License (CC BY). The use, distribution or reproduction in other forums is permitted, provided the original author(s) and the copyright owner(s) are credited and that the original publication in this journal is cited, in accordance with accepted academic practice. No use, distribution or reproduction is permitted which does not comply with these terms.
*Correspondence: Charlotte Gabel Y2hhcmxvdHRlZ2FiZWxAcGguYXUuZGs=
‖ORCID Charlotte Gabel orcid.org/0000-0001-5870-0614 Torben Sigsgaard orcid.org/0000-0002-2043-7571 Steffen Petersen orcid.org/0000-0002-7230-6207
Disclaimer: All claims expressed in this article are solely those of the authors and do not necessarily represent those of their affiliated organizations, or those of the publisher, the editors and the reviewers. Any product that may be evaluated in this article or claim that may be made by its manufacturer is not guaranteed or endorsed by the publisher.
Research integrity at Frontiers
Learn more about the work of our research integrity team to safeguard the quality of each article we publish.