 M. J. van den Berg1*
 J. L. Zaslona1D. P. Muller1L. Wu1M. Hughes2B. Johnston2C. Dyer2
 M. Drane2
 T. L. Signal1
- 1Sleep/Wake Research Centre, School of Health Sciences, Massey University, Wellington, New Zealand
- 2Operational Integrity and Safety, Air New Zealand, Auckland, New Zealand
Introduction: Ultra-long range (ULR) flights have the potential to increase fatigue-related risk for cabin crew, if the extended flight times are associated with extended wakefulness, sleep loss and higher levels of crew fatigue. ULR flights may also require longer opportunities for recovery sleep. This study evaluates the utilization of fatigue risk mitigations for cabin crew operating the Auckland – Chicago ULR route with a two-day layover.
Methods: 65 cabin crew (45 women; aged 20–59 years) wore an actigraph and completed a sleep/duty diary for 3 local nights prior to, throughout, and for 3 local nights after a ULR trip. Crewmembers rated their fatigue (Samn-Perelli Crew Status Check), sleepiness (Karolinska Sleepiness Scale), and workload (OW; NASA-TLX) at key times during each flight. Jet lag was rated each day at home and during layover.
Results: Fatigue and sleepiness were highest at top-of-descent and after landing and were higher on the inbound flight than on the outbound flight. For every hour of additional sleep in-flight, top-of-descent fatigue ratings decreased by 0.24 points and top-of-descent sleepiness ratings decreased by 0.38, whereas top-of-descent fatigue and sleepiness ratings increased by 0.24 points with every 10-point increase in OW ratings. Crew slept more in the 24-hours prior to the outbound (M = 8.5 h) and inbound flights (M = 9.1 h) compared to pre-trip baseline days (M = 8.2 h). Post-trip, crew slept more during the first day (M = 9.9 h) compared to baseline, with 95% taking a daytime nap. Jet lag ratings decreased daily on return home but were still higher on the fourth day than on the day of the outbound flight.
Discussion: Cabin crew prepare for ULR flights by obtaining more sleep prior to departure. However, large individual differences in sleep and declining jet lag ratings across pre-trip days suggest that some crewmembers may still be recovering from a previous trip. Further refinement of in-flight sleep strategies and workload mitigations could be considered for managing fatigue risk at top-of-descent. Findings also highlight the importance of a protected period of post-trip rest to facilitate cabin crews' recovery from the effects of sleep restriction and circadian disruption associated with this ULR trip.
Introduction
Ultra-long range (ULR) flight operations have the potential to increase fatigue-related operational risk, particularly during the final safety critical phase of flight if the extended flight times (16+ hours) and duty times (18–22 h) are associated with extended periods of wakefulness, limited prior sleep and higher levels of crew fatigue (1). This is based largely on laboratory-based studies that have shown robust relationships between cognitive performance impairment and extended wakefulness (2), increasing sleep loss (3), and performing during an adverse circadian phase (4). Higher levels of crew fatigue could also require longer opportunities for recovery sleep during layovers, and/or after a ULR trip.
Internationally, the regulatory approach has been for an operator to present a safety case that demonstrates how they will identify, manage and monitor risks associated with the ULR operation, including the risk of fatigue (5, 6). Due to the unique risks associated with each ULR city-pair, the safety case will normally stipulate that data will be collected during initial operations to demonstrate the effectiveness of mitigations and an equivalent level of safety to existing operations. Regulators also usually require the operator to have an approved Fatigue Risk Management System (FRMS) in place before a ULR operation can commence. In New Zealand there is no regulatory option for an operator to obtain an approved FRMS, but Air New Zealand (Air NZ) has been an industry leader in the development of these processes (7) and has undertaken numerous previous data collection studies to inform the management of fatigue among flight crew (8–11) and cabin crew (not published) within their organization. Because FRMS is a data-driven means of managing fatigue-related safety risk and is “based on scientific principles, knowledge, and operational experience”, (12) sharing information on the utilization and effectiveness of fatigue risk mitigations on existing ULR routes will inform the planning of new ULR operations.
The main mitigation employed to address the fatigue-related operational risk during ULR flights is the scheduling of in-flight rest breaks during which crewmembers have the opportunity to sleep in crew rest facilities with lie-flat bunks (1, 13, 14). The extent to which in-flight rest breaks can mitigate the effects of extended wakefulness on ULR flights depends on the amount and quality of sleep that crewmembers are able to obtain (15). Other key mitigations in ULR operations include providing a protected period of time prior to a ULR trip that includes a minimum of two local nights to ensure crew are well rested before departure, a minimum layover duration that accommodates at least two full nights of sleep for sufficient recovery prior to the inbound flight, and the provision of an adequate protected period of recovery following the ULR trip (1).
Several studies have evaluated the effectiveness and/or utilization of fatigue mitigations for managing flight crew fatigue during ULR operations (16–20) but very limited data is available on the utilization of fatigue mitigations for cabin crew during ULR operations (21). Findings from these studies can inform other ULR operations but the generalizability of findings will depend on the similarity of departure times, arrival times, flight durations, layover durations, flight directions (westward vs. eastward), and/or number of time zones crossed. Flight duration will determine the available time for in-flight rest, whereas departure and arrival times will influence the timing of sleep opportunities relative to crewmembers' biological night which in turn will influence the sleep they may obtain in-flight and during the layover (6). Flight direction, the number of time zones crossed, and layover duration will also influence crewmembers' sleep during the layover and on the inbound flight, and during post-trip recovery.
The suitability of measures recommended for monitoring cabin crew fatigue during ULR operations [actigraphy, sleep/duty diaries, ratings of fatigue and sleepiness, workload, and psychomotor vigilance task (PVT)] (6) has previously been demonstrated (21). However, since no significant associations were found between cabin crews' sleep/wake history and PVT performance, it is debatable whether PVT data add worthwhile information for the evaluation of cabin crew fatigue risk. In other shift work settings, the PVT has been an informative measure of performance impairment during shifts which in most instances appeared to be consistent with subjective measures of fatigue (22). However, incomplete data resulting from missing tests or tests taken too early or too late will limit their representativeness of the group studied (22). The additional burden this test places on busy cabin crew as well as the logistical challenges associated with obtaining reliable PVT data in a busy testing environment also needs to be considered (21).
When monitoring post-trip recovery, actigraphic measures of sleep and post-sleep fatigue and sleepiness may not provide a complete picture of how crew are recovering and how prepared they are for the next trip. Previous research has demonstrated that compared to cabin crews’ pre-trip baseline sleep, total sleep per 24 h following a ULR trip was significantly longer on the first post-trip day but no different on subsequent post-trip days (21). Though post sleep fatigue and sleepiness ratings were highly variable, there were no significant differences observed between baseline and post-trip days (21). Post-trip recovery can also be evaluated by assessing phase shifts in circadian rhythms, and there are multiple measures for doing this (melatonin, cortisol, body temperature, cognitive performance) (23, 24) but they are logistically challenging. Subjective reports of jet lag may be a useful addition (25, 26) and are easy to administer and less burdensome for cabin crew to complete.
The aim of the present study was to evaluate the utilization of the airline's fatigue risk mitigations put in place for cabin crew operating an eastward outbound Auckland-Chicago-Auckland (AKL-ORD-AKL) trip with two-day layover, by monitoring cabin crews' sleep, and obtaining jet lag ratings before, during, and after this trip, as well as ratings of sleepiness, fatigue and workload across each flight, using international best practice methods (6). A secondary aim of this study was to add information to the existing knowledge of cabin crews' sleep, sleepiness, and fatigue during ULR operations.
Materials and methods
Subjects
The study was reviewed and approved by the Massey University Human Ethics Committee (Southern A, Application SOA 18/82). All Air NZ cabin crew scheduled to fly the AKL-ORD-AKL ULR route during the study period were eligible to participate. Cabin crew volunteering to participate provided written informed consent prior to beginning their data collection and confidentiality was strictly maintained. Cabin crew were not compensated for participating. The aim was to recruit 78 cabin crew as determined by power calculations with cabin crew data collected in a previous ULR validation study (21).
Materials
Sleep/wake patterns were monitored with actigraphy (Micro Motionlogger, Ambulatory Monitoring, Inc., Ardsley, New York, flight USA). Actigraphy is a validated, widely used method for monitoring sleep/wake patterns in various populations (27, 28) including cabin crew (29–34). It has been validated for monitoring in-flight sleep of flight crew (15, 35) and has since been used in ULR validation studies involving flight crew (16–18) and cabin crew (21). The Micro Motionlogger actigraph, which is the size of a wristwatch with a functional time display, has an “event marker” button which participants were instructed to press each time they began and stopped trying to sleep. Activity counts, ambient light, and case temperature were recorded in 1-minute epochs and subsequently downloaded to a computer, using the manufacturer's Motionlogger WatchWare program (Ambulatory Monitoring Inc, Ardsley, NY).
A sleep/duty diary used previously in multiple ULR validation studies with flight crew (16, 17) and cabin crew (21) was adapted for use in the present study. The sleep/duty diary included a pre-study questionnaire to collect information on cabin crew position, flying experience, age, sex, usual sleep at home on days off, and usual sleep in onboard crew rest facilities, as well as a lookback report for recording duty periods in the week leading up to the ULR duty. For recording sleep start- and end-times at home pre-trip, post-trip, and during layover, 24-hour timelines were included. For each flight sector (AKL-ORD; ORD-AKL), additional pages were included to collect operational information, including scheduled and actual duty start and end time, cabin worked (Business Premier, Premium Economy, or Economy), planned rest breaks for the flight, actual rest breaks taken, and how the crewmember usually manages fatigue on this flight. There were also spaces for rating fatigue, sleepiness, and workload at specific times, and for any comments.
Fatigue was rated on the Samn-Perelli Crew Status Check (SP), using a scale from 1 = “fully alert, wide awake” to 7 = “completely exhausted, unable to function effectively” (36–38). The SP was developed specifically for use with flight crew (38). Sleepiness was rated on the Karolinska Sleepiness Scale (KSS), using a scale from 1 = “extremely alert” to 9 = “extremely sleepy, fighting sleep” (39–41). These scales have been used in previous studies focused on sleep loss, fatigue, and performance of flight crew (17, 42–46), and cabin crew (21). In controlled laboratory studies, values of 7 and above (≥7) on the KSS have been associated with the occurrence of microsleeps (very short periods of uncontrolled sleep) (39). Therefore, the frequency with which KSS values ≥7 occurred in the present study is reported. There is less empirical evidence for a cut-off on the SP. However, airlines have used values of 5 and above (≥5) to indicate excessive crewmember fatigue (17, 47). The frequency with which SP values ≥5 occurred is also reported in the present study.
Workload was rated on the Overall Workload scale (48), by placing a mark on a horizontal line divided into 20 slots, anchored with “low” on the left and “high” on the right. Subsequently, a score between 0 (low) and 100 (high) was assigned. Workload for the entire flight was rated on the raw NASA Task Load Index (NASA TLX) (49). The weighting component, included in the traditional NASA TLX to account for any individual differences in the subjective experience of the task (50), was omitted to reduce the burden on participants. The raw NASA TLX (without the weighting component) has been shown to be equally sensitive as the original version (51, 52).
Also included was a post-service duty questionnaire which has been used in a previous cabin crew fatigue study (29) to document the number of passengers on the flight, whether the flight was delayed, if turbulence was experienced, if there were disruptive passengers, medical or emergency incidents, and/or major service disruptions, and number of times they assisted with baggage. These data are not included in the present analyses.
Feelings of jet lag were rated on a horizontal visual analog scale, anchored with “no jet lag” on the left and “extreme jet lag” on the right. Subsequently, a score between 0 (no jet lag) and 100 (extreme jet lag) was assigned (25, 26). Jet lag ratings were made at 16:00 local time and ratings on pre-trip days were categorised as “Pre-trip day 1–3” and “Day of departure of the outbound flight”. Ratings on the day of arrival in New Zealand were categorised as “Post-trip day 1”, with ratings made on subsequent days “Post-trip day 2–4”.
Procedure
Information on the study was initially posted on the airline's intranet channels. Cabin crew scheduled for an AKL-ORD-AKL trip with a two-night layover were telephoned by an Air NZ member of the research team and invited to participate. Cabin crew interested in participating were sent a study pack containing a study information sheet, consent form, letter of support from the airline, actigraph, sleep/duty diary, and instruction guide within two weeks of their study trip, and a suitable time was arranged for a conference training call and delivery of the study pack. During the conference training phone call with up to seven cabin crew, a Sleep/Wake Research Centre (SWRC) member of the research team explained the study requirements and the use of the study materials. Instructions were also included in the sleep/duty diary and were available on the airline's intranet.
The eastward outbound flights, with 14.9 h planned flight time, were scheduled to depart Auckland at 20:10 local time, arriving in Chicago in the afternoon (depending on the time of the year 16:15 or 18:05 ORD time = 11:15 or 11:05 AKL time). Cabin crew had a two-day layover which included two local nights. The westward inbound flights had a planned flight time of 16.2 h and were scheduled to depart Chicago in the evening (depending on the time of the year 19:10 or 21:20 ORD time = 14:10 or 16:20 AKL time), arriving in Auckland in the morning (06:30 AKL time = 11:30 or 13:30 ORD time). Study flights were regular commercial flights on the AKL-ORD-AKL route which was introduced seven months prior to the commencement of the study.
Flights on the B787-9 Dreamliner were operated by 10 cabin crew, including one In-flight Service Manager Lead (ISM Lead) and one In-flight Service Manager 2 (ISM 2). Crew worked as two groups (A and B) who alternated periods of cabin duty and rest breaks outside of the main meal services.
As part of the airline's fatigue risk management, cabin crew were provided with advisory material developed by the airline, recommending that the portion of the flight in between meal services be split into four rests breaks, with each crewmember scheduled for two in-flight sleep opportunities in the bunk. For both flight sectors, the airline provided three break options, each comprising a long break (recommended duration varying between 3 h–3 h40 on outbound flights; 3 h20–4 h15 on inbound flights) timed to coincide with the biological night plus a short break (recommended duration varying between 50 min–1 h30 on outbound flights; 1 h–1 h30 on inbound flights). Break patterns could be varied for operational reasons. In addition to scheduled rest breaks for sleep in the bunk, an additional rest (no longer than 35 min, including a recovery period of 10 min) in one of two reclining high comfort crew seats with a folding leg rest and curtain (located at the rear passenger doors) was also provided.
Cabin crew were also provided with a minimum rest period of 48 h (including two local nights) free from all duty prior to their ULR trip, and a minimum of 96 h (including four local nights) protected time post-trip for recovery.
The airline's advisory material included recommended fatigue mitigation strategies at home pre-trip, during layover, and post-trip. Post-trip information addressed the fatigue risk of driving home post duty and provided mitigations, which included utilizing crew transport or the fatigue taxi system. This allows crew to order a taxi for traveling home at the airline's cost (up to a maximum of 50 km) and return to collect their vehicle the following day.
Participants were asked to complete the sleep/duty diary and wear the actigraph continuously for three days prior to the study trip, throughout the entire duration of the trip, and for three days after returning from the study trip. This included rating their jet lag at 16:00 local time each day. On the day of each flight, participants were asked to provide operational information, rate their fatigue and sleepiness: (1) pre-flight, after signing on for duty; (2) around top of climb (once the seatbelt sign was turned off); (3) around top of descent (at cabin clearance following the last meal service); and (4) after landing. They were also asked to rate their overall workload at top of climb, before each scheduled in-flight rest break, and at top of descent. For each flight sector, participants were also asked to rate their workload for the entire flight on the NASA TLX. In addition, they were asked to record scheduled and actual break start- and end-times, sleep start- and end-times, and rate their sleepiness and fatigue before and after each sleep (pre- and post-sleep ratings are not reported here).
All identifying crewmember information was held by an Air NZ member of the research team, and sleep/duty diaries and actigraph data were labeled with a unique participant identification number. The Air NZ member of the research team scanned completed sleep/duty diaries and downloaded actigraphy files which were securely transferred to the SWRC. At the end of data collection all paper diaries and consent forms were forwarded to the SWRC for secure storage and archiving.
Sleep/duty diaries, including the pre-study questionnaire and lookback report, were completed by all cabin crew, and were entered into a MS Access database. Once data entry was completed, data were screened for outliers, which were cross-checked against the sleep/duty diary data. In some instances, certain responses were missing. For one crewmember, all inbound diary pages were missing. The number of available responses for each measure are included in the results tables.
Actigraphy data recorded in the Proportional Instrument (PIM) mode was scored with the UCSD algorithm applied in the ActionW2.7 software program (Ambulatory Monitoring Inc, Ardsley, NY) in conjunction with sleep diary information. To assess the reliability of the manual identification of time-in-bed intervals, 20% of files were independently double-scored by a second trained researcher. Discrepancies of more than 15 min occurred in 8.8% of time-in-bed interval start times and 13.4% of time-in-bed interval end times and an overall agreement (agreement being classed as 15 min or less difference between scorers) of 88.9% was achieved. All discrepancies were double-checked, and any errors corrected.
Actigraphy variables were exported via MS Excel to a custom-built program (53) in R (54) where for each crewmember, total sleep was calculated for specific 24-hour periods as follows:
• Baseline sleep: was calculated for an individual as the average sleep obtained at home in the two 24-hour periods from midday to midday (AKL time) that preceded midday on the day of departure. Sleep was included if duties preceding a sleep period ended before 19:00 and was not followed by a subsequent early sign on time (i.e., sleep was not curtailed by work). If a crewmember arrived back from an international flight on the morning of the first “baseline” day, subsequent sleep was included. Therefore, in most instances, there are two baseline days of sleep data for each crewmember.
• Pre-flight sleep: total sleep in the 24 h prior signing on for duty for each flight.
• Layover sleep (day 1; day 2): total sleep per 24 h from noon-to-noon AKL time, to enable comparisons with sleep at home.
• Post-trip sleep: total sleep per 24 h from noon-to-noon AKL time across three days from the day of arrival in AKL. Any sleep before noon on the day of arrival was not included to enable comparisons with baseline sleep.
Actigraphy data were available for all except three participants. In addition, one crewmember began wearing the actigraph on the day of the outbound flight and had no pre-flight sleep data. “Baseline day 1” sleep was missing for eight crewmembers and excluded for 12 crewmembers whose sleep was curtailed by work. “Layover day 1” sleep was missing for three crewmembers and “Layover day 2” sleep was missing for two crewmembers; “Post-trip day 1” sleep was missing for two crewmembers; “Post-trip day 2” sleep was missing for two crewmembers; and “Post-trip day 3” sleep was missing for eight crewmembers.
Statistical analysis
Descriptive statistics were calculated in SPSS 25 (IBM Corp., Armonk, NY) or SAS 9.4 software (SAS Institute Inc., Cary, NC, USA) and plots prepared using MS Excel for Windows, IBM SPSS Statistics 25, RStudio, Version 1.2.1335 (Integrated Development for R. RStudio, Inc., Boston, MA); and Prism 6.01 for Windows (Graphpad Software, Inc). For univariate comparisons of non-normally distributed data, Wilcoxon rank sum tests, and Kruskal-Wallis tests with Benjamini and Yekutieli adjustment were undertaken in RStudio.
Linear mixed modelling was undertaken in SAS 9.4. For mixed design ANOVAs for repeated measures, appropriate covariance structures suitable for unequally spaced data were considered (compound symmetry or first order ante-dependence) and the Bayesian Information Criteria was used to determine which covariance structure provided the best model fit. Subject ID was included as random effect to account for individual differences. The Kenward-Roger adjustment was applied to the degrees of freedom estimation (55). For between-subject mixed models, subject ID was included as a random effect with “variance components” applied as covariance structure. For each model, assumptions of normality, linearity, and constant variance were checked visually and the distribution of the residuals were tested with the Shapiro-Wilk test of normality, and Levene's test for constant variance (56). If outlying residuals were identified, the model was rerun excluding the outlier(s). If removal of the outlier(s) changed the findings of the model, the reported results exclude the outlier(s) but otherwise results are reported with the outlier(s) included.
Post hoc pairwise comparison tests were used to investigate statistically significant main effects and for statistically significant interaction effects, simple effect tests were used to investigate comparisons of interests. Holm's sequentially rejective procedure was used to adjust the level of significance for more than two levels of comparisons (57).
Results
Table 1 provides details of the participating cabin crew in the study. A total of 80 cabin crew were approached regarding the study; 78 cabin crew received a study pack, however 11 did not begin data collection. One cabin crew stopped participating on the outbound flight, and one did not return a diary; as such, 65 cabin crew (45 women; 20 men) provided sufficient data to be included in the study and, among these, 59 had complete data sets.

Table 1. Crew demographics by cabin crew position.
A total of 20 return trips were studied (20 outbound and 20 inbound flights) between 10 July 2019 and 5 October 2019. The number of participating crewmembers on each flight varied, ranging from one to five. Daylight saving began in New Zealand on 29 September 2019, with one trip studied after that date. Therefore, there was a 7-hour time difference between Auckland and Chicago in most instances. As illustrated in Figure 1, both flights spanned the domicile night. Outbound flights (AKL-ORD) had a median duration of 14.9 h, and duty times were on average 17.3 h (Table 2). Inbound flights (ORD-AKL) were 1.2 h longer on average and duty time averaged 18.3 h. Layover duration was close to 48 h (calculated between duty-end and start-times).

Figure 1. Median flight departure and arrival times and flight durations relative to domicile and local times. NZ, New Zealand; CDT, central daylight time; EASA, European union aviation safety agency; UK CAP 371, the avoidance of fatigue in aircrews guide to requirements, United Kingdom civil aviation authority.
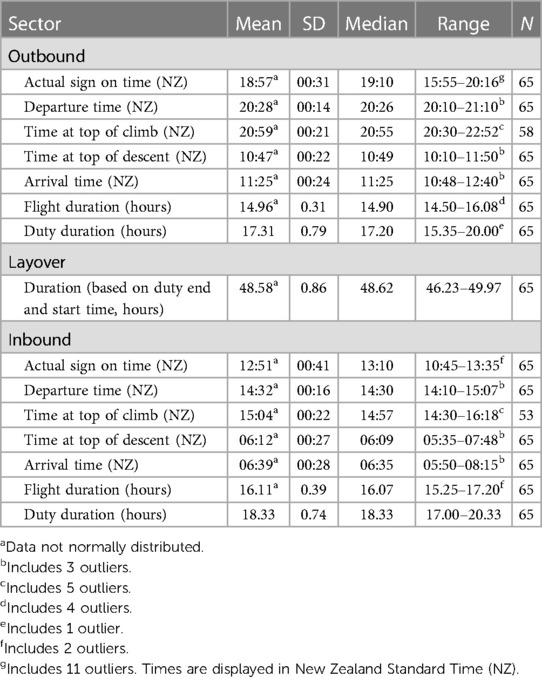
Table 2. Flight details.
Figure 2 shows the overall pattern of sleep and flight times for cabin crew across the duration of the study. A single crewmember's data is presented as one row across the page and each day of the study is a column. Total sleep per 24 h at home pre- and post-trip, and on layover, is summarized in Table 3.

Figure 2. Pattern of sleep and work for cabin crew across the AKL-ORD-AKL trip. Figure key: Dark blue bars, sleep periods recorded using actigraphy; Light blue bars, sleep periods recorded using the duty/sleep diary; Brown bars, flight sectors; Green shading, domicile night in New Zealand; Dark grey shading, local night in Chicago.
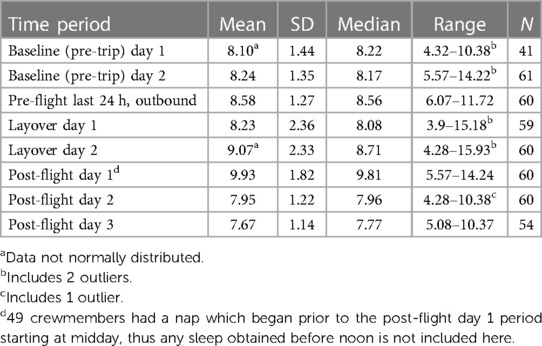
Table 3. Total sleep time (hours) at home pre- and post-flight, and on layover.
Sleep at home and on layover
A mixed model ANOVA for repeated measures showed that compared to their baseline sleep (estimated mean = 8.2 h), cabin crew obtained more sleep in the 24 h prior to the outbound flight (estimated mean = 8.5 h), F(1, 103) = 4.31, p = 0.040. On the day of the outbound flight, 49.2% cabin crew had a pre-flight nap and 91.7% obtained at least 7 h sleep (8.3% obtained less than 7 h sleep).
A second mixed model ANOVA for repeated measures showed that cabin crews' layover sleep differed significantly from their baseline sleep (F(2, 160) = 4.47, p = 0.013). Post hoc pairwise comparisons indicated that compared to their baseline sleep, cabin crew obtained a similar amount of sleep on the first day of the layover (estimated mean = 8.2 h, p = 0.987) but obtained on average 53 min more sleep on the second day of the layover (estimated mean = 9.1 h, p = 0.010). The number of sleep episodes, sleep timing, and sleep durations were highly variable between crewmembers (see Figure 2) but 83.3% obtained at least 7 h sleep on the second layover day (16.7% obtained less than 7 h) and 33.9% napped at various times prior to departure of the inbound flight.
A mixed model ANOVA comparing total sleep in the 24 h prior to the outbound and inbound flight found that sleep in the 24 h prior the inbound flight (estimated mean = 9.1 h) did not differ significantly from the amount of sleep obtained prior the outbound flight (estimated mean = 8.6 h), (F(1, 59.6) = 2.52, p = 0.117).
A third mixed model ANOVA for repeated measures showed that cabin crews' post-trip sleep differed significantly from their baseline sleep (F(3, 213) = 36.85, p < 0.001). Post hoc pairwise comparisons indicated that cabin crew slept on average 1.7 h more on post-flight day 1 (on average 9.9 h) compared to baseline days (on average 8.2 h), p < 0.001. On subsequent post-flight days, cabin crews' sleep per 24 h did not significantly differ from baseline.
In-flight rest and sleep, workload, fatigue, and sleepiness during ULR duty
On the outbound flight, all except three crewmembers had a single long break, either during the first half or second half of the cruise phase of flight. On the longer inbound flight, 29% had a single long break, while 71% had two scheduled rest breaks in the bunk. Where crew were provided with two rest breaks each, three different rest patterns were observed, namely: “long-long-short-short” (4 h15-4 h15-1 h-1 h), “short-long-long-short” (1 h30-3 h30-3 h30-1 h30), or “short-short-long-long” (1 h20-1 h20-3 h30-3 h30). All crewmembers attempted and obtained sleep on the outbound flight. On the longer inbound flight, three crewmembers with two scheduled breaks (short + long) did not attempt sleep during their first, short rest break. Three other crewmembers who attempted sleep during their first short bunk rest did not obtain sleep, one of whom also did not manage to obtain sleep during their second break. One other crewmember with a long + short break did not manage to fall asleep during their short break.
The additional rest provision in the high comfort seat was utilized by 36.9% crewmembers on the outbound flight, and by 32.3% crewmembers on the inbound flight. On the inbound flight, the proportion of crewmembers using the additional rest provision was higher among crew with one break (53%) compared to those with two breaks each (24%).
Total rest duration in the bunk was on average longer on the inbound flight (estimated mean = 4.84 h) compared to the outbound flight (estimated mean = 4.31 h), F(1, 63.6) = 79.96, p < 0.001. A mixed model ANCOVA investigated whether total in-flight sleep differed between flight sectors, irrespective of the rest break pattern. Crewmembers' age and sex was also included in this model. Total in-flight sleep did not differ between flight sectors (F(1, 61) = 0.06, p = 0.804) with cabin crew obtaining a similar amount of sleep on the outbound flight (estimated mean = 2.42 h) and on the inbound flight (estimated mean = 2.38 h). Age and sex were not associated with the amount of in-flight sleep obtained (F(1, 59) = 0.01, p = 0.913; F(1, 59) = 1.14, p = 0.291).
The effect of timing of the rest break relative to the domicile night was evaluated only for cabin crews’ long(er) break, due to the various rest break patterns being used on the inbound flight. For crew with a single rest break, the cruise portion of each flight was divided into two equal time bins. For crewmembers with two scheduled breaks each, the cruise portion on these flights was divided into 3, with the long break occurring either in the first third, middle third, or last third of the cruise. On outbound flights, all but three crewmembers had a single long break and crewmembers who had their break during the second half of cruise obtained significantly more sleep (estimated mean = 167.7 min) than the those who had their break scheduled during the first half of cruise (estimated mean = 122.9 min), F(1, 59) = 14.46, p < 0.001 (Figure 3A). On inbound flights, crewmembers with a single break (the majority of these timed during second half of the cruise) obtained on average 40 min more sleep (estimated mean = 174.0 min) than crew with two scheduled rest breaks (estimated mean = 133.7 min), F(1, 60) = 11.59, p = 0.001. The influence of the timing of the long break on total in-flight sleep was evaluated separately for crew with a single long break and those with two scheduled breaks. For crew with a single break, total in-flight sleep differed significantly depending on the timing of the break, Ws = 69.0, z = 2.07, p = 0.038. Crewmembers obtained more sleep in the first half of cruise (median = 206 min; n = 5) compared to crew with their break in the second half of cruise (median = 164 min; n = 13) (Figure 3B). For crew with two scheduled breaks, total in-flight sleep did not differ by the timing of their longer break (first 3rd of cruise median = 103.5 min, n = 4; middle 3rd of cruise median = 132.0 min, n = 21; last 3rd of cruise median = 137.0 min, n = 19), (H(2) = 1.16, p = 0.560 (Figure 3C).

Figure 3. Total in-flight sleep by timing of long break for crew with a single break on outbound flights (A), and a single (B) or two breaks (C) on inbound flights.
Ratings of sleepiness and fatigue were made multiple times during each flight sector but due to the highly variable pattern and timing of rest breaks, only ratings completed pre-flight, at top of climb, at top of descent and after landing are considered here. To evaluate changes in sleepiness and fatigue ratings across the flight, mixed model ANOVAs for repeated measures considered the time at which the rating was made (pre-flight, top of climb, top of descent, after landing), flight sector (outbound or inbound), and the interaction between rating time and flight sector. Findings are summarised in Table 4.

Table 4. Effect of time and sector on Karolinska sleepiness scale ratings and Samn-Perelli fatigue ratings during ULR duty.
Sleepiness ratings (Figure 4A) and fatigue ratings (Figure 4B) changed significantly across each flight, with cabin crew feeling least sleepy and fatigued pre-flight and getting progressively sleepier and more fatigued. Simple effect tests indicated that on both flight sectors, cabin crew were significantly sleepier and more fatigued at top of climb compared to pre-flight, sleepier, and more fatigued at top of descent compared to top of climb and pre-flight, and sleepier and more fatigued after landing compared to top of descent, top of climb and pre-flight. Cabin crew felt significantly sleepier and more fatigued on the inbound flight than on the outbound flight at pre-flight, top of climb, and top of descent. On the inbound flight, cabin crew also felt more fatigued after landing whereas sleepiness ratings after landing did not significantly differ between flight sectors.
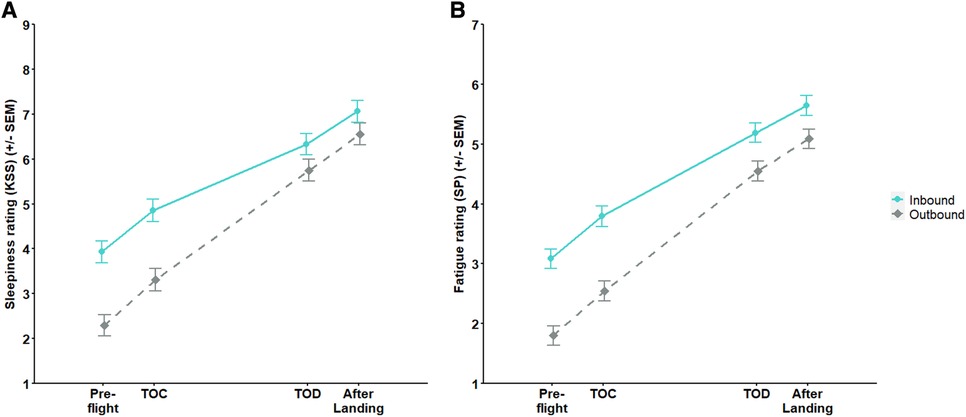
Figure 4. Estimated mean sleepiness ratings (A) and fatigue ratings (B) of cabin crew during the outbound and inbound flight. TOC, top of climb; TOD, top of descent.
Compared to the outbound flight, a larger proportion of cabin crew had sleepiness ratings ≥7 (Figure 5A), and fatigue ratings ≥5 (Figure 5B) at each rating time on the inbound flight.

Figure 5. Percentage of cabin crew with sleepiness ratings ≥7 (A) and fatigue ratings ≥5 (B) during outbound and inbound flights. TOC, top of climb.
Due to the highly variable pattern and timing of rest breaks, only overall workload ratings at top of climb and top of descent ratings were analysed (Table 5). A mixed model ANOVA evaluated whether OW ratings differed between top of climb and top of descent, between flight sectors, and/or between cabin class worked (4 crewmembers who worked in more than one cabin class during the flight were excluded from this analysis). Overall Workload ratings did not differ between top of climb and top of descent (F(1, 174) = 1.29, p = 0.257), or between outbound and inbound flights (F(1, 176) = 3.60, p = 0.059) but differed significantly by cabin class worked (F(2, 193) = 13.45, p < 0.001). Post hoc pairwise comparisons indicated that cabin crew who worked in Business Premier had significantly higher OW ratings when compared to cabin crew working in either Premium Economy (p < 0.001) or Economy class (p < .001).
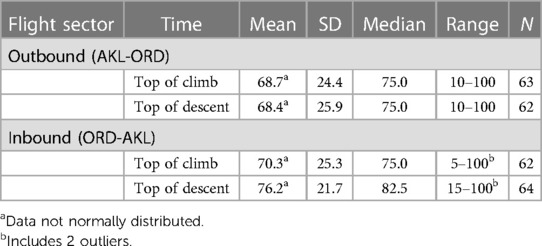
Table 5. Overall workload (OW) ratings at top of climb and top of descent on each flight sector.
Table 6 compares each of the 6 NASA Task Load Index subscales between outbound and inbound flights. Two mixed model ANCOVAs did not find an association between cabin crews’ overall mean TLX scores and either total in-flight sleep (F(1, 103) = 0.00, p = 0.951) or total sleep in the 24 h prior top of descent (F(1, 113) = 0.07, p = 0.799), and duration of prior wakefulness at top of descent (F(1, 84.7) = 2.55, p = 0.114), but overall mean TLX scores were significantly higher on the inbound flight (estimated mean = 59.15) than on outbound flight (estimated mean = 51.03), F(1, 57.3) = 11.41, p = 0.001.
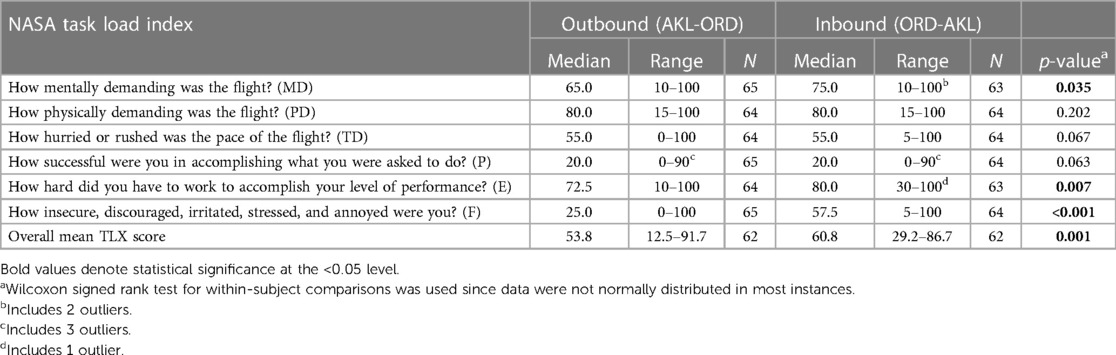
Table 6. Workload on each flight sector assessed with NASA task load index.
A series of mixed model ANCOVAs investigated the factors influencing sleepiness and fatigue ratings at top of descent. For each outcome variable, four models were run with the first model including the amount of in-flight sleep obtained, the length of time a crewmember had been awake at top of descent, OW rating at top of descent, and flight sector (outbound or inbound). The second model was similar but included total sleep in the 24 h prior to top of descent instead of the amount of sleep obtained in flight. These models were repeated but instead of OW ratings at top of descent they included workload rated for the entire flight on the NASA TLX (overall mean TLX score). Findings of the mixed model ANCOVAs are summarised in Table 7.
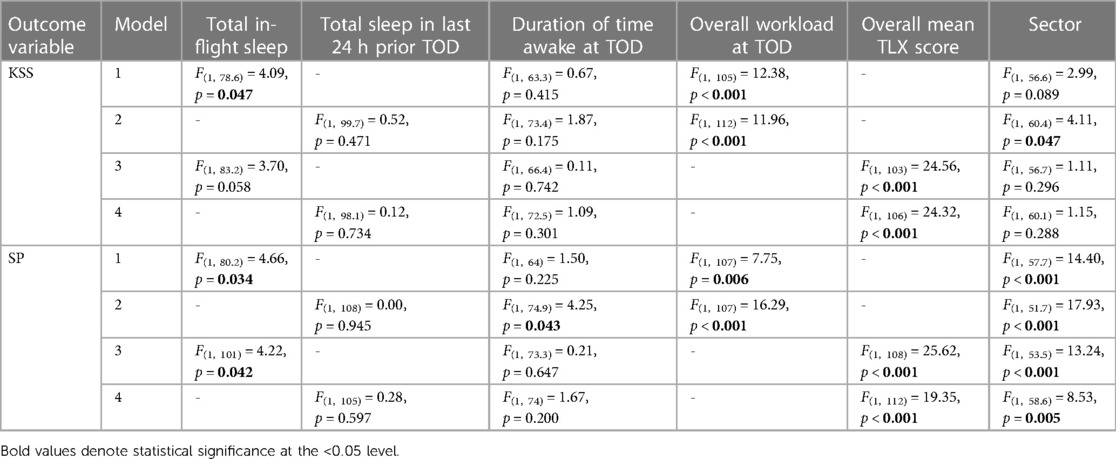
Table 7. Effect of sleep/wake history and workload on sleepiness and fatigue at top of descent.
Sleepiness ratings at top of descent were associated with total in-flight sleep, but not with the duration of time awake prior to top of descent or total sleep in the 24 h prior to top of descent (Table 7). For every hour of additional sleep obtained in-flight, sleepiness ratings at top of descent decreased by 0.38 points. With every 10-point increase in OW ratings, sleepiness ratings at top of descent increased by 0.24 points. In models that included mean TLX score instead of OW ratings, no relationships were found between cabin crews' sleep/wake history and sleepiness at top of descent, but with every 10-point increase in the overall mean TLX score, sleepiness ratings increased by 0.45 points.
Fatigue ratings at top of descent were associated with total in-flight sleep and time awake at top of descent, but not with total sleep in the last 24 h prior top of descent (Table 7). For every hour of additional sleep obtained in-flight, fatigue ratings at top of descent decreased by 0.24 points. After controlling for total sleep in 24 h prior to top of descent and at OW at top of descent, fatigue ratings at top of descent increased by 0.06 points with every hour of additional wakefulness. With every 10-point increase in OW ratings, fatigue ratings at top of descent increased by 0.24 points. With every 10-point increase in overall mean TLX score, fatigue ratings at top of descent increased by 0.28 points.
Feelings of jet lag
As shown in Figure 6, jet lag ratings varied widely between individuals. A series of mixed model ANOVAs for repeated measures were used to investigate changes in jet lag ratings across days. Across pre-trip days 1–3, jet lag ratings changed significantly (F(2, 109) = 10.70, p < 0.001). Post hoc pairwise comparisons indicated that cabin crew rated their jet lag as significantly lower on pre-trip day 3 when compared to pre-trip day 1 (p < 0.001) and pre-trip day 2 (p = 0.001). Forty-four crewmembers also rated their jet lag on the day of departure of the outbound flight, which did not significantly differ from ratings the day prior (F(1, 28) = 3.97, p = 0.056).
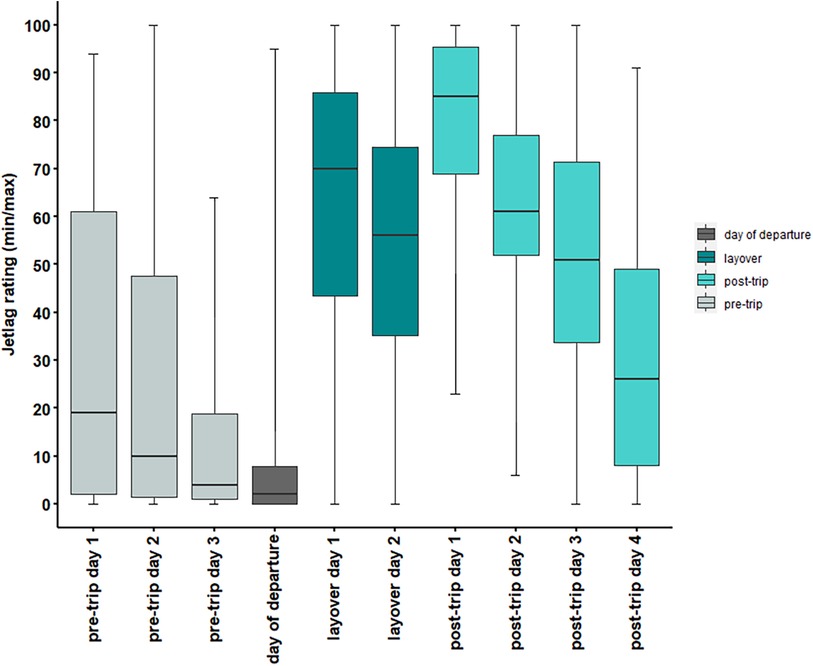
Figure 6. Feelings of jet lag ratings at home pre-trip, during layover, and post-trip.
On layover, jet lag ratings were significantly lower on day 2 (i.e., after the second night's sleep) than on day 1 (F(1, 45.9) = 9.89, p = 0.003). Post-trip, jet lag ratings differed significantly between post-trip days (F(3, 156) = 55.63, p < 0.001). Post hoc pairwise comparisons indicated that jet lag ratings differed between each day (p < 0.01 in all instances) and were lowest on the last day. An additional model showed that jet lag ratings on the last post-trip day were higher than on the day of departure of the outbound flight (F(1, 53.9) = 26.52, p < .001).
Discussion
Cabin crews' participation in the present study was excellent, with 98% of those approached agreeing to participate, 86% beginning data collection and of those, 97% providing useable data. Overall, the data collected were of high quality and with only a small amount missing. In comparison, in a previous ULR validation study involving cabin crew, 73% of those invited agreed to participate, with 60% completing data collection and 41% provided data of suitable quality (21). The present findings suggest that cabin crew found the study measures and processes acceptable which should be taken into account when planning future fatigue monitoring studies.
The amount of sleep cabin crew obtained pre-flight suggests that they prepared for the Auckland-Chicago-Auckland flights, by obtaining on average more sleep in the 24 h prior to the outbound flight (8.5 h) and inbound flights (9.1 h) when compared to their baseline sleep (8.2 h), and more than the average pre-flight sleep (7 h) of cabin crew prior to a ULR flight departing at a similar domicile time (21). A small proportion of crewmembers obtained less than the recommended minimum 7 h sleep per 24 h (58) prior to the outbound flight (8.3%, vs. 91.7% who obtained at least 7 h) and inbound flight (16.7%, vs. 83.3% who obtained at least 7 h), which may suggest insufficient recovery for those crewmembers. Several factors may have impacted on cabin crews' pre-flight sleep. A previous study with cabin crew indicated that there was generally a trade-off between sleep and other activities in an attempt to fit everything into the limited time available (59). Cabin crew flying long range and ULR face the additional challenge of recurrent jet lag and a common complaint associated with this is disturbed sleep (60, 61).
Declining jet lag ratings across the three pre-trip days suggest that some crewmembers were still recovering from a previous trip during those days. Similarly, jet lag ratings on the second layover day were lower than on the first layover day, suggesting some adaptation to local Chicago time and/or some recovery from sleep loss accrued on the outbound sector. It is however not clear to what extent subjective ratings of jet lag in the present study reflect disruption in circadian rhythms and whether they also reflect recovery from sleep loss. In one previous study, cabin crews' feelings of jet lag were most strongly associated with mean daily sleepiness ratings (33). A recent study found that a phase shift in cabin crews' urinary melatonin peak time was associated with jet lag ratings prior to but not following a long-haul trip and changes in jet lag ratings were predicted by self-reported arousal state only (62). Taken together, the present findings highlight the importance of cabin crew having protected days free of duty in advance of both flights in a ULR duty. In addition, recurrency training that includes education on optimizing sleep would support cabin crew in making decisions about sleep at home and on layover in preparation for ULR flights.
Due to differences in rise times on the day of departure and use of pre-flight naps (outbound 49% of crewmembers; inbound 34% of crewmembers), the length of time awake prior to departure was highly variable between crewmembers (outbound: 1.5–14.8 h; inbound: 1.1–12.1 h). On average, crew had been awake longer prior to the outbound flight than prior to the inbound flight, likely due to the different domicile departure times (evening vs. afternoon, as illustrated in Figure 2). Additionally, domestic and/or family commitments may have precluded a later wake up time on the day of the outbound flight. Neither total sleep in the 24 h prior to sign on, nor duration of time awake were found to be related to pre-flight ratings of sleepiness and fatigue. However, cabin crew felt significantly more sleepy and fatigued prior to the inbound flight (estimated mean = 4.0 and 3.2 respectively) when compared to the outbound flight (estimated mean = 2.3 and 1.8 respectively). The proportion of cabin crew with sleepiness ratings of 7 or above was also larger prior to the inbound flight (15.9%) than prior to the outbound flight (3.2%). Similarly for fatigue ratings, 17.5% of crewmembers had ratings of 5 or above prior to the inbound flight, compared to 1.6% prior to the outbound flight. The lack of an association between pre-flight sleep/wake history and ratings of sleepiness and fatigue pre-flight may reflect the relatively limited sleep loss and duration of wakefulness cabin crew experienced pre-flight. However, the lack of association should not be interpreted as suggesting that these factors are unimportant. Among 237 commercial airline pilots flying long range and ULR flights, more sleep in the 24 h prior duty was associated with pilots feeling less sleepy and fatigued and performing better on a psychomotor vigilance task (PVT) pre-flight, whereas the duration of time awake was not associated with pilots’ pre-flight status (63). In laboratory studies, the relationships between sleep/wake history and subjective sleepiness have been clearly documented (2, 3), albeit under conditions of greater sleep loss and/or longer periods of wakefulness than in the present study. The higher pre-flight ratings prior to the inbound flight may be indicative of incomplete recovery from the cumulative effects of the outbound flight, circadian disruption, and time of day differences. The departure of the outbound flight occurred in the evening wake maintenance zone when alertness is promoted, whereas the inbound flight departed in the afternoon domicile time when there is a natural decrease in alertness. Pre-flight napping should be encouraged to reduce the duration of time awake and is another layer of protection in the event crewmembers are not able to sleep in flight. Previous studies have shown that pre-flight napping does not influence the amount of sleep during the first in-flight rest break, or the amount of total in-flight sleep (17, 21). Increasing the uptake of napping could be achieved through recurrent fatigue management training for cabin crew.
The airline's recommendation to schedule two rest breaks in the bunk on each flight sector was predominantly utilized only on the longer inbound flight for 71% of crewmembers (on the outbound flight only for 5% of crewmembers). On average, cabin crew obtained 2.4 h sleep on the outbound flight and although they had more time available in the bunk on the longer inbound flight, they did not obtain more sleep (2.4 h on average).
As expected, crewmembers with a single long break on the outbound sector obtained more sleep (estimated mean = 2.8 h) during the second half of the cruise phase than those who had their break earlier in flight (estimated mean = 2.0 h). This is likely due to the second rest break spanning the early hours of crewmembers' biological night and occurring after a longer period of prior wakefulness. In contrast, on the inbound sector, crew with a single break during the second half of cruise obtained less sleep on average than crew with their break during first half of cruise, even though their break occurred during a more favorable time for sleep (assuming minimal adaptation during the two-day layover). An important caveat here is that very few crew (n = 5) had their break in the first half of cruise, so this finding should be considered with caution. For cabin crew with two breaks each, a trend was observed for more sleep obtained when the longer break was timed later in flight, coinciding with the domicile night, but this finding was not significant.
On inbound flights, crewmembers with a single break obtained on average 40 min more sleep than crew with two scheduled rest breaks each (2.9 h vs. 2.2 h), whereas total break duration did not differ between crewmembers with one or two breaks. Obtaining more in-flight sleep was shown to be protective against higher sleepiness and fatigue at top of descent. However, findings also showed that a longer period awake was associated with higher fatigue ratings at top of descent. There are two issues to consider here, optimizing the total amount of in-flight sleep as well as minimizing the duration of wakefulness at top of descent on these very long flights.
Even though the longer of two breaks was scheduled to align with crewmembers' biological night, it is unknown how much crewmembers' circadian phase would have shifted following two days in a time zone 7 h ahead of domicile time. Another possible reason why on the inbound flight, crew with two breaks obtained less sleep than those with a single break is the way these breaks were split, i.e., a short (1 h–1 h30) plus a longer (3 h20–4 h15) break. By comparison, the usual in-flight rest pattern utilized on the ULR sector by South African Airways cabin crew was either 3 h-3 h-2 h-2 h or 2 h-2 h-3 h-3 h (21). In that study, cabin crew obtained on average 3.6 h sleep on the longer ULR flight (outbound sector, 16.0 h flight duration), 1.2 h more than Air New Zealand cabin crew on the ORD-AKL ULR flight (16.1 h flight duration).
Thus, optimizing the total amount of in-flight sleep, while also minimizing the duration of wakefulness at top of descent could be achieved by altering the duration of the two breaks for each crewmember. Furthermore, in the present study, three crewmembers did not attempt sleep during their first, shorter break, and three other crewmembers did not manage to obtain sleep during their first, shorter break. Splitting in-flight rest more evenly in two may reduce the likelihood of crew not attempting or obtaining sleep during their shorter break, although this will also be influenced by other factors, including the timing of the break relative to the crewmember's biological night.
Overall workload ratings were high at both top of climb and at top of descent, and at both time points did not differ between the outbound and inbound sector, whereas workload rated on the NASA Task Load Index was higher on the inbound flight, including higher mental demands, effort, and frustration. Ratings on the frustration subscale were higher on the inbound flight and although a negative emotional response to the work demands (49) may affect interactions with others (64), the relationship between momentary negative emotions and team performance, and specifically Crew Resource Management, requires further investigation. Overall mean TLX scores, as well as Overall Workload ratings, were also higher among cabin crew working in Business Premier compared to Premium Economy and Economy. The higher workload in Business Premier is likely reflective of the additional customer service requirements, considering that the crew to passenger ratio in this cabin is higher.
Fatigue and sleepiness ratings at top of descent were higher on the inbound flight than on the outbound flight, with a larger proportion of cabin crew rating their sleepiness ≥7 and fatigue ≥5. The significant relationship found between the amount of in-flight sleep and top of descent sleepiness and fatigue ratings demonstrates that obtaining more in-flight sleep is protective against increasing sleepiness and fatigue. A shorter duration of time awake at top of descent was also found to be protective against increasing fatigue when controlling for overall workload.
Workload (on either measure) was also a significant predictor of cabin crews' sleepiness and fatigue at top of descent after taking into account crewmembers’ prior sleep/wake history (total in-flight sleep, total sleep in the 24 h prior, and time awake at top of descent) and corroborates previous findings (65). Thus, workload needs to be carefully managed by ensuring appropriate staffing levels, and/or modifying in-flight service requirements, while ensuring adequate time for safety-related tasks (59). Ongoing monitoring of workload should therefore be considered, for example by including a question on workload in fatigue reports.
Post-trip, fatigue and sleepiness ratings after landing were highest, with 71% of crewmembers rating their sleepiness ≥ 7, and 85.5% rating their fatigue ≥ 5. Most cabin crew (95%) took an afternoon nap on the day of arrival, and on average, they slept 1.7 h longer during the first 24 h post-trip compared to their baseline days (9.9 h compared to 8.2 h) but sleep duration on subsequent post-trip days was not significantly different from baseline, whereas jet lag ratings declined incrementally across post-trip days. Jet lag ratings made after the third night post-trip were still higher in comparison to jet lag ratings on the day of departure of the outbound flight, similar to findings from previous studies with cabin crew flying long-haul trips that involved large time zone changes (23, 24, 33). Together, these findings are not unexpected and support the need for a minimum rest period that includes at least four local nights following a ULR trip, to facilitate cabin crews' recovery from the effects of sleep restriction and circadian disruption associated with the ULR trip. In future studies, additional measures of cabin crews' recovery from the effects of sleep restriction and circadian disruption should be considered, as this may help guide more specific recommendations.
In conclusion, the mitigations for managing cabin crew fatigue and associated risk during this eastward outbound ULR trip between Auckland and Chicago appear to be well utilized on average, based on the finding that cabin crew obtain on average more sleep prior the outbound and inbound flight compared to their baseline sleep. Findings also indicate that some crewmembers had not sufficiently recovered prior to each flight. This highlights the importance of providing cabin crew with a protected period of time free of duty that includes a minimum of two local nights in advance of ULR flights, as well as recurrent fatigue management training that includes education on optimizing sleep to support cabin crew in making decisions about sleep in preparation for ULR flights. Further refinement of in-flight sleep and workload mitigations could be considered for managing fatigue risk at top-of-descent. Findings also highlight the importance of post-trip rest to facilitate cabin crews' recovery from the effects of sleep restriction and circadian disruption associated with this ULR trip. Operationally and in future research studies, consideration should be given to what is scheduled prior to and after ULR trips. This study contributes to the small body of knowledge on fatigue management for cabin crew on ULR routes and adds important novel information that can inform the planning of new ULR operations, although as with all studies the generalisability of findings to operations with different flight durations, departure times, and/or arrival times needs to be considered.
Data availability statement
The datasets presented in this article are not readily available because they contain commercially sensitive data. They are held at the Sleep/Wake Research Centre and under certain conditions information from these datasets may be available on request. Requests to access the datasets should be directed to MB,bS5qLnZhbmRlbmJlcmdAbWFzc2V5LmFjLm56.
Ethics statement
The studies involving humans were approved by Massey University Human Ethics Committee (Southern A). The studies were conducted in accordance with the local legislation and institutional requirements. The participants provided their written informed consent to participate in this study.
Author contributions
MB: Conceptualization, Data curation, Formal Analysis, Funding acquisition, Investigation, Methodology, Project administration, Resources, Visualization, Writing – original draft. JZ: Conceptualization, Data curation, Formal Analysis, Investigation, Methodology, Project administration, Resources, Visualization, Writing – review & editing. DM: Data curation, Formal Analysis, Visualization, Writing – review & editing, Methodology. LW: Conceptualization, Writing – review & editing. MH: Writing – review & editing. BJ: Conceptualization, Investigation, Writing – review & editing. CD: Conceptualization, Investigation, Writing – review & editing. MD: Conceptualization, Investigation, Writing – review & editing. TS: Conceptualization, Funding acquisition, Investigation, Methodology, Project administration, Resources, Supervision, Writing – review & editing, Visualization.
Acknowledgments
We would like to acknowledge the significant contribution of the participating cabin crew. This study was made possible by Sarah-Jane Whitehead at Air New Zealand, and we are extremely grateful to Natalie Ward and Kelvin Moreira at Air New Zealand for the time, energy, and effort they put into participant recruitment and data collection. At the Sleep/Wake Research Centre, we would like to acknowledge Kathryn Teal for her assistance with the data processing.
Conflict of interest
This study was funded by Air New Zealand and the research team included employees from Air New Zealand. Data were analysed and interpreted independently by authors from the Sleep/Wake Research Centre. The operational implications of the findings are informed by authors from Air New Zealand.
The authors declare that the research was conducted in the absence of any commercial or financial relationships that could be construed as a potential conflict of interest.
Publisher's note
All claims expressed in this article are solely those of the authors and do not necessarily represent those of their affiliated organizations, or those of the publisher, the editors and the reviewers. Any product that may be evaluated in this article, or claim that may be made by its manufacturer, is not guaranteed or endorsed by the publisher.
References
1. Flight Safety Foundation. Fourth workshop yields insights into early ultra-long-range operations. Flight Safety Digest. (2005) 24(8–9):1–15. Available at: https://www.flightsafety.org/fsd/fsd_aug-sept05.pdf
2. Van Dongen HPA, Maislin G, Mullington JM, Dinges DF. The cumulative cost of additional wakefulness: dose-response effects on neurobehavioral functions and sleep physiology from chronic sleep restriction and total sleep deprivation. Sleep. (2003) 26(2):117–26. doi: 10.1093/sleep/26.2.117
3. Belenky G, Wesensten NJ, Thorne DR, Thomas ML, Sing HC, Redmond DP, et al. Patterns of performance degradation and restoration during sleep restriction and subsequent recovery: a sleep dose-response study. J Sleep Res. (2003) 12(1):1–12. doi: 10.1046/j.1365-2869.2003.00337.x
4. Zhou X, Ferguson SA, Matthews RW, Sargent C, Darwent D, Kennaway DJ, et al. Sleep, wake and phase dependent changes in neurobehavioral function under forced desynchrony. Sleep. (2011) 34(7):931–41. doi: 10.5665/SLEEP.1130
5. Gander PH, Mangie J, Wu LJ, van den Berg MJ, Signal TL, Phillips A. Preparing safety cases for operating outside prescriptive fatigue risk management regulations. Aerosp Med Hum Perform. (2017) 88(7):688. doi: 10.3357/AMHP.4791.2017
6. International Air Transport Association. International civil aviation organisation, international federation of airline pilots associations. In: Fatigue management guide for airline operators. 2nd ed. (2015). p. 1–149.
7. Gander PH, Hartley L, Powell D, Cabon P, Hitchcock E, Mills A, et al. Fatigue risk management: organizational factors at the regulatory and industry/company level. Accid Anal Prev. (2011) 43(2):573–90. doi: 10.1016/j.aap.2009.11.007
8. Powell D, Spencer M, Holland D, Broadbent E, Petrie K. Pilot fatigue in short-haul operations: effects of number of sectors, duty length, and time of day. Aviat Space Environ Med. (2007) 78(7):698–701.17679568
9. Powell D, Spencer M, Petrie K. Automated collection of fatigue ratings at the top of descent: a practical commercial airline tool. Aviat Space Environ Med. (2011) 82(11):1037–41. doi: 10.3357/ASEM.3115.2011
10. Powell D, Spencer M, Petrie K. Fatigue in airline pilots after an additional day’s layover period. Aviat Space Environ Med. (2010) 81(11):1013–7. doi: 10.3357/ASEM.2804.2010
11. Powell D, Spencer M, Petrie K. Comparison of in-flight measures with predictions of a bio-mathematical fatigue model. Aviat Space Environ Med. (2014) 85(12):1177–84. doi: 10.3357/ASEM.3806.2014
12. International Civil Aviation Organization. Manual for the oversight of fatigue management approaches. 2nd ed. Montréal, Canada: ICAO (2016).
13. Flight Safety Foundation. Consensus emerges from international focus on crew alertness in ultra-long-range operations. Flight Safety Digest. (2003) 22:1–21. Available at: https://flightsafety.org/fsd/fsd_may-june03.pdf
14. Flight Safety Foundation. Cabin crews adapt readily to challenges of ultra-long-range flight. Flight Safety Digest. (2005) 24(8-9):41–5. Available at: https://www.flightsafety.org/fsd/fsd_aug-sept05.pdf
15. Signal TL, Gale J, Gander PH. Sleep measurement in flight crew: comparing actigraphic and subjective estimates to polysomnography. Aviat Space Environ Med. (2005) 76(11):1058–63.16313142
16. Gander PH, Signal TL, van den Berg MJ, Mulrine HM, Jay SM, Mangie J. In-flight sleep, pilot fatigue and psychomotor vigilance task performance on ultra-long range versus long range flights. J Sleep Res. (2013) 22(6):697–706. doi: 10.1111/jsr.12071
17. Signal TL, Mulrine HM, van den Berg MJ, Smith AAT, Gander PH, Serfontein W. Mitigating and monitoring flight crew fatigue on a westward ultra-long-range flight. Aviat Space Environ Med. (2014) 85(12):1199–208. doi: 10.3357/ASEM.4034.2014
18. Holmes A, Al-Bayat S, Hilditch CJ, Bourgeois-Bougrine S. Sleep and sleepiness during an ultra long-range flight operation between the Middle East and United States. Accid Anal Prev. (2012) 45(Supplement(0)):27–31. doi: 10.1016/j.aap.2011.09.021
19. Ho P, Lansberger S, Signal TL, Singh J, Stone B. The Singapore experience: task force studies scientific data to assess flights. Flight Safety Digest. (2005) 24(8-9):20–40. Available at: https://www.flightsafety.org/fsd/fsd_aug-sept05.pdf
20. Lamp A, McCullough D, Chen J, Brown R, Belenky G. Pilot sleep in long-range and ultra-long-range commercial flights. Aerosp Med Hum Perform. (2019) 90(2):109–15. doi: 10.3357/AMHP.5117.2019
21. van den Berg M, Signal TL, Mulrine HM, Smith AAT, Gander PH, Serfontein W. Monitoring and managing cabin crew sleep and fatigue during an ultra-long range trip. Aerosp Med Hum Perform. (2015) 86(8):705–13. doi: 10.3357/AMHP.4268.2015
22. Ferris M, Bowles K-A, Bray M, Bosley E, Rajaratnam SMW, Wolkow AP. The impact of shift work schedules on PVT performance in naturalistic settings: a systematic review. Int Arch Occup Environ Health. (2021) 94(7):1475–94. doi: 10.1007/s00420-021-01668-0
23. Härmä M, Laitinen J, Partinen M, Suvanto S. The effect of four-day round trip flights over 10 time zones on the circadian variation of salivary melatonin and cortisol in airline flight attendants. Ergonomics. (1994) 37(9):1479–89. doi: 10.1080/00140139408964927
24. Suvanto S, Härmä M, Ilmarinen J, Partinen M. Effects of 10 h time zone changes on female flight attendants’ circadian rhythms of body temperature, alertness, and visual search. Ergonomics. (1993) 36(6):613–25. doi: 10.1080/00140139308967924
25. Waterhouse J, Nevill A, Edwards B, Godfrey R, Reilly T. The relationship between assessments of jet lag and some of its symptoms. Chronobiol Int. (2003) 20(6):1061–73. doi: 10.1081/CBI-120025249
26. Petrie K, Dawson AG, Thompson L, Brook R. A double-blind trial of melatonin as a treatment for jet lag in international cabin crew. Biol Psychiatry. (1993) 33(7):526–30. doi: 10.1016/0006-3223(93)90007-Z
27. Ancoli-Israel S, Cole R, Alessi C, Chambers M, Moorcroft W, Pollak CP. The role of actigraphy in the study of sleep and circadian rhythms. Sleep. (2003) 26(3):342–92. doi: 10.1093/sleep/26.3.342
28. Sadeh A. The role and validity of actigraphy in sleep medicine: an update. Sleep Med Rev. (2011) 15(4):259–67. doi: 10.1016/j.smrv.2010.10.001
29. Roma P, Mallis M, Hursch S, Mead A, Nesthus T. Flight Attendant Fatigue recommendation II: Flight Attendant work/rest patterns, alertness, and performance assessment. Technical Report. Washington DC: Federal Aviation Administration, Office of Aerospace Medicine. (2010). Report No.: DOT/FAA/AM-10/22.
30. Grajewski B, Whelan E, Nguyen M, Kwan L, Cole R. Sleep disturbance in female flight attendants and teachers. Aerosp Med Hum Perform. (2016) 87(7):638–45. doi: 10.3357/AMHP.4512.2016
31. Vejvoda M, Samel A, Maaß H, Luks N, Schulze M, Mawet L. Study on strain, workload, and circadian rhythm in cabin crews during transmeridian flights. Aviat Space Environ Med. (2001) 72(3):289.
32. Lowden A, Åkerstedt T. Sleep and wake patterns in aircrew on a 2-day layover on westward long distance flights. Aviat Space Environ Med. (1998) 69(6):596–602.9641407
33. Lowden A, Åkerstedt T. Retaining home-base sleep hours to prevent jet lag in connection with a westward flight across nine time zones. Chronobiol Int. (1998) 15(4):365–76. doi: 10.3109/07420529808998696
34. Lowden A, Åkerstedt T. Eastward long distance flights, sleep and wake patterns in air crews in connection with a two-day layover. J Sleep Res. (1999) 8(1):15–24. doi: 10.1046/j.1365-2869.1999.00129.x
35. Signal TL, Gander PH, van den Berg MJ, Graeber RC. In-flight sleep of flight crew during a 7-hour rest break: implications for research and flight safety. Sleep. (2013) 36(1):109–15. doi: 10.5665/sleep.2312
36. Samel A, Wegmann HM, Vejvoda M, Drescher J, Gundel A, Manzey D, et al. Two-crew operations: stress and fatigue during long-haul night flights. Aviat Space Environ Med. (1997) 68(8):679–87.9262808
37. Samel A, Wegmann H-M, Vejvoda M. Aircrew fatigue in long-haul operations. Accid Anal Prev. (1997) 29(4):439–52. doi: 10.1016/S0001-4575(97)00023-7
38. Samn SW, Perelli LP. Estimating aircrew fatigue: A technique with implications to airlift operations.. Brooks AFB, Texas, USA: USAF School of Aerospace Medicine (1982). Report No.: SAM-TR-82-21.
39. Åkerstedt T, Gillberg M. Subjective and objective sleepiness in the active individual. Intern J Neuroscience. (1990) 52:29–37. doi: 10.3109/00207459008994241
40. Gillberg M, Kecklund G, Åkerstedt T. Relations between performance and subjective ratings of sleepiness during a night awake. Sleep. (1994) 17(3):236–41. doi: 10.1093/sleep/17.3.236
41. Härmä M, Sallinen M, Ranta R, Mutanen P, Muller K. The effect of an irregular shift system on sleepiness at work in train drivers and railway traffic controllers. J Sleep Res. (2002) 11(2):141–51. doi: 10.1046/j.1365-2869.2002.00294.x
42. Pascoe PA, Johnson MK, Montgomery JM, Roberston KA, Spencer MB. Sleep in rest facilities onboard aircraft: Questionnaire studies. Farnborough, UK: RAF Institute of Aviation Medicine (1994). Report No.: IAM 778.
43. Pascoe PA, Johnson MK, Roberston KA, Spencer MB. Sleep in rest facilities on board aircraft: Field studies. Farnborough, UK: DERA (1995). Report No.: DERA/CHS/A&N/CR/95/002.
44. Spencer MB, Roberston KA. The Haj operation: Comparison of the benefits of in-flight rest in a crew seat and a bunk. Farnborough, UK: DERA (2000). Report No.: DERA/CHS/PPD/CR00008.
45. Gander PH, Mulrine HM, van den Berg MJ, Smith AAT, Signal TL, Wu LJ, et al. Pilot fatigue: relationships with departure and arrival times, flight duration and direction. Aviat Space Environ Med. (2014) 85(8):833–40. doi: 10.3357/ASEM.3963.2014
46. Robertson KA, Spencer MB, Stone BM, Johnson MK. Scheduling the on-board rest of aircrew. Farnborough, UK: DERA (1997). Report No.: DERA/CHS/PP5/CR97095/1.0.
47. Gander PH, Mangie J, van den Berg MJ, Smith AAT, Mulrine HM, Signal TL. Crew fatigue safety performance indicators for fatigue risk management systems. Aviation. Space Environ Med. (2014) 85(2):139–47. doi: 10.3357/ASEM.3748.2014
48. Vidulich MA, Tsang PS. Absolute magnitude estimation and relative judgement approaches to subjective workload assessment. Proceedings of the human factors and ergonomics society annual meeting (1987). SAGE Publications.
49. Hart SG. Nasa-task load index (NASA-TLX); 20 years later. Proc Hum Factors Ergon Soc Annu Meet. (2006) 50(9):904–8. doi: 10.1177/154193120605000909
50. Hart SG, Staveland LE. Development of NASA-TLX (task load index): results of empirical and theoretical research. In: Hancock PA, Meshkati N, editors. Human mental workload. Amsterdam, Netherlands: North Holland Press (1988). p. 139–84.
51. Byers JC, Bittner AC, Hill SG. Traditional and raw task load index(TLX) correlations: are paired comparisons necessary? In: Mital A, editors. Advances in industrial ergonomics and safety. Vol 1. London, United Kingdom: Taylor & Francis (1989). p. 481–5.
52. Moroney WF, Biers DW, Eggemeier FT, Mitchell JA. A comparison of two scoring procedures with the NASA task load index in a simulated flight task. Aerospace and electronics conference (NAECON). Dayton, OH, USA: IEEE; 1992. p. 734–40.
53. Santos-Fernandez E, Wu L, van den Berg M. ActisoftR: a toolbox for processing and visualizing scored actigraphy data. (2018).
54. Core Team R. R: A language and environment for statistical computing. Vienna, Austria: R Foundation for Statistical Computing (2017).
55. Littell RC, Milliken G, Stroup W, Woldfinger R, Schabenberger O. SAS for mixed models. Cary, NC: SAS Institute (2006).
56. Tabachnick BG, Fidell LS. Using multivariate statistics. 6th ed. New Jersey, USA: Pearson (2013).
57. Aickin M, Gensler H. Adjusting for multiple testing when reporting research results: the Bonferroni vs Holm methods. Am J Public Health. (1996) 86:726–8. doi: 10.2105/AJPH.86.5.726
58. Hirshkowitz M, Whiton K, Albert S, Alessi C, Bruni O, DonCarlos L, et al. National sleep foundation’s sleep time duration recommendations: methodology and results summary. Sleep Health. (2015) 1(1):40–3. doi: 10.1016/j.sleh.2014.12.010
59. van den Berg M, Signal TL, Gander PH. Fatigue risk management for cabin crew: the importance of company support and sufficient rest for work-life balance—a qualitative study. Ind Health. (2020) 58:2–14.30996214
60. Avers K, King S, Nesthus T, Thomas S, Banks J. Flight Attendant Fatigue, Part I: National Duty, Rest, and Fatigue Survey. Technical Report. Washington DC: Federal Aviation Administration, Office of Aerospace Medicine. (2009). Report No.: DOT/FAA/AM-09/24.
61. Härmä M, Suvanto S, Partinen M. The effect of four-day round trip flights over 10 time zones on the sleep-wakefulness patterns of airline flight attendants. Ergonomics. (1994) 37(9):1461–78. doi: 10.1080/00140139408964926
62. Ruscitto C, Ogden J, Ellis J. To what extent is circadian phase predictive of subjective jet lag in long-haul cabin crew pre-and post-trip? Appl Ergon. (2023) 106(103882):1–12. doi: 10.1016/j.apergo.2022.103882
63. Gander PH, Mulrine HM, van den Berg MJ, Smith AAT, Signal TL, Wu LJ, et al. Effects of sleep/wake history and circadian phase on proposed pilot fatigue safety performance indicators. J Sleep Res. (2015) 24(1):110–9. doi: 10.1111/jsr.12197
64. Totterdell P, Niven K. Workplace moods and emotions: A review of research. Charleston, SC: Createspace Independent Publishing (2014).
Keywords: fatigue risk management, actigraphy, workload, sleepiness, circadian disruption
Citation: van den Berg MJ, Zaslona JL, Muller DP, Wu L, Hughes M, Johnston B, Dyer C, Drane M and Signal TL (2023) Managing cabin crew fatigue during ultra-long range operations. Front. Environ. Health 2:1329206. doi: 10.3389/fenvh.2023.1329206
Received: 28 October 2023; Accepted: 4 December 2023;
Published: 19 December 2023.
Edited by:
Dorothee Fischer, German Aerospace Center (DLR), GermanyReviewed by:
Cátia Reis, Universidade Católica Portuguesa, PortugalLaurie Marsman, Royal Netherlands Aerospace Centre, Netherlands
© 2023 van den Berg, Zaslona, Muller, Wu, Hughes, Johnston, Dyer, Drane and Signal. This is an open-access article distributed under the terms of the Creative Commons Attribution License (CC BY). The use, distribution or reproduction in other forums is permitted, provided the original author(s) and the copyright owner(s) are credited and that the original publication in this journal is cited, in accordance with accepted academic practice. No use, distribution or reproduction is permitted which does not comply with these terms.
*Correspondence: M. J. van den Berg bS5qLnZhbmRlbmJlcmdAbWFzc2V5LmFjLm56