
94% of researchers rate our articles as excellent or good
Learn more about the work of our research integrity team to safeguard the quality of each article we publish.
Find out more
ORIGINAL RESEARCH article
Front. Environ. Health, 11 January 2024
Sec. Occupational Safety and Health Interventions
Volume 2 - 2023 | https://doi.org/10.3389/fenvh.2023.1329203
This article is part of the Research TopicMaintaining Health, Safety and Cognitive Function Under Challenging Environmental and Working ConditionsView all 7 articles
 T. L. Signal1*
 M. J. van den Berg1
 J. L. Zaslona1L. Wu1M. Hughes2B. Johnston2C. Dyer2
 M. Drane2M. Glover3
Introduction: Ultra-long range (ULR) flights are defined as exceeding regulatory limits: normally 16 h flight time. They pose challenges due to long duty periods that could result in extended wakefulness and sleep loss, increasing the risk of fatigue. This study describes the mitigations used to manage fatigue in these operations. Two data collection phases were conducted on the Auckland-Chicago ULR route: when the route commenced (Study 1) and when the flight crew complement was altered (Study 2). Seasonal differences were also investigated.
Methods: Study 1 involved 72 crew who completed diaries and wore an actigraph to record sleep pre-departure, throughout the trip, and on return. In-flight, fatigue, sleepiness and workload were reported, and reaction time performance was measured. Study 2 involved 75 crew and data collection in the northern summer and northern winter. Crew completed diaries throughout the trip.
Results: Study 1 data found crew sleep longer than usual in the 24 h pre trip and post flights. On the shorter outbound flight in-flight sleep averaged 3.3 h and on the longer inbound flight, 3.3–3.8 h, with most crew taking 3 breaks. Ratings of sleepiness and fatigue increased, and reaction time performance declined across flights, with greater decrements on longer inbound flights. Pilots did not fully adjust their sleep patterns to local time during the layover and no seasonal differences were found. Comparisons between Study 1 and 2 showed no difference in ratings of fatigue and sleepiness or in-flight sleep duration with an altered crew complement. There was a trend for Captains to report greater workload and less in-flight sleep in Study 2.
Discussion: Mitigations that allow for preparation and recovery are well utilized by crew. In-flight sleep is relatively short and ways of increasing the amount of sleep obtained should be considered. The incomplete adaptation of sleep during the layover has implications for rest break strategies on the return flight. The altered crew complement did not result in higher levels of fatigue or sleepiness or less in-flight sleep on average, although findings suggest a need to understand the effects of changing the crew complement on workload and in-flight sleep for Captains.
Aviation is an ultra-safe industry (1) and is at the forefront of processes that support safety e.g., (2). Yet it is also an industry where technological advances can create challenges for human functioning. For example, newer aircraft that can operate very long commercial routes also require pilots to work long periods, up to 20 h in some instances. In most countries, operations of this length will exceed existing prescriptive duty time limits and are known as ultra-long range (ULR). They are recognized as challenging due to the potential for pilots to experience long periods of wake and limited amounts of sleep.
When aircraft manufacturers were first producing aircraft capable of operating commercially over much longer distances, the Flight Safety Foundation (FSF) convened a number of international workshops where operators, regulators and scientists reached consensus on processes that should accompany new ULR routes to ensure safety was equivalent to or better than safety in existing long range operations (3). Subsequent to the FSF consensus document, the International Civil Aviation Organization developed guidance for regulators and operators on managing the risk of fatigue in aviation operations (4, 5) which includes detail on the processes needed for a Fatigue Risk Management System (FRMS). An FRMS is a data driven method used to manage the risk of fatigue, including when operations fall outside of the prescriptive limits.
Based on these global guidelines, many regulators have developed specific requirements for ULR operations. For example in the United States, FAR Part 117 (6) requires flights that exceed current flight and duty time limits to be flown under an approved FRMS, for the operator to develop an alternative method of compliance (AMOC), and to demonstrate that this AMOC provides a level of safety equivalent to or better than current operations. Similarly, in Australia the Civil Aviation Safety Authority provides an option for an operator to obtain approval for an FRMS for operations that do not fit within current prescriptive limits (7) and in New Zealand operators who wish to work outside current flight and duty time limits can present an alternative scheme to the Civil Aviation Authority that has received scientific endorsement and demonstrates an equivalent or greater level of safety than prescribed schemes (8).
Fatigue-related risk in ULR operations is influenced by features of the operation such as the timing of departure and arrival windows, and length and direction of flights, along with fatigue mitigations in place such as pre and post trip rest opportunities, in-flight rest break strategies, layover duration, and crew complement. For example, previous research has shown that when the outbound flight departs in the evening, crew often nap and obtain more sleep in the 24 h prior to departure compared to other pre-trip days free of work (9, 10) but when the outbound flight departs early in the day prior sleep is shorter (11, 12). Longer flights (13, 14) and in-flight rest breaks at more biologically ideal times have been found to result in more in-flight sleep (11, 12), although acute sleep loss occurs in the 24 h period that includes the ULR flight (10). All previously documented ULR operations have an augmented crew and pilots receive guidance recommending two in-flight rest breaks, with the crew operating the take-off and landing phases of flight taking the second and fourth break to minimize time awake at top of descent (9, 11, 13). The relatively limited amount of sleep obtained in flight is thought to contribute to reports of increasing fatigue and sleepiness across a flight (9, 11). Following a ULR trip crew immediately return to sleeping on local time and sleep duration is similar to that obtained pre-trip or is extended slightly (9–11). Compared to existing long range operations, ULR operations have been shown to result in a greater amount of in-flight sleep and lower or equivalent levels of self-reported fatigue at top of descent (13, 14).
Although ULR flights have been operated safely for nearly two decades and the results from previous ULR data collection studies provide useful information when planning a new ULR route, the fatigue risks associated with each new ULR route must be considered (3) as no two operations will be the same. Furthermore, biomathematical tools are often utilized to support the planning of new routes but the validation of these tools may be limited in ULR operations. As such, a primary aim of the present study is to add to the growing body of knowledge on managing fatigue risk in ULR operations.
The ULR operation described here involves flights from Auckland (AKL) to Chicago (ORD) and return (AKL-ORD-AKL), with the inbound flight being the longer, ULR sector. Flights depart Auckland in the evening and pilots have 4 or 5 nights in Chicago before returning to Auckland, with the return flight also departing in the evening local time. The time difference between Auckland and Chicago can be between 5 and 7 h eastward depending on the time of the year. Fatigue mitigations provide protected time for preparation and recovery, including a minimum of 48 h pre-trip free of duty that includes 2 local nights, 96 h free of duty post-trip that includes 4 local nights, and a minimum of 48 h free of duty during the layover that includes 2 local nights. The crew is augmented with 2 additional pilots to enable in-flight rest breaks. Pilots were provided with guidance recommending two in-flight rest breaks each, with a longer break planned during the estimated biological night. In line with existing airline practices, advice on both the outbound and inbound flight was for the two pilots operating the descent and landing phase to have the first and third break, with the first break shorter due to it falling earlier in the evening (∼2.5 h) and for the second break to be longer (∼4 h). The relief crew were advised to have the second and fourth breaks, with a long first rest break (∼4 h) and a shorter second break (∼2.5 h). During initial operation of the route the augmenting crew was composed of one Captain and one First Officer, which after 9 months was changed to one First Officer and one Second Officer. As well as considering how fatigue mitigations were working during the initial phases of this ULR route, this study also considers the impact of altering the flight crew complement on fatigue risk, given that it is a key change to the operational conditions.
The altered crew complement was first implemented during the northern summer months when it was expected that crew would adapt to the layover time zone quickly and completely given the long layover duration and greater daylight hours in Chicago. Complete adaptation during the layover would result in crew operating the inbound landing and descent phase close to midday biological time. In contrast, if adaptation was slower during the northern winter, crew could be operating the inbound landing and descent phase at a less ideal biological time i.e., closer to 07:30. Based on findings from the initial operation, which are further detailed here, it was determined that data collection subsequent to the altered crew complement would occur in two phases: the first during northern summer months and the second during northern winter months. This would allow comparisons of fatigue metrics between seasons, which to our knowledge has not been previously investigated in ULR operations.
The ULR operation described here is embedded within the wider safety and risk management processes of the airline, which are in addition to the airline's extensive fatigue risk management processes that apply to all flight operations. To obtain regulatory approval the airline provided a safety case to the regulator, and a condition of the approval to operate the route was data collection during initial operations to determine if fatigue mitigations were functioning as intended. Data collection for these studies was also supported by a special scheduling agreement between the airline and the pilot body.
Data collection on the AKL-ORD-AKL ULR route began in December 2018, immediately after the operation commenced, with a priori power calculations indicating that a minimum of 48 complete data sets were needed for the comparisons of interest. This study is identified here as Study 1. The change in crew complement occurred in August 2019 and data was collected for 3 months in the northern summer (Study 2a) and for 2 months in the northern winter (Study 2b). Data collection for Study 2b was halted prematurely by the Covid-19 pandemic. Power calculations for Study 2 showed that a minimum of 48 complete data sets were required to compare with metrics from Study 1. Study 1 was reviewed and approved by the Massey University Human Ethics Committee (Application NOR 18/50). Study 2 was registered with the Massey University Human Ethics Committee Southern A (Institutional Review Board #00006014) as a low risk study.
Outbound flights departed in the evening from AKL (approximately 20:00) and arrived in ORD early in the evening (approximately 17:30 local time). Return flights departed ORD in the evening (approximately 21:00) and arrived in AKL in the early morning (approximately 06:30). Flights operated three times a week and crew were scheduled to have a 4- or 5-day layover in ORD. During data collection periods all pilots operating the B787-9 Dreamliner on the AKL-ORD-AKL route who had a 5-day layover (the predominant layover duration) were eligible to participate.
In Study 1, pilots' sleep was recorded using an actigraph. The Micro Motionlogger (Ambulatory Monitoring, Inc., Ardsley, New York, USA) was worn by the first 10 participants and an AW2 (Philips Respironics, Inc., Bend, Oregon, USA) was worn by the remainder of participants. Actigraphy is a validated, well recognised, widely used method for recording sleep in many different populations (15) and has been tested in flight crew (16). Actigraphy data were analysed using the respective manufacturer's software (either Actiware® version 6.0.9, Philips Respironics, Bend, Oregon, USA, using a medium sensitivity setting, or ActionW2.7, Ambulatory Monitoring Inc., Ardsley, New York, USA, using the UCSD algorithm) in conjunction with information recorded in a sleep/duty diary. Twenty-five percent of files were independently double-scored by a second trained researcher and actigraphy variables for each sleep period were exported to a custom-built program in R (Actisoft R1) (17). This program was used to sum sleep across 24 h intervals. In-flight self-reported sleep duration and location was also recorded in both studies. Self-reported sleep duration has shown a reasonable correlation (R2 = 0.63) with actigraphic estimates during a single in-flight rest on long haul flights (18). In Study 2, only diary records of sleep start and end times during the layover were available.
In both studies self-reported fatigue was rated pre-flight, at top of climb, top of descent, and after landing on the Samn-Perelli Crew Status Check (SP), using a scale from 1 = “fully alert, wide awake” to 7 = “completely exhausted, unable to function effectively” (19–21). At the same time, sleepiness was rated on the Karolinska Sleepiness Scale (KSS), using a scale from 1 = “extremely alert” to 9 = “extremely sleepy, fighting sleep” (22–24). Both scales have been extensively used in measuring an individual's perception of fatigue or sleepiness. The SP was developed specifically for use with flight crew (21) and has been used in previous studies focused on sleep loss, fatigue, and performance of flight crew (25–30). The KSS has been used to measure subjective sleepiness in both laboratory (22) and field studies (23, 24), including those with flight crew (25, 29). In controlled laboratory studies, values of ≥7 on the KSS have been associated with the occurrence of microsleeps (22). For the SP, airlines have been using values of ≥5 to indicate increased crewmember fatigue (9, 31).
In Study 1, pilots' reaction time performance was measured using a validated 5 min version of the Psychomotor Vigilance Task (PVT) (32) (PalmPVT, Walter Reed Army Institute of Research) loaded onto a Palm Centro Smartphone (Palm, Inc., Sunnyvale, California, USA). The PVT measures psychomotor performance, which includes the ability of an individual to sustain attention and respond rapidly when presented with information. It has the advantage of being simple and straightforward to use, of short duration, and does not require an individual to practice, except to make sure that participants know how to operate the testing device. Response speed (1/reaction time × 1000), slowest 10% of responses and fastest 10% of responses were generated from test data using REACT software (Ambulatory Monitoring Inc, USA).
Pilots rated their workload at top of climb and top of descent using the Overall Workload (OW) scale, which is presented as a horizontal line divided into 20 slots, anchored with “low” on the left and “high” on the right and results in a score between 0 (low) and 100 (high) in 5-step increments. It is simple and quick to complete, is sensitive to increased task difficulty, and has been used previously in the aviation environment (33). At 16:00 local time on each of the pre-trip days, during the layover, and on post-trip days feelings of jet lag were rated on a horizontal visual analog scale, anchored with “no jet lag” on the left and “extreme jet lag” on the right (34–36). A score between 0 (no jet lag) and 100 (extreme jet lag) was assigned.
All subjective ratings and records of in-flight sleep duration, and sleep start and end times were recorded in a paper-based sleep/duty diary. The diary was also used to provide demographic data and to record flight details: duty and flight times, timing of planned rest breaks, crew rank (e.g., Captain, First Officer) and the pre-assigned operating position (landing crew, who operated the take-off, departure, descent and landing phases of flight as well as for periods of time in the cruise, or relief crew, who only operated during cruise phases of flight).
Pilots were provided with information about the studies via internal communication channels. In Study 1, pilots were also phoned directly by an individual from the medical team in the airline and invited to participate. Interested pilots returned the signed consent form and attended a study training session over the phone. Equipment was provided approximately 5-days prior to a study trip. For Study 2, pilots collected a study pack at the airport prior to departure from a member of the research team and were briefed on the study requirements. They returned completed information anonymously on their arrival back in New Zealand.
As has been noted, the airline implemented a range of fatigue mitigations in association with this operation, including 48 h (2 local nights) free of duty prior to departure, a minimum 48 h layover that can be reduced to 36 h under special conditions, and 96 h (4 local nights) free of duty following the trip. Guidance material provided to pilots recommended that the outbound flight be split into four rest breaks (3.5 h, 4 h, 4 h, 3.5 h) with each crewmember scheduled for two breaks. On the inbound flight the recommendation to pilots was again for four rest breaks (3 h, 4.25 h, 4.25 h, 3 h). In developing the guidance material, the airline indicated the landing crew should have the 1st and 3rd rest break to align more closely with practices on other routes. This is in contrast to other ULR operations were the 2nd and 4th in-flight rest breaks are provided to the landing crew to minimise the duration of prior wakefulness before operating the aircraft during the approach and landing phase of flight.
In Study 1, pilots completed a sleep/duty diary and wore an actigraph to record their sleep for 3 local nights prior to the study trip; the entire duration of the study trip, including in-flight sectors and during the layover; and for 3 local nights after returning from the study trip. Ratings of fatigue and sleepiness were made pre and post in-flight sleep periods as well as pre-flight, at top of climb, top of descent and post flight, while reaction time performance was measured pre-flight, at top of climb and top of descent. Ratings of jet lag were made each day and subjective estimates of workload were recorded at top of climb and top of descent. In Study 2, similar study processes and identical measures were employed, with the following differences: less demographic information was collected; sleep was only recorded in the diary and actigraphy was not used; reaction time performance was not measured; and participants did not provide information on the 3 nights pre and post the study trip.
All data was labelled with a unique participant identification number. Equipment and paper-based diaries were collected by an airline member of the research team and data uploaded to a secure server for analysis by researchers at the Sleep/Wake Research Centre.
Descriptive statistics were calculated using IBM SPSS Statistics 25 (IBM Corp., Armonk, NY) or SAS 9.4 software (SAS Institute Inc., Cary, NC, USA) and plots prepared using RStudio, Version 1.3.959 (Integrated Development for R. RStudio, Inc., Boston, MA) and Graphpad Prism 6.0 (Graphpad Software, Inc. San Diego, California, USA). Kruskal-Wallis tests and Wilcoxon signed rank tests with Benjamini-Yekutiele adjustment were undertaken in RStudio. Chi-square tests and linear mixed modeling were undertaken using SAS 9.4.
Mixed model ANOVAs for repeated measures were used to compare total sleep per 24 h across days of the duty and included day of trip as a fixed factor. Mixed model ANOVAs investigating factors influencing sleep duration in flight included position (landing/relief), flight direction (outbound/inbound) and pilot age. An interaction of position with flight direction was also included but was not significant so was removed from the final model. Mixed model analyses investigating when pilots slept in flight included flight quartile (1st/2nd/3rd/4th) and position (landing/relief). To investigate change in fatigue, sleepiness and performance across flights, mixed model ANOVAs for repeated measures were used and considered the time at which the rating was made (pre-flight, top of climb, top of descent, after landing, repeated effect), crew position (landing/relief), flight direction (outbound/inbound), and the interaction of test time and flight direction, and position and flight direction.
To determine if there were seasonal differences between flights, mixed models investigated differences in measures at top of descent on the inbound flight. Models included season (northern winter/northern summer), crew position (landing/relief) and the interaction between season and crew position. Models were run separately for flights in Study 1 and Study 2.
Mixed model ANOVAs for repeated measures were used to investigate differences between in-flight sleep duration and fatigue, sleepiness and workload at top of descent in Study 1 and Study 2 and included the factors: study (1/2), crew position (landing/relief), flight direction (outbound/inbound, repeated effect), and the interaction between study and flight direction, and between crew position and flight direction. Similar models were run separately for each crew position and included study (1/2), flight direction (outbound/inbound, repeated effect), and the interaction between study and flight direction.
Post hoc pairwise comparison tests were used to investigate statistically significant main effects and for statistically significant interaction effects simple effect tests were used to investigate comparisons of interests. Holm's sequentially rejective procedure was used to adjust the level of significance for more than two levels of comparisons, with reported significant differences being p < .05 (37).
Data from a total of 147 flight crew members were available for analysis. This includes 72 pilots in Study 1 (53 complete data sets; 40 Captains, mean age 57; 32 First Officers, mean age 47) and 75 in Study 2 (20 Captains, 37 First Officers, 18 Second Officers). Data collection for Study 1 occurred on 40 return trips between December 2018 to June 2019 and in Study 2 data was collected between August-October 2019 (n = 53) and again between February-March 2020 (n = 22). Details of flight, duty and layover duration can be found in Table 1.
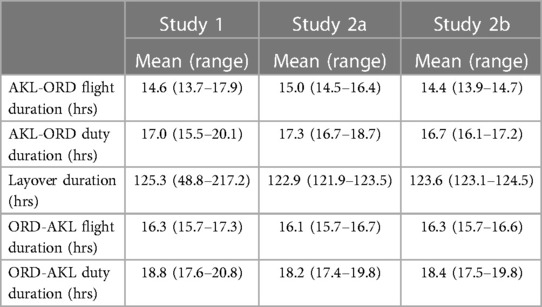
Table 1. Flight, duty and layover duration details.
Flight duration differed significantly by study for both the outbound (Kruskal-Wallis test p < 0.0001) and the inbound flight (Kruskal-Wallis test p = 0.0013). Outbound flights were longer in northern summer (Study 2a) than in Study 1 and northern winter (Study 2b), and shorter in Study 2b than in Study 1. Inbound flights were shorter in Study 2a than Study 1 and Study 2b. Within Study 1, outbound flights were significantly longer during the northern winter (median 14.7 h) compared to the northern summer months (median 14.4 h) (p = 0.0114). Inbound flight durations in Study 1 did not differ significantly between northern summer (median 16.4 h) and northern winter months (median 16.3 h) (p = 0.0736).
Figure 1 is a plot of the timing and duration of sleep and flights for all pilots on each day of Study 1. Across the first 3 days of the study, all pilots slept at night and half (36/72) napped prior to the departure of the outbound flight. Sleep during layover generally spanned part of the local night in Chicago and part of the local night in New Zealand. Approximately one third (21/72) of pilots napped prior to the departure of the inbound flight. On the day they returned to New Zealand, 44/72 pilots napped and most of them quickly adjusted the timing of their sleep to the local night in New Zealand.
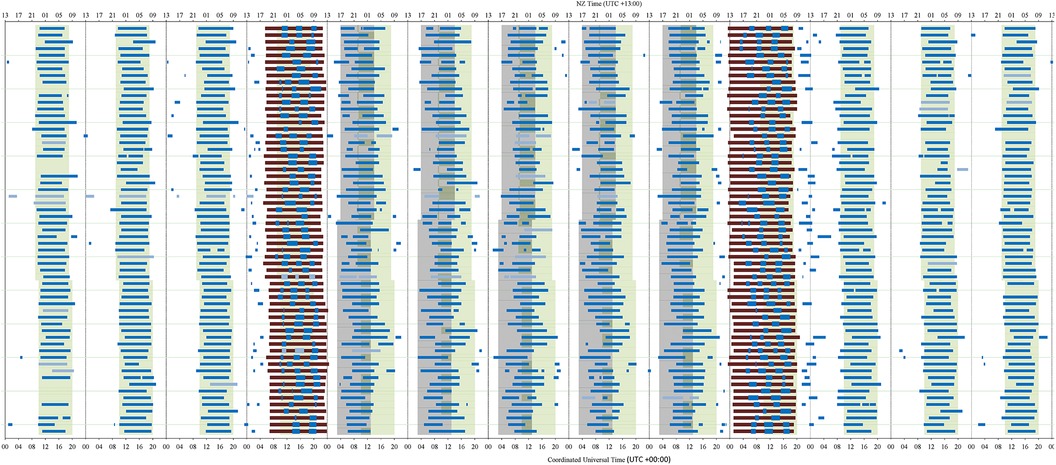
Figure 1. Timing and duration of sleep and flights across study days. A single pilot's data is presented as one row across the page and each day of the study is a column. Sleep periods are presented as blue bars (light blue if only diary data was available) and flights are dark brown bars. Local night in New Zealand is shown as green shading and local night in Chicago as dark grey shading.
On pre-trip days without work (first 2 days of Figure 1), pilots averaged 7.5hrs of sleep in 24 h (range 3.7–10.3). Results of mixed model ANOVAs showed that compared to pre-trip days without work, pilots slept for longer in the 24 h immediately prior to departure (7.8 h, F1,124 = 6.96, p = .009), the first 24 h of the layover (8.1 h, F5,380 = 3.05, p = .010) and the first 24 h back home (8.4 h, F3,252 = 18.12, p < .001). On all other days total sleep in 24 h did not differ compared to pre-trip days without work. There was also no difference in the amount of sleep obtained during the 24-hours prior to the outbound and inbound flight (7.8 and 7.9 h respectively, F1,66.2 = 0.12, p = .733).
On the outbound flight 70% of pilots took 3 rest breaks with the remainder taking 2 breaks, and on the inbound flight 75% took 3 rest breaks, 11% 2 breaks and 14% 4 breaks (see Table 2). When pilots took 2 rest breaks, both were used for sleep but when more breaks were taken the first break was sometimes not used for sleep (e.g., outbound 70% attempted sleep on first break of 3; inbound 55% attempted sleep in the first break of 3 and 40% attempted sleep in the first break of 4). Pilots attempted to sleep in all other breaks and other than on 2 occasions, sleep was obtained. Relief crew almost always had the last break before top of descent (97% outbound, 88% inbound).
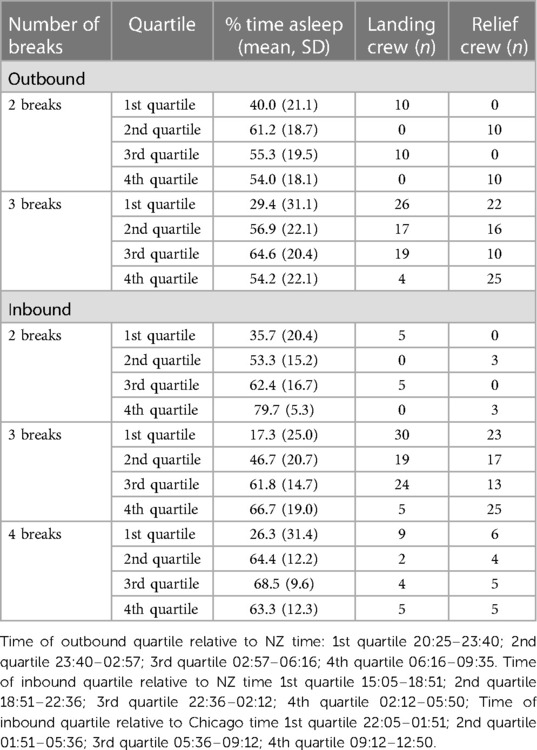
Table 2. Sleep obtained as a proportion of the time available for rest on the outbound and inbound flight.
A mixed model ANOVA investigating factors influencing sleep in flight found that more sleep was obtained on the longer inbound flight (F1,65.1 = 4.88, p = .031) and relief crew obtained more sleep than landing crew (F1,86.5 = 4.79, p = .031). Age was not a significant influence. Mean sleep durations for flights were: outbound landing crew = 3.28 h, range 1.18–4.52; outbound relief crew = 3.44 h, range 1.3–4.83; inbound landing crew = 3.38 h, range = 1.75–5.08; inbound relief crew = 3.85 h, range = 1–5.56.
To better understand when pilots were able to obtain the most sleep during their in-flight rest breaks, the cruise portion of each flight was divided into 4 equal time bins with each rest break allocated to the quartile it predominantly fell within (see Table 2). If a rest break was spread equally across 2 quartiles it was allocated to the quartile it commenced in. Mixed model analyses indicate that on outbound and inbound flights, pilots obtained significantly less sleep as a proportion of the time available for rest in the 1st quartile compared to 2nd, 3rd and 4th quartile (outbound F3,174 = 16.47, p < .001; inbound F3,163 = 64.23, p < .001). On the inbound flight, flight crew also obtained significantly less sleep as a proportion of the available rest time during breaks occurring during 2nd quartile when compared to 3rd (p = .005) and 4th quartile (p < .001).
Ratings of fatigue and sleepiness and mean response speed are shown in Figure 2. Mixed model ANOVAs for repeated measures investigated change in these measures across flights, as well as change in the slowest 10% of responses and fastest 10% of responses. Fatigue and sleepiness changed significantly across each flight (F3,471 = 227.5, p < .001 and F3,472 = 144.43, p < .001 respectively), with pilots feeling least fatigued and sleepy pre-flight compared to top of climb, top of descent and after landing, and less fatigued and sleepy at top of climb compared to top of descent and after landing. Pilots were also less fatigued at top of descent compared to after landing. There were no differences in fatigue or sleepiness ratings between landing and relief crew, but pilots felt more fatigued and sleepier on the inbound flight than on the outbound flight (F1,475 = 23.68, p < .001 and F1,476 = 25.12, p < .001 respectively). For all performance measures, pilots became slower at responding across flights (response speed F2,290 = 47.49, p < .001; slowest 10% of responses F2,289 = 17.59, p < .001; fastest 10% responses F2,292 = 44.20, p < .001). The following in-flight differences were seen: at top of descent, response speed was slower compared to all previous time points; at top of descent, the slowest 10% of responses were slower compared to pre-flight, with relief crew also having slower responses at top of climb compared to pre-flight; and the fastest 10% responses were slower at each time point compared to any previous time point. There were no differences between landing and relief crew and no difference between the outbound and inbound flight, except that the fastest 10% of responses were faster on the outbound flight than on the inbound flight (F1,294 = 11.68, p < .001).
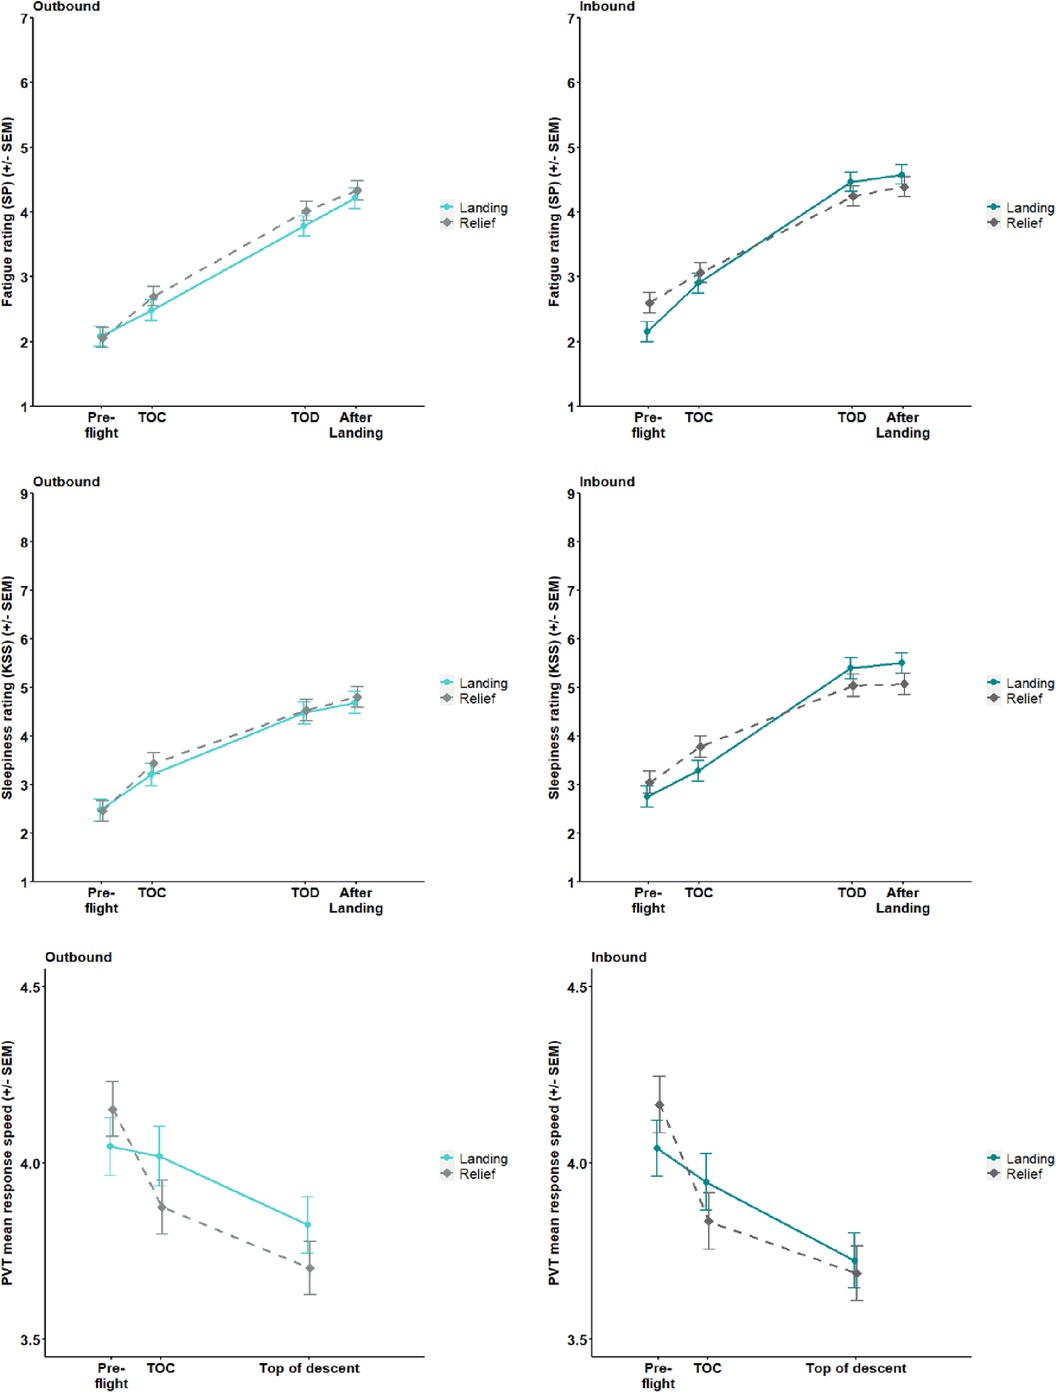
Figure 2. Ratings of fatigue and sleepiness and mean response speed across the outbound and inbound flight for landing and relief crew.
To determine if there were seasonal differences in fatigue metrics data from Study 2a (northern summer) were compared to data from Study 2b (northern winter). Because the Covid-19 pandemic curtailed data collection for Study 2b and due to concerns about the reduced statistical power to detect differences, additional analyses were conducted using data from Study 1, where data collected during December-January (northern winter) were compared to data collected during May-June (northern summer). Mixed model ANOVAs tested whether on inbound flights in Study 1 and 2, ratings of sleepiness, fatigue, performance and workload at top of descent, total in-flight sleep, and jetlag on layover differed between datasets collected in the northern summer and northern winter (performance data was available only for Study 1 and jetlag data was included only for Study 2). None of these seasonal comparisons were statistically significant [Table 3, models also included crew position (landing/relief) and for jetlag, day of layover]. Subsequently data from Study 2a and 2b was combined (other than information on rest break patterns, see below) and compared to data from Study 1.
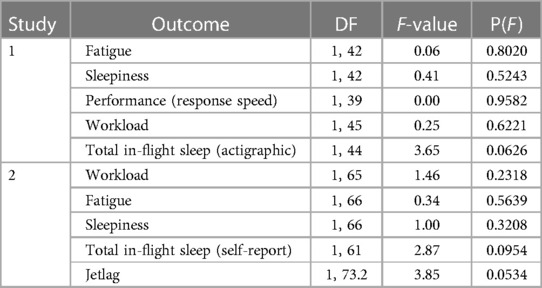
Table 3. Results of mixed model ANOVAs comparing fatigue, sleepiness, workload and performance at top of descent, total in-flight sleep on inbound flights and jetlag ratings on layover in summer and winter months in study 1 and study 2.
Following Study 1, pilots were provided with updated written recommendations on the organisation of in-flight rest breaks that emphasized the importance of scheduling two rest breaks per pilot. The advice was also altered to recommend that the landing crew take the 2nd and 4th rest breaks. These recommendations were further reinforced using a short video between Study 2a and 2b. The organisation and timing of in-flight rest breaks was largely the same in Study 1 and 2a (Table 4) with most pilots taking 3 scheduled breaks and relief crew taking the last break prior top of descent (73%–97% of the time). In Study 2b, a larger proportion of crewmembers adhered to the company's guidance material, by taking 2 scheduled breaks each and the landing crew taking the last break (70%–71% of the time).
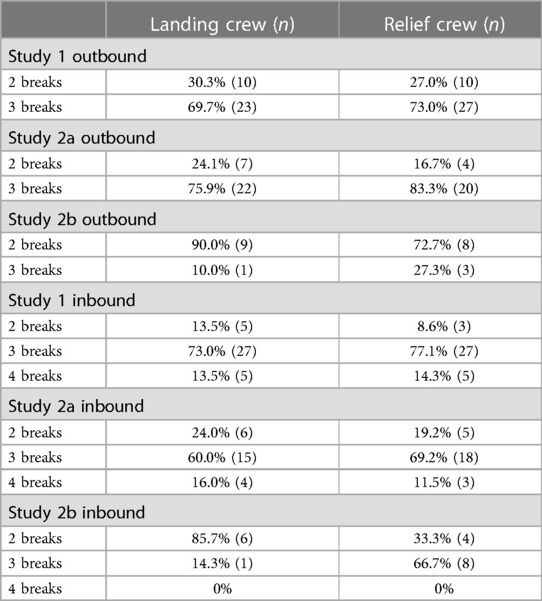
Table 4. Proportion of pilots taking 2, 3 or 4 rest breaks on the outbound and inbound flight in each study.
A mixed model ANOVA investigated whether self-reported total in-flight sleep duration differed between Study 1 and Study 2 and found no differences in the sleep of crew between the two studies. There was a significant interaction between crew position and flight direction (F1,237 = 4.70, p = .031), with relief crew on the inbound flight reporting getting more sleep (estimated mean = 4.3 h) than on the outbound flight (estimated mean = 3.8 h). Additional mixed models evaluated whether total in-flight sleep differed between landing Captains in Study 1 and 2 (F1,47 = 1.17, p = .284). The difference was not statistically significant, but the trend of less sleep on the inbound flight in Study 2 is worthy of noting (Figure 3B) due to the small number of landing Captains (Study 1 n = 17, Study 2 n = 15) and low statistical power for detecting differences. The same analysis was also undertaken for landing First Officers (F1,52 = 5.77, p = .020) and relief First Officers (F1,54.2 = 0.00, p = .974), with landing First Officers obtaining more sleep in Study 2 compared to Study 1.
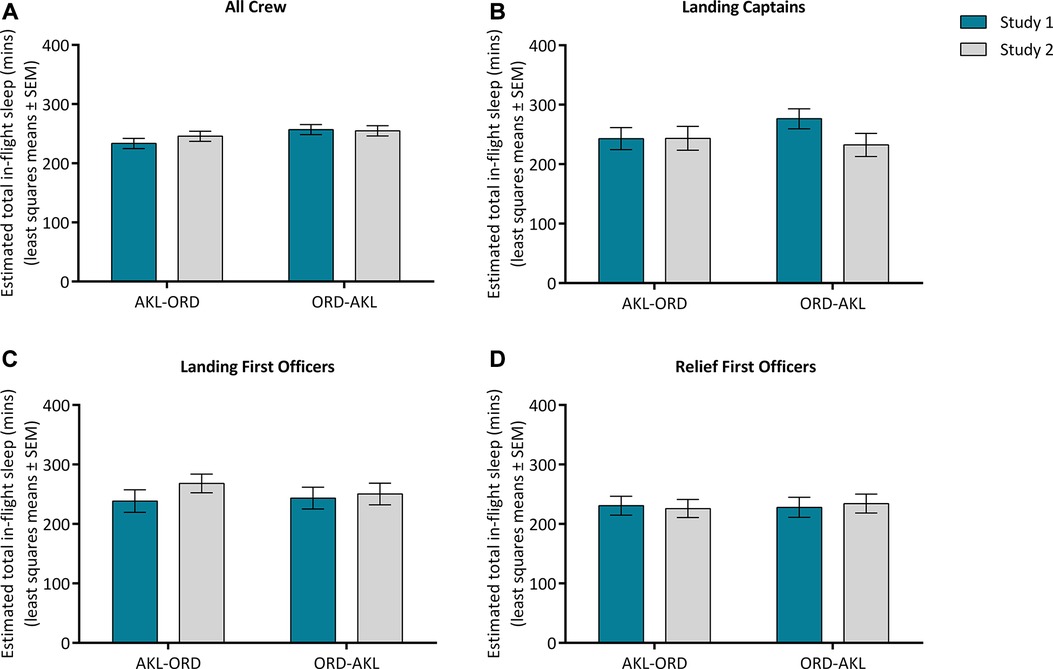
Figure 3. Total in-flight sleep (estimated mean) of all crew (A), landing Captains (B), landing First Officers (C) and relief First Officers (D) on the outbound and inbound flight in Study 1 and 2.
Mixed model ANOVAs also investigated whether ratings of fatigue, sleepiness and workload at top of descent differed between Study 1 and Study 2 for all crew and separately for landing Captains, landing First Officers and relief First Officers. Results are shown in Table 5. There were no notable patterns for ratings of fatigue or sleepiness at top of descent, but there was a statistically non-significant trend for landing Captains to rate their workload as higher at top of descent in Study 2 on both the outbound and inbound flights (Figure 4B).
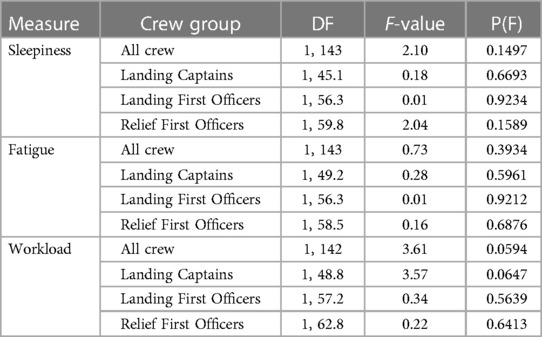
Table 5. Results of mixed model ANOVAs comparing fatigue, sleepiness and workload at top of descent in study 1 and 2.
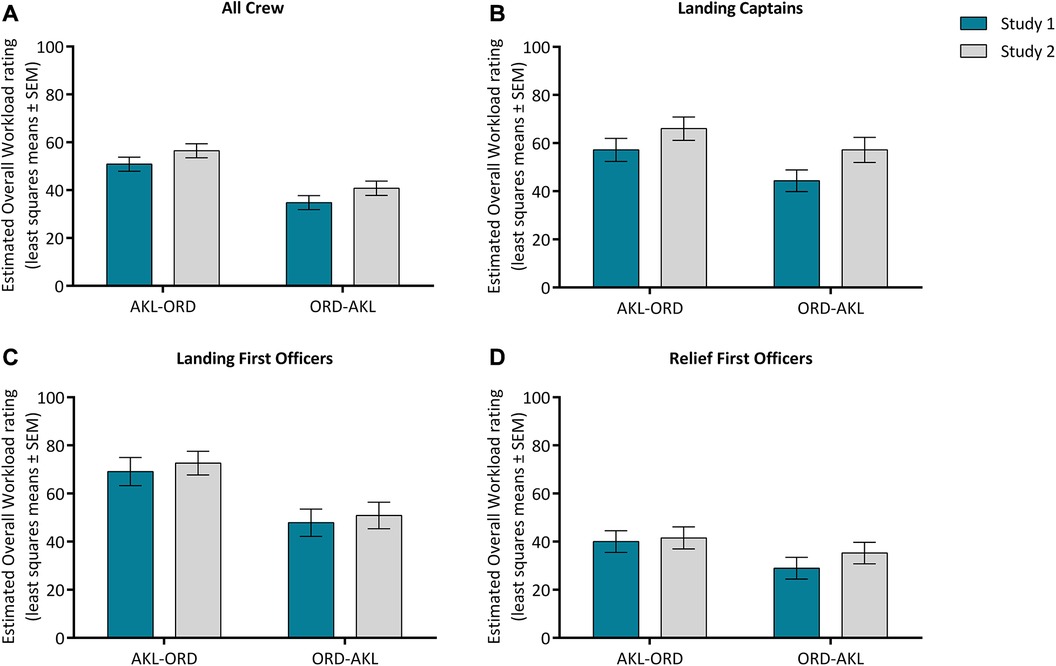
Figure 4. Workload (estimated mean) of all crew (A), landing Captains (B), landing First Officers (C) and relief First Officers (D) on the outbound and inbound flight in Study 1 and 2.
This paper describes the processes and mitigations used to manage fatigue on the Auckland-Chicago-Auckland ULR route. The study was designed and conducted using a tripartite approach, with input from scientists, operational personnel, and pilot union representatives and employed best practice methods and well recognized measures of fatigue, sleepiness, sleep and performance to produce information of scientific and operational value.
As has been noted, to allow for preparation and recovery in association with a ULR trip, pilots are provided with protected time off pre and post trip and during the layover. Actigraphy data (Figure 1) indicate pilots sleep on local night prior to departure and actively prepare for trips by obtaining more sleep in the 24 h immediately pre-trip (7.8 h) compared to pre-trips days without work (7.5 h), likely in part due to pre-trip naps. Sleep in the 24 h prior to the return flight (7.9 h) was similar to that obtained in the 24 h prior to the outbound flight, but not statistically different from pre-trips days without work, likely due to the larger variability. Recovery periods are also utilized by pilots, with sleep extended during the first 24 h of the layover and pilots returning to sleeping on local night immediately post-trip, with only the first night of recovery sleep being extended.
The extension of sleep only in the first 24 h post-flight is seen in other studies of flight crew operating long-range and ULR flights (9, 10). Controlled studies investigating recovery after sleep restriction or sleep loss tend to focus on recovery after multiple days of restricted sleep (38, 39) or a single extended period of no sleep. The latter is somewhat similar to, but more extreme than what pilots on ULR flights experience. Results from these studies of a single period of sleep loss show that people fall asleep more quickly on the first night of recovery sleep, and sleep is deeper, longer, and has fewer awakenings (40, 41). The second night of recovery sleep is still slightly longer than sleep prior to sleep loss but the structure of sleep returns to normal (41). In the present study sleep extension post-flight was only evident on the first night which could be due to the large variability in sleep between individuals, and insufficient statistical power to detect differences on second or subsequent nights. The measures of sleep used in this study don't allow further investigation of how the structure of pilots’ sleep may be altered during recovery opportunities, but do support the need for and protection of, sufficient recovery time between flights within a trip and between trips. Studies in controlled settings suggests that after a long period of wakefulness, a single time-limited sleep opportunity does not allow for complete recovery, whereas an extended sleep opportunity does (41, 42). Pilots should therefore be encouraged to continue with their current post-flight recovery behaviors and be made aware of the importance of not restricting sleep after flights, particularly in the first 24 h.
One of the challenges associated with ULR operations is an increased risk of pilots being awake for an extended period of time, particularly when operating flights that depart in the evening. Pre-flight naps reduce the likelihood of extended wakefulness, increase the total amount of sleep obtained pre-flight and provide some protection in the event a pilot has difficulty sleeping in flight. Actigraphy data from the present study indicated that many pilots utilize this strategy (50% prior to outbound and 30% prior to inbound). Pre-flight napping is likely to be influenced by the time a flight departs, with evening flights more conducive to obtaining an afternoon nap and also by prior knowledge of the expected in-flight rest break patterns (43). Prior research has shown that pilots who are allocated the first in-flight rest opportunity report being less likely to nap prior to a flight. This is despite other evidence demonstrating that a pre-flight nap has no influence on either the amount of sleep obtained in the first rest break or total sleep obtained in-flight (9). Methods to increase the proportion of pilots using pre-flight naps should be considered and could include education on why pre-flight naps are an important fatigue control and the lack of a demonstrated impact on the amount of sleep obtained in flight.
Due to the length of the layover, guidance for this trip encouraged pilots to shift the timing of their sleep to local night at the layover destination. Although data was not analyzed statistically to determine if sleep timing changed across the layover, plotted actigraphy data (Figure 1) indicate that the main sleep period moves slightly earlier to cross both the local night and New Zealand night, but that most pilots do not fully adjust the timing of their sleep to the layover destination. Analyses investigating the proportion of time asleep during rest breaks on the inbound flight also support incomplete adaptation. If full adjustment of the circadian time keeping system occurred while in the destination, a pilot's biological night would occur in the first half of the flight, whereas no or minimal adaptation would result in it being in the second half. Findings show the proportion of sleep obtained during in-flight rest breaks in the third and fourth quartile of the inbound flight was greater compared to breaks occurring in the first and second quartile, suggesting the biological night of participating pilots remained closer to New Zealand time.
The lack of any difference between fatigue metrics on the inbound flight during northern summer and northern winter months also may indicate adaptation during the layover does not occur as expected. As noted previously, adaptation is expected to be easier during the northern summer when there are more daylight hours and pilots are more likely to spend time outdoors at the layover destination. Complete adaption by the end of the layover would result in an individual's circadian biological clock being at an ideal time for mood and functioning (close to midday) at top of descent on the inbound flight. Whereas if pilots do not adjust at all, top of descent would occur at a less ideal biological time (early in the waking day i.e., ∼07:30). The lack of a difference between fatigue metrics in the northern summer and winter at top of descent on the inbound flight suggests that either crew completely adapt at both times of the year, although as discussed above other data suggests this is not the case, or that adaptation is slow or highly variable both in the northern summer and winter. Incomplete adaptation may be due to a combination of behavioral strategies (i.e., crew chose to sleep on or close to New Zealand night time throughout the layover) and/or that adaptation to a large eastward time zone change is slow at all times of the year. Findings from a number of studies investigating circadian adaptation following large eastward time zone changes highlight that there are large individual differences in both the direction and rate of adaptation (44).
The current findings indicating incomplete adaptation are unexpected given the length of the layover (approximately 5 days) and have implications for the guidance provided to pilots on sleep strategies for the inbound flight. They also suggest care needs to be taken with bio-mathematical model estimates, because if a bio-mathematical model predicts full adaptation to local time during a 5-day layover, then the fatigue estimates produced for the inbound sector may be less accurate. The assumptions that underpin acclimatization tables in flight and duty time regulatory schemes also may not reflect pilot behavior in these circumstances. A better understanding of adaptation under these conditions would be valuable, although at present the gold standard methods for measuring circadian phase are not well suited for use in field settings.
One of the primary fatigue controls on ULR flights is the provision of in-flight sleep opportunities, which is facilitated by additional crew and dedicated crew rest facilities. Recommendations were based on international best practice (3) and evidence from previous studies of ULR operations (9), although as has been noted, the order of rest breaks in Study 1 was modified to align with usual practice on other routes operated by the airline. Guidance included each pilot taking two in-flight rest breaks with a longer break planned during the estimated biological night. In Study 1, the advice was similar for both the outbound and inbound flight and was for the two landing pilots to have the first and third break, with the second break the longer of the two. The relief crew were advised to have the second and fourth breaks, with a long first rest break and a shorter second break. Findings from Study 1 showed that pilots had on average more sleep on the longer inbound flight, and relief crew, who adhered to the recommendation to have the second and fourth rest break, had more sleep than landing crew. This is likely due to their rest breaks being at a more ideal biological time, particularly on the inbound flight when adaptation to the layover time zone was not as expected. Between Study 1 and Study 2 the guidance material was revised to recommend that landing pilots use the second and fourth rest breaks on both the outbound and inbound flights and that on the inbound flight all crew have their longer break in the second half of the flight. Due to flight crew appearing not to adapt fully during the layover, rest breaks occurring in the latter part of the inbound flight are expected to be more closely aligned to crews' biological night and result in more and better-quality sleep.
Pilots' adoption of recommended in-flight rest strategies increased across the studies. This correlated with the enhanced guidance material provided and was also likely the result of pilots personally experiencing the benefits of the longer breaks. The updated guidance material provided between the Study 1 and Study 2 encouraged pilots to utilize the recommended rest break pattern and have a maximum of two in-flight rest breaks. Longer and fewer breaks are expected to result in more sleep relative to the length of time available for sleep, as less time is spent preparing for sleep and preparing for returning to the flight deck. Between Study 2a and Study 2b, a short video was provided to crew reiterating this guidance information. Findings highlight the benefits of communicating fatigue mitigation strategies to crew in advance of the changes and reinforcing this through continued education, messaging, and information sharing using different mediums.
Likely due to the relatively limited amount of in-flight sleep obtained (on average 3.3–3.9 h) and the flight spanning the biological night, ratings of sleepiness and fatigue increased, and reaction time performance declined across both the outbound and inbound flights. Higher levels of sleepiness and fatigue were also found on the longer inbound flight compared to the outbound flight, although reaction time performance did not differ between flight sectors, except for the fastest 10% of responses. Greater sleepiness and fatigue on the inbound flight could be due to the timing of the flight relative to pilots' circadian biological clock and/or be reflective of the fact that the sleep obtained on the longer inbound flight does not completely counteract the longer duration of this flight. If longer ULR sectors are operated in the future, monitoring of fatigue metrics across flights will be important to determine the extent of change in fatigue and sleepiness. The increased fatigue and sleepiness across flights also adds weight to the importance of protected time for recovery between flights and after the trip.
Comparisons between Study 1 (flights operated with 2 Captains and 2 First Officers) and Study 2 (flights operated with 1 Captain, 2 First Officers and 1 Second Officer) found that across all crew there was no difference in the amount of in-flight sleep obtained and ratings of fatigue, sleepiness and workload at top of descent. In separate comparisons conducted with either Captains or First Officers, there was a pattern of Captains in Study 2 reporting higher workload on both the outbound and inbound flight and obtaining less sleep on the inbound flight compared to Captains in Study 1. The differences were not statistically significant but due to the limited number of Captains providing data it is likely that the analyses had insufficient statistical power. In contrast, landing First Officers, who had the same rest break pattern as landing Captains, obtained more in-flight sleep in Study 2 compared to Study 1. The change in the guidance material between Study 1 and Study 2 and the greater uptake of the in-flight strategies in Study 2b were expected to favor the sleep of both landing Captains and First Officers. As a result of Study 2b being curtailed by the Covid-19 pandemic and the reduced data available, the findings on the impact of altering the crew complement for Captains requires further investigation.
As noted above there are several limitations associated with this research, particularly the reduced statistical power for some comparisons. All measures of sleep, fatigue and sleepiness have strengths and weaknesses that need to be considered. For example, actigraphy is an excellent tool for collecting information on the timing and duration of sleep in an operational setting but does not allow detailed investigation of changes to sleep structure and quality. This limits our ability to understand how other features of sleep may contribute to fatigue and sleepiness in this context. We were also not able to further investigate circadian adaptation during the layover due to the practical difficulties of current measures in field settings. Care should also be taken with the application of findings from this study to other ULR flights with different operational features.
To conclude, this study adds to the small but growing body of information on fatigue management in ULR operations and demonstrates how fatigue mitigations are being used by crew. Pilots take advantage of opportunities to prepare for and recover from flights, but recommendations provided on in-flight rest were initially not closely followed. This demonstrates the importance of ensuring ULR guidance is communicated effectively to pilots, particularly when strategies may differ from those employed in existing operations. Information from this study was also used to amend guidance to better support the sleep of landing crew, which supports the value of such studies in refining fatigue mitigations. This study also raises questions about adaptation after large eastward time zone changes and the impact of altering the crew complement on fatigue metrics, both of which warrant further study.
The datasets presented in this article are not readily available because they contain commercially sensitive data. They are held at the Sleep/Wake Research Centre and under certain conditions information from these datasets may be available on request. Requests to access the datasets should be directed to Leigh Signal,dC5sLnNpZ25hbEBtYXNzZXkuYWMubno=.
Study 1 was approved by Massey University Human Ethics Committee, Northern. Study 2 was registered with Massey University Human Ethics Committee, Southern A. The studies were conducted in accordance with the local legislation and institutional requirements. The participants provided their written informed consent to participate in Study 1, and participation in Study 2 was considered consent.
TLS: Conceptualization, Funding acquisition, Methodology, Project administration, Resources, Supervision, Writing – original draft, Investigation. MV: Conceptualization, Data curation, Formal analysis, Funding acquisition, Investigation, Methodology, Project administration, Visualization, Writing – review & editing, Resources. JZ: Conceptualization, Data curation, Formal analysis, Investigation, Methodology, Project administration, Visualization, Writing – review & editing, Resources. LW: Conceptualization, Data curation, Formal analysis, Investigation, Methodology, Visualization, Writing – review & editing. MH: Writing – review & editing. BJ: Conceptualization, Writing – review & editing, Investigation. CD: Conceptualization, Investigation, Writing – review & editing. MD: Conceptualization, Investigation, Writing – review & editing. MG: Investigation, Writing – review & editing.
We would like to acknowledge the significant contribution of the participating pilots. We are grateful to Hardeep Hundal at Air New Zealand for his involvement in participant recruitment and data collection. At the Sleep/Wake Research Centre, we would like to acknowledge Kathryn Teal and Dee Muller for their assistance with data processing.
The authors declare that this study received funding from Air New Zealand and the research team included employees from Air New Zealand. Data were analysed and interpreted independently by authors from the Sleep/Wake Research Centre. The operational implications of the findings are informed by authors from Air New Zealand.
All claims expressed in this article are solely those of the authors and do not necessarily represent those of their affiliated organizations, or those of the publisher, the editors and the reviewers. Any product that may be evaluated in this article, or claim that may be made by its manufacturer, is not guaranteed or endorsed by the publisher.
1Actisoft R was developed by Edgar Santos-Fernandez, Lora Wu, and Margo van den Berg, Sleep/Wake Research Centre, Massey University, Wellington, New Zealand.
1. International Civil Aviation Organisation. ICAO Safety Report. Montreal, QC, Canada: International Civil Aviation Organisation (2023).
2. International Civil Aviation Organisation. Doc 9859, Safety Management Manual (SMM). Montreal, QC, Canada: International Civil Aviation Organisation (2018).
3. Flight Safety Foundation Editorial Staff. Consensus emerges from international focus on crew alertness in ultra-long-range operations. Flight Safety Dig. (2003) 22(5-6):1–21. https://flightsafety.org/wp-content/uploads/2017/06/fsd_mayjune03-1.pdf
4. International Civil Aviation Organisation. Fatigue management guide for airline operators. Montreal, QC, Canada: International Civil Aviation Organisation (2015).
5. International Civil Aviation Organisation. Manual for the oversight of fatigue management approaches (doc 9966). Montreal, QC, Canada: International Civil Aviation Organisation (2016).
6. Part 117—Flight and duty limits and rest requriements: flightcrew members, 14 CFR FAR Part 117 (2012).
8. Civil Aviation Authority of New Zealand. Assessment of Flight and Duty Times (FDT) Schemes Procedure. (2020).
9. Signal TL, Mulrine HM, van den Berg MJ, Smith AAT, Gander PH, Serfontein W. Mitigating and monitoring flight crew fatigue on a westward ultra-long-range flight. Aviat Space Environ Med. (2014) 85(12):1199–208. doi: 10.3357/ASEM.4034.2014
10. Lamp A, McCullough D, Chen JMC, Brown RE, Belenky G. Pilot sleep in long-range and ultra-long-range commercial flights. Aerosp Med Hum Perform. (2019) 90(2):109–15. doi: 10.3357/AMHP.5117.2019
11. Holmes A, Al-Bayat S, Hilditch C, Bourgeois-Bougrine S. Sleep and sleepiness during an ultra long-range flight operation between the Middle East and United States. Accid Anal Prev. (2012) 45(Suppl):27–31. doi: 10.1016/j.aap.2011.09.021
12. Signal TL, Gander PH, van den Berg MJ, Graeber RC. In-flight sleep of flight crew during a 7-hour rest break: implications for research and flight safety. Sleep. (2013) 36(1):109–15. doi: 10.5665/sleep.2312
13. Gander PH, Signal TL, van den Berg MJ, Mulrine HM, Jay SM, Jim Mangie C. In-flight sleep, pilot fatigue and psychomotor vigilance task performance on ultra-long range versus long range flights. J Sleep Res. (2013) 22(6):697–706. doi: 10.1111/jsr.12071
14. Lamp A, Chen JMC, McCullough D, Belenky G. Equal to or better than: the application of statistical non-inferiority to fatigue risk management. Accid Anal Prev. (2019) 126:184–90. doi: 10.1016/j.aap.2018.01.020
15. Jean-Louis G, Kripke DF, Mason WJ, Elliott JA, Youngstedt SD. Sleep estimation from wrist movement quantified by different actigraphic modalities. J Neurosci Methods. (2001) 105(2):185–91. doi: 10.1016/S0165-0270(00)00364-2
16. Signal TL, Gale J, Gander PH. Sleep measurement in flight crew: comparing actigraphic and subjective estimates to polysomnography. Aviat Space Environ Med. (2005) 76(11):1058–63. PMID: 16313142.16313142
17. R Core Team. R: A language and environment for statistical computing. Vienna: R Foundation for Statistical Computing (2013). http://www.R-project.org/
18. Robertson K, Spencer M, Stone BM, Akerstedt T, Gillberg M, Simons RM, et al. Predicting alertness in future ultra long-range operations: a validation study by ECASS. Farnborough: QinetiQ 2002. Report No.: QINETIQ/KI/CHS/CR021119/2.0.
19. Samel A, Wegmann HM, Vejvoda M, Drescher J, Gundel A, Manzey D, et al. Two-crew operations: stress and fatigue during long-haul night flights. Aviat Space Environ Med. (1997) 68(8):679–87. PMID: 9262808.9262808
20. Samel A, Wegmann H-M, Vejvoda M. Aircrew fatigue in long-haul operations. Accid Anal Prev. (1997) 29(4):439–52. doi: 10.1016/S0001-4575(97)00023-7
21. Samn SW, Perelli LP. Estimating Aircrew Fatigue: A Technique With Implications to Aircraft Operations. Brooks AFB, Texas: USAF School of Aerospace Medicine; 1982. Report No.: Technical Report No. SAM-TR-82-21.
22. Åkerstedt T, Gillberg M. Subjective and objective sleepiness in the active individual. Int J Neurosci. (1990) 52(1-2):29–37. doi: 10.3109/00207459008994241
23. Gillberg M, Kecklund G, Akerstedt T. Relations between performance and subjective ratings of sleepiness during a night awake. Sleep. (1994) 17(3):236–41. doi: 10.1093/sleep/17.3.236
24. Harma M, Sallinen M, Ranta R, Mutanen P, Muller K. The effect of an irregular shift system on sleepiness at work in train drivers and railway traffic controllers. J Sleep Res. (2002) 11(2):141–51. doi: 10.1046/j.1365-2869.2002.00294.x
25. Gander P, van den Berg M, Jay S, Signal T. Comparison of flight crew sleep and fatigue during Delta air lines long range and ultra-long range operations. Wellington: Sleep/Wake Research Centre, Massey University (2012).
26. Pascoe PA, Johnson MK, Montgomery JM, Robertson KA, Spencer MB. Sleep in rest facilities onboard aircraft: questionnaire studies. Farnborough, UK: RAF Institute of Aviation Medicine (1994). Report No.: IAM Report No. 778.
27. Pascoe PA, Johnson MK, Robertson KA, Spencer MB. Sleep in rest facilities on board aircraft: field studies. Farnborough, UK: DERA (1995). Report No.: DERA/CHS/A&N/CR/95/002.
28. Robertson KA, Spencer MB, Stone BM, Johnson MK. Scheduling the on-board rest of aircrew. Farnborough, UK: DERA (1997). Report No.: DERA/CHS/PP5/CR97095/1.0.
29. Signal TL, van den Berg MV, Gander PH. Phase 3 ultra-long-range validation: polysomnographic sleep and psychomotor performance (final report). Wellington: Massey University (2004).
30. Spencer MB, Robertson KA. The Haj operation: comparison of the benefits of in-flight rest in a crew seat and a bunk. Farnborough, UK: DERA (2000). Report No.: DERA/CHS/PPD/CR00008.
31. Gander PH, Mangie J, van den Berg MJ, Smith AAT, Mulrine HM, Signal TL. Crew fatigue safety performance indicators for fatigue risk management systems. Aviat Space Environ Med. (2014) 85(2):139–47. doi: 10.3357/ASEM.3748.2014
32. Roach G, Dawson D, Lamond L. Can a shorter psychomotor vigilance task be used as a reasonable substitute for the ten-minute psychomotor vigilance task? Chronobiol Int. (2006) 23(6):1379–87. doi: 10.1080/07420520601067931
33. Vidulich MA, Tsang PS. Absolute magnitude estimation and relative judgement approaches to subjective workload assessment. Proceedings of the Human Factors and Ergonomics Society Annual Meeting. (1987).
34. Petrie K, Dawson AG, Thompson L, Brook R. A double-blind trial of melatonin as a treatment for jet lag in international cabin crew. Biol Psychiatry. (1993) 33(7):526–30. doi: 10.1016/0006-3223(93)90007-Z
35. Herxheimer A, Waterhouse J. The prevention and treatment of jet lag. Br Med J. (2003) 326:296–97. doi: 10.1136/bmj.326.7384.296
36. Lockley SW, Skene DJ, Tabandeh H, Bird AC, Defrance R, Arendt J. Relationship between napping and melatonin in the blind. J Biol Rhythms. (1997) 12(1):16–25. doi: 10.1177/074873049701200104
37. Aickin M, Gensler H. Adjusting for multiple testing when reporting research results: the Bonferroni vs Holm methods. Am J Public Health. (1996) 86(5):726–8. doi: 10.2105/AJPH.86.5.726
38. Belenkey G, Wesenten NJ, Thorne D, Thomas ML, Sing HC, Redmond DP, et al. Patterns of performance degradation and restoration during sleep restriction and subsequent recovery: a sleep dose-response study. J Sleep Res. (2003) 12:1–12. doi: 10.1046/j.1365-2869.2003.00337.x
39. Van Dongen H, Maislin G, Mullington J, Dinges DF. The cumulative cost of additional wakefulness: dose-response effects on neurobehavioral functions and sleep physiology from chronic sleep restriction and total sleep deprivation. Sleep. (2003) 26(2):117–26. doi: 10.1093/sleep/26.2.117
40. Mander BA, Reid KJ, Baron KG, Tjoa T, Parrish TB, Paller KA, et al. EEG measures index neural and cognitive recovery from sleep deprivation. J Neurosci. (2010) 30(7):2686–93. doi: 10.1523/JNEUROSCI.4010-09.2010
41. Jay SM, Lamond N, Ferguson SA, Dorrian J, Jones CB, Dawson D. The characteristics of recovery sleep when recovery opportunity is restricted. Sleep. (2007) 30(3):353–60. doi: 10.1093/sleep/30.3.353
42. Ikegami K, Ogyu S, Arakomo Y, Suzuki K, Mafune K, Hiro H, et al. Recovery of cognitive performance and fatigue after one night of sleep deprivation. J Occup Health. (2009) 51(5):412–22. doi: 10.1539/joh.L8127
43. Zaslona JL, O’Keeffe KM, Signal TL, Gander PH. Shared responsibility for managing fatigue: hearing the pilots. PLoS One. (2018) 13(5):e0195530. doi: 10.1371/journal.pone.0195530
Keywords: Fatigue Risk Management System, fatigue mitigations, in-flight sleep, Karolinska Sleepiness Scale, Samn-Perelli Crew Status Check, Psychomotor Vigilance Task, actigraphic sleep, workload
Citation: Signal TL, van den Berg MJ, Zaslona JL, Wu L, Hughes M, Johnston B, Dyer C, Drane M and Glover M (2024) Managing the challenge of fatigue for pilots operating ultra-long range flights. Front. Environ. Health 2:1329203. doi: 10.3389/fenvh.2023.1329203
Received: 28 October 2023; Accepted: 7 December 2023;
Published: 11 January 2024.
Edited by:
Dorothee Fischer, German Aerospace Center (DLR), GermanyReviewed by:
Brianna Eiter, Centers for Disease Control and Prevention (CDC), United States© 2024 Signal, van den Berg, Zaslona, Wu, Hughes, Johnston, Dyer, Drane and Glover. This is an open-access article distributed under the terms of the Creative Commons Attribution License (CC BY). The use, distribution or reproduction in other forums is permitted, provided the original author(s) and the copyright owner(s) are credited and that the original publication in this journal is cited, in accordance with accepted academic practice. No use, distribution or reproduction is permitted which does not comply with these terms.
*Correspondence: T. L. Signal dC5sLnNpZ25hbEBtYXNzZXkuYWMubno=
Disclaimer: All claims expressed in this article are solely those of the authors and do not necessarily represent those of their affiliated organizations, or those of the publisher, the editors and the reviewers. Any product that may be evaluated in this article or claim that may be made by its manufacturer is not guaranteed or endorsed by the publisher.
Research integrity at Frontiers
Learn more about the work of our research integrity team to safeguard the quality of each article we publish.