 Bikas Chandra Bhattarai
 Achut Parajuli2
95% of researchers rate our articles as excellent or good
Learn more about the work of our research integrity team to safeguard the quality of each article we publish.
Find out more
ORIGINAL RESEARCH article
Front. Environ. Eng. , 03 January 2025
Sec. Water, Waste and Wastewater Engineering
Volume 3 - 2024 | https://doi.org/10.3389/fenve.2024.1519115
Accurate measurement of solid precipitation still remains a significant challenge especially in snow dominated regions. Although it seems straightforward to measure solid precipitation by installing a simple gauge, measurement uncertainty remains the limiting factor even for the sophisticated precipitation collector. Precipitation gauges often rely on an antifreeze solutions, mostly ethylene glycol and methanol (glycometh), to melt snow stored in the collector and provide solid precipitation measurements. However, using antifreeze solution like glycometh often leads to various health and environmental issues. This study evaluates the effectiveness of propylene glycol and ethanol as an environmentally friendly alternatives of glycometh. Furthermore, our study examines the effectiveness of antifreeze mixtures and oil types suitable for the frigid cold temperatures. Based on our analysis, a mixture of 50% propylene glycol (PG) and 50% ethanol (E) solution demonstrated promising efficacy and remained in liquid state even at colder temperature of −40°C, thereby allowing significant dilution. Hydraulic oil is often used atop the antifreeze mixture to prevent evaporation loss from the precipitation. Moreover, some environmental concerns and toxicity risks are associated with the use of such oil. Therefore, we performed further test using Anderol’s food-grade synthetic oil as a safer alternative. The outcome of this test was promising and use of synthetic oil proved to be a viable, environmentally safe alternative for reliable precipitation measurements in cold climates.
In winter, snow in northern hemisphere can cover up to 40% of the land area (Langlois et al., 2009; Parajuli et al., 2020). During this period, most of the precipitation occurs in solid form. As it seems, solid precipitation measurement is pretty straightforward with installation of collector and the observer to record (Rasmussen et al., 2012). However, accurate solid precipitation measurement remains a significant challenge and is still difficult to achieve (Rasmussen et al., 2012; Thériault et al., 2021). This is because the speed and direction of wind flow, shape of the gauge, surface material of the apparatus, and selection of wind shield affects the accuracy of solid precipitation measurement (Kochendorfer et al., 2017; Pierre et al., 2019).
Typically, the solid precipitation is measured by precipitation gauge installation above the surface. Such measurement are done either by volumetric (non-weighing type) or weighing type gauges (Rasmussen et al., 2012). The volumetric gauge is a traditional precipitation gauge where snow is stored in the collector and then melted and poured into a graduated cylinder by the observer. In weighing type of sensors, a chemical antifreeze solution is added so as to melt the snow of which weight difference is measured (Rasmussen et al., 2012) thereby providing solid precipitation samples. There are two types of weighing type gauges i.e., manual and automated weighing gauge. In manual precipitation gauge, observer manually measure the weight of the precipitation. While operating manual precipitation gauge, one has to consider the precipitation undercatch. This is because the use of such gauge has loss probability of up to 50% or more during the windy condition (Kochendorfer et al., 2017; Smith, 2009). Although simple to operate, it is often unsuitable for a remote and unattended site (Wiesinger et al., 1993). Due to such problems, research institutions and climate monitoring organization have transitioned from manual to automated weighing type devices (Pierre et al., 2019).
For accurate solid precipitation measurement, there are different types of antifreeze solution that converts the snow into liquid form. In past, salt solution i.e.,
POWERCOOL DC 924-PXL is also an antifreeze solution made from propylene glycol (PG). This antifreeze solution is commonly used in the OTT Pluvio2 precipitation gauge (OTT Hydromet GmbH, 2014). The PG is regarded as an environmentally friendly antifreeze solution (Saxena et al., 2010). PG is considered a safe chemical and mostly used as solvent for pharmaceutical agent. However, its exposure to high dose for extended period may cause hyperosmolarity (high concentration ofsalt or glucose in the blood) and metabolic acidosis (Lim et al., 2014). In a recent study by Sasanami et al. (2020), the authors pointed that ethynele glycol intoxication can be treated using ethanol. It is believed that the ethanol minimizes the formation of toxic metabolites due to its alcohol dehydrogenase properties often effective for acidosis caused by ethylene glycol. Similar to ethylene glycol, the PG also induces metabolic acidosis (Lim et al., 2014). Hence, combination of ethanol, which also has low freezing point, with PG as an antifreeze solution might be effective and environmentally friendly approach. In Canada, Pierre et al. (2019) reported using the equal parts of ethanol and 1,2-propanediol (PG) solution as an antifreeze. One point to be noted is that the authors used 5%–7% kerosene to prevent evaporation loss in the OTT Pluvio2 precipitation gauge. The use of kerosene however is matter of concern as it is regarded as the pollutant to air, water and land. Hence, additional care is required when disposing them. Nonetheless, engine oil, which is also a environment pollutant like kerosene, is generally used atop the antifreeze solution to prevent evaporative loss (Wiesinger et al., 1993).
It is therefore important to find a feasible solution to completely replace these chemicals with the alternative substance that mixes well, prevent precipitation evaporation and create less havoc to environment. Thus, this study aims to test the effectiveness of PG and ethanol mixture as an antifreeze and make use of Johnson’s baby oil (Johnson and Johnson, 2009) or anderol’s food-grade synthetic oil (Anderol, 2024) as a protective film and prevent evaporative loss. Here, we have experimented the various mixture of propylene glycol and ethanol solutions in the laboratory environment with temperature ranging from −40 to 0°C and test its antifreeze property. Furthermore, we have analysed the air temperature data and GEONOR recorded precipitation across 199 measurement sites in Norway. These tests are conducted to replace the usage of existing antifreeze and identify cost we have to bear to protect the environment.
Norway (Figure 1) is known for its temperate maritime climate which features both mild winters and cool summers, with warmer temperatures than its latitude due to the influence of the North Atlantic Ocean. The country’s location in the far north of Europe and proximity to the Gulfstream help to keep moderate temperatures. The warmest temperatures (up to 7.7°C) are found along the south-western coast, while the coldest temperatures (down to −3.1°C) are found on the Finnmark Plateau (Tveito, 2021; Ketzler et al., 2021). The highest and lowest temperatures recorded on the mainland are +35.6°C and −51.4°C respectively (World Bank, 2024). Rainfall is prevalent throughout the year, with the west coast receiving the most (Johnsson, 1937; Whan et al., 2020). The prevailing westerly winds bring moist air masses from the ocean, resulting in abundant precipitation throughout Norway Sodemann (2006), with the highest levels of precipitation occurring in the coastal regions of western Norway (Johnsson, 1937). This area is one of the wettest in Europe, with some locations receiving over 3,500 mm of precipitation annually (Zhou et al., 2022). The gulf stream and North Atlantic currents have a significant impact on Norway’s climate, bringing warm ocean water to the coast and creating a mild and wet environment.
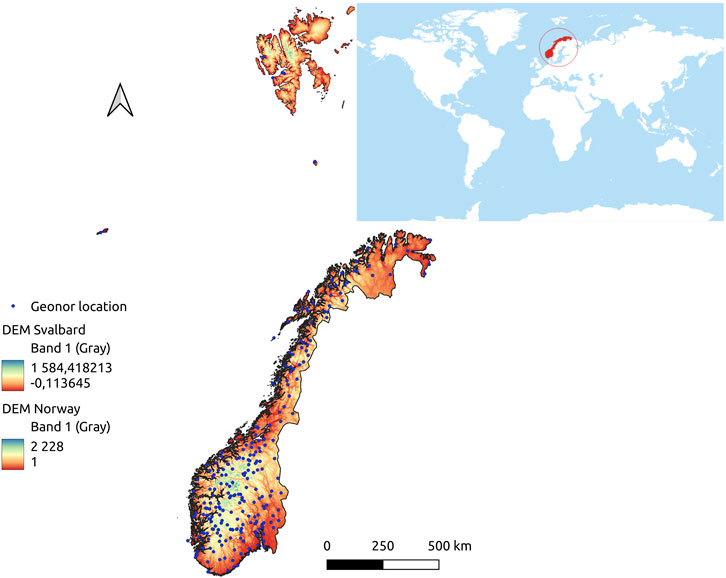
Figure 1. Elevation map of Norway with Geonor location.
For our tests, we have used absolute ethanol (99.5%), mono propylene glycol (100%), and different oil options were examined (Table 1). Here we first mixed the PG and ethanol in different mixing ratio. We conducted 729 tests with different solution mixtures, temperatures, and water dilutions. We have evaluated 9 different ratios of PG and ethanol mixture ranging form 10:90 to 90:10 (See Figure 2). Here, the mixing solution temperature was maintained between −40°C and 0°C with an interval of 5°C inside a freezer (Tefcold, gastrotech. no). To ensure consistent temperature regulation inside the freezer, the built-in temperature regulator was adjusted to the desired setting. To verify the accuracy of the temperature adjustment, a thermometer and an iButton temperature logger (Maxim Integrated, ibuttonlink.com) were placed inside the freezer for continuous monitoring. This dual monitoring approach ensured that the freezer maintained a stable and precise temperature throughout the experiment.
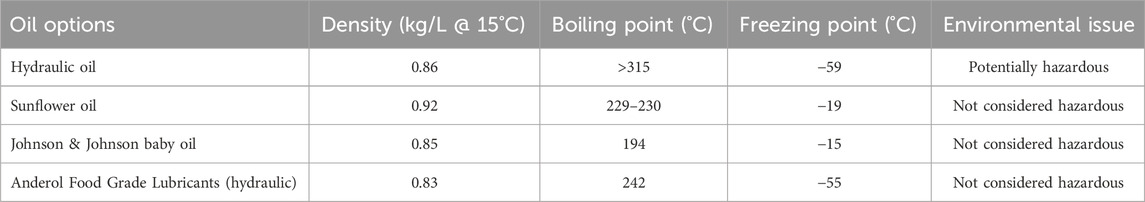
Table 1. Properties of various oil options and their environmental considerations.
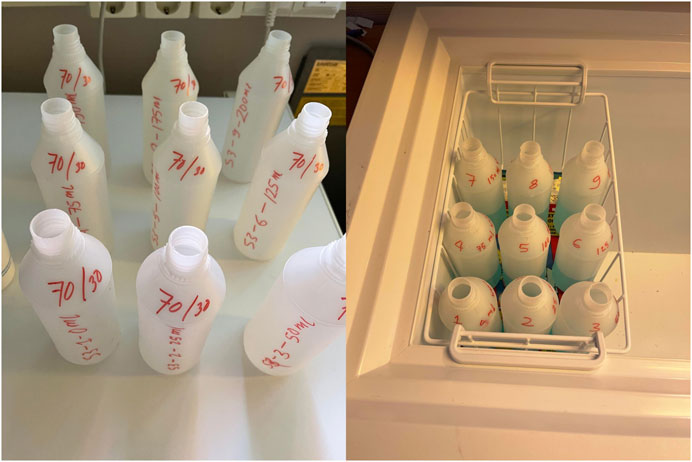
Figure 2. Sample preparation for an experiment and samples are in freezer.
As a first step, we conducted our experiment without adding any water as a diluting agent, and we proceed with the addition of 25 mL of water each time until it reaches a 200 mL threshold thereby forming 9 intervals again. Our experiment was performed in a 300 mL sampling bottle and the mixture solution of PG and ethanol with 729 different samples were kept inside the freezer. For the identification of ice crystals, slush and liquid, we adopted the visual inspection method. Moreover, to validate the visual observation, we inserted an object and noted its speed to reach the bottom as it easily notified the presence of ice, slush or liquid. The object will sink immediately if it is in the liquid state while there will be some delays with the presence of slush, but the presence of ice completely obstructs the object to get inside the mixture of PG and ethanol.
We analyzed data from 199 Geonor precipitation gauges in Norway and air temperature records from nearby locations. At these sites, both precipitation and temperature data were recorded at 10-min intervals. Nevertheless, for our analysis we have aggregated our dataset into the daily total precipitation and the daily average air temperature. Precipitation (2017–2022) and temperature (2017–2022) data from those 199 stations were downloaded from Norwegian Meteorological Institute (MET-Norway) data distribution portal (seklima.met.no). The temperature data from these locations was leveraged to derive the minimum temperature of a particular site from the available historical record. As noted in the McGurk, (1992), the precipitation rarely occurs below −35°C. To validate this claim we analysed the precipitation and temperature record from 2017 to 2022 from the available sites.
In Norway, engine oil (hydraulic oil) is typically employed to mitigate evaporative loss in GEONOR precipitation gauges. In a distinct experiment, we assessed the variance in total precipitation with and without the protective cover of oil. A potential alternative antifreeze solution, determined through laboratory experimentation, was utilized as a mixture. For result comparison from two sets, where the sensor with the measurement using conventional antifreeze with hydraulic engine oil is referred to as Reference Geonor (Ref-Geonor), and the sensor with the new alternative antifreeze with new oil is placed in a nearby Geonor station called Test-Geonor (Figure 3).
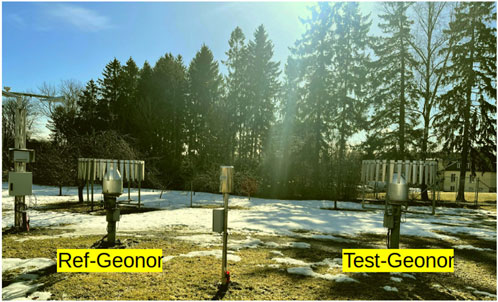
Figure 3. Test and reference Geonor at Norwegian Meteorological Institute, Blindern testfelt site.
To assess the extent of evaporation loss from the solution, antifreeze solution without oil was tested in August 2022. Additionally, the performance of various oils during winter was evaluated from December 2023 to March 2024.
A confusion matrix (Heydarian et al., 2022) was employed to evaluate the performance of the Test-Geonor in comparison to the Reference Geonor. This matrix provides a systematic way to compare predicted and actual observations, offering a detailed breakdown of classification outcomes. In this study, the predicted values were obtained from the Test-Geonor, while the actual values were based on observations from the Reference Geonor.
The confusion matrix comprises four key components as described by Fahmy Amin (2023): true positives (TP), which represent correctly identified precipitation events; true negatives (TN), which denote correctly identified non-precipitation events; false positives (FP), which indicate non-precipitation events misclassified as precipitation; and false negatives (FN), which represent precipitation events that were not identified. These components form the foundation for calculating various performance metrics, including accuracy, precision, specificity, and the F1-Score. These metrics provide a comprehensive assessment of the classification system’s ability to correctly identify and differentiate between rain and no-rain conditions.
The laboratory experiment, depicted in Figure 4, provided insightful results on various antifreeze mixtures. Notably, a blend consisting of 50% propylene glycol (PG) and 50% ethanol demonstrated superior performance. This mixture exhibited remarkable stability, remaining in a liquid state even at an extreme temperature of −40°C, accommodating dilution up to 100%. In practical terms, a solution comprising 1 L of PG and 1 L of ethanol could effectively retain an additional 2 L of snow or rain down to −40°C.
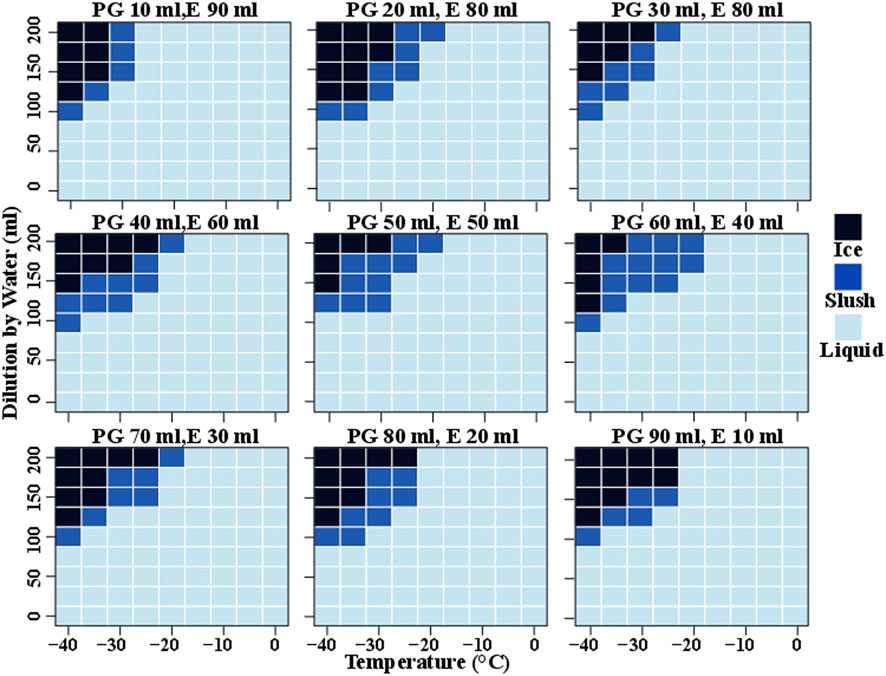
Figure 4. Antifreeze solution with different dilution in different temperature.
Current practices involve the use of a 40% Glycometh and 60% methanol mixture, bearing similarities to our recent findings. However, for optimal effectiveness, a slightly higher proportion of propylene glycol relative to ethylene glycol is recommended. A parallel study conducted by McGurk (1992) explored similar experiment, although with a focus on only five sampling ratios.
Beyond identifying the most suitable antifreeze mixing ratio, our research underscores the necessity of an oil layer to prevent evaporation, particularly of ethanol. Figure 5 illustrates a decrease in accumulated precipitation (blue line) within the bucket, with a higher rate of decrease (black line) during daylight hours when temperatures (red line) are at their maximum. This emphasizes the need for an oil layer atop the antifreeze solution. The oil layer not only mitigates evaporation but also mechanically minimizes the hygroscopic effect of the propylene glycol/water mixture. It has the added benefit of reducing initial water content, enhancing bucket capacity, and preventing hygroscopic accumulation.
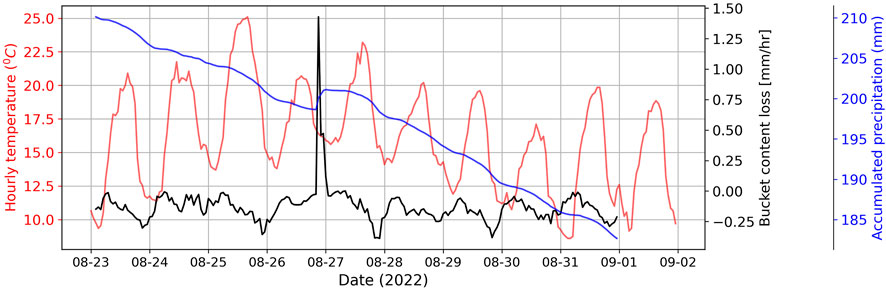
Figure 5. Accumulated precipitation (blue) with temperature (red) and per hour difference in bucket content (black) at Geonor test site.
Various oil options are presented in Table 1. The presented tested oils have different advantages and disadvantages based on their properties and environmental impact. Hydraulic oil has a very low freezing point (−59°C) and a high boiling point, making it suitable for extreme conditions, but it is potentially hazardous and requires careful handling. Sunflower oil is environmentally friendly and affordable but has a higher freezing point (−19°C), which limits its use in colder climates. Johnson & Johnson baby oil is safe and widely available but has a freezing point of −15°C and a relatively low boiling point. Anderol food-grade hydraulic oil is non-hazardous, has a low freezing point (−55°C), and a moderate boiling point, making it suitable for cold conditions.
There isn’t any official documentation about using different oils to prevent evaporation in the precipitation gauges with the OTT Pluvio or Geonor. However, there have been instances where sunflower oil and Johnson’s Baby Oil were used in Himalayan catchments, but these details are not well-documented.
Compared to the conventional oil used by the Norwegian Meteorological Institute, sunflower oil and Johnson’s Baby Oil seem to be less harmful to both the environment and the people handling them. However, their pour point temperature (Table 1) poses a significant concern. This prompts consideration for either limiting the use of antifreeze mixtures with Johnson & Johnson oil to stations with minimum temperatures consistently higher than −15°C or utilizing it exclusively during warmer months (June-September) or especially in regions where temperatures can not drop below −15°C (as depicted in Figure 6).
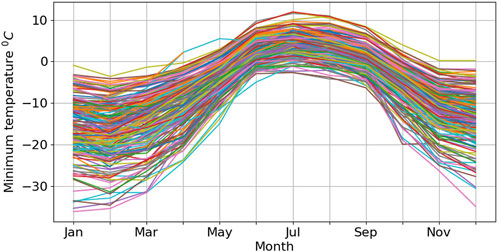
Figure 6. Five years (2018–2023) daily min monthly average temperate at meteorological station with Geonor.
If the main aim is to prevent evaporation loss in regions where temperatures hardly drop below −15°C, these oils could be better options. However, in colder regions like Norway, these oils cannot be used during winter.
When considering oils, it is also crucial to think about their density and viscosity. They should be less dense than water and have low viscosity so that snowflakes can easily penetrate the oil film layer. Otherwise, they might form a layer on top, creating a frozen barrier. While this research did not conduct detailed experiments to measure changes in density and viscosity affecting self-mixing, visual inspections were carried out at the test site after snowfall. No layer formation was observed, suggesting that snowflakes could penetrate the oil layer and promote self-mixing.
During our exploration of different oil options, Anderol Food Grade Lubricants Hydraulics (Anderol, 2024) emerged as a promising synthetic oil. ISO certified and environmentally benign, it meets the required density and pour point specifications. Field testing at the Blindern site (as illustrated in Figures 7, 8) compared results between the reference Geonor (Ref-Geonor) with Test-Geonor with glycometh and methanol and our alternative antifreeze solution with food-grade oil, revealing a good fit between the two measurements.
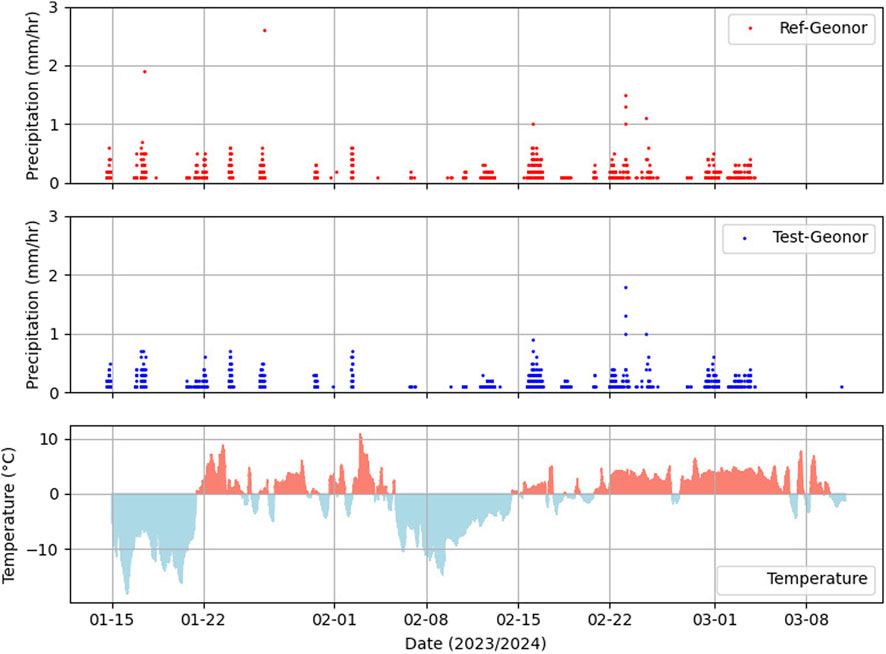
Figure 7. Time series for the precipitation observation from the Reference Geonor sensor with Test Geonor sensor.
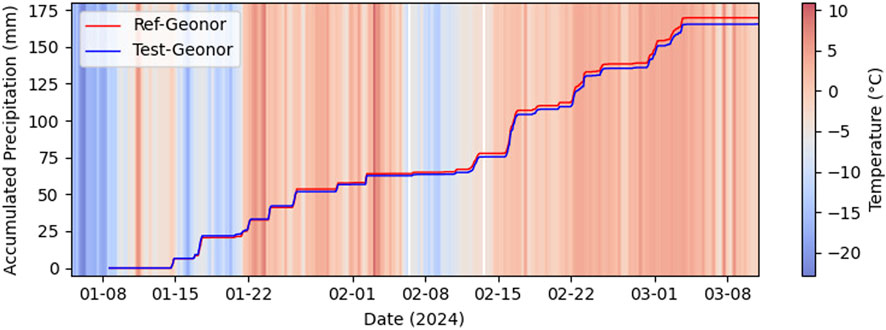
Figure 8. Accumulated precipitation measured from Geonor reference station and Geonor test station at Blindern.
The time series plot depicted in Figure 7 reveals that both sensors (Ref-Geonor and Test-Geonor) recorded precipitation events similarly over time, with the only exception being the omission of two events at the beginning by the Test-Geonor. Despite this initial discrepancy, the overall trend in the precipitation plots is notably similar. The total accumulated precipitation amount from the Reference Geonor sensor is measured at 169.7 mm, whereas the Test Geonor sensor reports a slightly lower accumulated value of 165.4 mm. The mean absolute error between the two sensors is minimal, with a value of 0.009 mm. These findings underscore the overall consistency and close agreement between the two sensors in capturing precipitation events, emphasizing the reliability of the Test-Geonor sensor despite the initial missed events.
Confusion metrics presents (Figure 9) in-depth understanding of observation from the Test-Geonor performance compared to the Reference Geonor under varying conditions. The classification model’s evaluation metrics derived from the confusion matrix (Figure 9) demonstrate robust performance by Test-Geonor during observation periods. With an accuracy of 95.7%, the Test-Geonor sensor adeptly discerns rain and no-rain instances, indicating an overall high correctness in observation. A precision of 79.4% emphasizes the Test-Geonor observation in correctly identifying rain, mitigating the occurrence of false positives. The sensitivity (recall) of 78.5% underscores the Geonor with new antifreeze along with food grade oil effectiveness in capturing a significant portion of actual precipitation instances, crucial for applications where missing precipitation events is undesirable. Remarkably, the specificity of 97.7% shows the Test-Geonor proficiency in accurately identifying instances without precipitation, minimizing false positives. The harmonic mean of precision and recall, the F1-Score, attaining 79.0%, illustrates a balanced performance in both aspects.
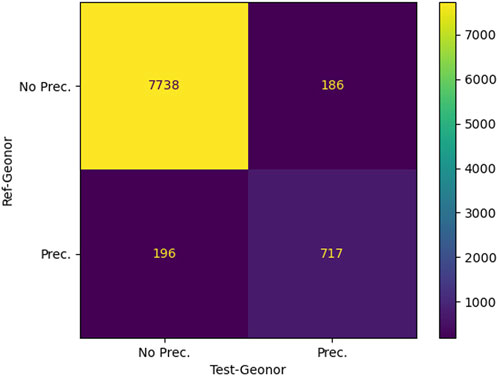
Figure 9. Confusion matrix for evaluating measurement accuracy between two sensors.
While the proposed solutions demonstrate strong performance, their environmental trade-offs, such as energy consumption during production and challenges associated with disposal practices, require further exploration. Addressing these aspects is crucial to ensuring the long-term sustainability of the solutions and minimizing their ecological footprint. Additionally, evaluating the performance of these solutions across varying climatic and environmental conditions could provide deeper insights into their robustness and adaptability.
Further research is required to assess the proposed antifreeze solutions in diverse settings, such as warmer or tropical regions, where unique challenges like increased evaporation or reduced chemical stability might arise. Incorporating recent advancements in antifreeze innovations for precipitation gauges could also help identify more environmentally friendly and efficient measurement practices.
In conclusion, our comprehensive exploration into antifreeze solutions reveals critical insights that extend beyond the laboratory confines to address practical challenges in real-world applications. The 50% propylene glycol (PG) and 50% ethanol blend was found to be the most effective antifreeze mixture. This composition, conformed through careful testing, remains liquid even at extremely low temperature of −40°C. Our findings offer a compelling alternative to the common 40% Glycometh and 60% methanol mixture, suggesting a balanced adjustment in the ratio of propylene glycol to ethylene glycol for better performance.
Moreover, our research accentuates the pivotal role of an oil layer as a pragmatic solution to counteract evaporation, particularly in the presence of ethanol. The observed reduction in accumulated precipitation and evaporation rates, as illustrated in Figure 5, underscores the practical utility of this supplementary layer. Beyond its mitigating effects on evaporation, the oil layer mechanically minimizes the hygroscopic impact of the propylene glycol/water mixture, offering a holistic approach to enhance the effectiveness of antifreeze solutions.
The examination of oil options introduces a nuanced consideration of environmental and operational factors. While conventional hydraulic oil raises concerns about its potential hazards, alternatives such as Johnson & Johnson baby oil and Anderol Food Grade Lubricants Hydraulics emerge as environmentally conscientious choices. The deliberation extends to trade-offs involving density and pour point temperature, as exemplified in Table 1; Figure 6.
The identification of Anderol Food Grade Lubricants Hydraulics as a promising synthetic oil, with ISO certifications and excellent environmental and physical properties, is a key achievement. Field testing at the Blindern site, shown in Figures 6, 7, confirms its effectiveness in real-world conditions, supporting its practical use.
These research outcomes contribute to improving antifreeze formulations by exploring different oil options and their effectiveness. Additionally, these outcomes offer valuable insights into the use of oil layers and the selection of oils that are environmentally sustainable. This helps ensure that the antifreeze solutions are both efficient and responsible in their environmental impact.
The data used in this research can be directly downloaded from the Norwegian Meteorological Institute’s data distribution portal, seklima.met.no. Experimental data generated during this study are available upon request by contacting the lead author.
BB: Conceptualization, Formal Analysis, Investigation, Methodology, Resources, Software, Validation, Visualization, Writing–original draft, Writing–review and editing. AP: Formal Analysis, Methodology, Software, Writing–original draft, Writing–review and editing. KS-S: Project administration, Resources, Supervision, Writing–review and editing.
The author(s) declare that no financial support was received for the research, authorship, and/or publication of this article.
We gratefully acknowledge the Norwegian Meteorological Institute for providing the necessary resources, access to the test site, and laboratory facilities, enabling us to conduct this study. Their support and commitment to facilitating research have been invaluable to the success of this work.
The authors declare that the research was conducted in the absence of any commercial or financial relationships that could be construed as a potential conflict of interest.
The author(s) declare that no Generative AI was used in the creation of this manuscript.
All claims expressed in this article are solely those of the authors and do not necessarily represent those of their affiliated organizations, or those of the publisher, the editors and the reviewers. Any product that may be evaluated in this article, or claim that may be made by its manufacturer, is not guaranteed or endorsed by the publisher.
Anderol (2024). En-USAnderol food grade Lubricants hydraulic. Available at: https://anderol.com/application/hydraulics/ (Accessed April 12, 2024).
Fahmy Amin, M. (2023). Confusion matrix in three-class classification problems: a step-by-step tutorial. J. Eng. Res. 7. doi:10.21608/erjeng.2023.296718
Fan, H., Yu, H., Zhao, Y., Ma, H., Wang, W., and Li, Y. (2024). Deicing performance of cement pavement concrete mixed with chlorine salt antifreeze material. Road Mater. Pavement Des. 25, 637–652. doi:10.1080/14680629.2023.2219752
Heydarian, M., Doyle, T. E., and Samavi, R. (2022). Mlcm: multi-label confusion matrix. IEEE Access 10, 19083–19095. doi:10.1109/access.2022.3151048
Jammalamadaka, D., and Raissi, S. (2010). Ethylene glycol, methanol and isopropyl alcohol intoxication. Am. J. Med. Sci. 339, 276–281. doi:10.1097/MAJ.0b013e3181c94601
Johnson, , and Johnson, (2009). en-USHousehold products database -health and safety information on household products. Available at: https://www.in.gov/fssa/thehub/files/baby-oil-johnsons.pdf.
Johnsson, O. (1937). The distribution of precipitation in Norway. Geogr. Ann. 19, 104–117. doi:10.1080/20014422.1937.11880627
Ketzler, G., Römer, W., and Beylich, A. A. (2021). The climate of Norway. Landscapes and landforms of Norway 7–29.
Kochendorfer, J., Rasmussen, R., Wolff, M., Baker, B., Hall, M. E., Meyers, T., et al. (2017). The quantification and correction of wind-induced precipitation measurement errors. Hydrology Earth Syst. Sci. 21, 1973–1989. doi:10.5194/hess-21-1973-2017
Langlois, A., Kohn, J., Royer, A., Cliche, P., Brucker, L., Picard, G., et al. (2009). Simulation of snow water equivalent (SWE) using thermodynamic snow models in québec, Canada. J. Hydrometeorol. 10, 1447–1463. doi:10.1175/2009JHM1154.1
Lim, T. Y., Poole, R. L., and Pageler, N. M. (2014). Propylene glycol toxicity in children. J. Pediatr. Pharmacol. Ther. 19, 277–282. doi:10.5863/1551-6776-19.4.277
Løkke, H. (1984). enLeaching of ethylene glycol and ethanol in subsoils. Water, Air, Soil Pollut. 22, 373–387. doi:10.1007/BF00282608
Mayo, L. R. (1972). Self-mixing antifreeze solution for precipitation gages. J. Appl. Meteorology 11, 400–404. doi:10.1175/1520-0450(1972)0110400:SMASFP2.0.CO;2
McGurk, B. J. (1992). “Propylene glycol and ethanol as a replacement antifreeze for precipitation gauges: dilution, disposal and safety,” in Western snow conference (Wyoming), 56–65.
OTT HydroMet (2014). Pluvio precipitation gauge—Operating instructions. OTT HydroMet GmbH Doc., 52. Available at: https://www.ott.com/download/operating-instructionsprecipitation-gauge-ott-pluvio2-l.pdf.
Parajuli, A., Nadeau, D. F., Anctil, F., Schilling, O. S., and Jutras, S. (2020). enDoes data availability constrain temperature-index snow models? A case study in a humid boreal forest. Water 12, 2284. doi:10.3390/w12082284
Pierre, A., Jutras, S., Smith, C., Kochendorfer, J., Fortin, V., and Anctil, F. (2019). Evaluation of catch efficiency transfer functions for unshielded and single-alter-shielded solid precipitation measurements. J. Atmos. Ocean. Technol. 36, 865–881. doi:10.1175/JTECH-D-18-0112.1
Rasmussen, R., Baker, B., Kochendorfer, J., Meyers, T., Landolt, S., Fischer, A. P., et al. (2012). How well are we measuring snow: the NOAA/FAA/NCAR winter precipitation test bed. Bull. Am. Meteorological Soc. 93, 811–829. doi:10.1175/BAMS-D-11-00052.1
Sasanami, M., Yamada, T., Obara, T., Nakao, A., and Naito, H. (2020). Oral ethanol treatment for ethylene glycol intoxication. Cureus 12, e12268. doi:10.7759/cureus.12268
Saxena, R. K., Anand, P., Saran, S., Isar, J., and Agarwal, L. (2010). Microbial production and applications of 1,2-propanediol. Indian J. Microbiol. 50, 2–11. doi:10.1007/s12088-010-0017-x
Smith, C. D. (2009). “The relationship between snowfall catch efficiency and wind speed for the Geonor T-200B precipitation gauge utilizing various wind shield configurations,” in Proc. 77th West. Snow Conf. 115–121.
Sodemann, H. (2006). Tropospheric transport of water vapour: Lagrangian and Eulerian perspectives (ETH Zurich).
Thériault, J. M., Leroux, N. R., and Rasmussen, R. M. (2021). Improvement of solid precipitation measurements using a hotplate precipitation gauge. J. Hydrometeorol. 22, 877–885. doi:10.1175/JHM-D-20-0168.1
Tveito, O. E. (2021). Norwegian standard climate normals. Oslo, Norway: Norwegian Meteorological Institute.
Whan, K., Sillmann, J., Schaller, N., and Haarsma, R. (2020). Future changes in atmospheric rivers and extreme precipitation in Norway. Clim. Dyn. 54, 2071–2084. doi:10.1007/s00382-019-05099-z
Wiesinger, T., Takami, S., Ohno, H., and Yokoyama, K. (1993). Development of an automatic, storage precipitation gauge for improved winter precipitation measurements. Ann. Glaciol. 18, 211–214. doi:10.3189/S0260305500011538
World Bank (2024). World Bank Climate Change Knowledge Portal. World BankGroup. Available at: https://climateknowledgeportal.worldbank.org/ (Accessed March 13, 2024).
Zhang, L., Dong, Z., Zhang, Y., Wang, L., and Xu, C. (2022). Effects of CaCl2 on concentration and speciation of soil Cd around a Pb-Zn mine. IOP Conf. Ser. Earth Environ. Sci. 1087, 012057. doi:10.1088/1755-1315/1087/1/012057
Keywords: antifreeze, environmentally friendly alternative, self mixing, propylene glycol, glycometh
Citation: Bhattarai BC, Parajuli A and Stiansen-Snoerud KB (2025) Evaluating the effectiveness of propylene glycol and ethanol as antifreeze: an environmentally friendly alternative. Front. Environ. Eng. 3:1519115. doi: 10.3389/fenve.2024.1519115
Received: 29 October 2024; Accepted: 11 December 2024;
Published: 03 January 2025.
Edited by:
Wendong Tao, SUNY College of Environmental Science and Forestry, United StatesReviewed by:
Beytullah Eren, Sakarya University, TürkiyeCopyright © 2025 Bhattarai, Parajuli and Stiansen-Snoerud. This is an open-access article distributed under the terms of the Creative Commons Attribution License (CC BY). The use, distribution or reproduction in other forums is permitted, provided the original author(s) and the copyright owner(s) are credited and that the original publication in this journal is cited, in accordance with accepted academic practice. No use, distribution or reproduction is permitted which does not comply with these terms.
*Correspondence: Bikas Chandra Bhattarai, YmlrYXNjYkBtZXQubm8=
Disclaimer: All claims expressed in this article are solely those of the authors and do not necessarily represent those of their affiliated organizations, or those of the publisher, the editors and the reviewers. Any product that may be evaluated in this article or claim that may be made by its manufacturer is not guaranteed or endorsed by the publisher.
Research integrity at Frontiers
Learn more about the work of our research integrity team to safeguard the quality of each article we publish.